effect of in‑plane fiber waviness on the failure of fiber
TRANSCRIPT
This document is downloaded from DR‑NTU (https://dr.ntu.edu.sg)Nanyang Technological University, Singapore.
Effect of in‑plane fiber waviness on the failure offiber reinforced polymer composites
Narayanan, Swaroop
2018
Narayanan, S. (2018). Effect of in‑plane fiber waviness on the failure of fiber reinforcedpolymer composites. Doctoral thesis, Nanyang Technological University, Singapore.
http://hdl.handle.net/10356/73702
https://doi.org/10.32657/10356/73702
Downloaded on 04 Apr 2022 03:15:39 SGT

EFFECT OF IN-PLANE FIBER WAVINESS ON THE
FAILURE OF FIBER REINFORCED POLYMER
COMPOSITES
SWAROOP NARAYANAN NAIR
INTERDISCIPLINARY GRADUATE SCHOOL
ENERGY RESEARCH INSTITUTE @ NTU (ERI@N)
2018


EFFECT OF IN-PLANE FIBER WAVINESS ON THE
FAILURE OF FIBER REINFORCED POLYMER
COMPOSITES
SWAROOP NARAYANAN NAIR
Interdisciplinary Graduate School
Energy Research Institute @ NTU (ERI@N)
A thesis submitted to the Nanyang Technological University in
partial fulfilment of the requirement for the degree of
Doctor of Philosophy
2018


Statement of Originality
I hereby certify that the work embodied in this thesis is the result of original
research and has not been submitted for a higher degree to any other University
or Institution.
. . . . . . . . . . . . . . . . . . . . . . . . . . . . . . . . . . . . . . . . . . . .
Date Student Name

Abstract
i
Abstract
As the demand for energy increases day by day, the future relies more on
clean renewable energy resources. Wind turbines have a promising active
contribution to meet this future demand. Wind industries are more interested to
have bigger turbines to produce more power economically from a single turbine
unit. Glass and carbon fiber composite materials are largely used in the light
weight turbine blade manufacturing due to their high strength to weight ratio.
The spar-cap is considered as the back bone of a wind turbine blade and it
consists of significant amount of unidirectional laminates. Manufacturing defects
are unavoidable due to their nature and involvement in the structure. Some of
these defects may affect the life expectancy of the blade as well as the whole
turbine unit. Focus of the present study is related to a common manufacturing
defect found in spar cap regions, ‘fiber waviness’, and its influence towards the
failure initiation and propagation under compression and bending loads.
Despite its wide spread occurrence, in-plane fiber waviness defect found
throughout the thickness of composite laminates is not well studied. Therefore, a
coupon level in-plane fiber waviness defect was induced in unidirectional
composite samples and tested under numerous loading conditions. Variations in
both mechanical strength and failure modes of waviness induced samples were
characterized. In addition, double cantilever beam experiments were conducted
to study the effect of fiber waviness on the fracture energy and crack propagation.
Further, an analytical model has been prepared by adding sinusoidal waviness
into the laminate to estimate the reduction in modulus based on the constitutive
relations. Also, finite element analysis was used to predict the compressive
strength and failure modes under the static compression loads based on a physical
based failure theory (LaRC02) using ABAQUS 6.13TM software.
Finally, a 6-m wind turbine blade shell model was designed using NuMAD
software. Fiber waviness was introduced at various locations of the spar-cap
region and a static flap-wise bending analysis was performed at designed

Abstract
ii
maximum bending moment of the blade. The longitudinal strain deformation
during flap-wise bending analysis at the fiber waviness region of those blade
models was validated with the help of four-point bending test of a composite I -
beam consisting of waviness defect.
Acknowledgements
iii
Acknowledgements
To begin with, I express my deep gratitude to my supervisors, Prof. Yue Chee
Yoon and Asst. Prof. Aravind Dasari, who expertly guided me through 4 years
of my Ph.D. journey. Their continuous support with patience, motivation, and
immense knowledge helped me in all the time of research including the drafting
of this thesis. I would also like to express my deep appreciation to my mentors,
Assoc. Prof. Sunil C Joshi and Dr. Srikanth Narasimalu, for their guidance and
suggestions on my research. Their patience and enthusiasm impress me a lot.
Dr Srikanth Narasimalu is the program director and senior scientist leading
the joint industry program in offshore renewables and has been instrumental in
conceptualizing the present project’s research scope based on the wrinkling
issues in the wind turbine blade manufacturing. He has been part of the thesis
advisory committee for providing his technical suggestions during the
investigation.
Besides, I would like to thank Dr Paul Hibbard, for his valuable suggestions
on my research, especially in the research area of polymer composites. I
gratefully acknowledge the Graduate research scholarship funding received
towards my Ph.D. from the university through Energy Research Institute at NTU
(ERIAN), along with the funding received through the Interdisciplinary Graduate
School (IGS) of NTU as bench-fee for attending conferences. The present
research’s consumables have been supported from ERI@N’s EIRP research grant
S14-1187-NRFEIPO-EIRP-IHL.
My sincere thanks also go to all technicians in Materials Laboratory – I
(MAE), Aerospace Structure Laboratory (MAE), Composite Laboratory (ERIAN)
and Organic Material Service Lab (MSE) who provided equipment assistance.
Without their precious support, it would not be possible to conduct this research.
Also, I would like to express my deeply appreciation to the IGS staff’s Ms. Lily
Lim Seok Kim, Ms. Huang Minying and Ms. Ellen Heng for their help in
Acknowledgements
iv
administrative work. Also, I thank all to my friends especially Ganapati, Mani
and Subramani for their help and support in my research journey at NTU.
Special thanks to my better half Dharma for the elaborate caring, moral
support and encouragement throughout my Ph.D. journey and my life in general.
Last but not least, I would like to thank my parents. They are the motivation to
make myself to be more humble and responsible man.

Table of contents
v
Table of Contents
Abstract ………………………………………………………..….……………i
Acknowledgement……………………………………….………..….…...…. iii
Table of contents……………………………………………..………………...v
Table captions………………………………………………..…….……….... xi
Figure captions……………………..………………………..……………….xiii
Abbreviations………………………………………………….….……….....xix
Publications………………………………………………….……..……….. xxi
Introduction ........................................................................................................ 1
1.1 Background and motivation ............................................................. 1
1.2 Objectives ......................................................................................... 4
1.3 Scope of the thesis ............................................................................ 5
1.4 Dissertation outline ........................................................................... 6
References .................................................................................................... 6
Literature review ............................................................................................... 9
2.1 Wind turbine ..................................................................................... 9
2.2 Material requirements for wind turbine blades .............................. 10
2.3 Fiber Reinforced Polymer (FRP) Composites ................................ 11
2.4 Forces acting on wind turbine blades ............................................. 14
2.5 Manufacturing defects .................................................................... 16
2.5.1 Fiber waviness ................................................................................ 18
2.6 Failure modes in wind turbine blades ............................................. 18
2.7 Failure mechanisms in laminated composites ................................ 20
2.7.1 Fiber failure .................................................................................... 20

Table of contents
vi
2.7.2 Matrix failure .................................................................................. 21
2.7.3 Fiber/matrix debonding .................................................................. 23
2.7.4 Delamination failure ....................................................................... 23
2.8 Failure theories ............................................................................... 25
2.8.1 Generalized failure criterion ........................................................... 25
2.8.2 Physically-based failure criterion ................................................... 27
2.8.2.1 Hashin’s failure criterion ................................................................ 28
2.8.2.2 Puck’s failure criterion ................................................................... 29
2.8.2.3 LaRC02 failure criterion................................................................. 30
2.9 Compressive failure analysis of FRP composites .......................... 31
2.9.1 Effect of matrix properties in the compressive failure mechanism 34
2.9.2 Effect of fiber diameter on compressive failure mechanism .......... 35
Effect of fiber waviness on compressive strength .......................... 36
Flexural failure of unidirectional composite laminate.................... 36
Fatigue failure behavior of unidirectional composite laminate ...... 37
Summary ........................................................................................ 39
References .................................................................................................. 39
Experimental methodology ............................................................................. 47
3.1 Materials ......................................................................................... 47
3.2 Vacuum assisted resin infusion molding (VARIM) ....................... 48
3.3 Fiber waviness ................................................................................ 50
3.4 Fiber volume fraction ..................................................................... 52
3.5 Mechanical testing .......................................................................... 53
3.5.1 Tensile testing ................................................................................. 53
Table of contents
vii
3.5.2 Compression testing ....................................................................... 54
3.5.3 Shear testing ................................................................................... 55
3.5.4 Flexural testing ............................................................................... 56
3.5.5 Double cantilever beam (DCB) experiment ................................... 57
3.5.6 Fatigue flexural analysis ................................................................. 61
3.6 Damage characterization ................................................................ 62
3.6.1 Digital microscope.......................................................................... 62
3.6.2 Scanning Electron Microscope (SEM) ........................................... 62
3.6.3 Laser Shearography ........................................................................ 63
3.6.4 Computed Tomography (CT) ......................................................... 63
3.7 Summary ........................................................................................ 64
References .................................................................................................. 64
Compression and double cantilever beam experiment ................................. 67
4.1 Introduction .................................................................................... 67
4.2 Compression experiment ................................................................ 68
4.2.1 Experimental procedure.................................................................. 68
4.2.2 Results and Discussion ................................................................... 68
4.2.3 Mechanisms of failure .................................................................... 70
4.2 Double Cantilever Beam (DCB) experiment ................................. 72
4.2.1 Factors affecting on DCB test ........................................................ 73
4.2.2 Results and Discussion ................................................................... 75
4.3 Summary ........................................................................................ 83
References .................................................................................................. 83
Table of contents
viii
An analytical model and a numerical model: Effect of fiber waviness ....... 87
5.1 Introduction .......................................................................................... 87
5.2 An Analytical model with in-plane waviness ...................................... 87
Geometry of an In-plane waviness ................................................... 87
5.2.2 Analytical model results ................................................................... 90
5.3 Abaqus Model ...................................................................................... 91
5.3.1 Mesh Modelling ................................................................................ 94
5.3.2 Boundary conditions ......................................................................... 96
5.3.3 Damage initiation and progression ................................................... 96
5.3.4 Simulation results .............................................................................. 97
5.4 Comparison of analytical and simulation results with experiment ...... 98
5.4 Summary ...................................................................................... 103
References ................................................................................................ 104
Static and fatigue flexural testing of laminate with waviness defect ......... 107
6.1 Introduction ........................................................................................ 107
6.2 Static flexural test .............................................................................. 107
6.2.1 Specimen geometry and testing ...................................................... 108
6.2.2 Results and discussion .................................................................... 109
6.3 Flexural fatigue test ............................................................................ 113
6.3.1 Specimen geometry and testing ...................................................... 115
6.3.2 Results and Discussion ................................................................... 117
6.4 Summary ...................................................................................... 123
References ................................................................................................ 123

Table of contents
ix
Analysis of a wind turbine blade with a fiber waviness defect on spar-cap ...
125
7.1 Introduction ........................................................................................ 125
7.2 Design procedure ............................................................................... 125
7.2.1 Structural design ............................................................................. 126
7.2.2 Airfoil .............................................................................................. 128
7.3 NuMAD ............................................................................................. 128
7.4 Static analysis ..................................................................................... 130
7.4.1 Influence of waviness at spar-cap region ........................................ 133
7.5 Composite I-beam .............................................................................. 137
7.5.1 Result and discussion ...................................................................... 138
7.6 Summary ............................................................................................ 141
References ................................................................................................ 142
Conclusions and future work ........................................................................ 143
8.1 Conclusions ........................................................................................ 143
8.2 Contributions ................................................................................ 148
8.3 Scope for future work ........................................................................ 148
Appendix A ..................................................................................................... 151

Table of contents
x

Table captions
xi
Table captions
Table 2.1: Various failure modes ....................................................................... 20
Table 3.1: Material properties ............................................................................ 47
Table 3.2: Glass/epoxy DCB specimen ............................................................. 59
Table 4.1: Compression test results of composites with and without waviness
defect. ................................................................................................................. 70
Table 4.2: Initial specimen arm properties of the DCB specimen ..................... 74
Table 4.3: Average values of load, displacement and the delamination initiation
toughness. ........................................................................................................... 77
Table 5.1: Constituent elastic properties used in the Abaqus model (based on
material data sheet). ........................................................................................... 93
Table 5.2: Lamina strength properties used in the Abaqus model (Experimentally
determined). ....................................................................................................... 93
Table 5.3: Comparison of lamina material properties from experiment and model
............................................................................................................................ 94
Table 6.1: Fatigue test results of specimen ...................................................... 118
Table 7.1: Calculated bending moments .......................................................... 127
Table 7.2: Blade airfoil parameters along the blade span. ............................... 129
Table 7.3: Properties of material used for the blade design. ............................ 130
Table 7.4: Stacking sequence at various blade region. .................................... 131
Table 7.5: Waviness location ........................................................................... 133

Table captions
xii
Figure captions
xiii
Figure captions
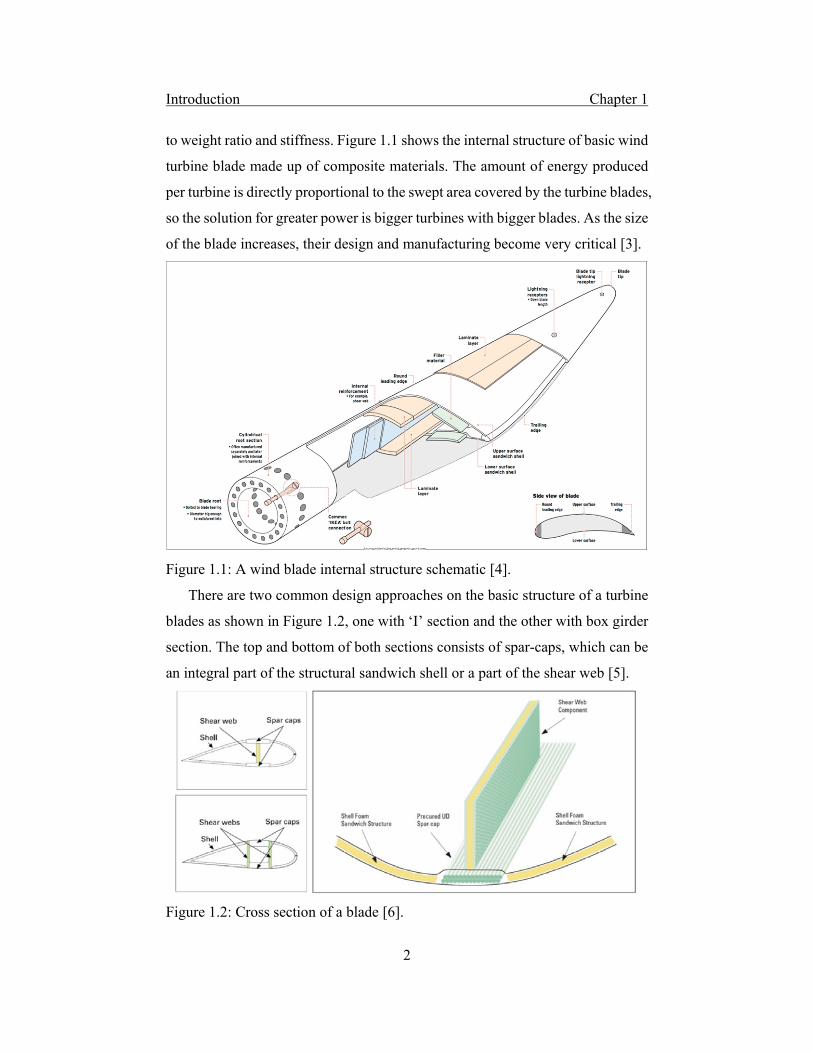
Figure 1.1: A wind blade internal structure schematic [4]. .................................. 2
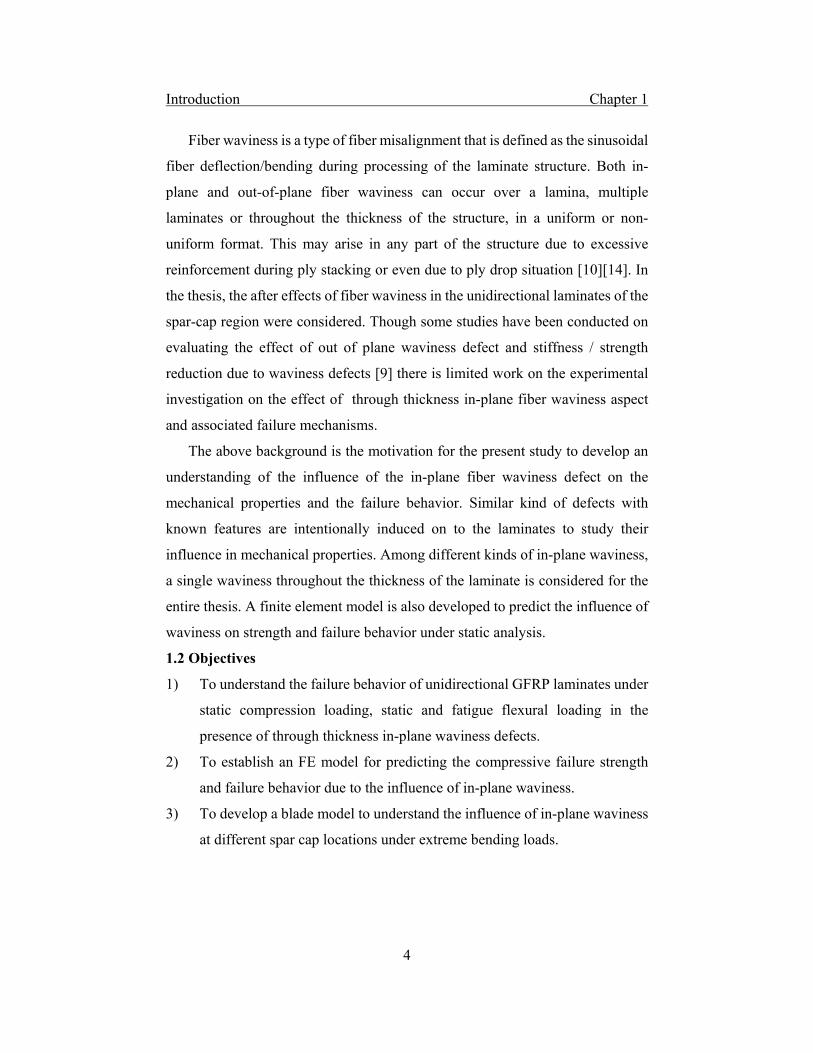
Figure 1.2: Cross section of a blade [6]. .............................................................. 2
Figure 1.3: Fiber waviness found in the composite structures [9], (a) In-plane
waviness over the surface, (b) Out of plane waviness throughout the thickness. 3
Figure 2.1: Relation between Youngs modulus (E) and density (ρ) [1]. ........... 10
Figure 2.2: Basic blade cross section [2] ........................................................... 11
Figure 2.3: Lift and drag in an airfoil. ............................................................... 14
Figure 2.4: Plot of power output and power coefficient versus wind speed (m/s).
[Credit: Enercon E141 – Datasheet]. ................................................................. 15
Figure 2.5:A full scale testing of a blade subjected to static load in the flap-wise
direction. [Credit: LM Glassfiber A/S] .............................................................. 15
Figure 2.6: In-plane waviness on the surface, out of plane waviness and
porosity/voids [17]. ............................................................................................ 17
Figure 2.7: Shape of an in-plane waviness with wave length ‘L’ and amplitude
‘A’. ..................................................................................................................... 18
Figure 2.8: Sketches of different failure modes in a wind turbine blade [20]. .. 19
Figure 2.9: Broken specimen and fibers from a tensile experiment [21]. .......... 20
Figure 2.10: Fiber breakage after kink band and crushing. ............................... 21
Figure 2.11: Crack propagation in the matrix [22] ............................................ 22
Figure 2.12: a) Cusps formation during shear failure, b) Cusps in peel fracture, c)
Peel fractured surface[22]. ................................................................................. 22
Figure 2.13: Fractured surface of glass fiber/vinyl ester composites due to
extensive interfacial debonding[24]. .................................................................. 23
Figure 2.14: Different types of surface delamination[26] ................................. 24
Figure 2.15: Opening mode, shear mode and tear mode ................................... 25
Figure 2.16: Condition for failure for the applied stresses 1 and 2 [32]. ...... 26
Figure 2.17: Kink–band with matrix yielding and no fiber failure (unloaded) [64]
............................................................................................................................ 35
Figure captions
xiv
Figure 2.18:Post failure analysis of laminate with moderate waviness and severe
waviness [12]. .................................................................................................... 36
Figure 3.1: Schematic of resin infusion [1] ....................................................... 48
Figure 3.2: The resin inlet is given at the middle and two outlets to the vacuum
pump are provided at both right and left ends. .................................................. 49
Figure 3.3: Fabrication of an in-plane fiber waviness ....................................... 51
Figure 3.4: a) Fiber waviness over a lamina before curing b) fiber waviness a
laminate after curing .......................................................................................... 52
Figure 3.5: Bare fiber after the resin burn out ................................................... 52
Figure 3.6: Tensile testing, (a) With clip-on extensometer, (b) Strain gage with
two element rosettes. .......................................................................................... 53
Figure 3.7: a) Schematic of a typical compression test specimen, and b) the actual
HCCF set up with sample. ................................................................................. 55
Figure 3.8: a) Shear test fixture b) V-notched specimen with waviness, c) Fixture
with specimen during loading. ........................................................................... 56
Figure 3.9: Three-point bending fixture with specimen .................................... 57
Figure 3.10: Specimen geometry, the bottom pictures show the inside waviness
portion after the crack initiation front (Shown with red line). ........................... 58
Figure 3.11: Double Cantilever Beam experiment setup and crack propagation
............................................................................................................................ 60
Figure 3.12: Double cantilever beam specimen. ................................................ 60
Figure 3.13: The sinusoidal load wave form representation for a unit maximum
load with respect to time .................................................................................... 62
Figure 4.1: Drop in compressive strength with wave severity ........................... 69
Figure 4.2: Stress-Strain curve of sample A0 and A3. ...................................... 69
Figure 4.3: Catastrophic failure of waviness-free specimen under compressive
loading conditions. ............................................................................................. 70
Figure 4.4: Sequence of crack propagation before complete failure in sample A1.
............................................................................................................................ 71

Figure captions
xv
Figure 4.5: (a) Fiber kinking and fiber splitting along the wavy fiber direction in
sample A3, b) Magnified fiber kinking view, (c) Kink band view at the free edge
of the width, d) Fiber breakage. ......................................................................... 72
Figure 4.6: Load vs displacement plots for U6 and W6 .................................... 76
Figure 4.7: Load vs displacement plots for U8 and W8 .................................... 77
Figure 4.8: Fracture toughness calculated (R – curve) based on MBT, CC and
MCC for U6 and W6 specimens. ....................................................................... 78
Figure 4.9: Fracture toughness calculated (R – curve) based on MBT, CC and
MCC for U8 and W8 specimens. ....................................................................... 78
Figure 4.10: R – curves of U6 and W6 DCB specimens ................................... 79
Figure 4.11: R – curves of U8 and W8 DCB specimens ................................... 79
Figure 4.12: Shape of delamination front at different stages of W8 specimen. a)
Crack initiation point, b) Initial shape, c) Shape before reaching the peak of fiber
waviness, d) Shape after the wave crest, e) Regaining the initial shape ............ 81
Figure 4.13: a) Fiber bridging (W8 specimen). Shape of crack front: - b) before
the waviness peak region, c) After the waviness peak area. .............................. 82
Figure 4.14: Crack opening rate along the delamination path of U6 and W6 DCB
specimens ........................................................................................................... 82
Figure 4.15: Crack opening rate along the delamination path of U8 and W8 DCB
specimens ........................................................................................................... 83
Figure 5.1: A representative volume of an in-plane waviness in an x-y plane .. 88
Figure 5.2: Normalized Young’s modulus with respect to wave severity ......... 90
Figure 5.3: Normalized shear modulus with respect to wave severity. ............. 91
Figure 5.4: (a) Abaqus specimen model, (b) Zoomed vies at gage portion, (c)
Mesh flow in the gauge area along the waviness path, (d) Element orientation at
the waviness region. ........................................................................................... 95
Figure 5.5: Mesh refinement for both unidirectional and wave induced model
(Wave severity = 0.075). .................................................................................... 95
Figure 5.6: Boundary conditions at both ends of the model. ............................. 96
Figure captions
xvi
Figure 5.7: Damage over the gage area in unidirectional laminate with respect to
SDV. ................................................................................................................... 97
Figure 5.8: Damage over the gage area in wavy laminate with respect to SDV.
............................................................................................................................ 98
Figure 5.9: Stress vs Strain behavior of models and experiment ....................... 99
Figure 5.10: Shear response of both unidirectional and wavy laminate. ......... 100
Figure 5.11: Normalized Young’s modulus vs wave severity. ........................ 101
Figure 5.12: Comparison of compressive strength obtained with Argon model
and Budiansky model mentioned in literature. ................................................ 102
Figure 5.13: Comparison of failure strength with different wave severity ...... 102
Figure 5.14: (a) Experimentally failed specimens and (b) Model prediction of
both defect free and waviness defect containing samples. .............................. 103
Figure 6.1: An illustration of the three-point bending fixture with specimen. 109
Figure 6.2: Stress – Strain behavior under bending ......................................... 110
Figure 6.3: Comparison of unidirectional and wavy specimens, a) Flexural
strength, b) Flexural modulus .......................................................................... 110
Figure 6.4: Failure over the tension side and compression side of the
unidirectional specimen. .................................................................................. 111
Figure 6.5: Final failure over wavy specimen. a) Outer surface failed due to
tensile stresses, b) Inner surface failed due to compression stresses, c) Damage at
the specimen thickness region, d) Fiber kink band with corresponding orientation
angle 18.5º. ....................................................................................................... 112
Figure 6.6: Representation of stress amplitude for a unit maximum load with
respect to time. ................................................................................................. 115
Figure 6.7: Three-point bending fixture and specimen mounted on fixture
(insight). ........................................................................................................... 116
Figure 6.8: Comparison of S-N plots for unidirectional and wavy specimen at
stress ratio R = 0.5 ........................................................................................... 118
Figure 6.9: Comparison of S-N plots for unidirectional and wavy specimen at
stress ratio R = 0.1 ........................................................................................... 119

Figure captions
xvii
Figure 6.10: Comparison of S-N plots for wavy specimens at stress ratio R = 0.1
and 0.5. ............................................................................................................. 119
Figure 6.11: The visible damage on failed specimens over the outer (in tension)
and inner (in compression) surface at various loads. ....................................... 120
Figure 6.12: Comparison between unidirectional and wavy specimen ........... 121
Figure 6.13: Laser shearography over the damaged area. ............................... 121
Figure 6.14: 3D tomographic scan of unidirectional specimen. ...................... 122
Figure 6.15: 3D tomographic scan of wavy specimen. .................................... 122
Figure 7.1: Bending moment distribution along the blade span. ..................... 128
Figure 7.2: Generated blade skeleton in NuMAD ........................................... 130
Figure 7.3: Boundary conditions for the blade loaded in flap-wise direction. 132
Figure 7.4: Stress plot of the blade at maximum deflection. ........................... 132
Figure 7.5: Blade spar-cap with fiber waviness a) Waviness at the middle region,
b) Waviness at the transition region. ................................................................ 134
Figure 7.6: Effect of waviness at transition and middle region over the tip
deflection. ......................................................................................................... 134
Figure 7.7: Blade tip deflection because of waviness at the pressure side. ..... 135
Figure 7.8: Location of strain measurement from element node at region 1 and 2.
.......................................................................................................................... 135
Figure 7.9: The strain across the cross section at the waviness effected area of the
blade model, a) waviness at the spar-cap on blade top (suction side), b) Waviness
at the spar-cap on blade bottom (Pressure side). .............................................. 136
Figure 7.10: A composite I-beam with waviness at the top and bottom flange.
.......................................................................................................................... 137
Figure 7.11: (a) Experiment set up with waviness at the bottom of the beam, (b)
bonded strain gages. ......................................................................................... 138
Figure 7.12: Measured longitudinal strain with applied load. ......................... 139
Figure 7.13: Strain along the cross section of the I-beam. ............................... 140
Figure 7.14: Comparison of strains obtained from the wavy middle region of the
FE blade model and the I-beam experiment. ................................................... 141

Figure captions
xviii

Abbreviations
xix
Abbreviations
FRP Fiber Reinforced Polymer
GFRP Glass Fiber Reinforced Polymer
U Unidirectional
FE Finite element
FEM Finite element method
P Power
Air density
A Swept area
V Wind velocity
α Aerodynamic efficiency coefficient
E Young’s Modulus
υ12 Poisson’s ratio
HAWT Horizontal Axis Wind Turbine
VARIM Vacuum Assisted Resin Infusion Molding
ASTM American Standard for Testing of Materials
HCCF Hydraulic Composite Compression Fixture
DCB Double Cantilever Beam
MBT Modified Beam Theory
CC Compliance Calibration
MCC Modified Compliance Calibration
SEM Scanning Electron Microscope
CT Computed Tomography
NREL National Renewable Energy Laboratory
NuMAD Numerical Manufacturing and Design

Abbreviations
xx

Publications
xxi
Publications
1) Swaroop Narayanan Nair, Aravind Dasari, Chee Yoon Yue, and Srikanth
Narasimalu. "Failure Behavior of Unidirectional Composites under
Compression Loading: Effect of Fiber Waviness." Materials 10, no. 8
(2017): 909.
2) Swaroop Narayanan Nair, Aravind Dasari, Chee Yoon Yue, and Srikanth
Narasimalu. “Effect of fiber waviness on the delamination onset and Mode
- I fracture energy of polymer composites” (Drafted).

Publications
xxii

Introduction Chapter 1
1
Introduction
In this chapter, the background of the research work presented in
this thesis along with the scope and objectives are discussed. Finally,
a detailed layout of the dissertation is presented.
1.1 Background and motivation
The contribution of renewable energy is highly remarkable to mitigate the
future global energy crisis. It also helps to reduce the dependency on fossil fuel.
Wind energy is one of the cleanest and environmental friendly renewable forms
of energy. It is expected that up to 20% of global renewable energy will be
derived from wind energy by 2020 [1]. In a survey conducted by the global wind
energy council, the total installed wind energy production reached 282.4GW by
the end of 2012 [2]. Among the wind energy producing countries, China is
leading with a cumulative capacity of 75,564MW and a production percentage
share of 26.8%.
As the future is dependent on environmental friendly renewable energy,
improving the reliability of wind turbine blades is critical. Adoption of polymer
matrix composites technology in wind turbine industry enabled the
manufacturers to produce bigger rotor blades with higher strength to weight ratio.
When the size of the turbine increases, it is equally important to have an extended
life span of the blades to balance the cost of manufacturing.
The turbine rotor blade is one of the key components in a wind turbine, which
converts the wind energy into kinetic energy to produce power. Blades are critical
components in the design and manufacturing of wind turbine system as they are
designed to withstand environmental conditions. Composite materials are
commonly used for manufacturing wind turbine blades due to their high strength
Introduction Chapter 1
2
to weight ratio and stiffness. Figure 1.1 shows the internal structure of basic wind
turbine blade made up of composite materials. The amount of energy produced
per turbine is directly proportional to the swept area covered by the turbine blades,
so the solution for greater power is bigger turbines with bigger blades. As the size
of the blade increases, their design and manufacturing become very critical [3].
Figure 1.1: A wind blade internal structure schematic [4].
There are two common design approaches on the basic structure of a turbine
blades as shown in Figure 1.2, one with ‘I’ section and the other with box girder
section. The top and bottom of both sections consists of spar-caps, which can be
an integral part of the structural sandwich shell or a part of the shear web [5].
Figure 1.2: Cross section of a blade [6].

Introduction Chapter 1
3
Blades are generally made up of large tow fiber fabrics to build up the
thickness rapidly. Several layers of fiber impregnated with adhesive resins are
present in the structure. These composite layers are generally very stiff and strong
along the fiber direction, but weak across the plane perpendicular to the fiber axis.
The in-plane properties are mainly determined by the fibers, and out of plane
properties are by the matrix. Composite properties have dependents on the lay-
up sequence, fiber volume and the technique used for manufacturing. Blade
stresses are predominant in the longitudinal direction due to flap-wise and edge-
wise bending loads. Spar-caps are designed to act as reinforcement and they
generally consist of thick unidirectional laminate whereas internal shear web is
designed to carry shear loads, so they are usually sandwich structures with +/−
45° biaxial laminates. Balsa wood or polymer foams are generally used as
sandwich cores and they are the body skin of blades [5].
According to historical wind farm data [7], 10% of the wind turbine down
time has been due to blades and rotor failure. Additionally, with the current trend
in wind turbine design (∼7-8 MW capacity and ∼70-80 m blade length made of
polymer composites), better characterization and understanding of the design and
manufacturing flaws in blades is essential. Postmortem analysis of failed blades
has indicated manufacturing flaws like porosity, improper wetting of fibers with
matrix, fiber waviness etc.[8]. Many mechanical (particularly compressive
strength, a major design driver in this application) and physical properties of the
blades are affected by these defects, which have had a deep economic impact [7].
Figure 1.3: Fiber waviness found in the composite structures [9], (a) In-plane waviness over the surface, (b) Out of plane waviness throughout the thickness.
Introduction Chapter 1
4
Fiber waviness is a type of fiber misalignment that is defined as the sinusoidal
fiber deflection/bending during processing of the laminate structure. Both in-
plane and out-of-plane fiber waviness can occur over a lamina, multiple
laminates or throughout the thickness of the structure, in a uniform or non-
uniform format. This may arise in any part of the structure due to excessive
reinforcement during ply stacking or even due to ply drop situation [10][14]. In
the thesis, the after effects of fiber waviness in the unidirectional laminates of the
spar-cap region were considered. Though some studies have been conducted on
evaluating the effect of out of plane waviness defect and stiffness / strength
reduction due to waviness defects [9] there is limited work on the experimental
investigation on the effect of through thickness in-plane fiber waviness aspect
and associated failure mechanisms.
The above background is the motivation for the present study to develop an
understanding of the influence of the in-plane fiber waviness defect on the
mechanical properties and the failure behavior. Similar kind of defects with
known features are intentionally induced on to the laminates to study their
influence in mechanical properties. Among different kinds of in-plane waviness,
a single waviness throughout the thickness of the laminate is considered for the
entire thesis. A finite element model is also developed to predict the influence of
waviness on strength and failure behavior under static analysis.
1.2 Objectives
1) To understand the failure behavior of unidirectional GFRP laminates under
static compression loading, static and fatigue flexural loading in the
presence of through thickness in-plane waviness defects.
2) To establish an FE model for predicting the compressive failure strength
and failure behavior due to the influence of in-plane waviness.
3) To develop a blade model to understand the influence of in-plane waviness
at different spar cap locations under extreme bending loads.

Introduction Chapter 1
5
4) To validate the waviness effect on the strain deformation at the suction side
and pressure side of a turbine blade (that is supported with the help of
composite I-beam) under bending loads.
1.3 Scope of the thesis
The literature is reviewed to understand the basic design of composite wind
turbine blades and the effects of several common manufacturing defects on
mechanical properties. Various types of failures found in the composite laminates
under static and fatigue bending and compression loading are studied.
An in-plane waviness defect with different severity levels are intentionally
induced in the unidirectional laminate while manufacturing to study the effect of
waviness defect. Static bending and compression tests are conducted on the
waviness induced specimens and the results are compared with those from defect-
free samples. The failures are thoroughly examined and various failure modes
are identified.
Both analytical and numerical models have been developed to study the
through thickness in-plane fiber waviness under compression conditions at
various fiber severity level. The numerical model (commercial FE package
AbaqusTM) is developed based on the constituent based failure theory under the
influence of in-plane waviness defect. The results obtained from the FE model
and the analytical model are compared and validated with the experimental
findings.
To study the influence of flap-wise wind loads acting on the blades with
waviness, all the specimens with in-plane fiber waviness are tested under fatigue
flexural loads. As most of the wind load acts in the unidirectional flap-wise way,
the specimens are tested in bending with stress ratios (R) 0.1 and 0.5. After the
test, the effects of in-plane fiber waviness defect on specimen cycle lives are
analyzed and failure modes are thoroughly examined.
A 6 m blade shell model to study the influence of fiber waviness on blade tip
deflection and longitudinal strain at different spar-cap locations under extreme
bending loads. Experimental validation on the influence of waviness defect on
Introduction Chapter 1
6
suction side and pressure side is achieved through a four-point bending analysis
on a composite I – beam with waviness on the top flange and the bottom flange
separately.
1.4 Dissertation outline
The outline of the remainder of the thesis is:
A literature review on the manufacturing defects in turbine blades and the
different types of failures that exist in composite laminates is outlined in Chapter
2. In Chapter 3, a method to intentionally induce in-plane waviness into a
composite laminate is discussed. The influence of waviness on the mechanical
properties based on experimental studies on specimens with and without
waviness defects is explained in detail. In Chapter 4, static compression analysis
of defect-prone unidirectional specimens is outlined and discussed. The failure
modes in the specimens are also studied along with the influence of waviness on
the fracture energy of delamination. Next, in Chapter 5, an analytical model that
has been developed to explain the experimental results is outlined. An FE model
to predict failure in waviness-induced specimens under compression loading has
also been built. Flexural static and fatigue analysis on the waviness induced
specimen is considered and discussed in Chapter 6. Chapter 7 details a 6 m
turbine blade model that was developed to investigate the effect of waviness at
different spar-cap locations and its influence under extreme flap-wise bending
loads. Finally, the conclusions and scope for future research are outlined in
Chapter 8.
References
[1]. S. Lindenberg, 20% Wind Energy By 2030: Increasing Wind Energy's
Contribution to US Electricity Supply. 2009: Diane Publishing.
[2]. D. V. Rosato Economic and social forces drive wind energy trends Wind
Energy Trends for Composites, 2014.
[3]. P. Brøndsted, H. Lilholt, and A. Lystrup, Composite Materials for Wind
Power Turbine Blades. Annual Review of Materials Research, 2005.
35(1): p. 505-538.

Introduction Chapter 1
7
[4]. A diagram from a Gurit presentation on “Materials Technology for the
Wind Energy Market”. Source: Gurit.
[5]. T. Burton, et al., Wind energy handbook. 2011: John Wiley & Sons.
[6]. WE Handbook- 5 - Gurit Composite Materials for Wind Turbine Blades.
[7]. J. Ribrant and L. M. Bertling, Survey of Failures in Wind Power Systems
With Focus on Swedish Wind Power Plants During 1997–2005.
IEEE Transactions on Energy Conversion, 2007. 22(1): p. 167-173.
[8]. T. Riddle, D. Cairns, and J. Nelson. Characterization of manufacturing
defects common to composite wind turbine blades: Flaw
characterization. in 52nd AIAA/ASME/ASCE/AHS/ASC Structures,
Structural Dynamics and Materials Conference 19th AIAA/ASME/AHS
Adaptive Structures Conference 13t. 2011: p.1758.
[9]. J. W. Nelson, D. S. Cairns, and T. W. Riddle. Manufacturing Defects
Common to Composite Wind Turbine Blades: Effects of Defects. in
Proceedings AIAA Aerospace Science Meeting, Wind Energy Symposium,
Orlando, FL. 2011: p. 1756.
[10]. D. Griffin and M. Malkin, Lessons Learned from Recent Blade Failures:
Primary Causes and Risk-Reducing Technologies. 2011: p. 259.

Introduction Chapter 1
8
Literature review Chapter 2
9
Literature review
In this chapter, basics of wind turbine blades, typical blade design,
types of loads acting on the blade and different manufacturing defects
and their effects on various mechanical properties along with failure
modes of wind turbine blades are discussed. Special focus is on the
fiber waviness defect and the previous research on the effect of
waviness on the mechanical properties and failure modes under
extreme compression and bending load conditions. Also, various
research studies on coupon level fatigue flexural failure of
unidirectional composite laminates are discussed to understand the
different failure modes presented.
2.1 Wind turbine
The primary component of the wind turbine is the energy converter which
converts the kinetic energy of the wind to mechanical energy, and subsequently
to electrical energy. The amount of power produced depends on various factors
like the density of air (ρ), swept area of rotor blade (A), the wind velocity (v) and
is given by,
(2.1)
α is the aerodynamic efficiency coefficient.
In general, rotor is mounted over a tower and a blade with aerodynamic in
shape to capture the wind and to rotate the rotor by facing in the wind direction.
Nearly all wind turbines have a rotor mounted in a vertical plane with three blades
rotating in a horizontal axis (called Horizontal axis wind turbine, HAWT).

Literature review Chapter 2
10
2.2 Material requirements for wind turbine blades
The general property requirements for a wind blade material include high
stiffness, light-weight and long-fatigue life. Undoubtedly the advantages of the
fibrous composite materials are their high specific stiffness and high specific
strength as compared to the traditional engineering materials. Figure 2.1 shows
the Young’s modulus and density of various engineering materials.
Figure 2.1: Relation between Youngs modulus (E) and density (ρ) [1].
The basic design aspects of the blade are material selection and aerodynamic
shape. Figure 2.2 shows the basic aerodynamic shape of the cross section of a
rotor blade. The aerodynamic outer contour shape is called shell made up of thin
layer of composites. The contour is supported by a longitudinal beam, with a
cross section of box or I-section. The longitudinal beam consists of a thick
composite layer of spar-caps (on top and bottom) and a sandwiched vertical
structure of shear web. The weight and thickness of the rotor blade gradually
decreases from root to tip to optimize the load distribution along the cantilever
structure.

Literature review Chapter 2
11
Figure 2.2: Basic blade cross section [2]
Based on the turbine working environment conditions and operational
parameters the lead requirements for a blade material is their density, stiffness
and fatigue life. High stiffness is needed for an optimal aerodynamic performance,
low density materials are preferred for a reduced gravitational force and a
material with minimum property degradation for a better fatigue life. From the
listed requirements, fiber reinforced composite material is a leading choice [3].
Material performance is measured by conducting coupon level static and fatigue
tests to ascertain the material qualification and the design demand calculated
from the aero-elastic model based on wind loads.
2.3 Fiber Reinforced Polymer (FRP) Composites
Blades are generally made up of large tow fiber fabrics to build up the
thickness rapidly. Several layers of fiber impregnated with adhesive resins are
present in the structure. These composite layers are generally very stiff and strong
along the fiber direction, but weak across the plane perpendicular to the fiber axis.
The in-plane properties are mainly determined by the fibers, and out of plane
properties are by the matrix. Composite properties have dependents on the lay-
up sequence, fiber volume and the technique used for manufacturing. Blade
stresses are predominant in the longitudinal direction due to flap-wise and edge-
wise bending loads. Spar-caps are designed to act as reinforcement and they
generally consist of thick unidirectional laminate whereas internal webs are
designed to carry shear loads, so they are usually sandwich structures with +/−

Literature review Chapter 2
12
45° biaxial laminates. Balsa wood or polymer foams are generally used as
sandwich cores and they are the body skin of blades [4].
FRP Composites are layered structures made up of several layers of fiber
fabric called lamina. A lamina may consist of long fibers, short fibers, braided or
woven fibers stacked together and bonded with the help of a polymer matrix
material to form a laminate. The bonding between the fiber and matrix helps to
form a load bearing structural element. The fiber consists of many filaments in
the diameter range 5 to 20 μm. Generally used fiber materials are glass, carbon,
Kevlar®, aramid and so on. Polymer matrices are divided into thermoset and
thermoplastic, e.g. polyesters, epoxies, polyamides and bismaleimides. While
curing, the thermoset polymers were crosslinked to create a three-dimensional
network which is irreversible. Due to their three-dimensional crosslinking ability,
thermosets have high temperature resistance and dimensional stability. On the
other hand, thermoplastics are reversible so that they will return to the viscous
liquid form once they are heated to their melting temperature. Currently,
thermoplastics are employed for the low temperature and impact resistance
applications. However, nowadays high-performance thermoplastic/fibrous
composites are getting more attention from industries. Glass and carbon fibers
were widely used for the fabrication of blades.
Glass fibers have high strength, moderate density and moderate stiffness
properties (69 to 80 GPa) [5, 6]. They are composed of SiO2, Al2O3 with smaller
amount of other oxides such as CaO, MgO, ZnO, TiO2 etc. Glass fibers have
amorphous (non-crystalline) structure and considered as isotropic in nature. They
are generally in between 10 to 20 μm in diameter. The fiber surfaces were
normally coated (sizing) with silane compounds to protect from cracking while
drawing. Also, fiber sizing improves the bonding properties of glass fibers with
matrix material.
Carbon fibers are composed of pure carbon in a crystallographic lattice form
with a hexagonal shape (Graphite). Within the hexagon plane, atoms are bonded
together with strong covalent bond and in between the hexagonal plane, they are

Literature review Chapter 2
13
bonded weakly. Hence, carbon fibers show greater degree of anisotropy in their
mechanical and thermal properties. Carbon fibers have excellent stiffness (200 to
250 GPa) and strength properties as compared to glass. However, they are very
expensive as compared to glass fibers. Nowadays, both fibers are commonly used
for the fabrication of moderate size blades (5 to 20 m length).
Wind industries commonly uses thermoset polymers as matrix material due
to their matching densities with fiber material (1.1 – 1.3 g/cm3) and higher
strength, thermal resistance properties as compared to thermoplastics. The
properties of the composite depend on the combined properties of fibers and
matrix. Most importantly, the mixing ratio and the established interface between
the fiber and matrix materials. On a general note the effective stiffness ( ) of a
composite with no porosity ( 1 can be calculated as,
(2.2)
Vf, Ef and, Vm, Em represents the volume fraction and effective stiffness’s of
fiber and matrix respectively.
The common techniques followed by blade industries are resin infusion
technology and prepreg technology. In resin infusion technique, dry fibers were
placed in the blade mold and sealed tightly. The liquid resin was injected into the
package and allowed to flow through the whole fiber package. However, it is
important to make sure that the resin wets all the fibers completely. In prepreg
technology, a semi raw product of fiber fabrics was pre-impregnated with resin.
At room temperature, the prepreg material would be in a tacky solid and this
tacky prepregs were stacked together to form the required structure. For curing,
these stacked layers were consolidated under the vacuum bag and a curing step
cycle was followed at required pressure and temperature range as per the
manufacturers requirement.
Most of the turbine blades are prepared as two segments in separate molds
and bonded together with the help of adhesives like epoxy and polyurethane. The
adhesive must have the capability to hold a large area of airfoil shell and
longitudinal supporting beam under extreme cyclic loads. The shell and the shear
Literature review Chapter 2
14
webs are made up of sandwich structures using low density core materials such
as balsa wood and polymer foams.
2.4 Forces acting on wind turbine blades
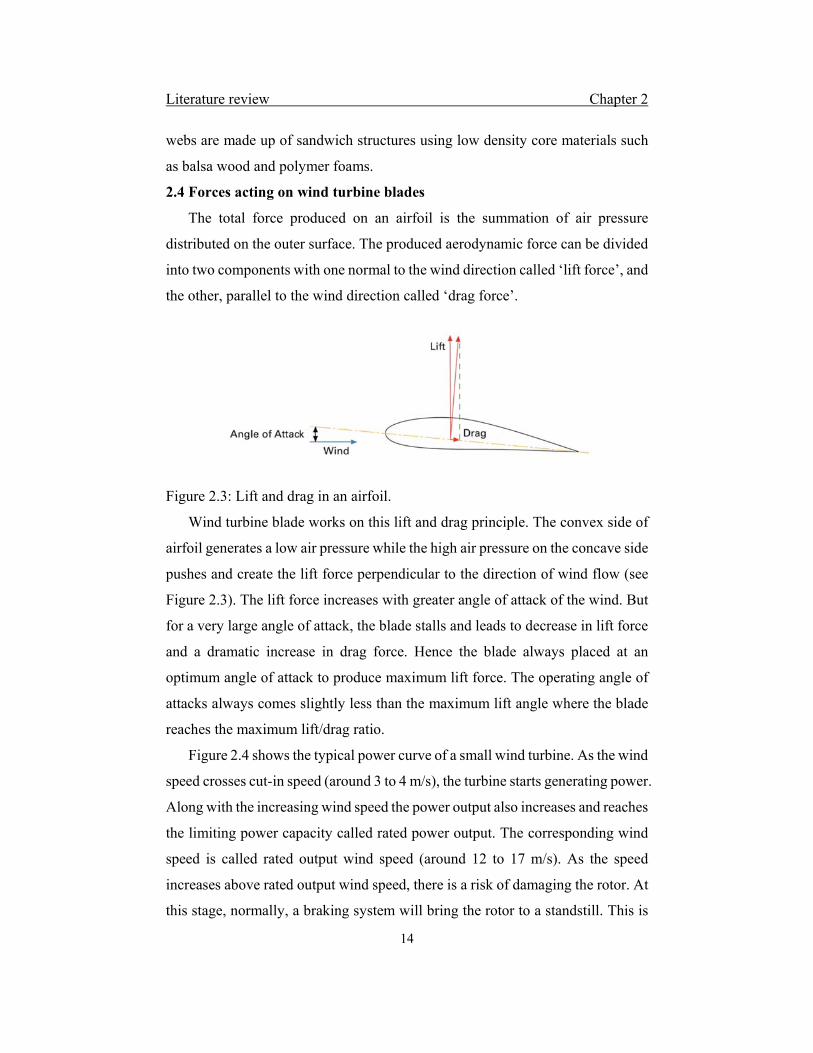
The total force produced on an airfoil is the summation of air pressure
distributed on the outer surface. The produced aerodynamic force can be divided
into two components with one normal to the wind direction called ‘lift force’, and
the other, parallel to the wind direction called ‘drag force’.
Figure 2.3: Lift and drag in an airfoil.
Wind turbine blade works on this lift and drag principle. The convex side of
airfoil generates a low air pressure while the high air pressure on the concave side
pushes and create the lift force perpendicular to the direction of wind flow (see
Figure 2.3). The lift force increases with greater angle of attack of the wind. But
for a very large angle of attack, the blade stalls and leads to decrease in lift force
and a dramatic increase in drag force. Hence the blade always placed at an
optimum angle of attack to produce maximum lift force. The operating angle of
attacks always comes slightly less than the maximum lift angle where the blade
reaches the maximum lift/drag ratio.
Figure 2.4 shows the typical power curve of a small wind turbine. As the wind
speed crosses cut-in speed (around 3 to 4 m/s), the turbine starts generating power.
Along with the increasing wind speed the power output also increases and reaches
the limiting power capacity called rated power output. The corresponding wind
speed is called rated output wind speed (around 12 to 17 m/s). As the speed
increases above rated output wind speed, there is a risk of damaging the rotor. At
this stage, normally, a braking system will bring the rotor to a standstill. This is

Literature review Chapter 2
15
called cut-out speed (around 25 m/s). The power coefficient (Cp) of a wind
turbine is the ratio of actual power divided by the available power.
Figure 2.4: Plot of power output and power coefficient versus wind speed (m/s). [Credit: Enercon E141 – Datasheet].
Figure 2.5:A full scale testing of a blade subjected to static load in the flap-wise direction. [Credit: LM Glassfiber A/S]
Literature review Chapter 2
16
The rotor blades are exposed to wind loads and gravity loads. The wind load
acts in the flap-wise direction and the gravity load acts in the edgewise direction
of the blade. A flap-wise bending load acts due to the wind and a varying
edgewise bending acts in tension/compression at both leading and trailing edge.
During operation, centrifugal force acts on the blade due to the rotation. However,
centrifugal force is relatively low as compared to the flap-wise loads and
neglected during the blade design calculation. The blades are designed as per IEC
61400-1 [7] by considering both static and cyclic loads subjected to a wide range
of environmental conditions such as temperature, humidity, wind gust.
Full-scale testing of blades is mandatory to check whether the blade is
satisfying certain categories of limit states as per Det Norske Veritas (DNV) [8].
They are ultimate limit state (ULS), fatigue limit state (FLS) and serviceability
limit state (SLS). A limit state is defined as the state beyond which the structure
no longer satisfies the design requirement. Also, full scale blade helps to validate
certain design assumptions used in the load calculations. Figure 2.5 shows the
full-scale blade testing in a flap-wise direction for the ultimate limit state (ULS).
2.5 Manufacturing defects
Though the composites have good engineering qualities, they still lack in
giving an improved life expectancy for the blades. The main problem faced by
the blade industry is due to the defects induced in the blade during the
manufacturing process. Postmortem reports on failed blades indicate that 64% of
blade failures are due to manufacturing defects (wrinkles, voids and porosity)(see
Figure 2.6) [9]. Common manufacturing defects that are found in the blades are
waviness and porosity/voids [10]. Waviness can occur due to misalignment of
the fiber (makes waviness in the plane of laminate) and misalignment of the
lamina (makes waviness out of plane of the laminate). Porosity/voids are
generally a result of the presence of air bubbles and/or foreign impurities during
the time of curing of the blades.
Research on waviness in laminates revealed that it causes significant
reduction in mechanical properties [11] and the impact is large in unidirectional

Literature review Chapter 2
17
laminates, [10, 12-15]. It was also found that the blade reinforcing components
reduces its strength (such as spar-caps). From the design perspective, the
compressive strength of a composite is the key property for structural
components [16]. Though unidirectional laminates have good tensile strength
and stiffness along the fiber direction, they are weak in compression. Waviness
or wrinkles may arise in any part of the structure due to excessive reinforcement
during layup on curved section of the mold structure or due to the ply drop
situation. The current focus of research is on waviness induced unidirectional ply
present in the spar-cap area. During turbine operation, defects can deteriorate the
material properties dramatically and initiate damage in the spar-cap. Once the
reinforcement fails, the whole blade structure will be in a critical condition and
it may lead to catastrophic failure of the whole turbine unit due to dynamic mass
imbalance.
Figure 2.6: In-plane waviness on the surface, out of plane waviness and porosity/voids [17].
Unidirectional fibers over spar-caps should withstand the predominant flap-
wise bending due to wind load. Full scale failure analysis of blades is expensive,
but at the coupon level many studies have shown that waviness deteriorates the
compressive strength of unidirectional composite laminate [13, 15, 17-19]. The

Literature review Chapter 2
18
compression strength decreases steadily with increase in both wave severity and
the number of 0° ply’s containing waviness [10]. Adams et al [11] found that the
percentage reduction in strength is approximately equal to the percentage of 0°
ply containing waviness and a reduction of 35% in strength was observed with
0° plies containing 33% waviness.
2.5.1 Fiber waviness
To define the extent of fiber waviness, Adams [12] characterized the wave
geometry (see Figure 2.7) with a set of parameters such as wave amplitude (A)
and wavelength (L). He defined wave severity (Ws) as the ratio of wave amplitude
to the wave length.
Figure 2.7: Shape of an in-plane waviness with wave length ‘L’ and amplitude ‘A’.
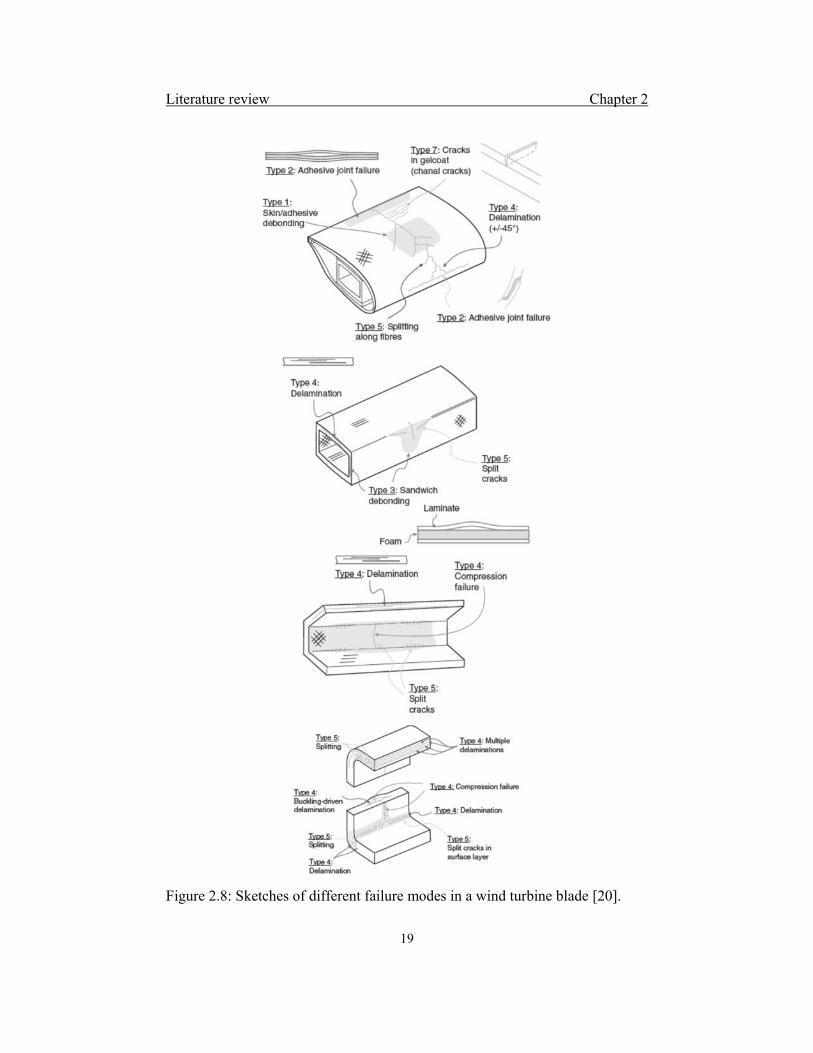
2.6 Failure modes in wind turbine blades
Failure modes of a blade is defined as the stages of its operation where the
blade loses its load bearing capabilities. This could be a damage mode that further
lead to the failure or repair. Failure of a blade involves crack initiation,
progression of crack and final failure. Table 2.1 and Figure 2.8 shows the various
failure modes that are common in a turbine blade tested to failure [20]. In the
following section and sub-sections, a general overview of these failure modes on
the composite laminates are discussed.
Literature review Chapter 2
19
Figure 2.8: Sketches of different failure modes in a wind turbine blade [20].
Literature review Chapter 2
20
Table 2.1: Various failure modes
Basic damage mode Types of damage
Adhesive joint failure Cracks in adhesive layer, laminate/adhesive
interface cracking.
Sandwich failure Interface cracking
Laminate failure Tensile failure (fiber or matrix failure),
Compressive failure (fiber failure), shear failure,
fiber/matrix debonding, fiber splitting,
delamination failure.
Gelcoat delamination and
crack
Interface cracking, thin film cracking.
2.7 Failure mechanisms in laminated composites
In the wind turbine blades, the major forces acting over the laminates under
extreme loading conditions are bending, tension, compression and shear forces.
In this section, failure mechanisms found in composite laminates under these test
conditions were discussed. The prime idea of this research is to understand the
effect of manufacturing defect on the failure modes in the wind turbine blade.
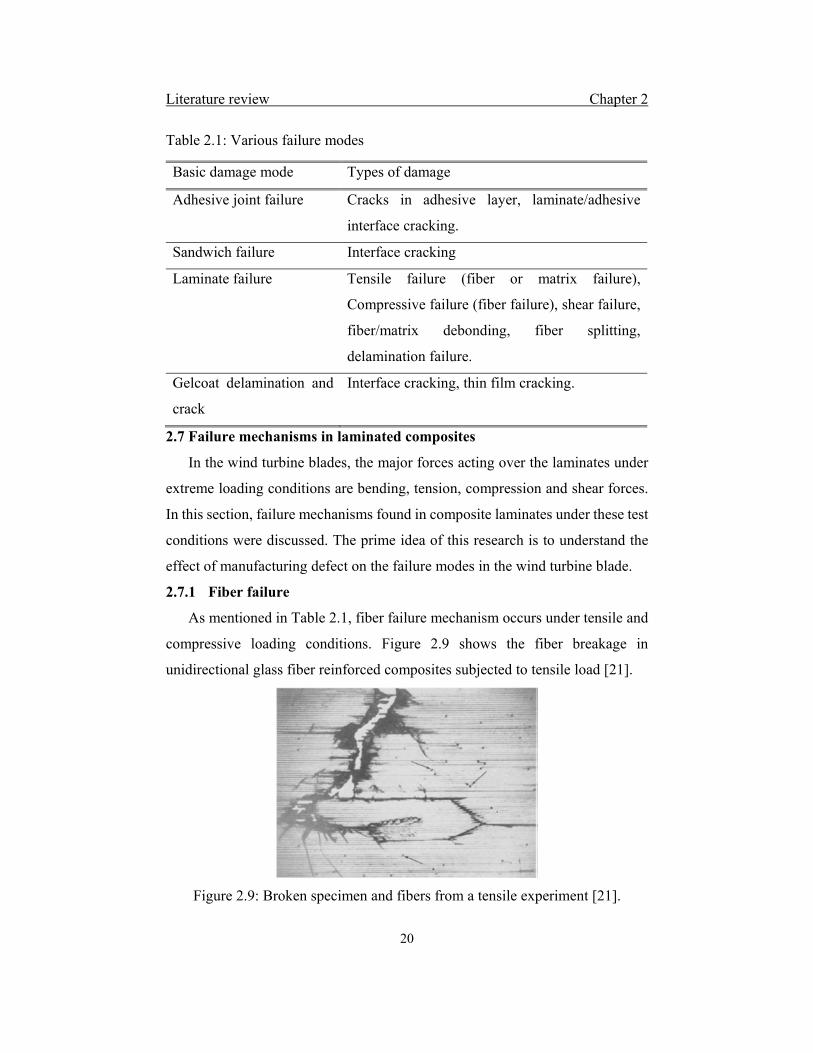
2.7.1 Fiber failure
As mentioned in Table 2.1, fiber failure mechanism occurs under tensile and
compressive loading conditions. Figure 2.9 shows the fiber breakage in
unidirectional glass fiber reinforced composites subjected to tensile load [21].
Figure 2.9: Broken specimen and fibers from a tensile experiment [21].

Literature review Chapter 2
21
On the other hand, when unidirectional FRP composites subjected to
compressive load, a sequence of failure mode in an order of fiber micro-buckling
followed by kink band and crushing of the whole specimen.
Figure 2.10: Fiber breakage after kink band and crushing.
Figure 2.10 shows that the fiber breakage occurs after the kink band and
crushing of the specimen in a compression experiment of unidirectional FRP
composite. When a fiber breaks, the net load distribution over the remaining
unbroken fibers increases, thus the average stress over the cross section. There
by increases the probability of breakage of more fibers and resulted into crushing
failure mode.
2.7.2 Matrix failure
The matrix material binds the fibers each other and helps to distribute the
loads among the fibers. Matrix has lower compressive and tensile strength as
compared to fiber material, hence chances of matrix failure is higher than the
fiber failure. Matrix failure generally occurs during transverse tension and shear
loads. The Figure 2.11 shows the crack propagation in a matrix material during
transverse tension failure [22]. Here, the fiber acts as a point of local stress
concentration. On a macroscopic approach, under transverse tension failure the
failure mode transforms from transverse tension to a combination of transverse
tension and shear (also called peel).

Literature review Chapter 2
22
Figure 2.11: Crack propagation in the matrix [22]
Figure 2.12: a) Cusps formation during shear failure, b) Cusps in peel fracture, c) Peel fractured surface[22].
One important phenomenon which forms during shear failure apart from the
transverse tension failure is cusps (Figure 2.12(a)). Shear failure usually occurs
in lamina interfaces with different fiber orientation. Shear failure follows the path
of the fiber, which is close to the shear stress direction [23]. Irrespective of the
fiber direction, the cusps always tend to align perpendicular to the shear stress
direction. The peel fracture always occurs normal to the fiber direction as shown
in Figure 2.12(c).

Literature review Chapter 2
23
2.7.3 Fiber/matrix debonding
This failure mode usually occurs when the interfacial strength is weak and
end up with a fiber failure. Every failure mode initiates with a micro-crack and
during transverse tensile failure the interfacial shear stress causes the crack to
propagate and end up with fiber/matrix debonding [24]. Figure 2.13 displays the
SEM micrographs of fiber/matrix debonding in a glass fiber/vinyl ester
composite subjected to shear test. The factors that affects fiber/matrix debonding
are moisture, temperature, fiber surface and matrix wettability.
Figure 2.13: Fractured surface of glass fiber/vinyl ester composites due to extensive interfacial debonding[24].
2.7.4 Delamination failure
Delamination is one of the root causes in many major failures observed in
wind turbine blades. It is the process of separating the adjacent plies due to
significant loss in mechanical toughness. The lateral strength of the fibers is
relatively low compared to longitudinal strength and the interface ply bonding
strength more relies on relatively weak matrix properties. Delamination failure
initiates at the point at which the interlaminar stress exceeds the through-
thickness strength.
Laminate layup configuration and type of curing service may cause
delamination. The moisture absorption and coefficient of thermal expansion of
fibers layers and matrix are different, hence the shrinkage rate and moisture
content in each ply varies during curing procedure. This may lead to the residual
stresses and favors delamination in the laminate [25]. The presence of resin rich

Literature review Chapter 2
24
region affects the curing time in adjacent plies and decrease the interface
properties, which may cause delamination [26].
Delamination can be divided into surface delamination and internal
delamination. Internal delamination occurs at the ply interface due to micro
cracks. Generally, occurs in compressive loading conditions and further reduces
the load carrying capacity of the laminate. Figure 2.14 shows different surface
delamination possibilities in composite components. Under static or cyclic
loading, the surface delamination reduces the strength and end up with a
catastropic failure of the components.
Figure 2.14: Different types of surface delamination[26]
There are totally three modes of delamination based on fracture toughness
of the resin state, they are opening mode (mode I), shear mode (mode II) and
tearing mode (mode III) as shown in Figure 2.15. Fracture toughness is the
amount of energy required to create a fracture surface. The crack propagates and
interface debonding will occur when strain energy reaches any of the maximum
mode energy value [27].

Literature review Chapter 2
25
Figure 2.15: Opening mode, shear mode and tear mode
2.8 Failure theories
The ultimate goal of failure criterion based prediction is to forecast the results
of simple and complex real world structural problems. Based on the lamina
failure, the proposed failure criteria could be divided into two groups. One group
with failure criteria which is not associated with failure modes (Generalized
failure criterion) and other group associated with failure modes (physically-based
failure criterion).
2.8.1 Generalized failure criterion
In generalized failure criteria, the failure is predicted based on the ply stress
and strength parameters [28].
, , , , , , , , …… . . 1nofailure
1failurelimit1failure
where as , … are the ply stresses and , … are the strength
parameters related to principal directions. This includes all the polynomial and
tensorial criteria such as Tsai-Wu criteria [29], Tsai-Hill criteria [30], Hoffman
criteria [31], etc. Each failure criterion provides the load at which the first ply-
failure occurs during a simple tensile or compression experiment. Also, it is the
point at which the load - displacement curve changes its path from linear direction.
After the first ply failure, the remaining ply will carry the applied load, hence as
the applied load increases, there will be a sequence of ply failure until the
complete laminate failure. The ultimate failure load might be higher than the first
ply failure load. The generalized failure criteria will not give any details
regarding the failure mechanism and mode of failure. The below inequality
represents the general form of the quadratic failure criterion up to second order.

Literature review Chapter 2
26
2
1
(2.3)
and are the derived coordinate stress values from the applied load and
Fij’s are the material dependent strength parameters. No failure will occur when
the inequality is less than unity. In Figure 2.16, the middle graph shows the failure
surface, and at this region the resultant stresses will be equal to the failure stresses
(σ .
Figure 2.16: Condition for failure for the applied stresses and [32].
Orthotropic material has three mutually perpendicular planes of symmetry.
The final inequality relation for failure can be re-written as,
2 1
(2.4)
Among the strength parameters, , , , , , , , , are
called non-interaction strength parameters and the values are obtained from
Literature review Chapter 2
27
uniaxial tensile, compressive and shear experiments. Similarly, , and
are called interaction strength parameters and their values are determined from
off-axis uniaxial and biaxial experiments.
For transversely isotropic material, because of the transverse symmetry about
one unique axis some of the stress parameters becomes identical. Final inequality
can be written as,
2
2 2 1
(2.5)
Similarly, for isotropic the failure criterion becomes,
σ
2
2 1
(2.6)
2.8.2 Physically-based failure criterion
According to physically-based failure criterion, based on the constituent
material properties various failure modes will be present during failure
progression such as fiber failure, transverse matrix cracking, shear matrix
cracking etc. Based on the failure criteria associated with, the physically-based
failure criterion can be sub-divided into non-interactive and interactive type
criterion.
In a non-interactive criterion, the stress - strain interaction in the lamina not
taken into consideration. E.g.: Maximum stress criterion and Maximum strain
criterion. Here the failure modes are predicted based on comparing the stresses
and strain values with ultimate limits. As per maximum stress criterion, the
composite is failed when the stress components in the longitudinal and transverse
direction reaches the allowable stress limit. The failure inequality conditions are,
, , (2.7)
Literature review Chapter 2
28
Similarly, for maximum strain criterion the failure will occur when the strain
exceeds the ultimate strain value.
, , (2.8)
The above maximum stress and maximum strain conditions are meant for
two-dimensional state condition. Though these non-interactive theories are poor
in predicting the failure, their easiness in implementation and understanding
makes them popular.
In interactive mode of failure, the stress/strain interaction will be present and
failure is predicted based on a mechanism (physically based) such as fiber-
dominated failures and matrix-dominated failures. E.g.: Hashin’s [33],
Christensen [34], Puck’s [35] and LaRC02 [36].
2.8.2.1 Hashin’s failure criterion
In 1973, for the first time Hashin [33, 37] established two separate failure
criteria for matrix and fiber based on tensile experiment. The criteria assume a
quadratic interaction between the tractions related with failure plane. In 1980, a
distinction has been made by him on the matrix and fiber failure criteria in tension
and compression related failure. The recent 3D version [33]of the criteria derived
using the quadratic interaction between stress invariant was purely based on the
logical reasoning. Though the criteria was developed for unidirectional laminates,
it also been applied for the progressive failure analysis of laminates by
constraining the inter lamina interaction in situ with the unidirectional strength
[38]. The following equation represents the fiber-matrix failure criteria under
tension and compression.
Matrix failure criteria,
In tension 0
(2.9)
In compression, 0

Literature review Chapter 2
29
1973: (2.10)
1980: 1 (2.11)
Fiber failure criteria,
In tension, 0
(2.12)
In compression, 0
(2.13)
Apparently, Hashin’s criteria failed to predict the increase in shear strength
during transverse compression failure. Also, Hashin’s criteria does not consider
the effect of in-plane shear during fiber compression, which has significant effect
on the effective compressive strength of the lamina. Several researchers further
modified the Hashin’s criteria for an improved failure prediction.
2.8.2.2 Puck’s failure criterion
In 1995, Puck [39] introduced a failure criteria by incorporating Mohr-
Coulomb criterion [40] into Hashin’s criterion and to be known as the first
mechanism-based failure theory. The failure was proposed based on the matrix
compression failure. For unidirectional composites, Puck’s failure criterion
identifies the fiber failure and matrix cracking failure. In tension, the major
failure mode is fiber failure and in compression the failure mode is fiber kinking.
Fiber failure criteria,
In tension, 0
11 (2.14)
In compression, 0

Literature review Chapter 2
30
11 10 (2.15)
The Puck’s criterion on the fiber material, for glass fiber the value of
1.3 and for carbon fiber 1.1.
The matrix cracking or fiber/matrix debonding are distinguished based on the
fracture plane angle. The first mode of matrix cracking is with 0° fracture angle,
this criterion invokes with a transverse stress greater than zero 0 and the
crack propagate perpendicular to the transverse load. The second mode
corresponds to transverse compressive stress 0 coupled with a
longitudinal shear stress. Third mode of matrix cracking resulted with an inclined
fracture plane relative to the reinforcing fiber. This mode usually happens for a
significantly large longitudinal shear stress.
2.8.2.3 LaRC02 failure criterion
LaRC02 failure criterion [41] is an improvement to Hashin’s model
combined with the fracture plane concept of Puck [35] failure criterion. This
criterion identifies the fiber failure and matrix cracking in unidirectional
composites (initiation and instantaneous damage progression) [35, 42] based on
the below mentioned constitutive relations. The matrix cracking failure under
transverse compression, is calculated based on the same Mohr-Coulomb effective
stresses. Under longitudinal compression, the fiber kinking failure is predicted
by measuring the fiber misalignment angle based on the load applied and
applying the matrix failure criterion at the coordinate plane of fiber misalignment.
Based on LaRC02 failure criterion, under uniaxial compression loading, (1)
fiber failure is further divided into (1.a) fiber compressive failure with matrix
compression, and (1.b) fiber compressive failure with matrix tension. (2) Matrix
cracking is again divided into (2.a) matrix cracking in tension, and (2.b) matrix
cracking in compression. The fiber compression failure scenario was explained
due to the collapse of fibers subjected to initial misalignment, leading to shear
kinking and further extending to the supporting matrix [43, 44].

Literature review Chapter 2
31
(1) As mentioned earlier, under fiber compression 0, two stress states
(matrix under compression and matrix under tension) were considered to
evaluate the fiber failure [1].
(1.a) For matrix compression ( 0)
Failure index ⟨| | ⟩ (2.16)
(1.b) For matrix tension ( 0)
Failure index (2.17)
(2) For the matrix compression failure criterion,
(2.a)
Failure index (2.18)
(2.b) at this stage the material is in a moderate biaxial compressive
state and the condition is,
Failure index (2.19)
2.9 Compressive failure analysis of FRP composites
Compressive strength of composite laminates is one of the major design
drivers in wind turbine industry. Compressive failure in these materials is
complex, as it involves multiple modes of failure like fiber kinking, splitting,
buckling and delamination [45-48]. Also, the failure event could be sudden and
catastrophic. In 1965, Rosen [45] attributed the compressive failure to elastic
instabilities resulting in a fiber-buckling mechanism. When the fiber buckles in
the out of phase it is called extension mode and if it buckles in-phase, it is called
shear mode. According to Rosen model, the compressive strength of composite
in the longitudinal direction is

Literature review Chapter 2
32
1
(2.20)
is the matrix shear modulus and is the fiber volume fraction.
Compared to experiment results both the shear mode (Eq: 2.20) and extension
mode overestimate the actual compressive strength by a factor of four or five.
Greszczuk [49] introduced a 3D model corresponding to Rosen model and
was in good agreement with metal/matrix composites and failed to perform
among graphite and boron/matrix composites. Later a lot of researchers modified
the Rosen model by introducing certain factors into account such as Steif model
[50], Xu and Reifsnider model [51] but all these models did not gave much
refinement to the final result. A model with a single fiber layer with infinite
matrix, by Waas [52] concluded that, if the interface is greater than 1/10th of the
fiber diameter, it causes reduction in compressive strength of the unidirectional
composites. Through elasticity approach Zhang et al [53] concluded that shear
mode failure is dominant in all range of volume fraction except 0.05 and this
contradicts Rosen’s model. The main disadvantage of micro-buckling model is
that it does not consider the effect of fiber misalignment and over prediction of
the result.
Fiber kinking is a highly-localized buckling caused due to inelastic
deformation of matrix, which happened because of fiber misalignment from their
reinforced direction. In this area the pioneer model is considered as Argon model
[54]. He considered both shear stress and fiber misalignment angle to calculate
the kinking stress of the composite laminate. The critical compressive stress
decreases with increasing fiber misalignment (rotation) angle, and the stress is
(2.21)
where is the yield stress in longitudinal shear and is the initial fiber
misalignment. Later on, Argon model is improved by Budiansky [55], Fleck and
Budiansky [46, 56], Hahn and Williams [57] with the addition of fiber

Literature review Chapter 2
33
misalignment. Budiansky Model [55] is especially for elastic-ideally plastic
composites.
1 (2.22)
G is the shear modulus of the composite and is the initial angular
misalignment of the fiber. At 0, it gives Rosen’s bifurcation stress and at
larger values of the results are asymptotes to the Argon Model results Eqn:
2.21. Still this model predicts a better result for the compressive strength and
considered as the basic model for the compression failure of unidirectional
composites.
However, subsequent studies accepted that compressive failure of
unidirectional composite systems are due to plastic micro-buckling. These
investigations concluded that compressive failure of fiber reinforced composites
is predominantly a result of plastic micro-buckling of the fibers in an idealized
inelastic matrix medium [46]. Along the same lines, Kyriakydes et al. [58]
observed regularly spaced in-plane kink bands with a width of ~1-1.5 mm during
compression testing of the composites. In addition, Vogler and Kyriakides [59,
60] showed that kink bands formation is a post-buckling event and initiate from
a local imperfection in the sample. In a micromechanical study, Prabhakar et al.
[61] observed an interaction between the kink band and splitting failure modes
and concluded that mode II cohesive shear strength has a greater influence in
failure mode interaction.
The point of failure initiation depends upon the type of specimens used for
the experiment. However, the failure initiation and progressions in the unnotched
specimens are highly unstable and spontaneous. The primary interest of all the
scientists was to determine failure mechanisms at the peak load and it was
globally acclaimed that kink band formation is the limiting mechanism which
leads to the failure of unidirectional composite at the peak load. Since the kink
band formation is a micro-level mechanism, it is very difficult to detect this

Literature review Chapter 2
34
failure during the time of testing, however, some of the researchers succeeded in
locating the failure mechanism in notched specimens using advanced
technologies.
Hapke et.al [62] did an in-situ SEM analysis on UD carbon/epoxy material
with a notched specimen to localize the initiation. In the sequence of event they
observed a plastic shearing in the matrix. Later, the straight fibers are locally
deflected and form a kink shape followed by a sudden and catastrophic failure.
In some models, fracture of fiber is not necessary for the initiation and
development of kink bands. There is no longitudinal splitting observed in the
sequence of events. In the later discussion, it was pointed out that the splitting
mechanism has greater importance in fiber diameter and fiber volume fraction.
2.9.1 Effect of matrix properties in the compressive failure mechanism
From the kinking mechanism, it was clear that matrix undergoes shear
deformation. The failure is effective only when the matrix shows an elastic -
plastic behavior during deformation. If the matrix is brittle and the reinforcing
fiber has larger diameter, the chances of fiber-matrix interface failures are high
and this leads to splitting mechanism. This splitting mechanism is found common
in glass fiber composites due to their larger diameter compared to carbon fiber
and it was experimentally proved by Lee and Waas [47], Oguni and
Ravichandran [63].
Pimenta et.al [64] did experiment and a micro-mechanical model analysis to
study the propagation of kinking failure in the composite. The material used for
the study was carbon/epoxy prepreg. An in-situ microscopy method is used in
experimental study and in the model the matrix is considered as elastic-plastic in
nature. In the sequence of kinking failure mechanism, composite undergoes a
global elastic deformation followed by an initiation of matrix yielding until the
peak load is reached. Finally, during the softening time the matrix yield and
composite deformation localized in to a narrow band and the fiber starts failing
in that narrow band. Figure 2.17 shows the micro graphs of kink bands of the
specimen from an unloaded condition using optical microscope.

Literature review Chapter 2
35
Figure 2.17: Kink–band with matrix yielding and no fiber failure (unloaded) [64]
2.9.2 Effect of fiber diameter on compressive failure mechanism
The earlier model proposed by Argon, Budiansky and Fleck does not mention
any importance of fiber properties in the compressive strength prediction. But
Lee and Waas [48], Yerramalli and Waas [65] considered fiber properties to
determine the compressive strength. When the mechanism become splitting,
especially in the case of glass fiber polymer matrix composite the expression for
splitting compressive stress is
81 (2.23)
- fiber volume fraction, – Interfacial fracture energy, - Fiber radius,
and are constants which depends on the elastic properties of the fiber and
matrix.
11
1 4
2 1 1 21
2 1 1 2
(2.24)
An experimental study was performed by Yerramalli [66] for two different
diameter (13.5 µm and 24 µm) of glass fiber polymer composite for a given fiber
volume fraction. Instead of getting an increase in compressive strength with

Literature review Chapter 2
36
decrease in fiber diameter, the values were comparable. The failure mechanism
shifted from splitting to kinking with increase in fiber volume fraction. It was
observed that small diameter fiber reinforced polymer composites failed due to
fiber kinking in all fiber volume fractions and splitting failure was observed more
in larger diameter fiber composites.
Effect of fiber waviness on compressive strength
Several researchers have studied various kinds of waviness which developed
during the manufacturing of composites and their effect on compressive strength.
Adams et. al [12] did an out of plane waviness study on several cross-ply
laminates and found that reduction in compressive strength is more significant in
laminate with unidirectional ply having waviness as compared to other cross-ply
laminates. A reduction in strength of 36% was observed with 20% of 0º laminates
carrying out of plane waviness.
Figure 2.18:Post failure analysis of laminate with moderate waviness and severe waviness [12].
Figure 2.18 shows that with increase in wave severity broom type failure (on
the right) was observed at the gage section. Avery et. al [15] studied the effect of
fiber misorientation due to ply drop, ply joints and mold geometry by using
various fiber fabric and matrix material. He has selected straight fabric, prepreg
fabric, stitched with large tows and woven fabrics for the study. An average of
0.6 to 0.8% reduction in failure strain was observed with inclusion of fiber
waviness on the large tow carbon fiber laminate. A failure strain of 0.3 to 0.5%
was reduced due to ply drop situation in a prepreg material.
Flexural failure of unidirectional composite laminate
Wind turbine blades were subjected to various amplitude of wind loads in
both flap-wise and edge-wise direction during its operational life. In this section,
Literature review Chapter 2
37
various research conducted on the flexural failure of composites were discussed.
Generally observed failure modes are fiber failure at both sides of the specimen,
interlaminar shear failure followed by delamination and extensive splitting of
fibers along the fiber direction. The outermost layer of the specimen was failed
due to tension and the innermost was due to compression. The failure modes are
generally the same kinds that discussed earlier in this section.
Fatigue failure behavior of unidirectional composite laminate
Wind turbine blade subjected to various kinds cyclic loads during its service
life such as aerodynamic load, gravitational load and the centrifugal forces. As
the wind is a chaotic form of energy, most of the turbine failures were reported
with fatigue failure of blades [67]. Therefore, it is important to understand the
fatigue behavior of the composites used in the blade fabrication for the better
understanding of the service life of a blade.
In general fatigue strength of a material is always below the ultimate strength
value and for composites subjected fatigue loads associated with a degradation
in both stiffness and strength. Stiffness can be related with fatigue strength of the
material and the degradation in the stiffness is dependents on the load ratio, layup
sequence and the type of cyclic load acting [68]. In a static and fatigue experiment
conducted by Philippidis et.al [69] on a multidirectional GFRP specimen found
that for a 95% reliability level the stiffness degradation was found close to 5 to
20%. When a composite specimen fails under an applied stress ratio in a force
controlled fatigue test, the point of failure is considered as the load bearing
capacity of that material for the applied stress ratio [70]. For a unidirectional
composite laminate under displacement – controlled fatigue test by Shih [71], a
10% load drop was considered as the failure criteria. Similarly, for a force –
controlled tensile fatigue test of [0/90º]s epoxy based laminate by Jones, a 15%
degradation of stiffness was considered as the failure criteria [72]. For the past
25 years, several researchers had delivered different failure criterion based on the
stiffness degradation. While looking on to the damage mechanism and failure
modes presented in a fatigue failure Talreja [73], concluded that fiber failure,

Literature review Chapter 2
38
matix cracking, delamination and the fiber/matrix debonding are the major
failures presented.
The failure modes and damage mechanisms varied based on the stress level.
At lower stress level matrix cracking is the major failure mode and in medium
loads delamination were observed. At higher load ratios fiber failure was the
dominant failure mode. Wind turbines generally operates at lower load, hence
matrix cracking was the common failure observed in many of the blades under
repair [74, 75]. Ogin [76] found a relationship between the transverse matrix
crack and the stiffness degradation for a cross-ply made up of GFRP. According
to Kashtalyan [77], matrix cracking is not the only reason for the final failure of
a laminate. But matrix cracking presented at the ply interface may lead to
delamination onset due to local stress concentration.
Daniel [78] performed a compression fatigue analysis on thermoplastic cross-
ply laminates with fiber waviness and established an S – N curve. Brooming
failure and delamination were the major failure modes. As compared with a
defect free sample (with a one million run out cycle), a moderate wave induced
sample showed 45% reduction in static compressive strength and a 75%
reduction in fatigue strength. Horrmann [79] has prepared an out of plane
waviness induced sample by inserting polymer rods in between the layer and
conducted both static and fatigue analysis. The study found that under C-C and
T-C loading conditions, 50% reduction in fatigue life was observed as compared
to no-defect sample under the same load conditions.
The fatigue failure mechanism of FRP composites are found to be complex
and the failure mechanisms have greater dependence on the load ratio and the
layup sequence (in a way fiber orientation). Many researchers found that matrix
cracking as the major failure mode and some others found fiber failure as the
major failure mode. So, for the current research it is vital to observe the fiber
waviness effect on the crack propagation and damage accumulation.

Literature review Chapter 2
39
Summary
In this chapter, basics of wind turbine blades, typical blade design, types of
load acting on the blades and different manufacturing defects in the wind turbine
blades were explained. Special attention was given to the fiber waviness defect
and the previous research on it. The failure mechanisms and different failure
modes of composite materials under extreme compression and bending load
conditions were explained. Previous research on failure analysis of composites
based on different failure theories was explained. Various research aspects on
coupon level bending and compression fatigue failure analysis of unidirectional
composite laminates were discussed to understand the different failure modes
presented.
References
[1]. M. F. Ashby, Materials selection in mechanical design. Metallurgia
Italiana. Vol. 86. 1994. 475-475.
[2]. WE Handbook- 5 - Gurit Composite Materials for Wind Turbine Blades.
[3]. P. Brøndsted, H. Lilholt, and A. Lystrup, Composite Materials for Wind
Power Turbine Blades. Annual Review of Materials Research, 2005.
35(1): p. 505-538.
[4]. T. Burton, et al., Wind energy handbook. 2011: John Wiley & Sons.
[5]. A. R. Bunsell, Fibre reinforcements for composite materials. Composite
materials series, 1988.
[6]. T. W. Chou, et al., Comprehensive Composite Materials: Fiber
Reinforcements and General Theory of Composites. 2000: Elsevier.
[7]. I. E. Commission, IEC 61400-1: Wind turbines part 1: Design
requirements, in International Electrotechnical Commission. 2005.
[8]. D. N. Veritas, Design and manufacture of wind turbine blades, offshore
and onshore wind turbines. DNV Standard, DNV-DS-J102, 2010: p.
2010-11.
[9]. D. Griffin and M. Malkin, Lessons Learned from Recent Blade Failures:
Primary Causes and Risk-Reducing Technologies. 2011: p. 259.

Literature review Chapter 2
40
[10]. J. Mandell, D. Samborsky, and L. Wang. Effects of fiber waviness on
composites for wind turbine blades. in International Sampe Symposium
and Exhibition. 2003. SAMPE; 1999.
[11]. D. Adams and S. J. Bell, Compression Strength Reductions in Composite
Laminates Due to Multiple-Layer Waviness. Composites Science and
Technology, 1995. 53(2): p. 207-212.
[12]. D. O. Adams and M. W. Hyer, Effects of Layer Waviness on the
Compression Strength of Thermoplastic Composite Laminates. Journal of
Reinforced Plastics and Composites, 1993. 12(4): p. 414-429.
[13]. T. A. Bogetti, J. W. Gillespie, and M. A. Lamontia, The influence of ply
waviness with nonlinear shear on the stiffness and strength reduction of
composite laminates. Journal of Thermoplastic Composite Materials,
1994. 7(2): p. 76-90.
[14]. J. F. Mandell, D. D. Samborsky, and H. J. Sutherland. Effects of materials
parameters and design details on the fatigue of composite materials for
wind turbine blades. in EWEC-CONFERENCE-. 1999.
[15]. D. P. Avery, et al. Compression strength of carbon fiber laminates
containing flaws with fiber waviness. in 42nd AIAA Aerospace Sciences
Meeting and Exhibit, p 174. 2004.
[16]. M. R. Piggott, The Effect of Fiber Waviness on the Mechanical-
Properties of Unidirectional Fiber Composites - a Review. Composites
Science and Technology, 1995. 53(2): p. 201-205.
[17]. J. W. Nelson, D. S. Cairns, and T. W. Riddle. Manufacturing Defects
Common to Composite Wind Turbine Blades: Effects of Defects. in
Proceedings AIAA Aerospace Science Meeting, Wind Energy Symposium,
Orlando, FL. 2011: p. 1756.
[18]. P. Davidson, et al. Effect of Fiber Waviness on the Compressive Strength
of Unidirectional Carbon Fiber Composites. in 53rd
AIAA/ASME/ASCE/AHS/ASC Structures, Structural Dynamics and
Materials Conference, AIAA 2012-1612, Honolulu, Hawaii. 2012.

Literature review Chapter 2
41
[19]. M. R. Wisnom, The Effect of Fiber Waviness on the Relationship between
Compressive and Flexural Strengths of Unidirectional Composites.
Journal of Composite Materials, 1994. 28(1): p. 66-76.
[20]. B. F. Sørensen, et al., Improved design of large wind turbine blade of
fibre composites based on studies of scale effects (Phase 1). Summary
report. 2004.
[21]. A. Armenakas and C. Sciammarella, Response of glass-fiber-reinforced
epoxy specimens to high rates of tensile loading. Experimental
Mechanics, 1973. 13(10): p. 433-440.
[22]. D. Purslow, Matrix fractography of fibre-reinforced epoxy composites.
Composites, 1986. 17(4): p. 289-303.
[23]. D. Purslow, Some fundamental aspects of composites fractography.
Composites, 1981. 12(4): p. 241-247.
[24]. J. Zhu, et al., Processing a glass fiber reinforced vinyl ester composite
with nanotube enhancement of interlaminar shear strength. Composites
Science and Technology, 2007. 67(7): p. 1509-1517.
[25]. T. Tay and F. Shen, Analysis of delamination growth in laminated
composites with consideration for residual thermal stress effects. Journal
of composite materials, 2002. 36(11): p. 1299-1320.
[26]. V. Bolotin, Mechanics of delaminations in laminate composite structures.
Mechanics of composite materials, 2001. 37(5): p. 367-380.
[27]. T. K. O'Brien, Interlaminar Fracture of Composites. 1984, National
Aeronautics And Space Administration Hampton VA, Langley Research
Centre.
[28]. M. N. Nahas, Survey of failure and post-failure theories of laminated
fiber-renforced composites. Journal of Composites, Technology and
Research, 1986. 8(4): p. 138-153.
[29]. S. W. Tsai and E. M. Wu, A general theory of strength for anisotropic
materials. Journal of composite materials, 1971. 5(1): p. 58-80.

Literature review Chapter 2
42
[30]. S. W. Tsai, Strength Characteristics of Composite Materials. 1965,
Philco Corp Newport Beach CA.
[31]. O. Hoffman, The brittle strength of orthotropic materials. Journal of
Composite Materials, 1967. 1(2): p. 200-206.
[32]. L. P. Kollár and G. S. Springer, Mechanics of composite structures. 2003:
Cambridge university press.
[33]. Z. Hashin, Failure Criteria for Unidirectional Fiber Composites. Journal
of Applied Mechanics-Transactions of the Asme, 1980. 47(2): p. 329-
334.
[34]. R. M. Christensen and S. DeTeresa, The kink band mechanism for the
compressive failure of fiber composite materials. Journal of applied
mechanics, 1997. 64(1): p. 1-6.
[35]. A. Puck and H. Schürmann, Failure analysis of FRP laminates by means
of physically based phenomenological models. Composites Science and
Technology, 1998. 58(7): p. 1045-1067.
[36]. D. Ambur, N. Jaunky, and C. Davila. Progressive Failure of Composite
Laminates Using LaRC02 Criteria. in 45 th AIAA/ASME/ASCE/AHS/ASC
Structures, Structural Dynamics and Materials Conference. 2004.
[37]. Z. Hashin and A. Rotem, A fatigue failure criterion for fiber reinforced
materials. Journal of composite materials, 1973. 7(4): p. 448-464.
[38]. I. Shahid and F.-K. Chang, An accumulative damage model for tensile
and shear failures of laminated composite plates. Journal of Composite
Materials, 1995. 29(7): p. 926-981.
[39]. A. Puck, Festigkeitsanalyse von Faser-Matrix-Laminaten: Modelle für
die Praxis. 1996: Hanser.
[40]. J. Salençon, Handbook of Continuum Mechanics: Short Reader. 2001:
Springer.
[41]. C. Davila, N. Jaunky, and S. Goswami. Failure Criteria for FRP
Laminates in Plane Stress. 2003.

Literature review Chapter 2
43
[42]. C. G. Davila, Failure Criteria for FRP Laminates. Journal of Composite
Materials, 2005. 39(4): p. 323-345.
[43]. N. A. Fleck and D. Q. Liu, Microbuckle initiation from a patch of large
amplitude fibre waviness in a composite under compression and bending.
European Journal of Mechanics a-Solids, 2001. 20(1): p. 23-37.
[44]. C. R. Schultheisz and A. M. Waas, Compressive failure of composites,
part I: testing and micromechanical theories. Progress in Aerospace
Sciences, 1996. 32(1): p. 1-42.
[45]. B. W. Rosen, Influence of fiber and matrix characteristics on mechanics
of deformation and fracture of fibrous composite. American Society for
Metals, Metals Park, Ohio, 1965: p. 37-75.
[46]. B. Budiansky, N. Fleck, and J. Amazigo, On kink-band propagation in
fiber composites. Journal of the Mechanics and Physics of Solids, 1998.
46(9): p. 1637-1653.
[47]. S. H. Lee and A. M. Waas, Compressive response and failure of fiber
reinforced unidirectional composites. International Journal of Fracture,
1999. 100(3): p. 275-306.
[48]. S. H. Lee, C. S. Yerramalli, and A. M. Waas, Compressive splitting
response of glass-fiber reinforced unidirectional composites. Composites
Science and Technology, 2000. 60(16): p. 2957-2966.
[49]. L. B. Greszczuk, Microbuckling Failure of Circular Fiber-Reinforced
Composites. AIAA Journal, 1975. 13(10): p. 1311-1318.
[50]. P. S. Steif, A simple model for the compressive failure of weakly bonded,
fiber-reinforced composites. Journal of composite materials, 1988. 22(9):
p. 818-828.
[51]. Y. L. Xu and K. L. Reifsnider, Micromechanical modeling of composite
compressive strength. Journal of Composite Materials, 1993. 27(6): p.
572-588.
[52]. A. Waas, Effect of interphase on compressive strength of unidirectional
composites. Journal of applied mechanics, 1992. 59(2S): p. S183-S188.

Literature review Chapter 2
44
[53]. G. Zhang and R. A. Latour Jr, An analytical and numerical study of fiber
microbuckling. Composites science and technology, 1994. 51(1): p. 95-
109.
[54]. A. S. Argon, Fracture of Compoites in Treatise on Materials Science and
Technology. New York: Academic Press, 1972. 1: p. 79-114.
[55]. B. Budiansky, Micromechanics. Computers & Structures, 1983. 16(1): p.
3-12.
[56]. B. Budiansky and N. A. Fleck, Compressive failure of fibre composites.
Journal of the Mechanics and Physics of Solids, 1993. 41(1): p. 183-211.
[57]. H. T. Hahn and J. G. Williams. Compression failure mechanisms in
unidirectional composites. in Composite materials: Testing and design
(seventh conference), ASTM STP. 1986.
[58]. S. Kyriakides, et al., On the Compressive Failure of Fiber-Reinforced
Composites. International Journal of Solids and Structures, 1995. 32(6-
7): p. 689-738.
[59]. T. J. Vogler and S. Kyriakides, On the initiation and growth of kink bands
in fiber composites: Part I. experiments. International Journal of Solids
and Structures, 2001. 38(15): p. 2639-2651.
[60]. T. J. Vogler, S. Y. Hsu, and S. Kyriakides, On the initiation and growth
of kink bands in fiber composites. Part II: analysis. International Journal
of Solids and Structures, 2001. 38(15): p. 2653-2682.
[61]. P. Prabhakar and A. M. Waas, Interaction between kinking and splitting
in the compressive failure of unidirectional fiber reinforced laminated
composites. Composite Structures, 2013. 98: p. 85-92.
[62]. J. Hapke, et al., Compressive failure of UD-CFRP containing void
defects: In situ SEM microanalysis. Composites Science and Technology,
2011. 71(9): p. 1242-1249.
[63]. K. Oguni and G. Ravichandran, An energy-based model of longitudinal
splitting in unidirectional fiber-reinforced composites. Journal of Applied
Mechanics-Transactions of the Asme, 2000. 67(3): p. 437-443.

Literature review Chapter 2
45
[64]. S. Pimenta, et al., A micromechanical model for kink-band formation:
Part I—Experimental study and numerical modelling. Composites
Science and Technology, 2009. 69(7): p. 948-955.
[65]. C. S. Yerramalli and A. M. Waas, The effect of fiber diameter on the
compressive strength of composites - A 3D finite element based study.
Cmes-Computer Modeling in Engineering & Sciences, 2004. 6(1): p. 1-
16.
[66]. C. S. Yerramalli, A mechanism based modeling approach to failure in
fiber reinforced composites. 2003.
[67]. C. W. Kensche, Fatigue of composites for wind turbines. International
journal of fatigue, 2006. 28(10): p. 1363-1374.
[68]. G. Belingardi and M. P. Cavatorta, Bending fatigue stiffness and strength
degradation in carbon–glass/epoxy hybrid laminates: Cross-ply vs.
angle-ply specimens. International journal of fatigue, 2006. 28(8): p. 815-
825.
[69]. T. Philippidis and A. Vassilopoulos, Fatigue of composite laminates
under off-axis loading. International Journal of fatigue, 1999. 21(3): p.
253-262.
[70]. B. Liu and L. B. Lessard, Fatigue and damage-tolerance analysis of
composite laminates: Stiffness loss, damage-modelling, and life
prediction. Composites Science and Technology, 1994. 51(1): p. 43-51.
[71]. G. Shih and L. Ebert, The effect of the fiber/matrix interface on the
flexural fatigue performance of unidirectional fiberglass composites.
Composites Science and Technology, 1987. 28(2): p. 137-161.
[72]. C. Jones, et al., Environmental fatigue of reinforced plastics. Composites,
1983. 14(3): p. 288-293.
[73]. R. Talreja, Fatigue of composite materials. 1987: Technomic.
[74]. M.-C. Lafarie-Frenot, C. Henaff-Gardin, and D. Gamby, Matrix cracking
induced by cyclic ply stresses in composite laminates. Composites science
and technology, 2001. 61(15): p. 2327-2336.

Literature review Chapter 2
46
[75]. J.-M. Berthelot, Transverse cracking and delamination in cross-ply
glass-fiber and carbon-fiber reinforced plastic laminates: static and
fatigue loading. Applied Mechanics Reviews, 2003. 56(1): p. 111-147.
[76]. S. Ogin, P. Smith, and P. Beaumont, Matrix cracking and stiffness
reduction during the fatigue of a (0/90) s GFRP laminate. Composites
Science and Technology, 1985. 22(1): p. 23-31.
[77]. M. Kashtalyan and C. Soutis, Analysis of local delaminations in
composite laminates with angle-ply matrix cracks. International Journal
of Solids and Structures, 2002. 39(6): p. 1515-1537.
[78]. D. O. Adams and M. W. Hyer, Effects of Layer Waviness on the
Compression Fatigue Performance of Thermoplastic Composite
Laminates. International Journal of Fatigue, 1994. 16(6): p. 385-391.
[79]. S. Hörrmann, et al., The effect of fiber waviness on the fatigue life of
CFRP materials. International Journal of Fatigue, 2016. 90: p. 139-147.
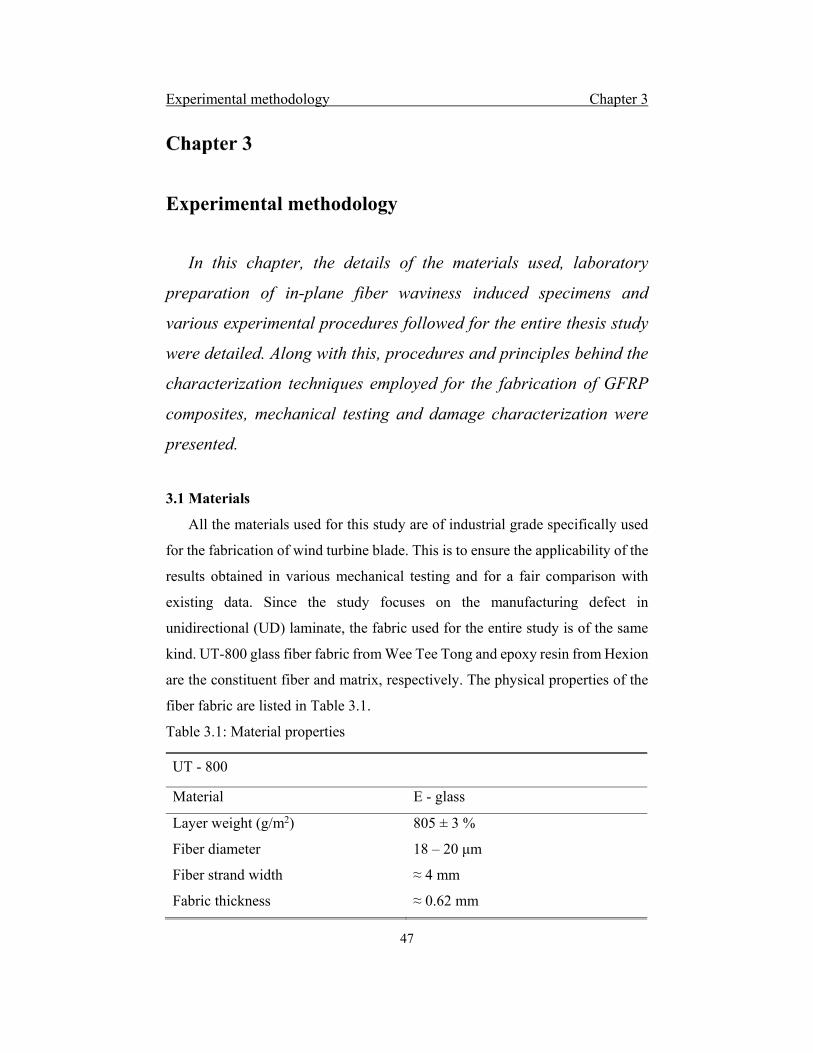
Experimental methodology Chapter 3
47
Experimental methodology
In this chapter, the details of the materials used, laboratory
preparation of in-plane fiber waviness induced specimens and
various experimental procedures followed for the entire thesis study
were detailed. Along with this, procedures and principles behind the
characterization techniques employed for the fabrication of GFRP
composites, mechanical testing and damage characterization were
presented.
3.1 Materials
All the materials used for this study are of industrial grade specifically used
for the fabrication of wind turbine blade. This is to ensure the applicability of the
results obtained in various mechanical testing and for a fair comparison with
existing data. Since the study focuses on the manufacturing defect in
unidirectional (UD) laminate, the fabric used for the entire study is of the same
kind. UT-800 glass fiber fabric from Wee Tee Tong and epoxy resin from Hexion
are the constituent fiber and matrix, respectively. The physical properties of the
fiber fabric are listed in Table 3.1.
Table 3.1: Material properties
UT - 800
Material E - glass
Layer weight (g/m2) 805 ± 3 %
Fiber diameter 18 – 20 μm
Fiber strand width ≈ 4 mm
Fabric thickness ≈ 0.62 mm

Experimental methodology Chapter 3
48
The epoxy consists of two parts, namely resin and hardener. The resin used
is EPIKOTE MGS RIMR-135 along with extra slow hardener EPIKURE RIMH-
137 as curing agent. Based on the Hexion specified mix ratio of 100:30 by weight,
were mixed together just before the resin infusion.
3.2 Vacuum assisted resin infusion molding (VARIM)
The general principle of infusion technology is to ‘suck’ resin into the stacked
fiber fabrics with the help of vacuum pressure. The vacuum pump generates a
pressure gradient at the outlet and forces the resin from inlet to outlet through the
fiber stack. As shown in Figure 3.1, initially all the fiber fabrics were placed on
the mold tool or mold plate followed by a peel ply. A sealant tape was used on
the boundaries to fix the vacuum bag. An 8-mm tube was inserted on one end for
the resin inlet and another on the opposite end for the outlet to the vacuum pump.
The resin inlet to outlet flow were opted in the fiber direction for creating a path
with least resistance to the resin flow. If the resin needs to cover longer path, the
inlet will be considered at middle and two outlets should be provided on both
ends (see Figure 3.2). The inlet and outlet line should be installed before closing
the vacuum bag. After placing all the dry materials and inlet-outlet tubing, the
vacuum bag gets sealed. Before infusing the resin, the resin line is clamped and
the vacuum bag tested for air leak. After infusion, the whole vacuum bag setup
allowed to cure at the same vacuum pressure (75mbar) and ambient condition
(23ºC, 60%RH) for the next 24h. For the resin used, a post curing of 8 to 15 hours
was recommended at an elevated temperature of 60ºC – 65ºC to achieve an
improvement in mechanical properties.
Figure 3.1: Schematic of resin infusion [1]
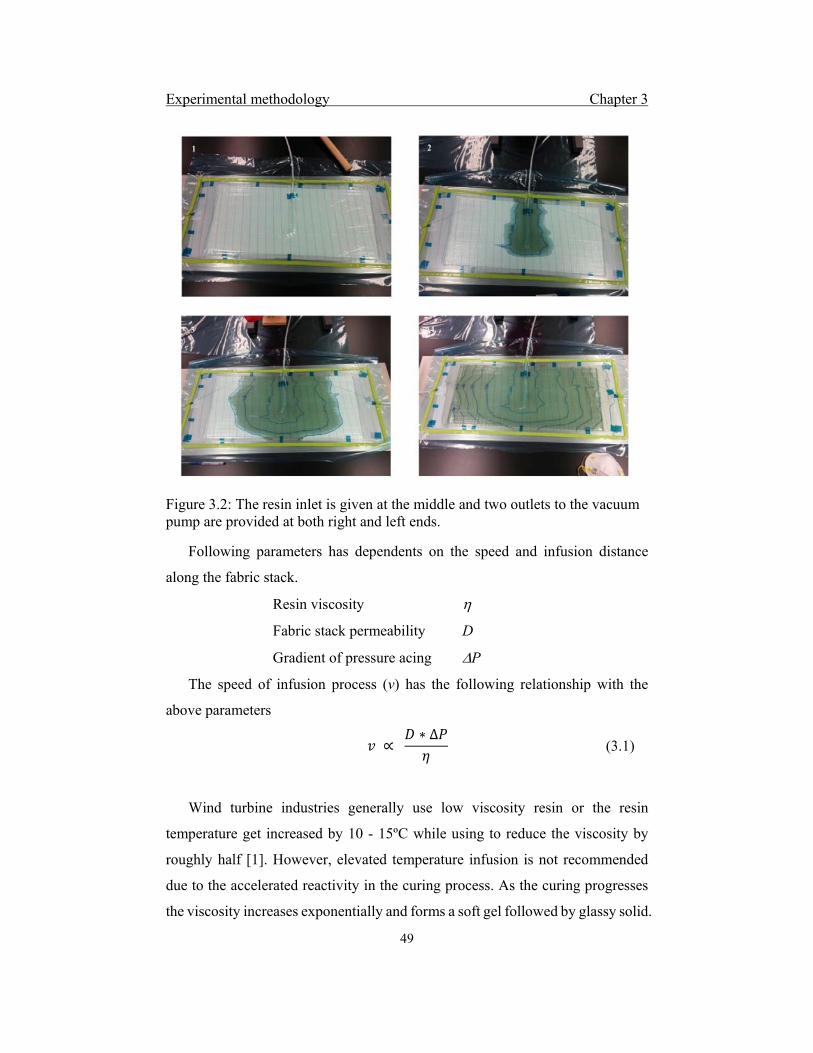
Experimental methodology Chapter 3
49
Figure 3.2: The resin inlet is given at the middle and two outlets to the vacuum pump are provided at both right and left ends.
Following parameters has dependents on the speed and infusion distance
along the fabric stack.
Resin viscosity
Fabric stack permeability D
Gradient of pressure acing P
The speed of infusion process (v) has the following relationship with the
above parameters
∝
∗ Δ (3.1)
Wind turbine industries generally use low viscosity resin or the resin
temperature get increased by 10 - 15ºC while using to reduce the viscosity by
roughly half [1]. However, elevated temperature infusion is not recommended
due to the accelerated reactivity in the curing process. As the curing progresses
the viscosity increases exponentially and forms a soft gel followed by glassy solid.

Experimental methodology Chapter 3
50
3.3 Fiber waviness
Waviness is a manufacturing defect that is generally found in composite
structures due to the imbalance in ply stacking, complicated mold structure or
due to ply drop situation [2]. Waviness can be of in-plane and out-of-plane and
can occur over a lamina, multiple laminates or throughout the thickness of the
structure, in uniform or in non-uniform format. In-plane waviness was generally
found along the stacked plane in a single lamina or in multiple laminate. Out-of-
plane waviness was found perpendicular to the fiber direction (or ply) in multiple
laminates. For the current study, a single sinusoidal wave of known severity
(similar to that found in full scale blade) was replicated on each ply to produce
an in-plane fiber wave throughout the thickness. The wave severity is defined
below. The parameters considered are wave geometry, wave position and
percentage of wavy layer present in the laminate. Adams [3] characterized the
wave geometry (Figure 3.3) with a set of parameters wave amplitude (A) and
wavelength (L) and the ratio called as wave severity.
Wave severity (3.2)
As shown in Figure 3.3, the idea was to introduce a single wave of fibers
intentionally on each lamina of the unidirectional fabric. A ply was laid over a
cylindrical tube which is held perpendicular to the fiber direction as shown in
Figure 3.3(a). The diameter of the tube (5 mm and 8 mm internal diameter) was
approximately equal to the height of waviness to be generated. The required wave
span was held on both sides of the cylindrical tube to create an out of plane fiber
waviness. From that holding position, the tube was removed and a uniform shear
load was applied normal to fiber direction to make the out of plane waviness into
in-plane waviness. After that operation, the wavy in-plane fibers were pressed
towards the table for 10 to 15 min. Same procedure was repeated for each ply to
be stacked. Thereafter, plies were stacked under vacuum bag for the curing
procedure. To get a different wave height using the same tube, the laminas
allowed to relax for one or two days. The final wave severity was measured after
the curing. To accommodate the waviness peak region at the gage portion of

Experimental methodology Chapter 3
51
various standard testing coupons, different wave severities were achieved by
changing the wave amplitude rather than changing the wavelength of the
waviness defect.
Figure 3.3: Fabrication of an in-plane fiber waviness
Figure 3.4 shows the fiber waviness on a lamina and laminate before and after
the curing. After curing, panels were visualized under optical microscopes and
wavelength and amplitude were measured at different locations over the
laminates and average fiber waviness was calculated based on the measurement.
The wavelength was always fixed in the range of 35 to 40 mm for a laminate to
be cured and based on the wave severity requirement, the amplitude varies from
0.35 to 2.6 mm. The range of average fiber wave severity achieved was 0.01,
0.025, 0.035 and 0.075. As per the experiment standard requirement, specimens
were cut using the diamond cutter and the sharp edges were grinded with grit
paper starting from 180 to 400. The specimens were cut in a way that the fiber
waviness portions are exactly in the middle of the gauge portion of the specimen.

Experimental methodology Chapter 3
52
Figure 3.4: a) Fiber waviness over a lamina before curing b) fiber waviness a laminate after curing
3.4 Fiber volume fraction
It is the ratio of total fiber volume presented per unit volume of composite.
This fraction should always be in the optimum range of 0.45 to 0.55 for better
mechanical properties. Burning off the cured resin based on ASTM D2584 [4]
standard was followed. Minimum of 5 samples were cut with approximate weight
of 5 g and 2.5 by 2.5 cm dimension. Each sample was placed in a crucible and
weighed to the nearest 1 mg. The crucible was then heated in the muffle furnace
at 600ºC until all the resin material had disappeared (see Figure 3.5). After, the
crucible was cooled back to room temperature, the final weight was measured.
From the samples taken from each panel, cured based on resin infusion technique,
an average fiber volume fraction in the range of 0.52 to 0.57 was obtained. It was
always made sure that for one set of experiments, the samples were cut from the
same panel to achieve the uniform fiber volume fraction.
Figure 3.5: Bare fiber after the resin burn out

Experimental methodology Chapter 3
53
3.5 Mechanical testing
Initially, a set of mechanical testing was performed on defect free
unidirectional samples to determine the tensile strength, compressive strength
and in-plane shear strength. These properties were used as the layup properties
for the FE model developed using Abaqus. In separate, all these tests were
conducted on the waviness induced specimens for determining the reduction in
mechanical properties. Additionally, a static flexural experiment, double
cantilever beam testing (DCB) and fatigue flexural testing were conducted on
both waviness induced specimen and defect free specimen. This was to compare
the variation in flexural, fracture and fatigue properties and failure behavior
under the influence of fiber waviness defect at different fiber wave severity level.
3.5.1 Tensile testing
Tensile tests were conducted to determine the in-plane tensile properties and
the Poisson’s ratio of the studied materials. The test follows ASTM standard
D3039 [5], which includes the method of material preparation, lay-up, the
specimen preparation, and conditioning, specimen gripping, testing environment
condition and speed of test. Ultimate tensile stress (S11), modulus of elasticity in
the test direction (E) and Poisson’s ratio (υ12) were determined from the test data.
Figure 3.6: Tensile testing, (a) With clip-on extensometer, (b) Strain gage with two element rosettes.

Experimental methodology Chapter 3
54
Specimens were cut along the fiber direction and tested on Instron 5500 with
a 50 kN load cell. Another set was tested with clip on extensometer to measure
the strain. In yet another set, two element rosette strain gages (GFCA-3-350-70
from Tokyo Sokki Kenkyujo Co. Ltd) were bonded (see Figure 3.6 (b)) to
measure both linear and lateral strain simultaneously.
Ultimate tensile stress (MPa) /
Tensile stress (MPa) /
Tensile strain /
Tensile Modulus of elasticity (GPa) ∆ /∆
Poisson’s ratio Δ /Δ
3.5.2 Compression testing
Compression experiments were conducted to determine both compressive
strength and the reduction in compressive properties due to the involvement of
waviness defect. The tests were performed as per ASTM D6641 [6] on a 100 kN
servo-hydraulic Instron 8801 machine with Zwick Hydraulic Composite
Compression Fixture (HCCF). A typical compression experiment specimen is
140 to 150 mm in length and 13 mm wide with an unsupported gage length of 13
to 20 mm. Wrinkle free specimens were prepared based on the same standard
dimensions. A width of 25 mm was considered for defect induced specimens (see
Figure 3.7 (a)) to minimize the percentage amount of discontinuous fibers due to
waviness inclusion in the coupon. Compression test fixtures were selected based
on combined shear and end loading [7, 8]. However, tab bonding should be strong
enough to avoid debonding failure due to shear loading. The combined end and
shear loads were applied hydraulically on the coupon at a constant crosshead
speed of 1 mm/min. The bonded strain gages (see Figure 3.6 (b)) on both sides
of the gage part were connected to the data logger for the compressive strain
measurement. During the test, failure progressions were captured using a high-
resolution video camera at the rate of 50 frames/sec. Tests on each types
specimen were repeated 5 times for getting statistically significant data.
Laminate compressive strength (MPa) /

Experimental methodology Chapter 3
55
where, = Maximum load (N)
= Specimen width (mm)
= Specimen thickness (mm)
Figure 3.7: a) Schematic of a typical compression test specimen, and b) the actual HCCF set up with sample.
3.5.3 Shear testing
V-Notched rail shear test method was used to determine the shear properties
of the current material. As per the ASTM standard D7078 [9], the notched
specimens were prepared as shown in Figure 3.8. A bonded strain gage with two
90º element rosette was used to measure the strain at +45 and -45 directions (see
Figure 3.8(c)). The strain gages were connected to the data logger to measure the
strain at one second interval. When the fixture loaded in tension, the clamped
rails on both sides of the specimen surface introduces a shear force. Usually the
experiment conducted on unidirectional laminates with fiber orientation either
parallel or perpendicular to the rail grip to ensure the balance and symmetry.
Since the waviness defect is symmetric about the neutral plane, it ensures the
geometric symmetry.

Experimental methodology Chapter 3
56
Figure 3.8: a) Shear test fixture b) V-notched specimen with waviness, c) Fixture with specimen during loading.
Shear Stress /
Shear Strain | | | |
where = Applied load (N)
= Cross-section area at the middle of the specimen (mm2).
, = Measured strain corresponding to applied load.
3.5.4 Flexural testing
Flexural properties of both unidirectional and waviness induced samples were
determined by three-point bending method. Specimens were cut from laminates
with 6 layers of unidirectional fabrics. At least 5 sets of samples were tested in
the flatwise configuration. Each specimen with average thickness 3.72 mm, width
20 mm and span length of 120 mm. A standard span to thickness ratio of 32:1
was chosen at the surface of the specimen due to bending moment. The Figure
3.9 shows the three-point bending fixture with specimen.

Experimental methodology Chapter 3
57
Figure 3.9: Three-point bending fixture with specimen
Maximum flexural stress (MPa)
whereas = Maximum load (N)
= Span length (mm)
= Specimen width (mm)
= Thickness (mm)
3.5.5 Double cantilever beam (DCB) experiment
Double cantilever beam is the most common configuration to determine
mode-I and the critical strain energy release rate. Davidson [10] analyzed that the
growth of crack front in a DCB specimen was curved and in the form of a thumb
nail shape. The mode separation energy release rate required for the delamination
growth is equal to the resistance offered by the material for the crack to grow.
Double cantilever beam specimens were prepared with and without fiber
waviness defect. ASTM standard D5528 [11] was recommended to characterize
the fracture properties of double cantilever beam specimens. Before resin
infusion, a Teflon film of thickness 20 μm was inserted exactly at the middle of
the layup for the initial crack.

Experimental methodology Chapter 3
58
Figure 3.10: Specimen geometry, the bottom pictures show the inside waviness portion after the crack initiation front (Shown with red line).
For the current investigation, a set of four unidirectional samples with
waviness defect (W6, W8) through the thickness and without waviness defect
(U6, U8) were tested. The defect free set of samples were fabricated and tested
for the comparison purpose. The geometry and the fiber wave severity (Ws)
details were mentioned in Table 3.2. As shown in Figure 3.10, the W6 and W8
samples differ in their crack initiation point. In W6, the crack initiation point or
the end of Teflon slit was situated on the fiber waviness area, whereas in W8
samples the crack initiation point was ahead of fiber waviness area. As per ASTM
D5528, the initial crack length to the thickness ratio ( ⁄ ) was selected to be
between 8 and 20 to reduce the transverse shear deformation effect for the
fracture toughness calculation. Currently, for W6 and W8 specimens it was 8.5
and 10.6 respectively.
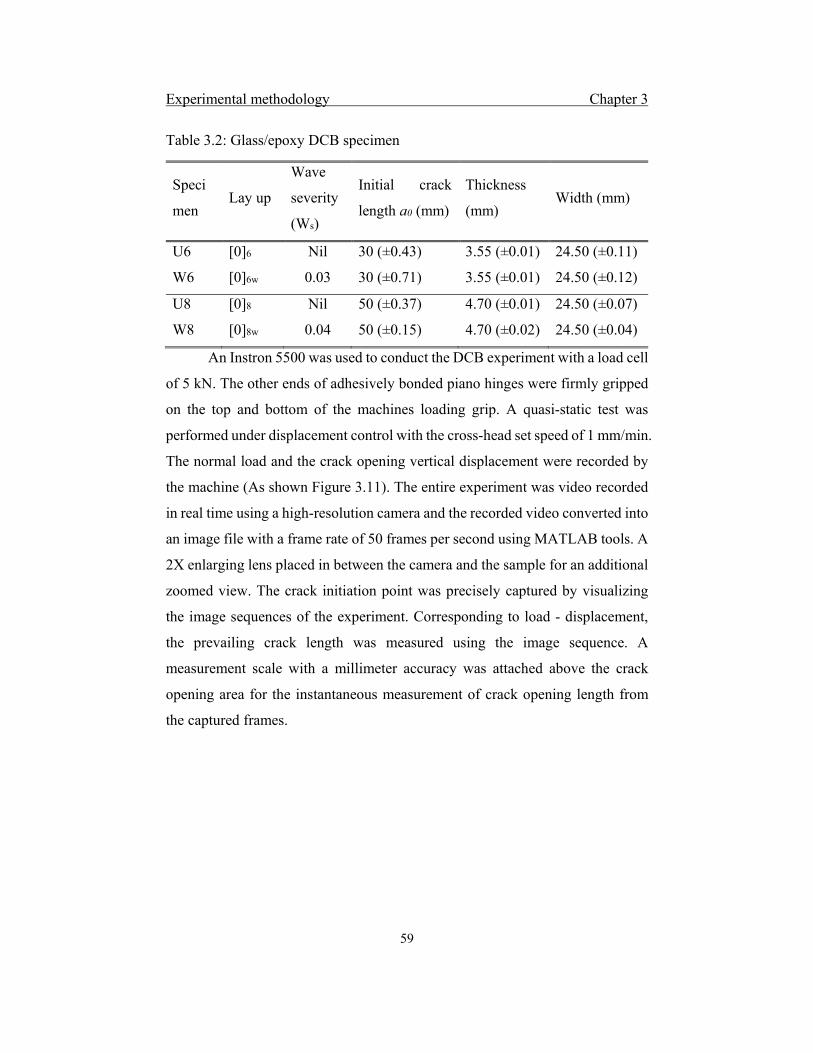
Experimental methodology Chapter 3
59
Table 3.2: Glass/epoxy DCB specimen
Speci
men Lay up
Wave
severity
(Ws)
Initial crack
length a0 (mm)
Thickness
(mm) Width (mm)
U6 [0]6 Nil 30 (±0.43) 3.55 (±0.01) 24.50 (±0.11)
W6 [0]6w 0.03 30 (±0.71) 3.55 (±0.01) 24.50 (±0.12)
U8 [0]8 Nil 50 (±0.37) 4.70 (±0.01) 24.50 (±0.07)
W8 [0]8w 0.04 50 (±0.15) 4.70 (±0.02) 24.50 (±0.04)
An Instron 5500 was used to conduct the DCB experiment with a load cell
of 5 kN. The other ends of adhesively bonded piano hinges were firmly gripped
on the top and bottom of the machines loading grip. A quasi-static test was
performed under displacement control with the cross-head set speed of 1 mm/min.
The normal load and the crack opening vertical displacement were recorded by
the machine (As shown Figure 3.11). The entire experiment was video recorded
in real time using a high-resolution camera and the recorded video converted into
an image file with a frame rate of 50 frames per second using MATLAB tools. A
2X enlarging lens placed in between the camera and the sample for an additional
zoomed view. The crack initiation point was precisely captured by visualizing
the image sequences of the experiment. Corresponding to load - displacement,
the prevailing crack length was measured using the image sequence. A
measurement scale with a millimeter accuracy was attached above the crack
opening area for the instantaneous measurement of crack opening length from
the captured frames.
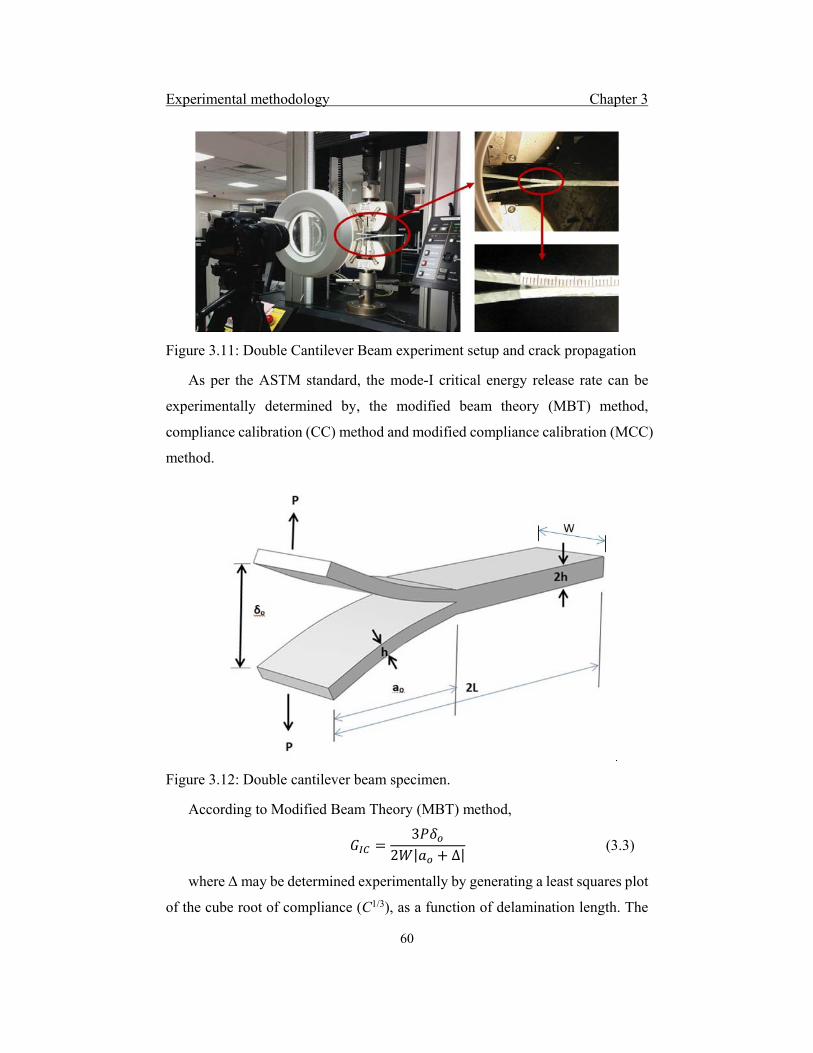
Experimental methodology Chapter 3
60
Figure 3.11: Double Cantilever Beam experiment setup and crack propagation
As per the ASTM standard, the mode-I critical energy release rate can be
experimentally determined by, the modified beam theory (MBT) method,
compliance calibration (CC) method and modified compliance calibration (MCC)
method.
Figure 3.12: Double cantilever beam specimen.
According to Modified Beam Theory (MBT) method,
32 | ∆|
(3.3)
where Δ may be determined experimentally by generating a least squares plot
of the cube root of compliance (C1/3), as a function of delamination length. The

Experimental methodology Chapter 3
61
compliance (C), is the ratio of the load point displacement to the applied load
(δ/P).
as per Compliance Calibration (CC) method,
2
(3.4)
where ‘n’ is the slope of the plot drawn log versuslog , quantities
with subscript ‘i’ denotes the incremental values of load (P), load point
displacement (δ) during regular intervals.
In Modified Compliance Calibration (MCC) method
3 ⁄
4 (3.5)
where A1 is the slope of least square plot, normalized delamination growth
versus cube root of the compliance ⁄ available from earlier method.
3.5.6 Fatigue flexural analysis
The wind turbine blades are subjected to long term fluctuating load and a
fatigue in the structure occurs when it is subjected to cyclic stresses. Hence it is
mandatory to study the resistance of defect containing specimens subjected to
fatigue loading. A dynamic reversible flexural load was applied on both defect-
free and wave defect containing unidirectional specimens to determine the
fatigue properties. A fluctuating three-point bending analysis was carried out
with stress ratios R = 0.1 and 0.5 at frequency 3 Hz, where R = Min. load/Max.
load. The tests were carried out in MTS810 with a load cell 10 kN under load
control and constant amplitude in the sinusoidal waveform (the Figure 3.13).
Rather than the expected fatigue strength reduction due to the waviness defect,
the focus was on the different failure modes occurring on the tension and
compression side. Three sets of specimens were tested at each stress level.
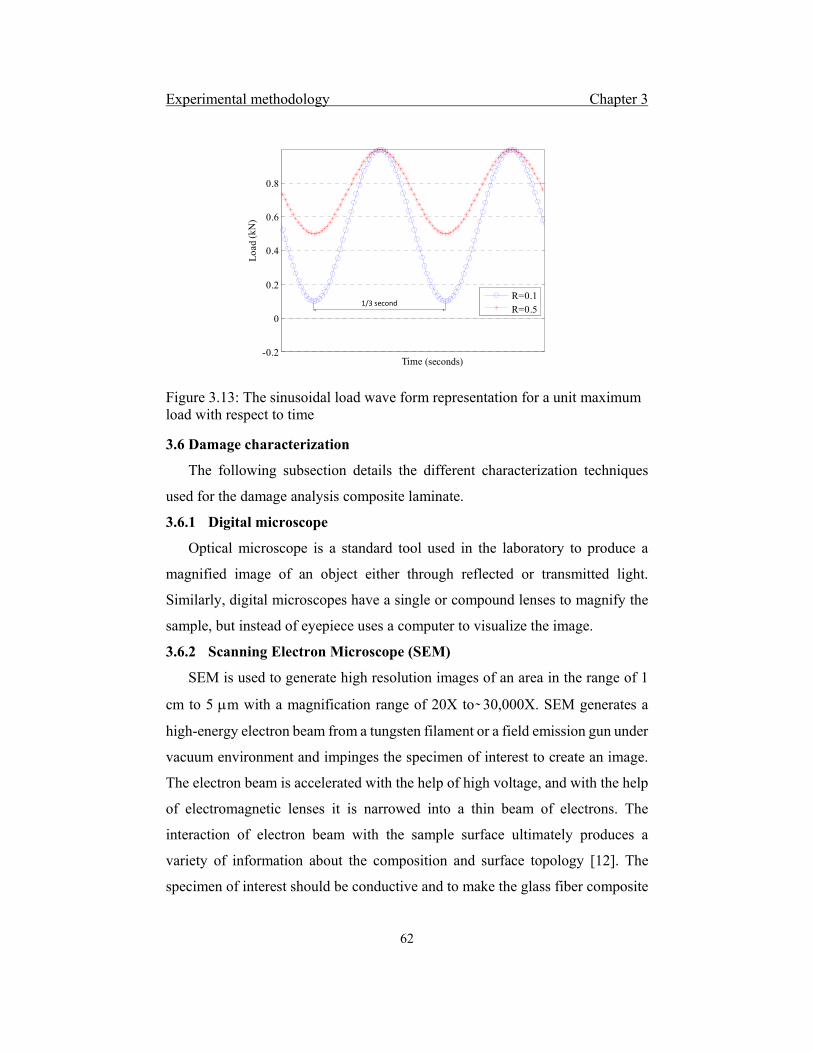
Experimental methodology Chapter 3
62
Figure 3.13: The sinusoidal load wave form representation for a unit maximum load with respect to time
3.6 Damage characterization
The following subsection details the different characterization techniques
used for the damage analysis composite laminate.
3.6.1 Digital microscope
Optical microscope is a standard tool used in the laboratory to produce a
magnified image of an object either through reflected or transmitted light.
Similarly, digital microscopes have a single or compound lenses to magnify the
sample, but instead of eyepiece uses a computer to visualize the image.
3.6.2 Scanning Electron Microscope (SEM)
SEM is used to generate high resolution images of an area in the range of 1
cm to 5 m with a magnification range of 20X to 30,000X. SEM generates a
high-energy electron beam from a tungsten filament or a field emission gun under
vacuum environment and impinges the specimen of interest to create an image.
The electron beam is accelerated with the help of high voltage, and with the help
of electromagnetic lenses it is narrowed into a thin beam of electrons. The
interaction of electron beam with the sample surface ultimately produces a
variety of information about the composition and surface topology [12]. The
specimen of interest should be conductive and to make the glass fiber composite
-0.2
0
0.2
0.4
0.6
0.8
Time
Loa
d
R=0.1R=0.5
(kN
)
(seconds)
1/3 second

Experimental methodology Chapter 3
63
conductive, a thin layer of carbon is sputter coated on the specimen. For the
present study, JEOL JSM-5600LV SEM was used for the fractography analysis.
3.6.3 Laser Shearography
This is a non-destructive test method used to obtain the subsurface features
like voids, crack and delamination. The specimens which were undamaged after
completing a million cycles of stress reversals were observed under the laser
shearography for the subsurface damage.
A laser light is illuminated over the surface under investigation. A speckle
pattern will be generated by the component surface and this pattern will be
recorded using a digital camera. Then after, a mechanical or thermal excitation
was given to the component surface that will lead to the change in speckle pattern
due to stress deformation. The new speckle pattern will get subtracted from the
old pattern and a shearographic fringe pattern will be displayed. This final black
and white fringe displays all the information about the relative deformation
before and after the excitation.
3.6.4 Computed Tomography (CT)
Among the different non-destructive techniques, CT technology is proven to
be the best technique to characterize the damage of the materials. The set up
consists of an X-ray source, detector, a multi axial sample holder, a computer
system to store and reconstruct the captured image and to display the results.
The object to be scanned is fixed in between the detector and the gun. The
X-rays emitted by the gun passes through the object before received by the
detector panel. The scanning is repeated for each increment of rotation about the
third axis until the rotation angle reaches 360º. To get higher spatial resolution,
the object should be positioned as closer to the target with a smaller increment of
rotation. Yxlon X-ray CT system was used for the scan operated at 55 kV and 46
μA. The increment of rotation was 0.5º, therefore a total projection of 720 were
made over a 360º scan.

Experimental methodology Chapter 3
64
3.7 Summary
In this chapter, the particulars of materials used for the specimen preparation
and the detailed procedure of composite laminate fabrication with fiber waviness
inclusions were discussed. Various mechanical testing procedures followed for
the evaluation of wavy fiber specimens were explained. The techniques used for
the damage characterizations were discussed.
References
[1]. WE Handbook- 5 - Gurit Composite Materials for Wind Turbine Blades.
[2]. T. Riddle, D. Cairns, and J. Nelson. Characterization of manufacturing
defects common to composite wind turbine blades: Flaw
characterization. in 52nd AIAA/ASME/ASCE/AHS/ASC Structures,
Structural Dynamics and Materials Conference 19th AIAA/ASME/AHS
Adaptive Structures Conference 13t. 2011: p.1758.
[3]. D. O. Adams and M. W. Hyer, Effects of Layer Waviness on the
Compression Strength of Thermoplastic Composite Laminates. Journal of
Reinforced Plastics and Composites, 1993. 12(4): p. 414-429.
[4]. ASTM, D 2584,“, in Standard Test Method for Ignition Loss of Cured
Reinforced Resins,” American Society for Testing and Materials, West
Conshohocken, Pa. 2008.
[5]. ASTM, D3039/D3039M-00, in Standard test method for tensile
properties of polymer matrix composite materials. 2000.
[6]. ASTM, D6641/D6641M, 2009”, in Standard Test Method for
Compressive Properties of Polymer Matrix Composite Materials Using a
Combined Loading Compression (CLC) Test Fixture.” West
Conshohoncken, PA. 2009.
[7]. T. J. Vogler and S. Kyriakides, On the initiation and growth of kink bands
in fiber composites: Part I. experiments. International Journal of Solids
and Structures, 2001. 38(15): p. 2639-2651.

Experimental methodology Chapter 3
65
[8]. T. J. Vogler, S. Y. Hsu, and S. Kyriakides, On the initiation and growth
of kink bands in fiber composites. Part II: analysis. International Journal
of Solids and Structures, 2001. 38(15): p. 2653-2682.
[9]. ASTM, D7078, in D7078M-Standard Test Method for Shear Properties
of Composite Materials by V-Notched Rail Shear Method. 2005.
[10]. B. D. Davidson, An Analytical Investigation of Delamination Front
Curvature in Double Cantilever Beam Specimens. Journal of Composite
Materials, 1990. 24(11): p. 1124-1137.
[11]. ASTM, D5528-94a, 2001, in Test Method for Mode I Interlaminar
Fracture Toughness of Unidirectional Fiber-Reinforced Polymer.
[12]. J. Goldstein, et al., Scanning electron microscopy and X-ray
microanalysis: a text for biologists, materials scientists, and geologists.
2012: Springer Science & Business Media, New York, NY 10013, USA.

Experimental methodology Chapter 3
66

Compression and double cantilever beam experiment Chapter 4
67
Compression and double cantilever beam experiment
In this chapter, coupon level unidirectional GFRP composites
with waviness defect were tested under compression. The results were
compared with defect free samples. Further, the effect of waviness
defect on mode – I fracture energy and delamination onset were also
studied using a double cantilever beam (DCB) setup.
4.1 Introduction
The backbone of any structure is their reinforcement part, similarly for wind
turbine blade it is the spar-cap. Hence, the defect that affects the spar-cap will
deteriorate the life span of whole blade structure. The spar-cap is made up of
unidirectional fibers for getting high strength and stiffness. The blades were
designed to undergo extreme wind load in flap-wise and edge wise direction.
From the earlier research of a concave up wave in bending analysis, a 37%
reduction in bending strength was noted [1]. Therefore, in the current work,
coupon level bending tests were conducted on unidirectional specimens with in-
plane fiber waviness defect. The different failure modes were also analyzed.
From the design perspective, compressive strength is one among the key
property for structural components made up of composite materials [2]. Though
unidirectional laminates have good tensile strength and stiffness along the fiber
direction, they are weak in compression. Under the compression loading
condition, the fiber waviness defect shows a significant reduction in compressive
strength and stiffness of the composite laminates. Further, double cantilever
beam tests were performed on the wave induced specimen to investigate the
effect.

Compression and double cantilever beam experiment Chapter 4
68
4.2 Compression experiment
Various studies on multiple layer waviness revealed that it caused significant
reduction in mechanical properties [3] and the impact was severe in
unidirectional laminates [4-8], in which a huge deterioration in the compressive
strength of composite laminates was observed [5, 8-11]. The compressive
strength decreased steadily with increase in both wave severity (Ws) and number
of waviness containing 0° plies [7]. Adams et al. [3] found a reduction of 35% in
strength when 0° plies contained 33% fiber waviness defect. Waviness or
wrinkles can arise in any part of the structure due to excessive reinforcement
during ply stacking on mold structure or due to ply drop situation.
A full-scale failure analysis of blades is expensive and testing of spar cap
with actual thickness of around 50 to 60 mm, is extremely difficult. In usual
practice, the test is performed on coupons with thicknesses between 2 to 6 mm
with fiber wave severity similar to that found in blade structure. The parameters
to be considered are wave geometry, wave position and percentage of wavy layer
present in the laminate.
4.2.1 Experimental procedure
As discussed in chapter 3, different wave severities were achieved by
changing the wave amplitude rather than changing the wavelength of the defect
(due to size limitations for testing and analysis). The [0]6 layer panels were
prepared with different wave severity levels using unidirectional glass fabrics.
Each layer has an average thickness of 0.62 mm. Compression tests were
conducted as per ASTM D6641 standards on a 100 kN servo-hydraulic Instron
8801 machine with Zwick Hydraulic Composite Compression Fixture (HCCF).
4.2.2 Results and Discussion
As listed in Table 4.1 and shown in Figure 4.1, the mean failure strength of
the composites significantly decreases with increase in fiber wave severity. For
instance, with a severity of 0.075, a 75% drop in strength is noted. Joyce and
Moon [12] have reported a similar but linear trend of decreasing compressive
strength with increasing (in-plane) fiber waviness severity. This has been

Compression and double cantilever beam experiment Chapter 4
69
attributed to the formation of kink bands at the fiber misorientation sites in the
wavy regions leading to catastrophic failure. In the current work, though a
catastrophic failure is observed with defect-free samples, with waviness defect,
the failure is not catastrophic. The Figure 4.2 represents the stress strain behavior
in the compression experiment.
Figure 4.1: Drop in compressive strength with wave severity
Figure 4.2: Stress-Strain curve of sample A0 and A3.

Compression and double cantilever beam experiment Chapter 4
70
Table 4.1: Compression test results of composites with and without waviness
defect.
Sample Wave severity
(Ws) Mean failure
strength (MPa) Standard
Deviation (MPa) A0 (unidirectional) 0 614 19.61
A1 0.01 479 34.5 A2 0.025 303 12.25 A3 0.035 222 13.16 A4 0.075 158 14.40
4.2.3 Mechanisms of failure
Unidirectional laminates without waviness defect: - Optical and SEM
observations of the failed samples reveal the presence of angled fracture plane
due to shear failure (Figure 4.3). Fiber strand debonding, micro-buckling and
matrix cracking were also clearly visible in the gage area. These observations
follow the traditional and expected mode of failure [13]. Fiber micro-buckling is
a resultant of shear instability process that occurs at higher strains for the matrix
to plastically yield. This results in the formation of kinks in a localized region
and ultimately leads to the formation of fiber kink-bands. However, it is
important to note that kinking stresses are very sensitive to fiber misalignment.
Even a misalignment angle in the range of 0.8-2.3º is enough to cause kinking
[14]. Moreover, with misaligned fibers, kinking stresses are reportedly 25% of
the elastic micro-buckling stresses of composites.
Figure 4.3: Catastrophic failure of waviness-free specimen under compressive loading conditions.

Compression and double cantilever beam experiment Chapter 4
71
Unidirectional laminates with waviness defect: - As compared to defect free
specimens, the failure progression of the wavy specimens was slow and gradual
(particularly, A4 with a wave severity of 0.075).Figure 4.4 Figure 4.3shows a few
selected snapshots of crack initiation and progression from the video of the test
captured with a high-speed camera operated at a frame rate of 50 frames/s. As
discussed earlier, axial compression failure of unidirectional composites occurs
by plastic kinking in the presence of fiber misalignment sites along with plastic
shear deformation in the matrix. As shown in Figure 4.5, failure initiated with a
visible fiber kinking followed by an inclined shear crack across the fiber direction
on the wavy area, ultimately resulting in fiber strand splitting. Previously, it has
been noted that glass fibers fail in compression by longitudinal splitting, when
the uniaxial strain in the composite equals the intrinsic crushing strain of the
fibers [15]. Nevertheless, the gradual kink-band formation, and the resultant fiber
kinking failure mode are more evident at higher fiber wave severities (A3 and A4
samples). For example, Figure 4.5 shows the failure progression in A3 with wave
severity 0.035.
Figure 4.4: Sequence of crack propagation before complete failure in sample A1.

Compression and double cantilever beam experiment Chapter 4
72
Figure 4.5: (a) Fiber kinking and fiber splitting along the wavy fiber direction in sample A3, b) Magnified fiber kinking view, (c) Kink band view at the free edge of the width, d) Fiber breakage.
A clear transition in the failure mode is seen in composites with and without
waviness defect. Also, the crushing phenomenon during the failure is absent with
higher fiber wave severity. However, audible crushing and/or knocking sounds
are heard in composites with a wave severity 0.025 (Sample A2, misalignment
angle ~5.7º) and below. Thus, a wave severity of 0.025 seems to be the transition
point in failure mode. The width of the kink band increases with increase in wave
severity. The kink band width changed from ~ 0.1-0.12 mm in A0 sample to ~1.5-
2 mm in A4 sample.
4.2 Double Cantilever Beam (DCB) experiment
DCB is the most popular specimen configuration to determine mode-I and
critical strain energy release rates. Davidson [16] analyzed that the growth of
crack front in a DCB specimen was curved and in the form of a thumb nail shape.
It is believed that the mode separation energy release rate required for the
delamination growth is equal to the resistance offered by the material to
delamination to growth. It was found from various studies that a waviness defect
can easily be induced in unidirectional laminates during manufacturing, and it

Compression and double cantilever beam experiment Chapter 4
73
causes a reduction in strength and stiffness of the laminates [1, 12, 17]. Hence,
the effect of this defect on the delamination resistance and the fracture toughness
when compared with the unidirectional laminates should be considered and
answered.
The specimen preparation and experiment procedures were discussed in
Chapter 3. A set of four unidirectional samples with through thickness waviness
defect (W6 - with 6 layers, W8 – with 8 layers) and without waviness defect (U6
– with 6 layers, U8 – with 8 layers) were tested. In W6, the crack initiation point
or the end of Teflon slit was situated on the fiber waviness area, whereas in W8
samples, the crack initiation point was ahead of fiber waviness area. As per
ASTM D5528 [18], the initial crack length to the thickness ratio ( ⁄ ) was
selected to be between 8 and 20 to reduce the transverse shear deformation effect
for the fracture toughness calculation.
4.2.1 Factors affecting on DCB test
The waviness defect is included in each layer of the lamina. The type of
defect considered was in-plane waviness and that would not affect the symmetric
nature of the layup about the mid-plane. Hence, the stiffness of the two arms of
defect containing specimens should be the same to ensure the perfect mode - I
design condition. Apparently, the fiber waviness induced samples were not
orthotropic in nature as compared to the unidirectional specimens. In the laminate
constituent relations, the extension – bending coupling stiffness ([B]) would be
absent due to the symmetry about the mid-plane, thereby eliminating the effect
of residual thermal stresses while curing. But there were a few non-zero terms
present at the extensional and bending stiffness ([A] and [D]) matrices.
The delamination curvature due to the longitudinal - transverse bending
coupling was influenced by the term D , introduced by Davidson [19], where
D D D D⁄ and D ’s were the components of bending stiffness matrix
[D]. Davidson found that, with an increase in D ratio, the curvature of the
delamination front increases. It was suggested that the stacking sequence of the
laminate should have been designed with = 0.25 as upper limit [19] for a
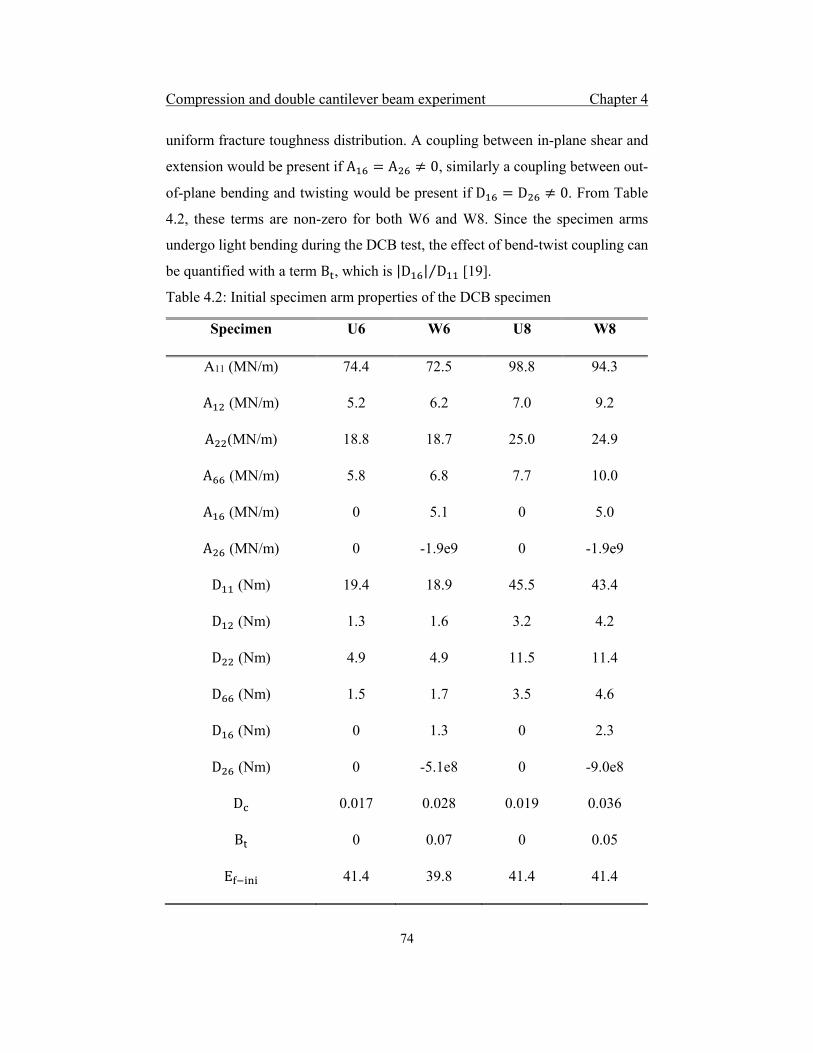
Compression and double cantilever beam experiment Chapter 4
74
uniform fracture toughness distribution. A coupling between in-plane shear and
extension would be present if A A 0, similarly a coupling between out-
of-plane bending and twisting would be present if D D 0. From Table
4.2, these terms are non-zero for both W6 and W8. Since the specimen arms
undergo light bending during the DCB test, the effect of bend-twist coupling can
be quantified with a term B , which is |D | D⁄ [19].
Table 4.2: Initial specimen arm properties of the DCB specimen
Specimen U6 W6 U8 W8
A11 (MN/m) 74.4 72.5 98.8 94.3
A (MN/m) 5.2 6.2 7.0 9.2
A (MN/m) 18.8 18.7 25.0 24.9
A (MN/m) 5.8 6.8 7.7 10.0
A (MN/m) 0 5.1 0 5.0
A (MN/m) 0 -1.9e9 0 -1.9e9
D (Nm) 19.4 18.9 45.5 43.4
D (Nm) 1.3 1.6 3.2 4.2
D (Nm) 4.9 4.9 11.5 11.4
D (Nm) 1.5 1.7 3.5 4.6
D (Nm) 0 1.3 0 2.3
D (Nm) 0 -5.1e8 0 -9.0e8
D 0.017 0.028 0.019 0.036
B 0 0.07 0 0.05
E 41.4 39.8 41.4 41.4

Compression and double cantilever beam experiment Chapter 4
75
Load versus vertical opening displacement was recorded during the test by
the machine. The video recording was also synchronized with the load
displacement data for the crack length measurement from the frames. The test
was continued until a crack extension length of approximately 20 to 30 mm. DCB
tests were performed on all the samples with fiber waviness defects and without
waviness defects having two different thicknesses and crack opening positions.
4.2.2 Results and Discussion
Load vs Displacement behavior
The typical load displacement curves of all the four different specimens were
shown in Figure 4.6 and Figure 4.7. In all the test samples, the response was
linear up to the crack initiation point or so-called point of non-linearity (NL). As
per the test standards, the point of NL is not visually observable. Hence, the
fracture energy measured for a visually observable crack is higher. It was
assumed that the crack initiated at the middle of the insert and after the initiation,
slope of the curve decreases. Along with crack propagation, the presence
of fiber bridge dominates in the delamination area. Initially the fiber bridge has
strong hold compared to crack propagation, hence the crack grows very slowly
and the crack opening load also increases. In the second stage, the fiber bridging
and crack opening have equal hold in the delamination area, and the load come
into a saturation stage. In the final stage, the crack starts growing very fast and
the load drops simultaneously. A sudden drop in the load-displacement curve can
be observed due to unstable growth of the delamination crack front. The slope of
the NL part depends on the fiber bridging strength and the stiffness of the
specimen arm. Among them, the stiffness of the specimen arm depends on the
fiber orientation. An entangled fiber network was present along the crack growth
and this bridging offers resistance to the delamination growth.
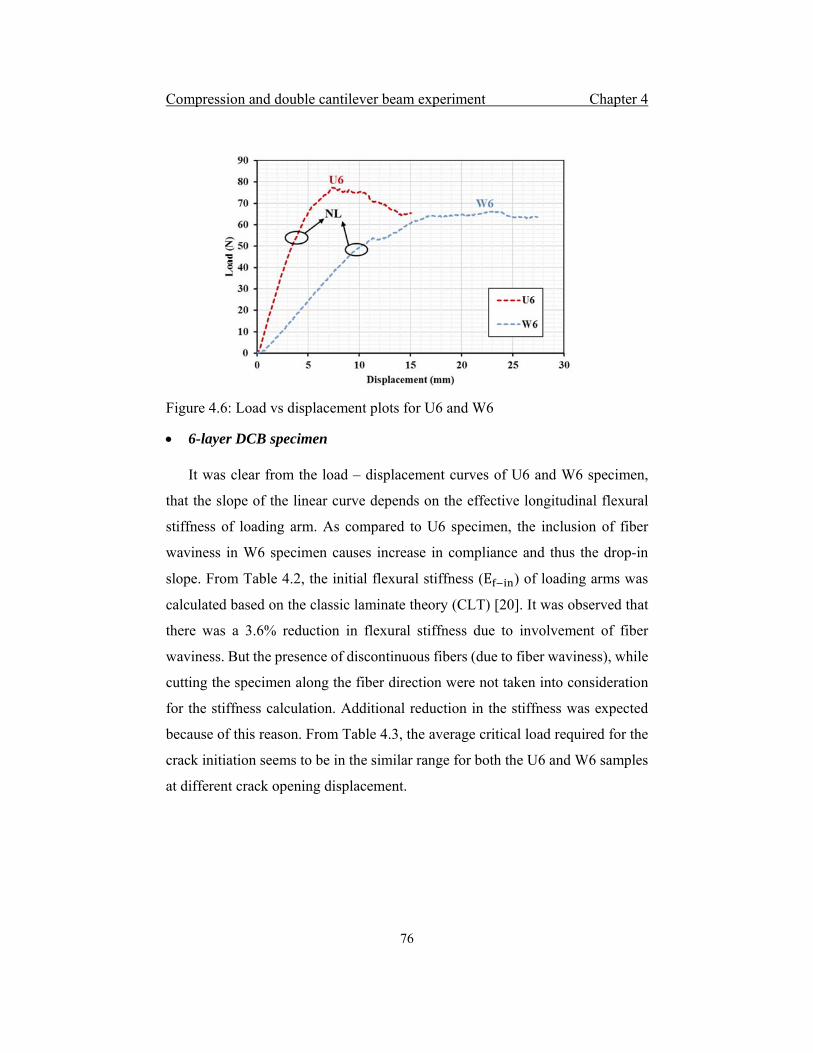
Compression and double cantilever beam experiment Chapter 4
76
Figure 4.6: Load vs displacement plots for U6 and W6
6-layer DCB specimen
It was clear from the load – displacement curves of U6 and W6 specimen,
that the slope of the linear curve depends on the effective longitudinal flexural
stiffness of loading arm. As compared to U6 specimen, the inclusion of fiber
waviness in W6 specimen causes increase in compliance and thus the drop-in
slope. From Table 4.2, the initial flexural stiffness (E ) of loading arms was
calculated based on the classic laminate theory (CLT) [20]. It was observed that
there was a 3.6% reduction in flexural stiffness due to involvement of fiber
waviness. But the presence of discontinuous fibers (due to fiber waviness), while
cutting the specimen along the fiber direction were not taken into consideration
for the stiffness calculation. Additional reduction in the stiffness was expected
because of this reason. From Table 4.3, the average critical load required for the
crack initiation seems to be in the similar range for both the U6 and W6 samples
at different crack opening displacement.

Compression and double cantilever beam experiment Chapter 4
77
Figure 4.7: Load vs displacement plots for U8 and W8
8-layer DCB specimen
For the W8 specimen, the waviness defect was not present in the initial
loading arm, hence there was no stiffness drop in the linear portion of the curve.
The average critical load required for the crack initiation was almost similar.
After the crack initiation, as compared to U8, a slight drop in the load rate was
observed for W8 specimen.
Table 4.3: Average values of load, displacement and the delamination initiation toughness.
Specimen Initial crack length ( ) (mm)
Point of Non-linearity (NL) Maximum load (N)
Fracture toughness based on CC method
(kJ/m2) Load (N) Displacement
(mm)
U6 30
53.1 3.67 77.1 1.10
W6 49.7 10.1 65.1 0.84
U8 50
56.8 18.3 90.8 1.21
W8 58.0 21.1 92.2 0.84
Mode-I fracture toughness and R-curve (Resistance curve)
The delamination resistance measured as fracture toughness (kJ/m2). As
mentioned in Chapter 3, the fracture toughness values were calculated based on
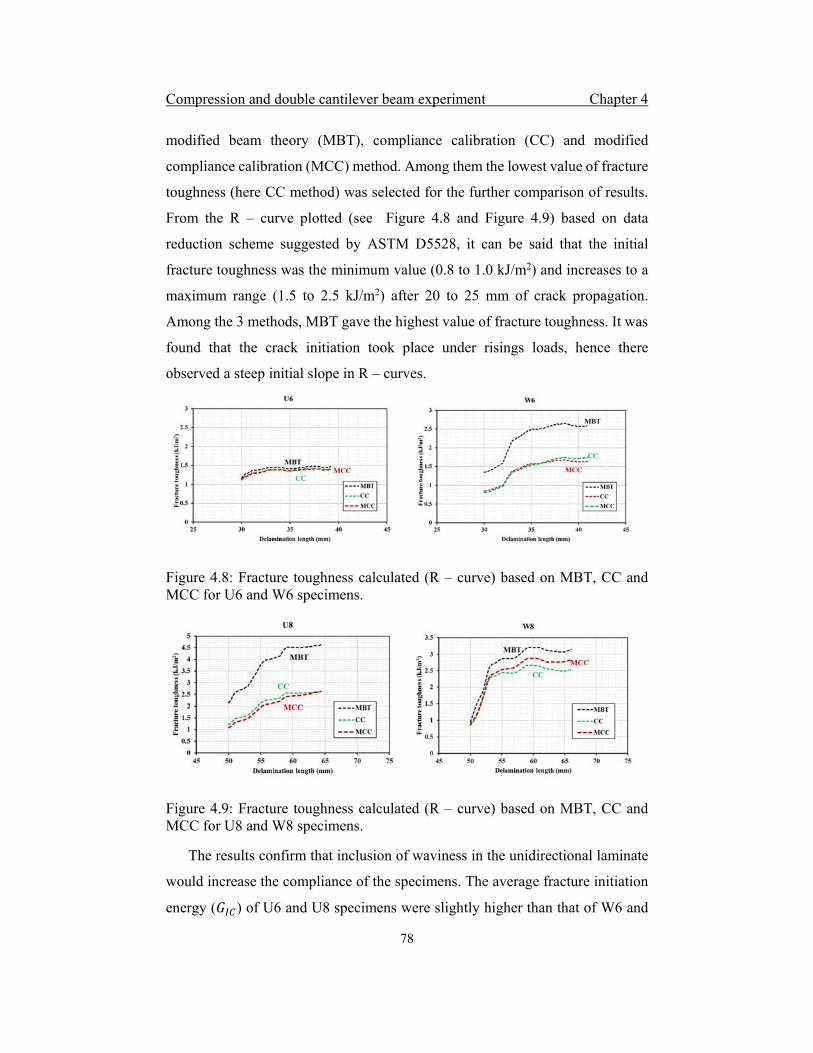
Compression and double cantilever beam experiment Chapter 4
78
modified beam theory (MBT), compliance calibration (CC) and modified
compliance calibration (MCC) method. Among them the lowest value of fracture
toughness (here CC method) was selected for the further comparison of results.
From the R – curve plotted (see Figure 4.8 and Figure 4.9) based on data
reduction scheme suggested by ASTM D5528, it can be said that the initial
fracture toughness was the minimum value (0.8 to 1.0 kJ/m2) and increases to a
maximum range (1.5 to 2.5 kJ/m2) after 20 to 25 mm of crack propagation.
Among the 3 methods, MBT gave the highest value of fracture toughness. It was
found that the crack initiation took place under risings loads, hence there
observed a steep initial slope in R – curves.
Figure 4.8: Fracture toughness calculated (R – curve) based on MBT, CC and MCC for U6 and W6 specimens.
Figure 4.9: Fracture toughness calculated (R – curve) based on MBT, CC and MCC for U8 and W8 specimens.
The results confirm that inclusion of waviness in the unidirectional laminate
would increase the compliance of the specimens. The average fracture initiation
energy ( ) of U6 and U8 specimens were slightly higher than that of W6 and

Compression and double cantilever beam experiment Chapter 4
79
W8 specimens. The resistance to delamination offered by the W6 specimens was
higher due to the increased compliance and the orientation of fibers (see Figure
4.10). At the waviness region, fiber orientation involved in the crack opening
plane was greater than zero. Also, the crack growth along the waviness region
was slow compared to the UD specimens.
For the W8 specimen, the wave region starts just after the crack initiation,
thus a sudden increase of resistance to delamination was observed (see Figure
4.11 for W8 specimen), once the crack reaches the fiber waviness peak.
Figure 4.10: R – curves of U6 and W6 DCB specimens
Figure 4.11: R – curves of U8 and W8 DCB specimens

Compression and double cantilever beam experiment Chapter 4
80
The W6 samples were tested to understand the influence of fiber waviness on
crack initiation, initial and final fracture toughness (mode-1), whereas W8
samples were tested to understand the influence of waviness during crack
propagation. Laminates with 0º orientation has the least GIC propagation value
and highest for 90º orientation [21]. From the Figure 4.10 and Figure 4.11 it can
be seen that GIC propagation value for wavy specimen increases due to fiber
orientation.
Delamination shape and crack propagation rate
Unidirectional samples generally follow a curved delamination front
throughout the delaminating interfaces. The shape of the delamination front has
greater dependence on the non-dimensional term and is the reason behind the
anticlastic curvature shape across the specimen width. The DCB specimen has
the highest energy release rate (ERR) in the middle and was lowest at the edges
[16]. The difference in the fracture toughness values at the middle and edges can
be correlated with the number. When compared to the unidirectional
specimens, the current fiber waviness induced specimens have 60% to 90%
higher value at the defect containing region. Hence, the maximum to
minimum fracture energy distribution along crack front for wave induced
specimen will vary accordingly.
The skewness of the ERR distribution across the width was dependent on the
non-dimensional ratio: [19]. This value shows the involvement of bend-twist
coupling on the specimen. The value was non-zero for both waviness induced
specimens. Over the first half of the fiber wave, the crack front dominates at the
top edge but over the second half of the wave, the bottom edge of the crack front
was dominant. This was due to the involvement of an equal amount of twist on
both the loading arms at the wave induced region. This is responsible for the non-
uniform crack front path along the delamination path (see Figure 4.12). In Figure
4.13(b & c), the obtained crack front was clearly visible. Due to the variation
observed in the crack opening in the experiment, all the crack lengths were
measured from the top edge of the specimen (W6, W8). That means the measured

Compression and double cantilever beam experiment Chapter 4
81
rate of crack front till the peak of the waviness would be fast as compared to the
rest of the opening speed, and this statement was confirmed from the graph shown
in the Figure 4.14 and Figure 4.15. When the crack passes through the waviness
peak, compared to the top edge, an abnormal crack growth was observed for the
bottom edge in the wavy region.
Figure 4.12: Shape of delamination front at different stages of W8 specimen. a) Crack initiation point, b) Initial shape, c) Shape before reaching the peak of fiber waviness, d) Shape after the wave crest, e) Regaining the initial shape
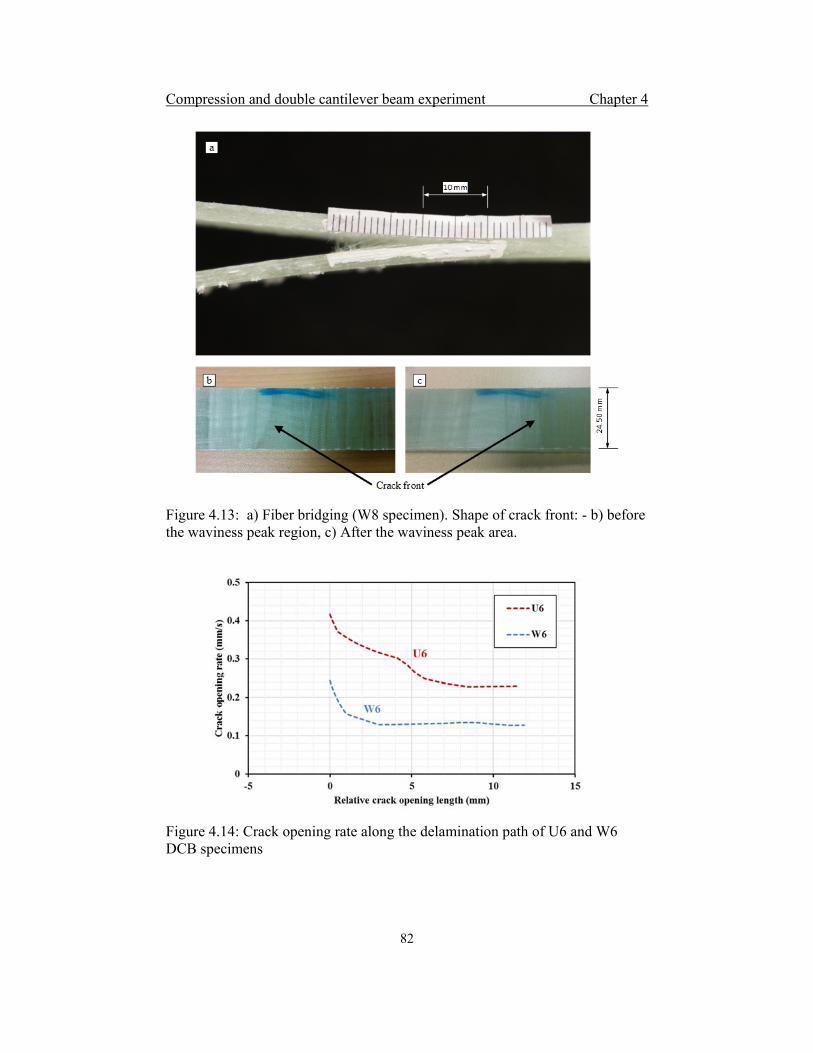
Compression and double cantilever beam experiment Chapter 4
82
Figure 4.13: a) Fiber bridging (W8 specimen). Shape of crack front: - b) before the waviness peak region, c) After the waviness peak area.
Figure 4.14: Crack opening rate along the delamination path of U6 and W6 DCB specimens

Compression and double cantilever beam experiment Chapter 4
83
Figure 4.15: Crack opening rate along the delamination path of U8 and W8 DCB specimens
4.3 Summary
A coupon level unidirectional GFRP with waviness defect were tested under
static compression loads. Specimens were tested with various fiber wave severity
and the results were compared with defect free samples. The reduction in
compressive strength and variation in failure modes on each wave severities were
analyzed. Effect of fiber waviness on mode – I fracture energy and delamination
onset were studied using DCB experiment. Two sets of wavy DCB specimens
with different waviness positions and geometrical parameters were tested and
compared with standard DCB specimens. The variation in the crack propagation
and the shape at the waviness effected areas were studied.
References
[1]. B. D. Allison and J. L. Evans, Effect of fiber waviness on the bending
behavior of S-glass/epoxy composites. Materials & Design, 2012. 36: p.
316-322.
[2]. M. R. Piggott, The Effect of Fiber Waviness on the Mechanical-
Properties of Unidirectional Fiber Composites - a Review. Composites
Science and Technology, 1995. 53(2): p. 201-205.
Compression and double cantilever beam experiment Chapter 4
84
[3]. D. Adams and S. J. Bell, Compression Strength Reductions in Composite
Laminates Due to Multiple-Layer Waviness. Composites Science and
Technology, 1995. 53(2): p. 207-212.
[4]. D. O. Adams and M. W. Hyer, Effects of Layer Waviness on the
Compression Strength of Thermoplastic Composite Laminates. Journal of
Reinforced Plastics and Composites, 1993. 12(4): p. 414-429.
[5]. T. A. Bogetti, J. W. Gillespie, and M. A. Lamontia, The influence of ply
waviness with nonlinear shear on the stiffness and strength reduction of
composite laminates. Journal of Thermoplastic Composite Materials,
1994. 7(2): p. 76-90.
[6]. J. F. Mandell, D. D. Samborsky, and H. J. Sutherland. Effects of materials
parameters and design details on the fatigue of composite materials for
wind turbine blades. in EWEC-CONFERENCE-. 1999.
[7]. J. Mandell, D. Samborsky, and L. Wang. Effects of fiber waviness on
composites for wind turbine blades. in International Sampe Symposium
and Exhibition. 2003. SAMPE; 1999.
[8]. D. P. Avery, et al. Compression strength of carbon fiber laminates
containing flaws with fiber waviness. in 42nd AIAA Aerospace Sciences
Meeting and Exhibit, p 174. 2004.
[9]. J. W. Nelson, D. S. Cairns, and T. W. Riddle. Manufacturing Defects
Common to Composite Wind Turbine Blades: Effects of Defects. in
Proceedings AIAA Aerospace Science Meeting, Wind Energy Symposium,
Orlando, FL. 2011: p. 1756.
[10]. P. Davidson, et al. Effect of Fiber Waviness on the Compressive Strength
of Unidirectional Carbon Fiber Composites. in 53rd
AIAA/ASME/ASCE/AHS/ASC Structures, Structural Dynamics and
Materials Conference, AIAA 2012-1612, Honolulu, Hawaii. 2012.
[11]. M. R. Wisnom, The Effect of Fiber Waviness on the Relationship between
Compressive and Flexural Strengths of Unidirectional Composites.
Journal of Composite Materials, 1994. 28(1): p. 66-76.

Compression and double cantilever beam experiment Chapter 4
85
[12]. P. J. Joyce and T. J. Moon, Compression strength reduction in composites
with in-plane fiber waviness. Composite Materials: Fatigue and Fracture,
Seventh Volume, 1998. 1330: p. 76-96.
[13]. N. A. Fleck, Compressive failure of fiber composites. Advances in
Applied Mechanics, Vol 33, 1997. 33: p. 43-117.
[14]. J. Lee and C. Soutis, A study on the compressive strength of thick carbon
fibre–epoxy laminates. Composites Science and Technology, 2007.
67(10): p. 2015-2026.
[15]. S. H. Lee, C. S. Yerramalli, and A. M. Waas, Compressive splitting
response of glass-fiber reinforced unidirectional composites. Composites
Science and Technology, 2000. 60(16): p. 2957-2966.
[16]. B. D. Davidson, An Analytical Investigation of Delamination Front
Curvature in Double Cantilever Beam Specimens. Journal of Composite
Materials, 1990. 24(11): p. 1124-1137.
[17]. H. M. Hsiao and I. M. Daniel, Effect of fiber waviness on stiffness and
strength reduction of unidirectional composites under compressive
loading. Composites Science and Technology, 1996. 56(5): p. 581-593.
[18]. ASTM, D5528-94a, 2001, in Test Method for Mode I Interlaminar
Fracture Toughness of Unidirectional Fiber-Reinforced Polymer.
[19]. B. D. Davidson, R. Kruger, and M. Konig, Effect of stacking sequence on
energy release rate distributions in multidirectional DCB and ENF
specimens. Engineering Fracture Mechanics, 1996. 55(4): p. 557-569.
[20]. H. T. Hahn and S. W. Tsai, Introduction to composite materials. 1980:
CRC Press.
[21]. M. R. Shetty, et al., Effect of fibre orientation on mode-I interlaminar
fracture toughness of glass epoxy composites. Journal of Reinforced
Plastics and Composites, 2000. 19(8): p. 606-620.

Compression and double cantilever beam experiment Chapter 4
86

An analytical model and a numerical model Chapter 5
87
An analytical model and a numerical model: Effect of
fiber waviness
In this chapter, the reduction in the stiffness of unidirectional
composites due to the presence of a through thickness in-plane
waviness is predicted based on an analytical model. Also, finite
element analysis is carried out based on a physical based failure
theory to identify the failure modes.
5.1 Introduction
In this chapter an analytical model is discussed to estimate the moduli of
unidirectional laminate with increase in wave severity. In the literature various
failure theories were discussed. Among various failure theories LaRC02 criterion
is found to be successfully predicting the compressive strength and failure modes
of the unidirectional laminate with waviness defect.
5.2 An Analytical model with in-plane waviness
In Chapter 4, a reduction in both stiffness and strength values due to the fiber
waviness effect were found. The analytical model results are compared with the
experimental findings from the last chapter 4. The model specifically focuses on
to address the reduction in Young’s modulus due to the through thickness in-
plane fiber waviness. In the current analytical model, the effect of in-plane
waviness throughout the thickness of a unidirectional composite laminate under
compressive loading was considered.
Geometry of an In-plane waviness
A typical geometry of a unidirectional composite laminate is considered with
fibers aligned along the length directions. In the case of the laminate with fiber
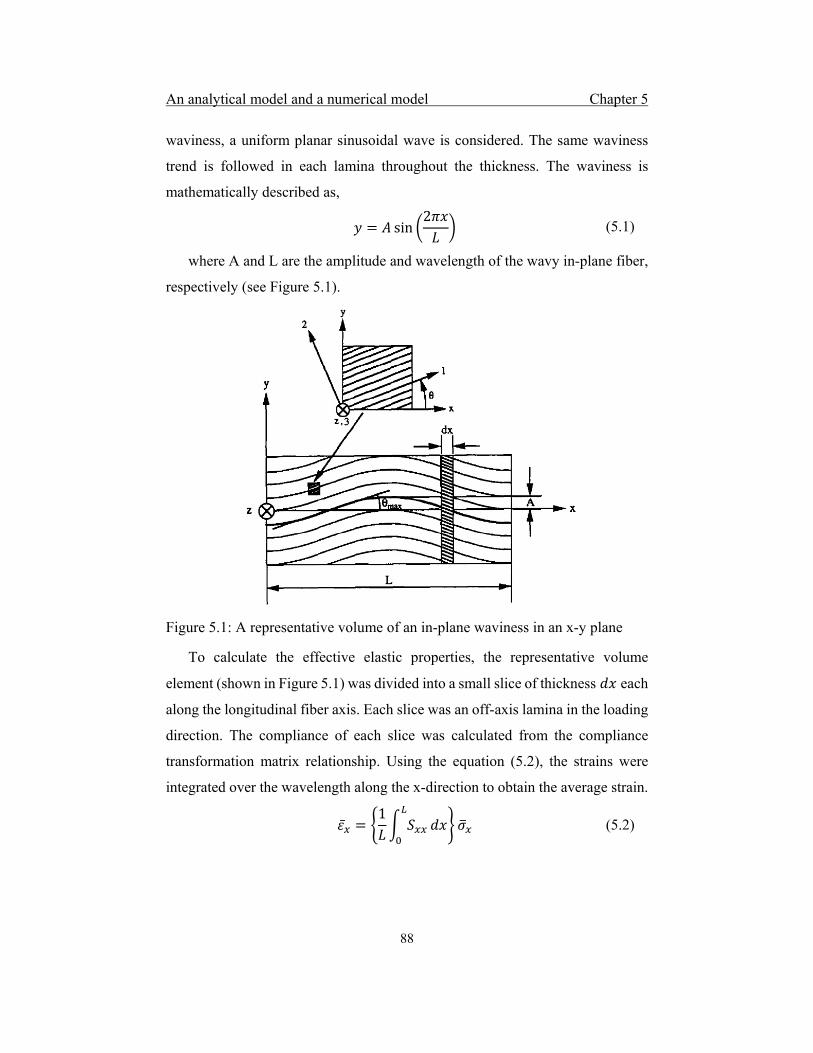
An analytical model and a numerical model Chapter 5
88
waviness, a uniform planar sinusoidal wave is considered. The same waviness
trend is followed in each lamina throughout the thickness. The waviness is
mathematically described as,
sin2
(5.1)
where A and L are the amplitude and wavelength of the wavy in-plane fiber,
respectively (see Figure 5.1).
Figure 5.1: A representative volume of an in-plane waviness in an x-y plane
To calculate the effective elastic properties, the representative volume
element (shown in Figure 5.1) was divided into a small slice of thickness each
along the longitudinal fiber axis. Each slice was an off-axis lamina in the loading
direction. The compliance of each slice was calculated from the compliance
transformation matrix relationship. Using the equation (5.2), the strains were
integrated over the wavelength along the x-direction to obtain the average strain.
1
(5.2)
An analytical model and a numerical model Chapter 5
89
where is the compliance of the slice of length x.
The detailed derivation of the average strain is given in Appendix A.
After the integration, the resulting equation will be,
2 (5.3)
, and are the integration components.
1 21
21
11 3 21
and
2 tan
From the equation (5.3), the Young’s Modulus is given as,
1
2 (5.4)
In general, individual stresses and strains can be analyzed based on the
classical laminate theory.
(5.5)
where A is the extensional stiffness matrix, B is the coupling stiffness and D
is the bending stiffness matrix. The current analysis was done for unidirectional
laminate and considering that the defect on each lamina consist of same severity
and size; hence the individual lamina stresses and total laminate stresses will be
the same. The analytical model was used to understand the stress-strain behavior
of the laminate at various severity levels. In this model, the severity of the
waviness is characterized based on the amplitude to the wavelength ratio (A/L)
called as wave severity. The severity ratio was varied from zero to a maximum
of 0.075 to correlate the experimental waviness geometry of severity 0.01, 0.025,
0.035 and 0.075. The geometry details of the current waviness are as follows,

An analytical model and a numerical model Chapter 5
90
Amplitude A = 0 – 2.6 mm
Wave length L = 35 mm
Wave severity Ws = 0 – 0.075
The experimentally determined lamina material properties used as follows
Young’s modulus = 41.4 GPa, = 10.4 GPa,
Poisson’s ratio = 0.28, 0.27
5.2.2 Analytical model results
Figure 5.2 shows the reduction in Young’s modulus on x, y and z coordinate
axis. In the longitudinal axis with a wave severity of 0.07, the Young’s modulus
is reduced by 45%. Compared to the elastic modulus in the lateral direction,
waviness defect had more influence in the longitudinal direction. There was no
change observed in the modulus value along the z axis. The waviness was literally
laid in the x-y plane (see Figure 5.1) and the symmetry of the laminate about the
x – y plane still intact as similar to the unidirectional laminate. Figure 5.3
illustrates the variation in shear strength, which shows a slight increase in the in-
plane shear strength with increase in wave severity. All the comparison with
experimental results will be explained in the section 5.3.
Figure 5.2: Normalized Young’s modulus with respect to wave severity

An analytical model and a numerical model Chapter 5
91
Figure 5.3: Normalized shear modulus with respect to wave severity.
5.3 Abaqus Model
ABAQUS is a finite element modelling and simulation software used to
analyze complex problems in the engineering with the help of a numerical solvers.
The different modules in the software helps to model the components and analyze
the problem by employing different integration scheme, such as Abaqus/Standard,
Abaqus/Explicit etc. Abaqus/Standard is a general-purpose solver and uses
implicit integration scheme to solve the problem. On the other hand,
Abaqus/Explicit is used to solve nonlinear dynamic, transient loads and quasi-
static problems with the help of explicit integration scheme.
In the explicit method, Abaqus does not use iterative solver to reach the
equilibrium stage. Instead, a central difference method is used to solve the
equation with the help of inertia force and viscous damping coefficient. When
explicit method applied to quasi-static problem, the loading rate is considered to
be as small as possible for a negligible kinetic energy. The analysis efficiency
can be improved by taking the analysis time as minimum as possible and the mass
scaling factor as maximum as possible.
In the analysis of laminated composite materials using ABAQUS, the general
failure criteria included are Max Stress, Max Strain, Tsai-Wu [1], Tsai-Hill [2]
and Hashin’s [3]. Except Hashin’s failure, all these failure initiation criteria are

An analytical model and a numerical model Chapter 5
92
not based on individual constituent materials and resulted in poor failure
prediction. These failure criterions are used to predict the failure initiation over
the integration points defined in the model. Once the model satisfies the initiation
condition at any of its integration points, it will follow the default stiffness
degradation method unless otherwise any degradation is mentioned.
In ABAQUS, the progressive damage initiation and damage evolution of both
matrix and fiber material constituents are predicted based on the composite
average state of stresses and strain. The damage progression is purely based on
in-plane stresses and strain components and completely ignoring the effect of
transverse stresses and strains. In the damage evolution part, Abaqus damage
model considers the stiffness reductions of in-plane constituents such as
, , and leaving behind the transverse stiffness such as , ,
unchanged. In order to avoid these limitations, an Autodesk plugin called Helius
PFA [4] for the simulation of composite analysis is included to incorporate the
constituent (matrix and fiber) level failure initiation criterion like MCT based
failure [5], Christensen [6], Puck [7] and LaRC02 [8] into the model.
Helius PFA [4] uses separate material manager to include the composite
lamina properties. Based on the input provided to the material manager, Helius
PFA provides the constitutive relations for composite materials as per the
required failure theory to the ABAQUS input. As seen in Table 5.1, the lamina
material properties were derived from the individual material properties input
(fiber and resin properties) given to the material manager of Helius PFA.
In the current work, LaRC02 failure criterion (based on an improvement to
Hashin’s model) was preferred as it combines the fracture plane concept of Puck
[7] as well. This criterion identifies the fiber failure and matrix cracking in
unidirectional composites (initiation and instantaneous damage progression) [7,
9] based on the below mentioned constitutive relations. The uniaxial tensile
strength (S11), compressive strength (-S11), and in-plane shear strength (S12) were
obtained from the experiments conducted. The out-of-plane shear strength values
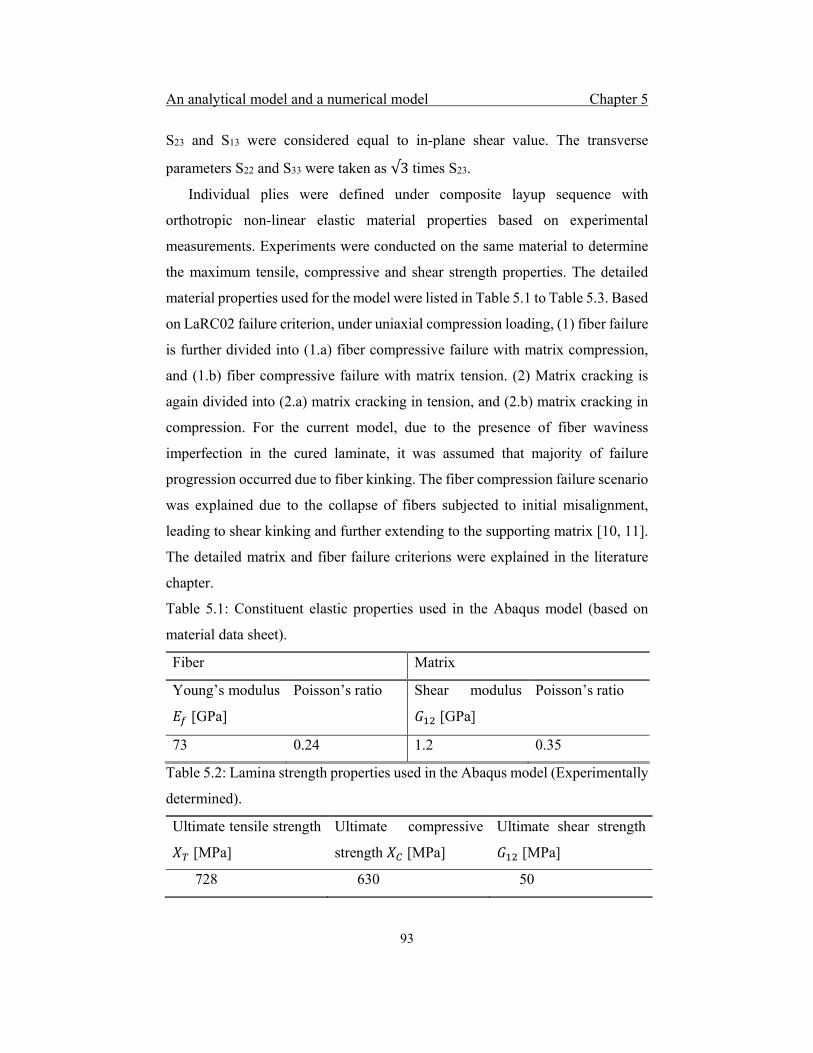
An analytical model and a numerical model Chapter 5
93
S23 and S13 were considered equal to in-plane shear value. The transverse
parameters S22 and S33 were taken as √3 times S23.
Individual plies were defined under composite layup sequence with
orthotropic non-linear elastic material properties based on experimental
measurements. Experiments were conducted on the same material to determine
the maximum tensile, compressive and shear strength properties. The detailed
material properties used for the model were listed in Table 5.1 to Table 5.3. Based
on LaRC02 failure criterion, under uniaxial compression loading, (1) fiber failure
is further divided into (1.a) fiber compressive failure with matrix compression,
and (1.b) fiber compressive failure with matrix tension. (2) Matrix cracking is
again divided into (2.a) matrix cracking in tension, and (2.b) matrix cracking in
compression. For the current model, due to the presence of fiber waviness
imperfection in the cured laminate, it was assumed that majority of failure
progression occurred due to fiber kinking. The fiber compression failure scenario
was explained due to the collapse of fibers subjected to initial misalignment,
leading to shear kinking and further extending to the supporting matrix [10, 11].
The detailed matrix and fiber failure criterions were explained in the literature
chapter.
Table 5.1: Constituent elastic properties used in the Abaqus model (based on
material data sheet).
Fiber Matrix
Young’s modulus
[GPa]
Poisson’s ratio Shear modulus
[GPa]
Poisson’s ratio
73 0.24 1.2 0.35
Table 5.2: Lamina strength properties used in the Abaqus model (Experimentally
determined).
Ultimate tensile strength
[MPa]
Ultimate compressive
strength [MPa]
Ultimate shear strength
[MPa]
728 630 50

An analytical model and a numerical model Chapter 5
94
Table 5.3: Comparison of lamina material properties from experiment and model
[GPa]
[GPa] [GPa]
Based on Autodesk
Helius PFA
41.4 9.99 3.58 0.27
From experiment 41.4 10.29 2.78 0.28
5.3.1 Mesh Modelling
Initially, an Abaqus model for the unidirectional specimen was prepared. The
kind of failure modes presented in unidirectional model is unimportant, rather the
model was used to compare the stress-strain behavior with the fiber waviness
induced model. A specimen model has been prepared in the same dimension of
the experimental specimen. A solid continuum element (C3D8R) with reduced
integration and enhanced hourglass control were used. Hourglassing is the
process of mesh instability caused due to the use of reduced integration. With the
help of fine mesh and enhanced hourglass control, the mesh instability is
controlled and confirmed that the artificial energy is less than 1% of internal
energy. A sweep mesh with mesh stack orientation perpendicular to the laminate
plane was preferred for getting a uniform mesh throughout the section. At the
gage portion, the waviness was obtained by aligning the elements in a
predetermined wave path. Based on the wave severity geometry, different wave
paths were created on each model. As shown in Figure 5.4, the mesh was
followed a path specially created for the wave severity 0.075 and the orientation
of each element in that wavy area follows the same path.

An analytical model and a numerical model Chapter 5
95
Figure 5.4: (a) Abaqus specimen model, (b) Zoomed vies at gage portion, (c) Mesh flow in the gauge area along the waviness path, (d) Element orientation at the waviness region.
The gage portion has a thickness of 3.72 mm and gage length of 20 mm. A
mesh refinement study has been performed on the wavy specimen to ensure the
simulation results obtained are adequate (see Figure 5.5). Neither the tabs nor the
adhesive joint of the tabs were failed during the experiment. Hence least
importance was given to the failure mechanisms of tab materials and adhesive
bonds.
Figure 5.5: Mesh refinement for both unidirectional and wave induced model (Wave severity = 0.075).
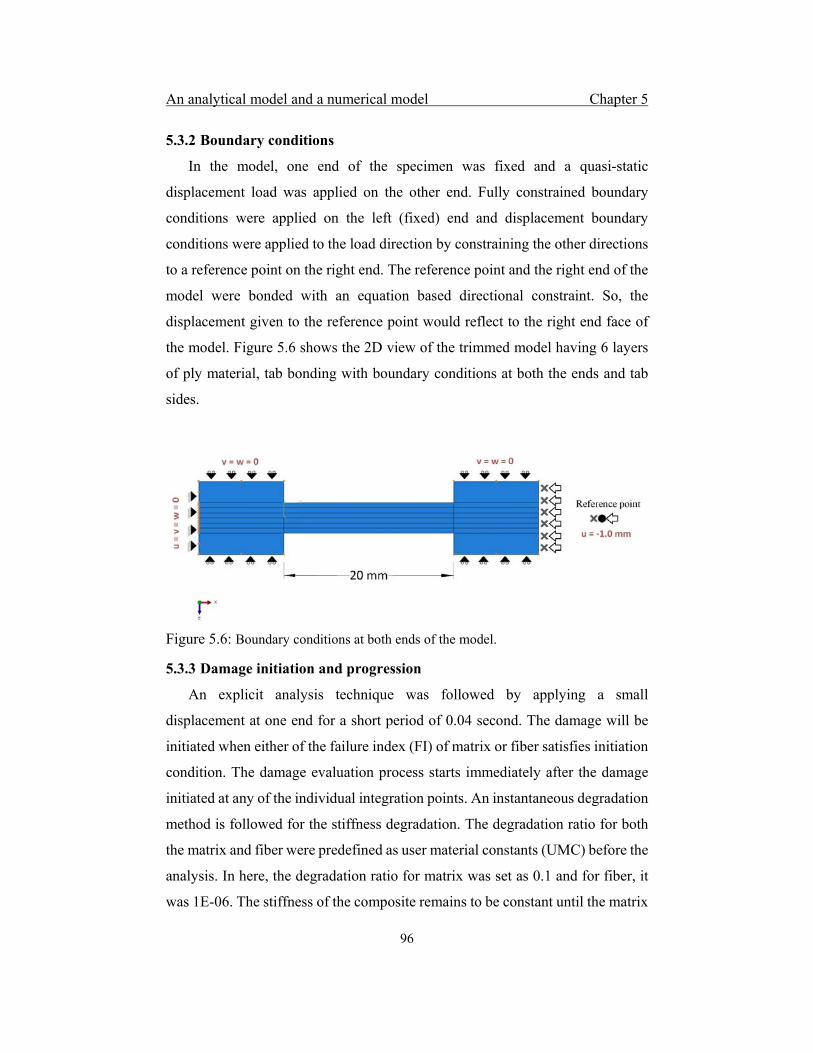
An analytical model and a numerical model Chapter 5
96
5.3.2 Boundary conditions
In the model, one end of the specimen was fixed and a quasi-static
displacement load was applied on the other end. Fully constrained boundary
conditions were applied on the left (fixed) end and displacement boundary
conditions were applied to the load direction by constraining the other directions
to a reference point on the right end. The reference point and the right end of the
model were bonded with an equation based directional constraint. So, the
displacement given to the reference point would reflect to the right end face of
the model. Figure 5.6 shows the 2D view of the trimmed model having 6 layers
of ply material, tab bonding with boundary conditions at both the ends and tab
sides.
Figure 5.6: Boundary conditions at both ends of the model.
5.3.3 Damage initiation and progression
An explicit analysis technique was followed by applying a small
displacement at one end for a short period of 0.04 second. The damage will be
initiated when either of the failure index (FI) of matrix or fiber satisfies initiation
condition. The damage evaluation process starts immediately after the damage
initiated at any of the individual integration points. An instantaneous degradation
method is followed for the stiffness degradation. The degradation ratio for both
the matrix and fiber were predefined as user material constants (UMC) before the
analysis. In here, the degradation ratio for matrix was set as 0.1 and for fiber, it
was 1E-06. The stiffness of the composite remains to be constant until the matrix

An analytical model and a numerical model Chapter 5
97
failure occurs. Once the matrix fails, the matrix stiffness drops correspond to
matrix degradation ratio and thus the composite stiffness. When fiber failure
occurs, the fiber stiffness reduced as per user material constant assigned and
which in turns a further drop in composite stiffness.
Based on these constitutive equations of LaRC02 failure criteria, Abaqus
identifies the failure initiation at individual integration points in the model. The
results were interpreted based on the State Dependent Variables (SDV). SDV =
1.0, signifies no damage in both fiber and matrix and SDV = 2.0 signifies failed
matrix. When SDV reaches 3.0 on a specified location, it was confirmed that both
matrix and fiber failed in that area.
5.3.4 Simulation results
Initially, a qualitative visual comparison study of both unidirectional and
waviness model simulation was performed. Similar to the experiment, a sudden
catastrophic failure was observed in unidirectional specimen.
Figure 5.7: Damage over the gage area in unidirectional laminate with respect to SDV.

An analytical model and a numerical model Chapter 5
98
Figure 5.8: Damage over the gage area in wavy laminate with respect to SDV.
The Figure 5.7 and Figure 5.8 shows the damage over the gage portion of the
specimen with respect to the solution dependent variable. It was seen that the
total gage portion of the unidirectional specimen was damaged similar to the
experiment. Similarly, for the wavy model, the damage was observed in an
angled plane along the width. This phenomenon is very similar to the kink band
formation found in the experimental specimen. A detailed comparison of the
compressive strength reduction, Young’s Modulus and failure mechanisms is
explained in the next session.
5.4 Comparison of analytical and simulation results with experiment
Figure 5.9 shows the stress vs strain behavior calculated for the unidirectional
samples. Both analytical and Abaqus simulation followed a linear path and
experiment shows a slighter deviation after a strain of 0.5%. This pre-failure
nonlinearity observed in the experiment can be explained with the help of shear
properties.

An analytical model and a numerical model Chapter 5
99
Figure 5.9: Stress vs Strain behavior of models and experiment
Under compression, unidirectional laminates typically exhibit a non-linear
shear response in the longitudinal direction prior to the failure [12]. It is due to
the presence of micro-cracks in the matrix material. Under compression loading,
the matrix material deforms due to shear in the longitudinal plane. During shear
deformation, the micro-cracks accumulate and lead to the degradation of matrix
in shear and a progressive degradation in the shear behavior of composite [13].
To understand the longitudinal shear behavior, a V-notch rail shear test was
conducted on the same material as per ASTM D7078 [14]. It was clear from the
shear experiment that the unidirectional composite exhibit non-linear shear
response prior to failure (see Figure 5.10). A same shear experiment was
performed on the wavy laminate and found a similar response as compared to
unidirectional laminate. A wave severity of 0.035 was measured on the shear
testing sample with fiber waviness.
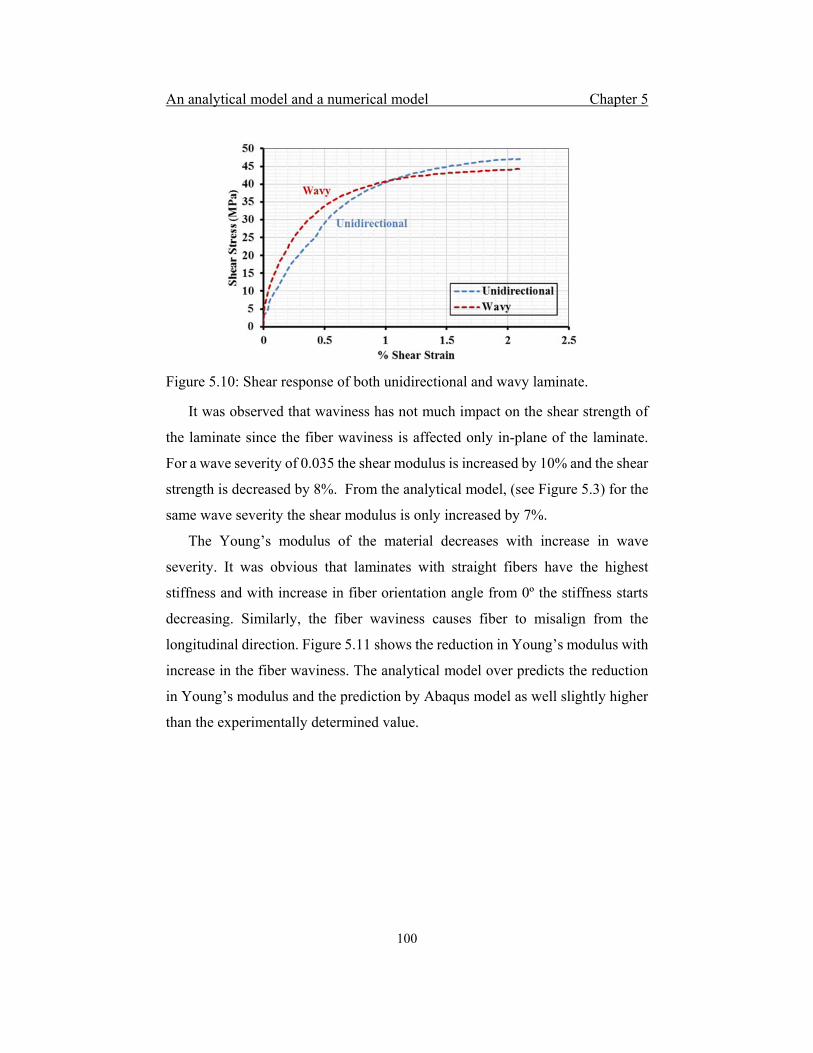
An analytical model and a numerical model Chapter 5
100
Figure 5.10: Shear response of both unidirectional and wavy laminate.
It was observed that waviness has not much impact on the shear strength of
the laminate since the fiber waviness is affected only in-plane of the laminate.
For a wave severity of 0.035 the shear modulus is increased by 10% and the shear
strength is decreased by 8%. From the analytical model, (see Figure 5.3) for the
same wave severity the shear modulus is only increased by 7%.
The Young’s modulus of the material decreases with increase in wave
severity. It was obvious that laminates with straight fibers have the highest
stiffness and with increase in fiber orientation angle from 0º the stiffness starts
decreasing. Similarly, the fiber waviness causes fiber to misalign from the
longitudinal direction. Figure 5.11 shows the reduction in Young’s modulus with
increase in the fiber waviness. The analytical model over predicts the reduction
in Young’s modulus and the prediction by Abaqus model as well slightly higher
than the experimentally determined value.
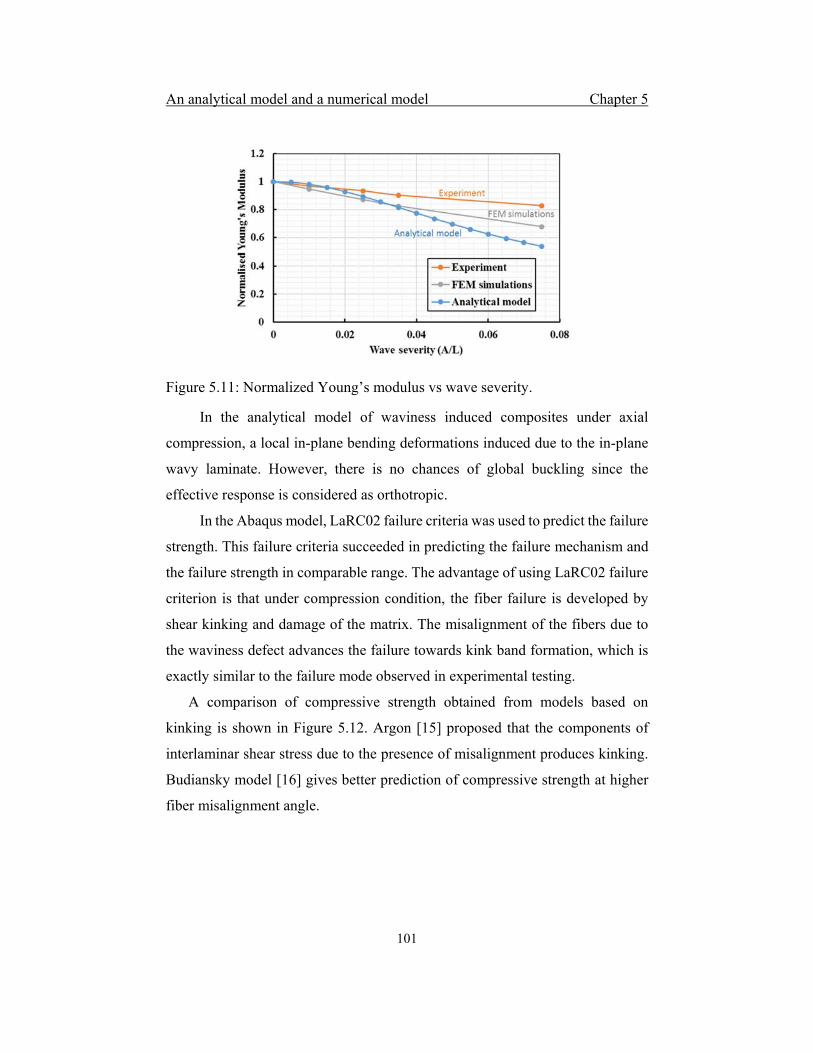
An analytical model and a numerical model Chapter 5
101
Figure 5.11: Normalized Young’s modulus vs wave severity.
In the analytical model of waviness induced composites under axial
compression, a local in-plane bending deformations induced due to the in-plane
wavy laminate. However, there is no chances of global buckling since the
effective response is considered as orthotropic.
In the Abaqus model, LaRC02 failure criteria was used to predict the failure
strength. This failure criteria succeeded in predicting the failure mechanism and
the failure strength in comparable range. The advantage of using LaRC02 failure
criterion is that under compression condition, the fiber failure is developed by
shear kinking and damage of the matrix. The misalignment of the fibers due to
the waviness defect advances the failure towards kink band formation, which is
exactly similar to the failure mode observed in experimental testing.
A comparison of compressive strength obtained from models based on
kinking is shown in Figure 5.12. Argon [15] proposed that the components of
interlaminar shear stress due to the presence of misalignment produces kinking.
Budiansky model [16] gives better prediction of compressive strength at higher
fiber misalignment angle.

An analytical model and a numerical model Chapter 5
102
Figure 5.12: Comparison of compressive strength obtained with Argon model and Budiansky model mentioned in literature.
Figure 5.13: Comparison of failure strength with different wave severity
From the Figure 5.13, it is evident that compared to the analytical model
results, the compressive strength predicted using the Abaqus model was well
matched. A single through thickness fiber waviness of severity 0.025 is enough
to bring about a reduction of up to 50% in the compressive strength. Figure 5.14
shows the comparison of gage area of both unidirectional and wavy laminate after
the complete failure.

An analytical model and a numerical model Chapter 5
103
Figure 5.14: (a) Experimentally failed specimens and (b) Model prediction of both defect free and waviness defect containing samples.
Unlike the brooming failure observed on the unidirectional specimen gage
area, the Abaqus model shows a very random failure at the gage portion. In the
experiment, fiber breakage and matrix cracking was evident, but in the Abaqus
model the fiber damage and matrix damage are together represented with the help
of solution dependent variables (SDV). However, the LaRC02 succeeded in
predicting the failure mechanism and the failure mode in the wavy laminate. A
fiber and matrix failure in the form of a kink band is clearly visible in Abaqus
model. It was also found that as the wave severity increases, a transition from a
sudden catastrophic failure to a slow and gradual failure will occur at the gage
area.
5.4 Summary
An analytical model study based on the laminate constitutive relation has
been done on the wavy laminate. A single uniform waviness in the form of a sine
wave was considered on each lamina and modulus properties were calculated.
Similarly, an Abaqus model has been prepared with the help of Helius PFA to
include the LaRC02 failure criteria. A comparison study has been performed on
the experimentally determined Young’s modulus and compressive strength
results with the results obtained from analytical and numerical simulation. The
Abaqus simulation succeeded in predicting the failure modes observed due to the
waviness defect.
An analytical model and a numerical model Chapter 5
104
References
[1]. S. W. Tsai and E. M. Wu, A general theory of strength for anisotropic
materials. Journal of composite materials, 1971. 5(1): p. 58-80.
[2]. S. W. Tsai, Strength Characteristics of Composite Materials. 1965,
Philco Corp Newport Beach CA.
[3]. Z. Hashin, Failure Criteria for Unidirectional Fiber Composites. Journal
of Applied Mechanics-Transactions of the Asme, 1980. 47(2): p. 329-
334.
[4]. Autodesk Helius PFA 2016.
[5]. T. E. Tay, et al., Progressive failure analysis of composites. Journal of
Composite Materials, 2008. 42(18): p. 1921-1966.
[6]. R. M. Christensen and S. DeTeresa, The kink band mechanism for the
compressive failure of fiber composite materials. Journal of applied
mechanics, 1997. 64(1): p. 1-6.
[7]. A. Puck and H. Schürmann, Failure analysis of FRP laminates by means
of physically based phenomenological models. Composites Science and
Technology, 1998. 58(7): p. 1045-1067.
[8]. D. Ambur, N. Jaunky, and C. Davila. Progressive Failure of Composite
Laminates Using LaRC02 Criteria. in 45 th AIAA/ASME/ASCE/AHS/ASC
Structures, Structural Dynamics and Materials Conference. 2004.
[9]. C. G. Davila, Failure Criteria for FRP Laminates. Journal of Composite
Materials, 2005. 39(4): p. 323-345.
[10]. N. A. Fleck and D. Q. Liu, Microbuckle initiation from a patch of large
amplitude fibre waviness in a composite under compression and bending.
European Journal of Mechanics a-Solids, 2001. 20(1): p. 23-37.
[11]. C. R. Schultheisz and A. M. Waas, Compressive failure of composites,
part I: testing and micromechanical theories. Progress in Aerospace
Sciences, 1996. 32(1): p. 1-42.
An analytical model and a numerical model Chapter 5
105
[12]. H. T. Hahn and S. W. Tsai, Nonlinear elastic behavior of unidirectional
composite laminae. Journal of Composite Materials, 1973. 7(1): p. 102-
118.
[13]. Y. He and A. Makeev, Nonlinear shear behavior and interlaminar shear
strength of unidirectional polymer matrix composites: A numerical study.
International Journal of Solids and Structures, 2014. 51(6): p. 1263-1273.
[14]. ASTM, D7078, in D7078M-Standard Test Method for Shear Properties
of Composite Materials by V-Notched Rail Shear Method. 2005.
[15]. A. S. Argon, Fracture of Compoites in Treatise on Materials Science and
Technology. New York: Academic Press, 1972. 1: p. 79-114.
[16]. B. Budiansky and N. A. Fleck, Compressive failure of fibre composites.
Journal of the Mechanics and Physics of Solids, 1993. 41(1): p. 183-211.

An analytical model and a numerical model Chapter 5
106

Static and fatigue flexural testing Chapter 6
107
Static and fatigue flexural testing of laminate with
waviness defect
In this chapter, the experimental analysis of unidirectional
laminates having through thickness in-plane waviness under both
static and flexural fatigue loading is explained. The static flexural
experiments were carried out on both unidirectional and wavy
specimens to compare the outcomes. The flexural fatigue experiments
were conducted at stress ratios of R = 0.1 and R = 0.5. The
experimental findings such as reduction in flexural strength, stiffness,
fatigue life and variation in the failure modes are discussed.
6.1 Introduction
As mentioned earlier in Chapter 2, wind turbine blade carries load in both
flap-wise and edgewise directions. The aerodynamic shape consists of two parts
namely suction side and pressure side. Usually the upper shell of the blade portion
is suction side and the lower portion is the pressure side. The spar-cap is
considered as the primary load caring member and nowadays most of the modern
wind turbine spar-caps are made up of laminated polymer composites. In this
chapter, these materials with fiber waviness defect were flexural tested under
static and fatigue loads to understand their failure behavior in various operating
loads.
6.2 Static flexural test
An analytical FEM study was conducted by Wisnom [1] on the waviness
defect and compared the compressive strength under compression and bending.

Static and fatigue flexural testing Chapter 6
108
He predicted that bending strength may be higher than the pure compressive
strength due to stress gradient in bending. In another study, Chan and Chou [2]
determine the bending strength of out of plane wavy laminate in terms of
compliance properties. Similarly, Chun and Shin [3] derived the flexural modulus
of wavy laminate using strain energy concept. With the help of a 2D compression
model, Fleck and Liu [4] found micro buckling failure due to fiber misalignment
could be used for thin laminate under bending. But the same model is not
applicable for thick laminate due to the stress gradient in bending. Allison [5] had
studied the effect of out of plane waviness in bending and found a 37% reduction
in compressive strength due to a large concave wave. But he found that smaller
waviness in the direction of bending provides greater strength.
In the present study, a three-point bending test were conducted on a through
thickness in-plane waviness induced laminated specimen. The study focuses on
the effect of waviness on the bending properties and the failure progression.
Similar to the specimen preparation method mentioned in previous chapter,
vacuum assisted resin infusion technique was followed. The specimens were
prepared in such way that waviness defect is presented at the exact middle of
each sample. For the comparison of results obtained, similar size unidirectional
samples were prepared without any waviness defect. Both set of samples were
tested for the same span to thickness ratio.
6.2.1 Specimen geometry and testing
The samples for mechanical testing were prepared according to ASTM
D7264 [6] using a diamond wheel cutter with water as coolant. Each specimen
consists of six layers of unidirectional fabric with an average thickness of 3.72
mm and 20 mm width. As per standard, a span to thickness ratio of 32:1 was
chosen so that the failure is on the outer surface of the specimen due to the
bending moment. An extra allowance of 20% was given to the specimen length
from the calculated support span. A set of seven specimens without any waviness
defect and another set of six specimens with waviness defect (in the middle) were
prepared. A wave severity of 0.035 was measured on the waviness induced
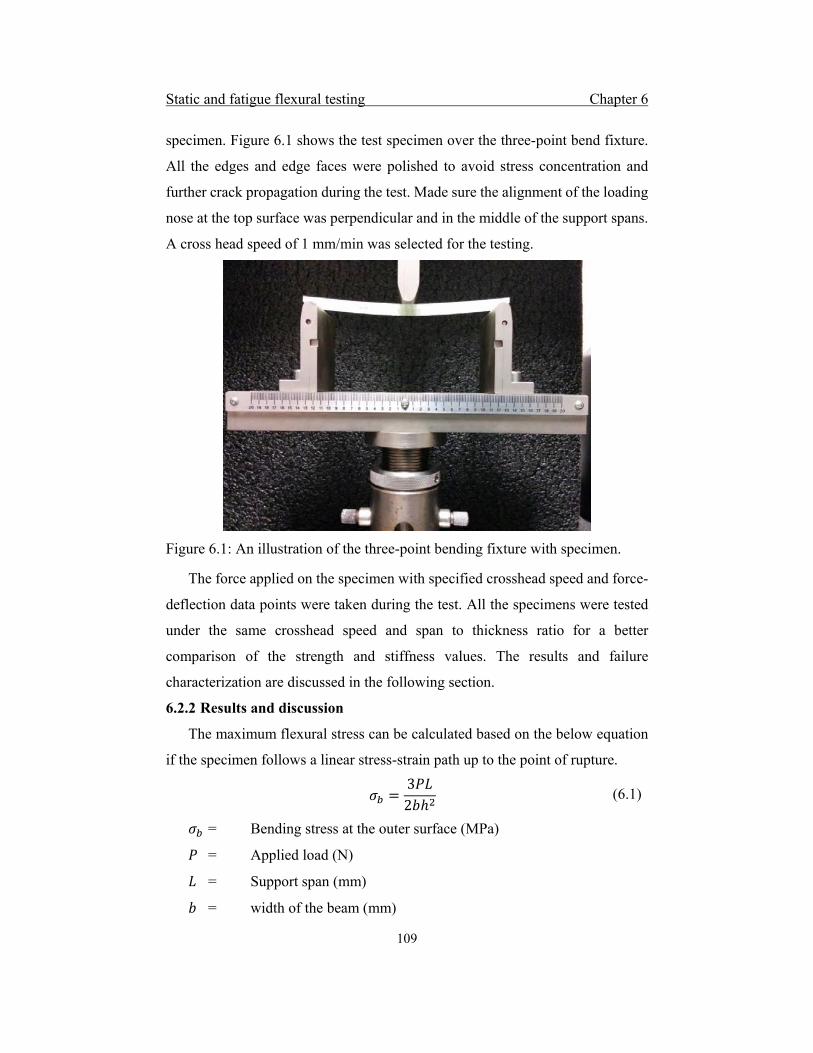
Static and fatigue flexural testing Chapter 6
109
specimen. Figure 6.1 shows the test specimen over the three-point bend fixture.
All the edges and edge faces were polished to avoid stress concentration and
further crack propagation during the test. Made sure the alignment of the loading
nose at the top surface was perpendicular and in the middle of the support spans.
A cross head speed of 1 mm/min was selected for the testing.
Figure 6.1: An illustration of the three-point bending fixture with specimen.
The force applied on the specimen with specified crosshead speed and force-
deflection data points were taken during the test. All the specimens were tested
under the same crosshead speed and span to thickness ratio for a better
comparison of the strength and stiffness values. The results and failure
characterization are discussed in the following section.
6.2.2 Results and discussion
The maximum flexural stress can be calculated based on the below equation
if the specimen follows a linear stress-strain path up to the point of rupture.
32
(6.1)
= Bending stress at the outer surface (MPa)
= Applied load (N)
= Support span (mm)
= width of the beam (mm)
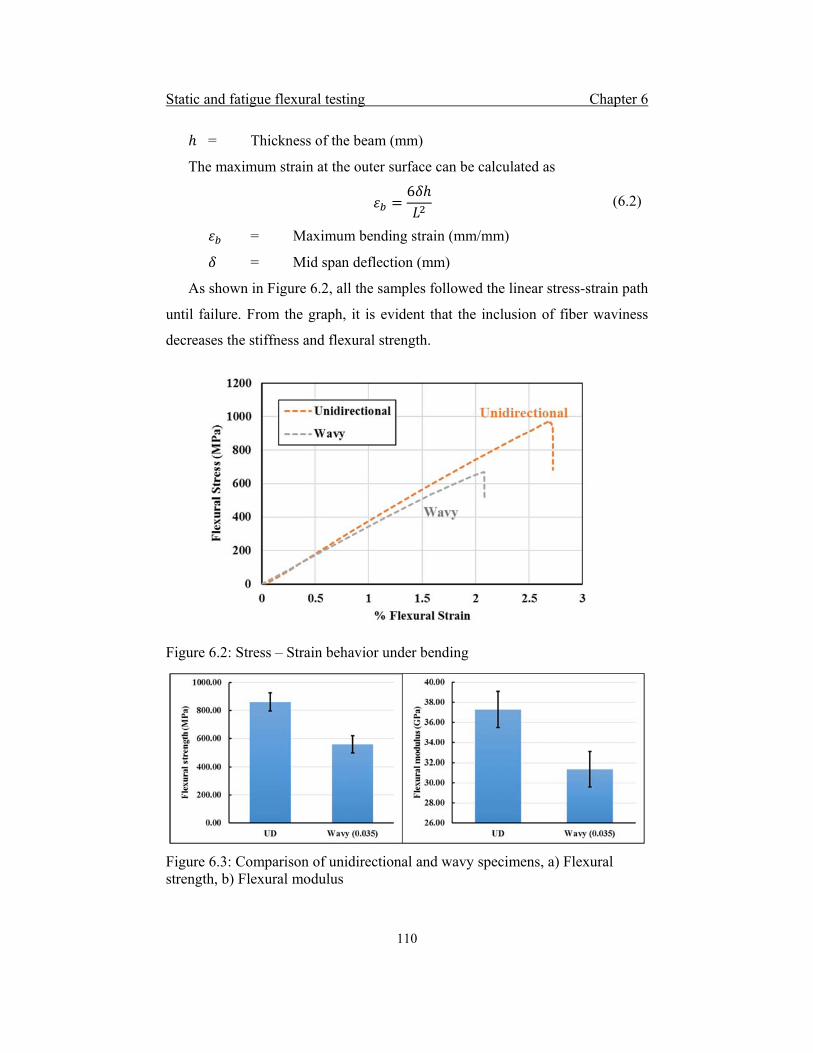
Static and fatigue flexural testing Chapter 6
110
= Thickness of the beam (mm)
The maximum strain at the outer surface can be calculated as
6 (6.2)
= Maximum bending strain (mm/mm)
= Mid span deflection (mm)
As shown in Figure 6.2, all the samples followed the linear stress-strain path
until failure. From the graph, it is evident that the inclusion of fiber waviness
decreases the stiffness and flexural strength.
Figure 6.2: Stress – Strain behavior under bending
Figure 6.3: Comparison of unidirectional and wavy specimens, a) Flexural strength, b) Flexural modulus

Static and fatigue flexural testing Chapter 6
111
It was found that even with the presence of a wave severity of 0.035, the
flexural strength dropped by 35% and the flexural modulus of elasticity dropped
by 16%. Figure 6.3 shows the deviation from the average flexural strength and
flexural modulus calculated from experiment. From the investigation conducted
on out-of-plane fiber misalignment, Potter et al. [7] found that flexural strength
dropped more when the misalignment affected the tension side as compared to
the compression side. As compared to the previous compression experiment, the
reduction in strength in flexural testing was 30% less for the same severity level.
Figure 6.4: Failure over the tension side and compression side of the unidirectional specimen.
Failure modes found in the failed specimens were observed visually and
through optical microscope. For the unidirectional specimen, the compression
side was failed due to fiber micro-buckling and in the tension side, the failure
was initiated with matrix crack along the fiber direction. In majority of the
specimen final failure ended up with delamination of the outer layer at the middle
region. Figure 6.4 (a, b), shows the visual observation of the failure on both the

Static and fatigue flexural testing Chapter 6
112
surfaces. From the optical microscope observations shown in Figure 6.4 (c), a
matrix crack at the tension side and micro-buckling followed by fiber breakage
were clearly visible at the compression side.
Figure 6.5: Final failure over wavy specimen. a) Outer surface failed due to tensile stresses, b) Inner surface failed due to compression stresses, c) Damage at the specimen thickness region, d) Fiber kink band with corresponding orientation angle 18.5º.
Figure 6.5 shows the damage observed over the waviness induced specimen
under flexural testing. On the tension side, similar to the earlier observation,
matrix cracks were found along the fiber waviness path. At the bottom free edge
(see Figure 6.5(a)), the extended matrix crack detached the surface lamina from
the laminate due to the fiber discontinuity. This was happened due to cutting of
the specimen into standard size along the fiber direction. However, the fiber
discontinuity situation may not be present at the waviness region in a real
structure. The loading nose passes through the black marker line shown at the
mid-section (see Figure 6.5 (b)) and the left side of the marker line shows the
damage over the compression side. The micro-buckling of the fibers occurs
perpendicular to the fiber orientation and propagates away from the middle
loading line due to the fiber waviness. The fiber breakage is also visible over the

Static and fatigue flexural testing Chapter 6
113
thickness from the top side of the waviness sample. Figure 6.5(d) shows the kink
band formation over the compression side after a fiber micro-buckling.
For unidirectional specimens, there exhibit surface cracks at the outer surface
(under tension) and local buckling (micro-buckling or ply level buckling) at the
inner surface (under compression) preceded by delamination of the outer ply. The
delamination of outer ply occurs only when the shear stress of the specimen
exceeds the interlaminar shear strength. Compared to unidirectional specimen,
the current wavy specimen with wave severity 0.035 requires 35% less load
towards the flexural strength. Moreover, from the shear test conducted (in
Chapter 5), both unidirectional and wavy specimens have comparable shear
strength irrespective of defect. Thus, for wavy specimen the chances of a
delamination failure before maximum flexural stress at the inner surface is
negligible.
On the wavy specimens, the damage initiation was not uniform along the
width. The top side of the waviness defect seems to be damaged more as
compared to the bottom side of the defect. This can be explained with the help of
bending stiffness matrix ([D]). Due to the presence of through thickness in-plane
waviness defect, the laminate loses its symmetry about x-z plane (x – along the
fiber direction and z – perpendicular to the lamina plane) and this leads to the
existence of some non-zero terms in [D]. This will cause the involvement of
bend-twist coupling and when the specimen is under bending, the amount of
twisting can be quantified with the help of a non-dimensional number B
|D | D⁄ [8]. Hence, while bending, the waviness defect containing specimen
will undergo a localized clockwise twist (looking from the left side). This causes
stress concentration and more damage on top side of the specimen.
6.3 Flexural fatigue test
The fracture mechanism of composite materials under cyclic loading is
complex. According to the previous studies conducted on the fatigue life of the
composite materials, there are four different basic failure modes that generally

Static and fatigue flexural testing Chapter 6
114
occur during cyclic loading. This includes matrix cracking, delamination,
interface debonding and fiber breakage [9].
The wind turbine blades are subjected to a pushing wind force, gravitational
force due to blade weight and a centrifugal force during rotation. Because of the
lower rotating speed, the effect of centrifugal force is generally ignored during
the blade design. The bending stresses due to the blade weight in the edgewise
direction and due to the blowing wind in the flap-wise direction are the major
active cyclic stresses on the blade. Currently, the cyclic pushing load due to wind
load on the blade structure was taken into consideration. During the operation,
the wind load makes the blade to bend in the flap-wise direction and the fibers
on the pressure side are subjected to tension and on the suction side, compression.
This tensile stress or compressive stress on one side of the blade are fluctuating
but not reversible during the flap-wise bending. Similarly, a fluctuating
irreversible load acting on the unidirectional specimen made up of blade material
was studied here. Both unidirectional specimen and fiber waviness induced
specimens were prepared and tested under cyclic loads.
Sakin [10] had studied three point bending fatigue on GFRP material with
fiber weight densities 800gsm, 500gsm, 300gsm and 200gsm and found that
fatigue life decreases with decrease in weight per unit area of fiber and fatigue
life has greater dependence on fiber anisotropy. Belingardi [11] did a bending
fatigue on both cross-ply and angle ply made up of carbon-glass/epoxy hybrid
laminate. He found that for the 85% of the ultimate bending strength the damage
was more significant on the cross-ply laminate as compared to the angle-ply. He
also found that the reduction in material strength and elastic modulus measured
after one million cycle has dependence on the stress ratio and laminate geometry.
Daniel [12] had performed a pure fatigue compression analysis on
carbon/polysulphone composite with layer waviness. He found both reduction in
fatigue life and compressive strength with a moderate level of layer waviness.
Similarly Horrmann et al. [13] had studied the out of plane fiber waviness effect
on CFRP material under C-C and T-C situation and found difference in failure
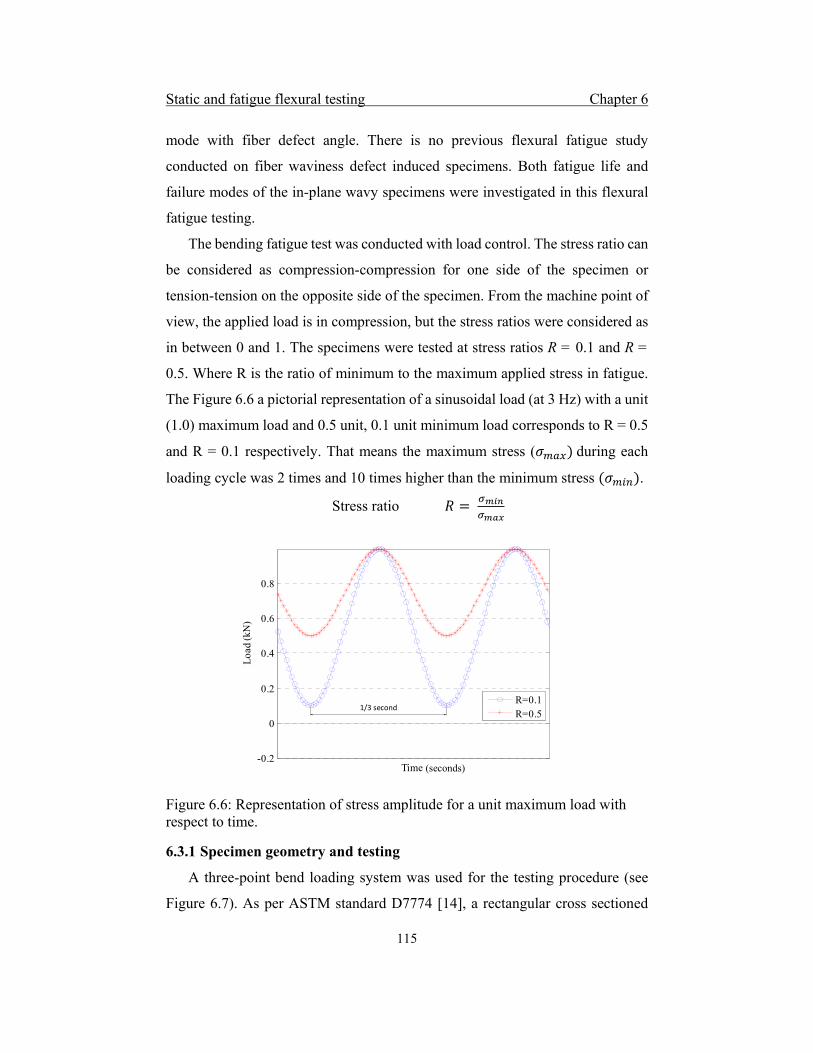
Static and fatigue flexural testing Chapter 6
115
mode with fiber defect angle. There is no previous flexural fatigue study
conducted on fiber waviness defect induced specimens. Both fatigue life and
failure modes of the in-plane wavy specimens were investigated in this flexural
fatigue testing.
The bending fatigue test was conducted with load control. The stress ratio can
be considered as compression-compression for one side of the specimen or
tension-tension on the opposite side of the specimen. From the machine point of
view, the applied load is in compression, but the stress ratios were considered as
in between 0 and 1. The specimens were tested at stress ratios R = 0.1 and R =
0.5. Where R is the ratio of minimum to the maximum applied stress in fatigue.
The Figure 6.6 a pictorial representation of a sinusoidal load (at 3 Hz) with a unit
(1.0) maximum load and 0.5 unit, 0.1 unit minimum load corresponds to R = 0.5
and R = 0.1 respectively. That means the maximum stress ( during each
loading cycle was 2 times and 10 times higher than the minimum stress .
Stress ratio
Figure 6.6: Representation of stress amplitude for a unit maximum load with respect to time.
6.3.1 Specimen geometry and testing
A three-point bend loading system was used for the testing procedure (see
Figure 6.7). As per ASTM standard D7774 [14], a rectangular cross sectioned
-0.2
0
0.2
0.4
0.6
0.8
Time
Loa
d
R=0.1R=0.5
(kN
)
(seconds)
1/3 second

Static and fatigue flexural testing Chapter 6
116
specimen was prepared with a span to thickness ratio of 18:1. The specimen was
cyclically loaded into one direction since both maximum and minimum stresses
are positive. Each specimen consists of eight layers of unidirectional fabric with
an average specimen thickness of 4.78 mm and 25 mm width.
Figure 6.7: Three-point bending fixture and specimen mounted on fixture (insight).
All the specimens were cut from a single cured panel using diamond cutter
and sharp edges were polished. The specimens were prepared in such way that
waviness defect is presented at the exact middle of each sample. For the
comparison of results obtained, similar size unidirectional samples were prepared
without any waviness defect. Both set of samples were tested for same span to
thickness ratio. An overhanging allowance of 10% was given to both end of the
span length to avoid the slippage from the support.
A sinusoidal wave form was followed (see Figure 6.6) to implement the
dynamic load in the specimen at 3 Hz frequency. The effect of temperature was
not taken into consideration for the current fatigue study. The machine records
the deflection, time and the number cycles for each stress ratio. Three specimens
were tested for each set of stress amplitude. Initially a static flexural test was
performed to determine the maximum flexural strength for the current span to
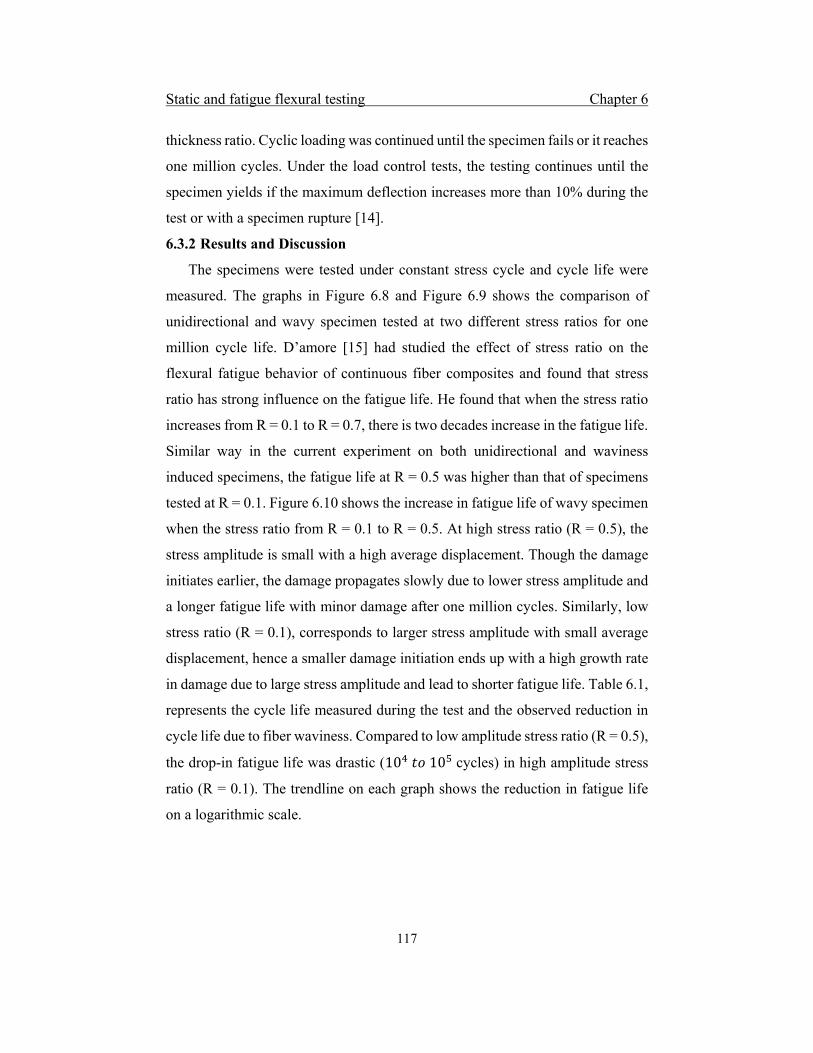
Static and fatigue flexural testing Chapter 6
117
thickness ratio. Cyclic loading was continued until the specimen fails or it reaches
one million cycles. Under the load control tests, the testing continues until the
specimen yields if the maximum deflection increases more than 10% during the
test or with a specimen rupture [14].
6.3.2 Results and Discussion
The specimens were tested under constant stress cycle and cycle life were
measured. The graphs in Figure 6.8 and Figure 6.9 shows the comparison of
unidirectional and wavy specimen tested at two different stress ratios for one
million cycle life. D’amore [15] had studied the effect of stress ratio on the
flexural fatigue behavior of continuous fiber composites and found that stress
ratio has strong influence on the fatigue life. He found that when the stress ratio
increases from R = 0.1 to R = 0.7, there is two decades increase in the fatigue life.
Similar way in the current experiment on both unidirectional and waviness
induced specimens, the fatigue life at R = 0.5 was higher than that of specimens
tested at R = 0.1. Figure 6.10 shows the increase in fatigue life of wavy specimen
when the stress ratio from R = 0.1 to R = 0.5. At high stress ratio (R = 0.5), the
stress amplitude is small with a high average displacement. Though the damage
initiates earlier, the damage propagates slowly due to lower stress amplitude and
a longer fatigue life with minor damage after one million cycles. Similarly, low
stress ratio (R = 0.1), corresponds to larger stress amplitude with small average
displacement, hence a smaller damage initiation ends up with a high growth rate
in damage due to large stress amplitude and lead to shorter fatigue life. Table 6.1,
represents the cycle life measured during the test and the observed reduction in
cycle life due to fiber waviness. Compared to low amplitude stress ratio (R = 0.5),
the drop-in fatigue life was drastic (10 10 cycles) in high amplitude stress
ratio (R = 0.1). The trendline on each graph shows the reduction in fatigue life
on a logarithmic scale.
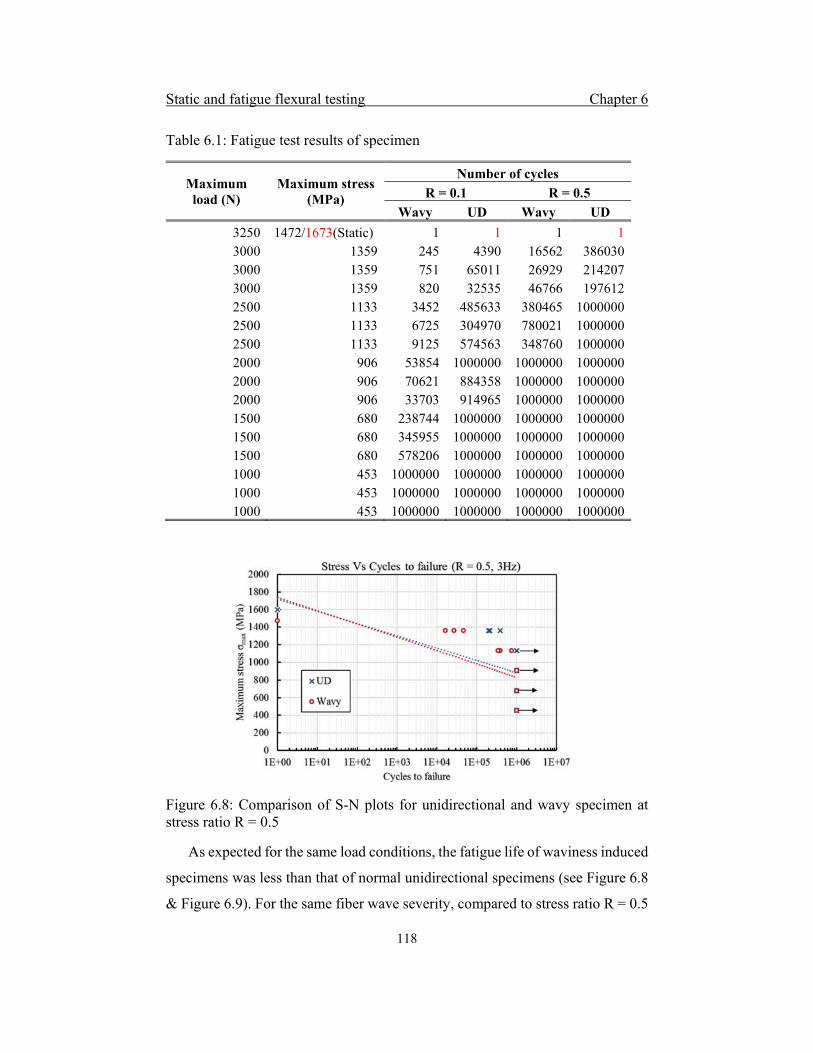
Static and fatigue flexural testing Chapter 6
118
Table 6.1: Fatigue test results of specimen
Maximum load (N)
Maximum stress (MPa)
Number of cycles
R = 0.1 R = 0.5
Wavy UD Wavy UD
3250 1472/1673(Static) 1 1 1 1 3000 1359 245 4390 16562 386030 3000 1359 751 65011 26929 214207 3000 1359 820 32535 46766 197612 2500 1133 3452 485633 380465 1000000 2500 1133 6725 304970 780021 1000000 2500 1133 9125 574563 348760 1000000 2000 906 53854 1000000 1000000 1000000 2000 906 70621 884358 1000000 1000000 2000 906 33703 914965 1000000 1000000 1500 680 238744 1000000 1000000 1000000 1500 680 345955 1000000 1000000 1000000 1500 680 578206 1000000 1000000 1000000 1000 453 1000000 1000000 1000000 1000000 1000 453 1000000 1000000 1000000 1000000 1000 453 1000000 1000000 1000000 1000000
Figure 6.8: Comparison of S-N plots for unidirectional and wavy specimen at stress ratio R = 0.5
As expected for the same load conditions, the fatigue life of waviness induced
specimens was less than that of normal unidirectional specimens (see Figure 6.8
& Figure 6.9). For the same fiber wave severity, compared to stress ratio R = 0.5

Static and fatigue flexural testing Chapter 6
119
the drop-in fatigue life trend is higher at R = 0.1. At R = 0.5, the approximate
reduction in the endurance stress for the wavy specimens compared to
unidirectional is 5% (considering 106 as cycle life). Similarly, at R = 0.1, the
reduction in endurance stress for the wavy specimen is 25%. Hence for the same
wave severity, the fatigue life of wavy specimens (see Figure 6.11) decreases
more than that of unidirectional specimens with decrease in stress ratio (from R
= 0.5 to R = 0.1).
Figure 6.9: Comparison of S-N plots for unidirectional and wavy specimen at stress ratio R = 0.1
Figure 6.10: Comparison of S-N plots for wavy specimens at stress ratio R = 0.1
and 0.5.

Static and fatigue flexural testing Chapter 6
120
Figure 6.11 shows the damage observed on the tension side and compression
side of the four-different waviness induced specimens at a stress ratio R = 0.1.
On the tension side, the damage is due to fiber-matrix debonding and outer layer
delamination and on compression side, the damage is due to fiber micro-buckling.
At lower stresses, the damage is more on the tension side as compared to
compression side. For specimen that completes one million cycles, there is little
damage on the compression side but fiber strand debonding is visible over tension
side. Similar type of damage is found in specimens tested at R = 0.5 as well.
Hence for both the stress ratios at R = 0.5 and R = 0.1, the damage on the tension
side was more severe as compared to compression side.
Figure 6.11: The visible damage on failed specimens over the outer (in tension) and inner (in compression) surface at various loads.
A comparison study on the failure modes was done between the
unidirectional and waviness defect containing specimens that completed one
million cycles. As discussed earlier, compared to compression side, more damage
was seen on the tension side in both the specimens. From Figure 6.12, it is evident
that unidirectional specimen was damaged due to fiber matrix debonding at the
middle region of the specimen (on tension side). But for wavy specimen, fiber
strand debonding was the major failure mode on the tension side and this could

Static and fatigue flexural testing Chapter 6
121
be reflected over the compression side as well. A laser shearography analysis was
performed on the damaged surface and found that compared to the surface
damage on the unidirectional specimen, more internal damages occurred on the
wavy specimen due to strand debonding (see Figure 6.13). From the earlier
research, it was found that unidirectional laminates at high stress amplitude (R =
0.1) were failed due to damage over the tension side and the major failure mode
observed was fiber matrix debonding and delamination [16]. Similar failure mode
was observed for unidirectional specimen but not for wavy specimen.
Figure 6.12: Comparison between unidirectional and wavy specimen
Figure 6.13: Laser shearography over the damaged area.
X-ray tomography scanning was done on the same (damaged) area to
visualize the internal damage (see Figure 6.14 and Figure 6.15). The
delamination failure on the tension side of the unidirectional specimen is clear
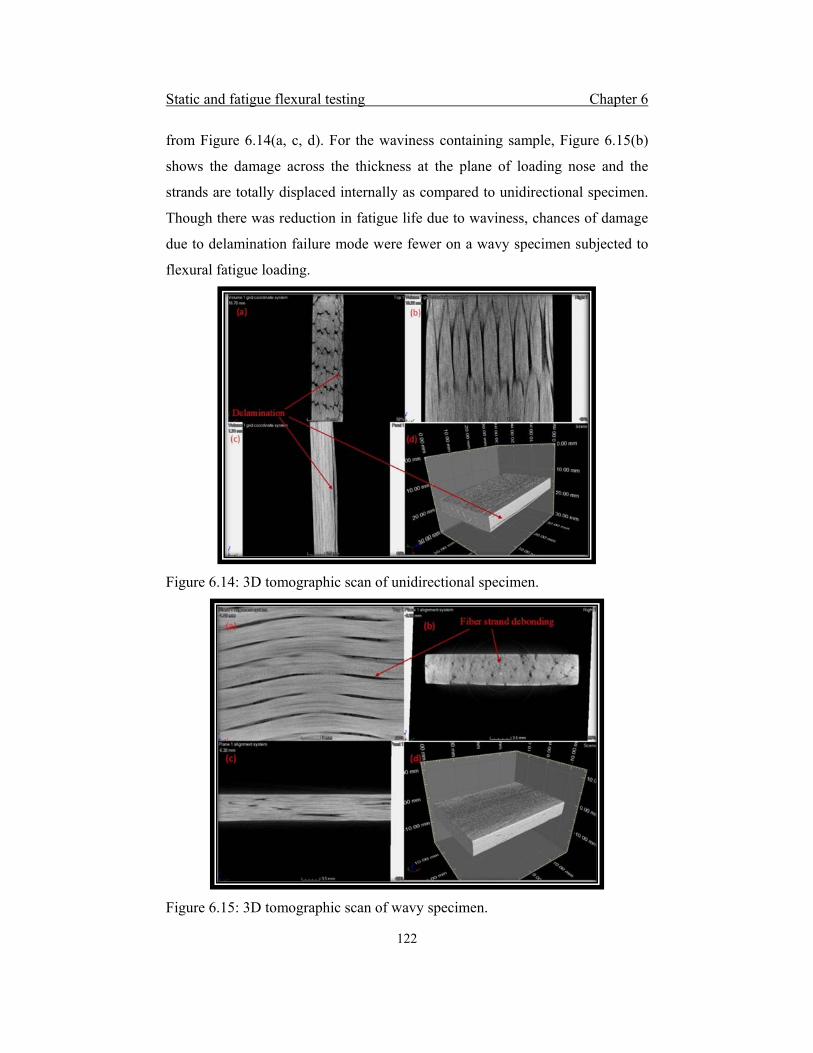
Static and fatigue flexural testing Chapter 6
122
from Figure 6.14(a, c, d). For the waviness containing sample, Figure 6.15(b)
shows the damage across the thickness at the plane of loading nose and the
strands are totally displaced internally as compared to unidirectional specimen.
Though there was reduction in fatigue life due to waviness, chances of damage
due to delamination failure mode were fewer on a wavy specimen subjected to
flexural fatigue loading.
Figure 6.14: 3D tomographic scan of unidirectional specimen.
Figure 6.15: 3D tomographic scan of wavy specimen.
Static and fatigue flexural testing Chapter 6
123
6.4 Summary
Static and fatigue flexural testing were performed on the in-plane wavy
specimen. From the static flexural analysis, a reduction of 35% in flexural
strength and 16% in flexural modulus were found due to 0.035 wave severity. A
change in the failure modes were observed due to fiber waviness under static
flexural loading. Flexural fatigue analysis was studied at two different stress
ratios (R = 0.1 and R = 0.5). It was found that both fiber waviness and stress ratio
has dependence on the cyclic life. In fatigue experiment, a delamination failure
mode was found on the tension side of the unidirectional specimen. But for wavy
specimen, a fiber strand debonding was the major mode of failure.
References
[1]. M. R. Wisnom, The Effect of Fiber Waviness on the Relationship between
Compressive and Flexural Strengths of Unidirectional Composites.
Journal of Composite Materials, 1994. 28(1): p. 66-76.
[2]. W. Chan and C. Chou, Effects of delamination and ply fiber waviness on
effective axial and bending stiffnesses in composite laminates. Composite
structures, 1995. 30(3): p. 299-306.
[3]. H. J. Chun, J. Y. Shin, and I. Daniel, Nonlinear behaviors of thick
composite materials with fiber waviness. 1999.
[4]. N. A. Fleck and D. Q. Liu, Microbuckle initiation from a patch of large
amplitude fibre waviness in a composite under compression and bending.
European Journal of Mechanics a-Solids, 2001. 20(1): p. 23-37.
[5]. B. D. Allison and J. L. Evans, Effect of fiber waviness on the bending
behavior of S-glass/epoxy composites. Materials & Design, 2012. 36: p.
316-322.
[6]. ASTM, D 7264/D 7261M–07, in Standard test method for flexural
properties of polymer matrix composite materials.
[7]. K. Potter, et al., Variability, fibre waviness and misalignment in the
determination of the properties of composite materials and structures.
Static and fatigue flexural testing Chapter 6
124
Composites Part A: Applied Science and Manufacturing, 2008. 39(9): p.
1343-1354.
[8]. B. D. Davidson, R. Kruger, and M. Konig, Effect of stacking sequence on
energy release rate distributions in multidirectional DCB and ENF
specimens. Engineering Fracture Mechanics, 1996. 55(4): p. 557-569.
[9]. F. Wu and W. Yao, A fatigue damage model of composite materials.
International Journal of Fatigue, 2010. 32(1): p. 134-138.
[10]. R. Sakin, I. Ay, and R. Yaman, An investigation of bending fatigue
behavior for glass-fiber reinforced polyester composite materials.
Materials & Design, 2008. 29(1): p. 212-217.
[11]. G. Belingardi and M. P. Cavatorta, Bending fatigue stiffness and strength
degradation in carbon–glass/epoxy hybrid laminates: Cross-ply vs.
angle-ply specimens. International journal of fatigue, 2006. 28(8): p. 815-
825.
[12]. D. O. Adams and M. W. Hyer, Effects of Layer Waviness on the
Compression Fatigue Performance of Thermoplastic Composite
Laminates. International Journal of Fatigue, 1994. 16(6): p. 385-391.
[13]. S. Hörrmann, et al., The effect of fiber waviness on the fatigue life of
CFRP materials. International Journal of Fatigue, 2016. 90: p. 139-147.
[14]. ASTM D7774-17,Standard Test Method for Flexural Fatigue Properties
of Plastics, in ASTM International. 2017: West Conshohocken, PA.
[15]. A. D'amore, et al., Effect of stress ratio on the flexural fatigue behaviour
of continuous strand mat reinforced plastics. Science and Engineering of
Composite Materials, 1996. 5(1): p. 1-8.
[16]. G. Caprino and A. D'Amore, Flexural fatigue behaviour of random
continuous-fibre-reinforced thermoplastic composites. Composites
Science and Technology, 1998. 58(6): p. 957-965.
Analysis of wind turbine blade with fiber waviness Chapter 7
125
Analysis of a wind turbine blade with a fiber waviness
defect on spar-cap
In this chapter, the basic blade design procedure is presented. A
frame work design of a blade with 6 m blade radius based on an
existing aero-elastic turbine model using NuMAD tool is explained.
A flap-wise bending analysis of the blade shell form in ABAQUS
software is carried out to study the effect of waviness on spar-cap
region. To further understand and validate the influence of fiber
waviness under bending on both pressure side and suction side of the
blade, a four-point bending experiment is performed on a composite
I - beam with fiber waviness on top and bottom of the flange.
7.1 Introduction
Wind turbine blade is an aerodynamic structure which carries load in both
flap-wise and edgewise direction. The aerodynamic shape consists of two parts
namely suction side and pressure side. The upper shell of the blade portion is
suction side and the lower shell is the pressure side. The spar-cap in the
aerodynamic structure is considered as the primary load caring member and most
of the modern wind turbine spar-caps are made up of laminated composites.
7.2 Design procedure
In this section, the details of parameters to be considered for a basic blade
design are explained. The bending moment data is taken from an existing 6 m
radius blade model developed by Energy Research Institute at NTU (ERIAN).
The design consists of an aero-elastic model developed using FAST software at
gust wind speed for 50 years of recurrence period. From the existing design, the

Analysis of wind turbine blade with fiber waviness Chapter 7
126
bending moment data at different sections of the beam based model was derived.
Subsequently, an approximate blade thickness was calculated for the maximum
tip deflections. Based on the existing design and with the help of NuMAD
software, a blade profile was generated. The generated profile then transferred to
ABAQUS and a static flap-wise bending analysis was performed by applying a
load equivalent to the derived bending moment at selected sections of the blade.
An optimum spar-cap thickness was calculated based on the allowed tip
deflection. For the current Abaqus shell model, fiber waviness defect was
introduced at four different spar cap locations of the blade. The effect of the
waviness was studied by considering the waviness on both suction side and
pressure side.
For wind turbines, IEC 61400-1 [1] was followed for design evaluation and
testing. The design is subdivided into another category called small wind turbines
(SWT) (IEC 61400-2) [2] with rotor swept area of less than or equal to 200 m2.
The present wind turbine design comes under class IV with average wind speed
( 6 m/s. The class was selected based on the wind condition, environment
condition and electrical load conditions.
7.2.1 Structural design
It includes the verification of the whole structural integrity of turbine
components in the critical load path from bottom foundation to top blade tip
comprising of rotor blade, hub, shaft, tower, nacelle, yaw haft and connections.
The design loads can be determined by a) simplified load methodology b)
simulation model or by c) full scale measurement. For the existing developed
model, a simulation model methodology was followed with the help of FAST
software [3]. FAST is an aerodynamic computer-aided engineering tool used to
design horizontal axis wind turbines (HAWT). FAST is a cluster of different
dynamic models, which are coupled through modular interfaces. The loads acting
on the wind turbine consists of vibrations, gravitational load, aerodynamic loads,
operational loads, etc. A partial safety factor of 1.35 was considered for the
ultimate loads to account the uncertainty in load estimation process.
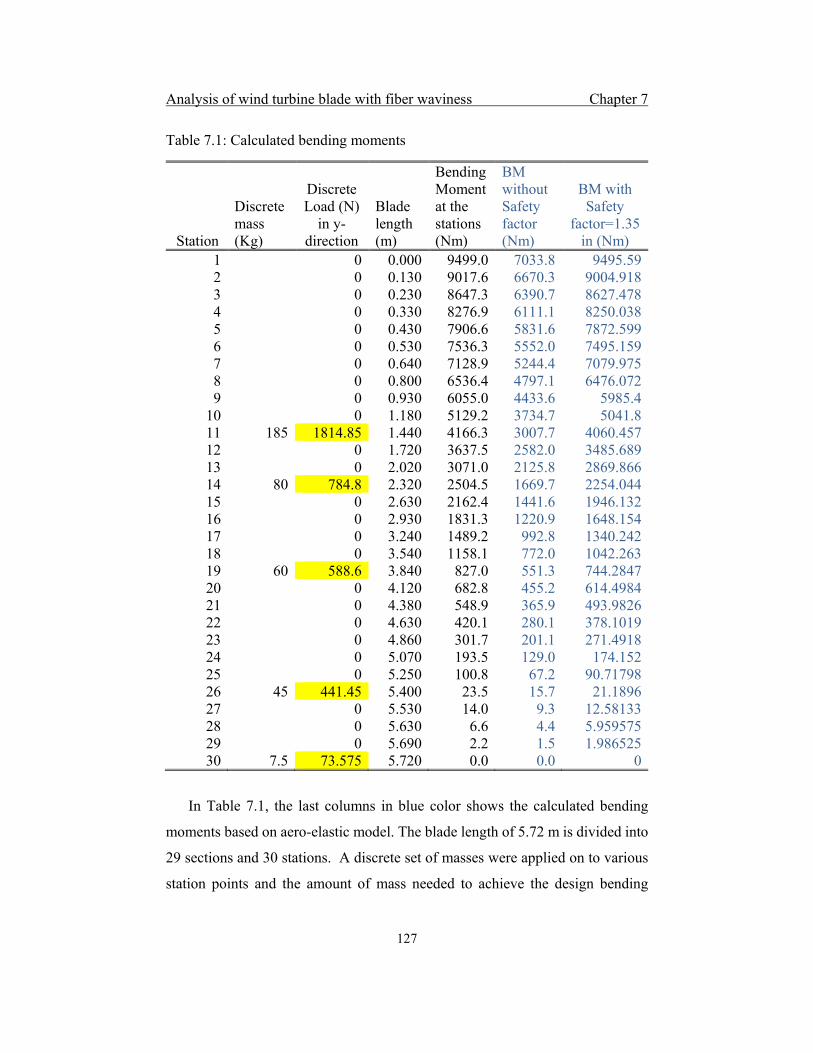
Analysis of wind turbine blade with fiber waviness Chapter 7
127
Table 7.1: Calculated bending moments
Station
Discrete mass (Kg)
Discrete Load (N)
in y-direction
Blade length (m)
Bending Moment at the stations (Nm)
BM without Safety factor (Nm)
BM with Safety
factor=1.35 in (Nm)
1 0 0.000 9499.0 7033.8 9495.59 2 0 0.130 9017.6 6670.3 9004.918 3 0 0.230 8647.3 6390.7 8627.478 4 0 0.330 8276.9 6111.1 8250.038 5 0 0.430 7906.6 5831.6 7872.599 6 0 0.530 7536.3 5552.0 7495.159 7 0 0.640 7128.9 5244.4 7079.975 8 0 0.800 6536.4 4797.1 6476.072 9 0 0.930 6055.0 4433.6 5985.4
10 0 1.180 5129.2 3734.7 5041.8 11 185 1814.85 1.440 4166.3 3007.7 4060.457 12 0 1.720 3637.5 2582.0 3485.689 13 0 2.020 3071.0 2125.8 2869.866 14 80 784.8 2.320 2504.5 1669.7 2254.044 15 0 2.630 2162.4 1441.6 1946.132 16 0 2.930 1831.3 1220.9 1648.154 17 0 3.240 1489.2 992.8 1340.242 18 0 3.540 1158.1 772.0 1042.263 19 60 588.6 3.840 827.0 551.3 744.2847 20 0 4.120 682.8 455.2 614.4984 21 0 4.380 548.9 365.9 493.9826 22 0 4.630 420.1 280.1 378.1019 23 0 4.860 301.7 201.1 271.4918 24 0 5.070 193.5 129.0 174.152 25 0 5.250 100.8 67.2 90.71798 26 45 441.45 5.400 23.5 15.7 21.1896 27 0 5.530 14.0 9.3 12.58133 28 0 5.630 6.6 4.4 5.959575 29 0 5.690 2.2 1.5 1.986525 30 7.5 73.575 5.720 0.0 0.0 0
In Table 7.1, the last columns in blue color shows the calculated bending
moments based on aero-elastic model. The blade length of 5.72 m is divided into
29 sections and 30 stations. A discrete set of masses were applied on to various
station points and the amount of mass needed to achieve the design bending
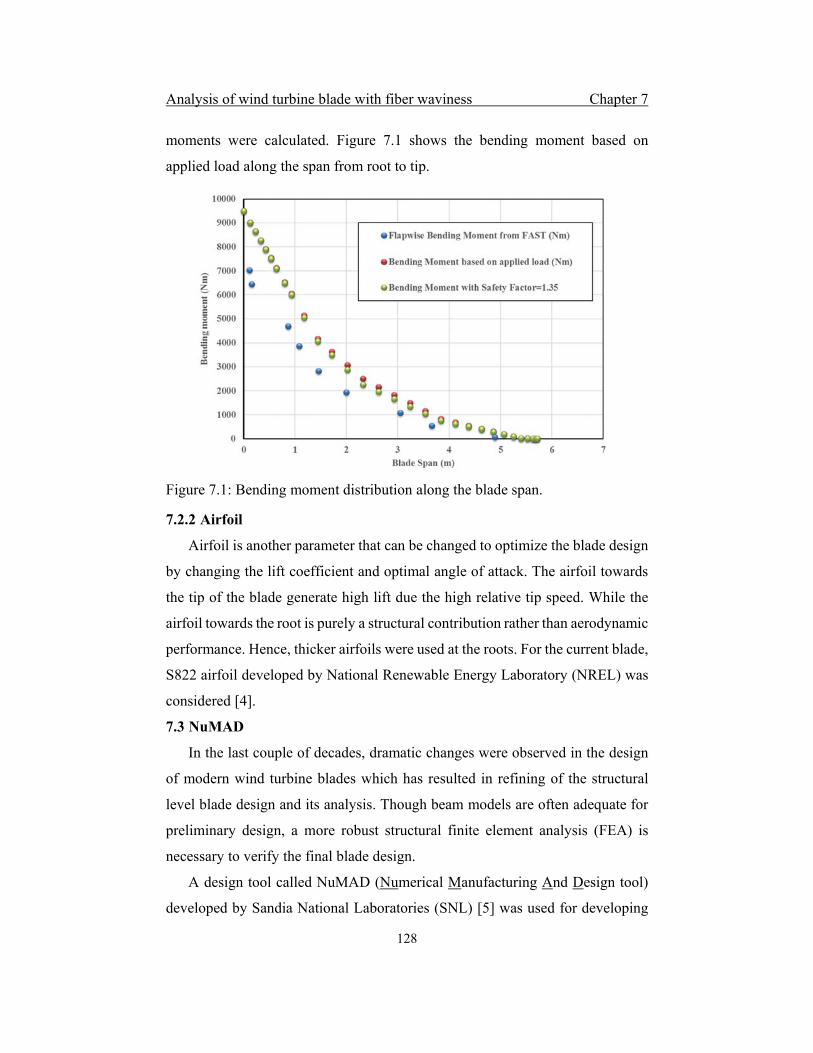
Analysis of wind turbine blade with fiber waviness Chapter 7
128
moments were calculated. Figure 7.1 shows the bending moment based on
applied load along the span from root to tip.
Figure 7.1: Bending moment distribution along the blade span.
7.2.2 Airfoil
Airfoil is another parameter that can be changed to optimize the blade design
by changing the lift coefficient and optimal angle of attack. The airfoil towards
the tip of the blade generate high lift due the high relative tip speed. While the
airfoil towards the root is purely a structural contribution rather than aerodynamic
performance. Hence, thicker airfoils were used at the roots. For the current blade,
S822 airfoil developed by National Renewable Energy Laboratory (NREL) was
considered [4].
7.3 NuMAD
In the last couple of decades, dramatic changes were observed in the design
of modern wind turbine blades which has resulted in refining of the structural
level blade design and its analysis. Though beam models are often adequate for
preliminary design, a more robust structural finite element analysis (FEA) is
necessary to verify the final blade design.
A design tool called NuMAD (Numerical Manufacturing And Design tool)
developed by Sandia National Laboratories (SNL) [5] was used for developing

Analysis of wind turbine blade with fiber waviness Chapter 7
129
the three-dimensional architectural design of the blade. NuMAD provides an
intuitive interface for defining the outer blade geometry, shear web locations in
the blade. Later, the complete 3D architecture transferred into any finite element
analysis package (presently ABAQUS). Once the model is imported, a static
analysis was done to understand the strength and response of the blade.
Initially, blade was divided into a set of station along the length from root to
tip. The hub radius is 250 mm. The blade root starts at station point 1 with blade
span coordinate 0.27 mm and ends at 5.99 mm. Based on the station, parameters
such as generalized airfoil coordinates, station location from root, maximum
chord length, twist angle and aero dynamic center were added into the design tool
to generate the blade profile (Table 7.2). Each airfoil shape then partitioned into
different zone such as root, leading edge, trailing edge, spar-cap and shear web
for the easy selection of parameters during FE analysis.
Table 7.2: Blade airfoil parameters along the blade span.
Station Blade span (m) Twist (deg) Chord (m) aero center
1 0.27 20.59 0.20 0.500 2 0.40 18.35 0.20 0.500 3 0.50 16.04 0.20 0.500 4 0.60 13.50 0.24 0.267 5 0.70 12.70 0.33 0.267 6 0.80 11.50 0.39 0.267 7 0.91 10.90 0.41 0.267 8 1.07 9.02 0.43 0.267 9 1.20 8.44 0.41 0.267
10 1.45 7.02 0.39 0.267 11 1.71 5.81 0.37 0.267 12 1.99 4.75 0.34 0.267 13 2.29 3.83 0.32 0.267 14 2.59 3.04 0.29 0.267 15 2.90 2.36 0.27 0.267 16 3.20 1.77 0.25 0.267 17 3.51 1.28 0.23 0.267 18 3.81 0.86 0.21 0.267 19 4.11 0.51 0.19 0.267 20 4.39 0.23 0.18 0.267
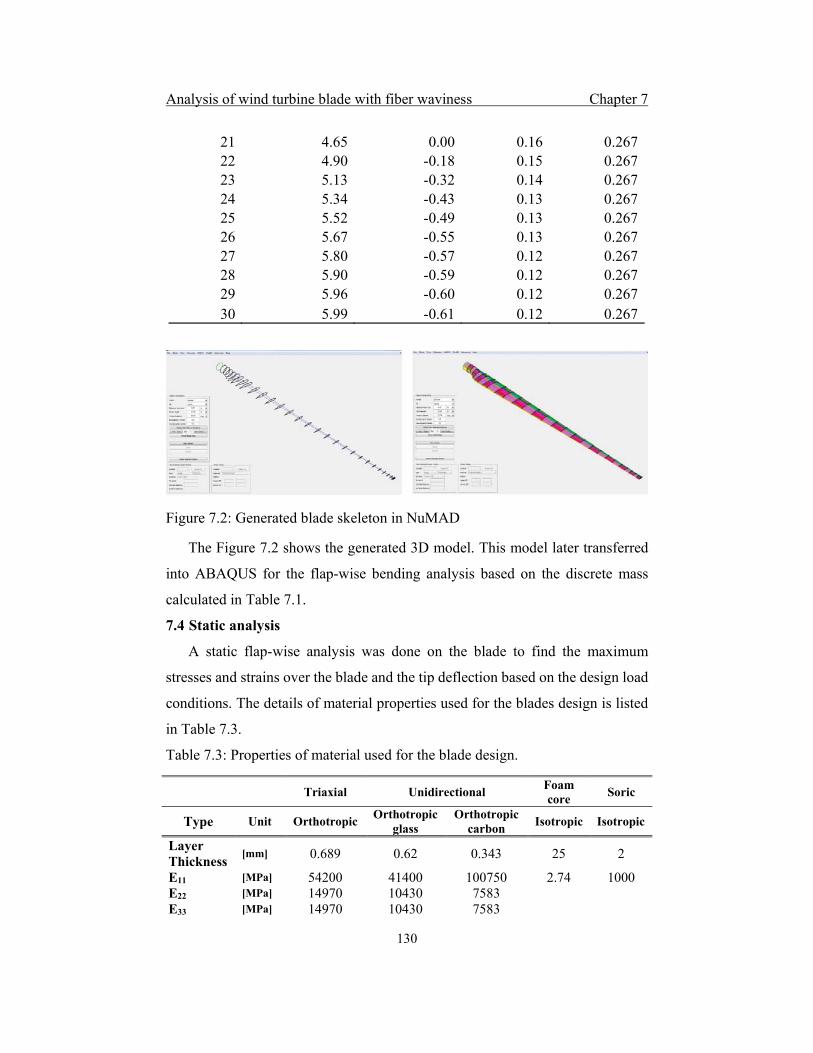
Analysis of wind turbine blade with fiber waviness Chapter 7
130
21 4.65 0.00 0.16 0.267 22 4.90 -0.18 0.15 0.267 23 5.13 -0.32 0.14 0.267 24 5.34 -0.43 0.13 0.267 25 5.52 -0.49 0.13 0.267 26 5.67 -0.55 0.13 0.267 27 5.80 -0.57 0.12 0.267 28 5.90 -0.59 0.12 0.267 29 5.96 -0.60 0.12 0.267 30 5.99 -0.61 0.12 0.267
Figure 7.2: Generated blade skeleton in NuMAD
The Figure 7.2 shows the generated 3D model. This model later transferred
into ABAQUS for the flap-wise bending analysis based on the discrete mass
calculated in Table 7.1.
7.4 Static analysis
A static flap-wise analysis was done on the blade to find the maximum
stresses and strains over the blade and the tip deflection based on the design load
conditions. The details of material properties used for the blades design is listed
in Table 7.3.
Table 7.3: Properties of material used for the blade design.
Triaxial Unidirectional Foam core
Soric
Type Unit Orthotropic Orthotropic
glassOrthotropic
carbonIsotropic Isotropic
Layer Thickness
[mm] 0.689 0.62 0.343 25 2
E11 [MPa] 54200 41400 100750 2.74 1000 E22 [MPa] 14970 10430 7583 E33 [MPa] 14970 10430 7583

Analysis of wind turbine blade with fiber waviness Chapter 7
131
G12 [MPa] 9970 3335 5446 30 26 G23 [MPa] 8970 3472 2964 G13 [MPa] 9970 3472 2964 υ12 [-] 0.37 0.28 0.32 0.3 0.3 υ23 [-] 0.35 0.4 0.37 υ13 [-] 0.32 0.3 0.35 density [kg/m3] 1550 1550 1550 100 470
Each region of the blade was stacked with different layup sequence. The spar-
cap was made up of gradually decreasing stacking sequence from the root to tip.
At the maximum thickness area, 11 layers of laminates with thickness 6.12 mm
were used. When it reaches to the tip area, the number of layers reduced to two
with thickness 1.37 mm. Table 7.4 represents the stacking sequence and the
material used at different locations of the blade.
Table 7.4: Stacking sequence at various blade region.
Location Material Number of layers Rotation angle
Root
Triaxial 1 0/+45/-45 Unidirectional glass 3 0 Unidirectional carbon 3 0 Unidirectional glass 3 0 Triaxial 1 0/+45/-45
Shear web
Unidirectional carbon 1 +45 Unidirectional carbon 1 -45 Foam core 1 0 Unidirectional carbon 1 -45 Unidirectional carbon 1 +45
Shell Triaxial 1 0/+45/-45 Soric 1 0 Triaxial 1 0/+45/-45
Spar cap near to root
Triaxial 1 0/+45/-45 Unidirectional glass 3 0 Unidirectional carbon 3 0 Unidirectional glass 3 0 Triaxial 1 0/+45/-45
Spar cap at tip Triaxial 1 0/+45/-45 Triaxial 1 0/+45/-45
The whole 5.72 m blade model was sweep meshed with a 0.5 mm shell
element S4R. The root surface was constraint to one reference point at the center
of the root with zero degrees of freedom. The stations 11, 14, 19, 26 and 30 were
selected for applying the load in the flap-wise direction with a magnitude of

Analysis of wind turbine blade with fiber waviness Chapter 7
132
1814.85 N, 784.8 N, 588.6 N, 441.45 N and 73.575 N respectively (Table 7.1).
The loads were applied from the pressure side of the blade through a reference
point, which act as a locus of all the surface airfoil coordinates of the loading
station (see Figure 7.3).
Figure 7.3: Boundary conditions for the blade loaded in flap-wise direction.
Abaqus/standard analysis was performed and the tip deflection, maximum
Von-Mises stresses were estimated from the stress plot.
Figure 7.4: Stress plot of the blade at maximum deflection.
From the visualization module, a stress concentration was observed at the
root transition region of pressure side with a maximum stress of 125 MPa (see
Figure 7.4). A tip deflection of 54.4 cm was calculated for the applied load based
on maximum bending moment. As per IEC 61400 – 2[2] no part of the blade
shall hit the tower under the most severe bending moment distribution for the
design load cases and the observed tip deflection was within the safe limit.

Analysis of wind turbine blade with fiber waviness Chapter 7
133
7.4.1 Influence of waviness at spar-cap region
In the past research, fiber waviness defects were found on failed blades [6, 7].
This manufacturing defect, as explained thoroughly in this thesis, could lead to
the strength and stiffness drop and failure of the whole structure [8, 9]. By
considering this fact into account, currently the effect of fiber waviness at various
spar-cap region was studied with the help of ABAQUS simulation. A through
thickness in-plane fiber waviness was chosen with a wave severity of 0.07 (with
wavelength 65 mm and amplitude 4.55 mm) that is typically observed in the
actual blade[7] was introduced on spar-cap region at center zone (approx. 3 m
from root section) and transition zone (near to root section) separately. An
Abaqus/standard analysis was performed with the same design load and
boundary conditions. Since the blade consist of two spar-caps each at suction side
and pressure side, analysis of those four sets were performed separately. Table
7.5 outlined the waviness location and Figure 7.5 shows the induced waviness at
center zone and transition region of the blade model.
Table 7.5: Waviness location
Region
Waviness
location
Wave
severity
Tip deflection (m)
No waviness 0 0.544
Spar-cap
Pressure side Transition zone 0.07 0.596
Center zone 0.07 0.601
Suction side Transition zone 0.07 0.548
Middle zone 0.07 0.548

Analysis of wind turbine blade with fiber waviness Chapter 7
134
Figure 7.5: Blade spar-cap with fiber waviness a) Waviness at the middle region, b) Waviness at the transition region.
It was found that for the same load condition, the waviness defect over
pressure side causes additional tip deflection of 48 mm to 53 mm as compared to
the waviness at suction side (see Figure 7.6). While bending, the outer surface of
a beam elongates more, hence during flap-wise bending the outer layer at the
pressure side would strain more as compared to inner layer at the suction side.
From the experimental study conducted in previous chapters, it was found that a
through thickness in-plane waviness reduces the stiffness properties while
bending. Due to higher strain deformation at pressure side and the stiffness
reduction of the waviness affected area, causes an additional bending with an
extra tip deflection was observed.
Figure 7.6: Effect of waviness at transition and middle region over the tip deflection.

Analysis of wind turbine blade with fiber waviness Chapter 7
135
From the deflection graph along the blade length shown in Figure 7.7, it was
confirmed that the additional deflection is caused due to the reduction in material
stiffness at the waviness induced region. The waviness at the transition region
caused the blade an additional deflection right after the transition region.
Similarly, a waviness at the mid region on the spar-cap, cause the blade to deviate
from the normal deflection path and finish with an additional tip deflection. In
the stress plot, a stress concentration was observed and the maximum stress over
the structure shifted towards that waviness affected region.
Figure 7.7: Blade tip deflection because of waviness at the pressure side.
Figure 7.8: Location of strain measurement from element node at region 1 and 2.

Analysis of wind turbine blade with fiber waviness Chapter 7
136
Under the design load condition, the maximum stress and maximum strain
was found concentrated at the waviness region of the blade. To understand the
strain variation over the section along the blade thickness, surface true strains of
the waviness affected regions were calculated from the nodal points in the model.
At the waviness induced blade central spar-cap region, two strain values were
measured from the region 1 and region 2 as shown in Figure 7.8. In addition, a
third strain value was measured from the opposite face of the waviness induced
region.
Figure 7.9: The strain across the cross section at the waviness effected area of the blade model, a) waviness at the spar-cap on blade top (suction side), b) Waviness at the spar-cap on blade bottom (Pressure side).
The pressure side of the blade would be under tension, and the suction side
would be under compression during the flap-wise bending analysis. For a beam
in bending, the outer layer strain would be more than the inner layer strain due to
the difference in the radius of curvature. In addition to that, when the waviness
affects the outer layer (pressure side), the increase in layer compliance causes
further increase in strain at the waviness affected region of the outer layer. Figure
7.9 shows the measured strain from the model at the outer and inner layer of the
spar-cap based on the waviness location. To validate the measured strain

Analysis of wind turbine blade with fiber waviness Chapter 7
137
behavior from the FE simulation, a flexural study had been conducted on a
composite I-beam with waviness at outer and inner flange separately.
7.5 Composite I-beam
Spar-cap is the main load bearing component in a blade structure and an I –
section was used to model the spar-cap and shear web of the blade. Irrespective
of various design concept, the key responsibility of the spar-cap is to provide the
required bending strength and stiffness. Considering the waviness effected
middle region of the current spar-cap design, 4 mm thick laminates were
presented with majority of unidirectional GFRP with a cross section of
approximately 80 mm thick at the root and 3 to 5 mm thick at the tip. To validate
the simulation results, an I-beam with six layers (≈3.72 mm) of unidirectional
GFRP laminate at top and bottom flange with a polyurethane (PU) foam as web
(height – 50 mm, density – 100kg/m3) were made using the same material used
for the blade model. Each I-beam measured an average height of 57.45 mm. In
the blade model, the center of the spar-cap is approximately 60 mm thick and
consists of 6 layers of unidirectional layers at top and bottom flange. The
dimension of the I-beam is approximately equal to the model blade cross
sectional dimension at the mid span. A four-point bending analysis has been
performed on the I-beam with span length of 250 mm, width 50 mm and load
span of one third of the span length (83.33 mm). The maximum strain over the
beam will always be at the point of maximum bending moment. As shown in
Figure 7.10, a through thickness in-plane waviness was introduced at the middle
of the beam flange.
Figure 7.10: A composite I-beam with waviness at the top and bottom flange.

Analysis of wind turbine blade with fiber waviness Chapter 7
138
The flexural experiments were conducted by considering the waviness on
both tension side and compression side separately. Strain over the top surface and
bottom surface were measured using bonded strain gages. Over the waviness
induced area, two set of strains were measured at upper and lower region. Four
set of specimens were tested separately by considering waviness at the top flange
and at the bottom flange.
Figure 7.11: (a) Experiment set up with waviness at the bottom of the beam, (b) bonded strain gages.
The tests were conducted at a speed of 1 mm/min and the strains were
measured using a datalogger. Both longitudinal and lateral strain were measured
with a bonded strain gage. Over the waviness affected area, two stain gages were
bonded as shown in Figure 7.11 (gage 1 and gage 2). In addition, the third strain
gage (gage 3) was bonded at exactly opposite flange surface of the waviness
region.
7.5.1 Result and discussion
In total, eight I - beams were tested by considering four beams each with fiber
waviness at the top flange and at the bottom flange. Compared to the inner most
layer (in compression), the outer most layer (in tension) strains more due to a
larger radius of curvature at higher deflection. Hence, at a particular load, the
outermost layer has larger strain value (see Figure 7.12) compared to innermost
layer. It is clear from the measured strains 1 and 2 as shown in Figure 7.12,
irrespective of waviness location (top or bottom), the strain rate at the upper
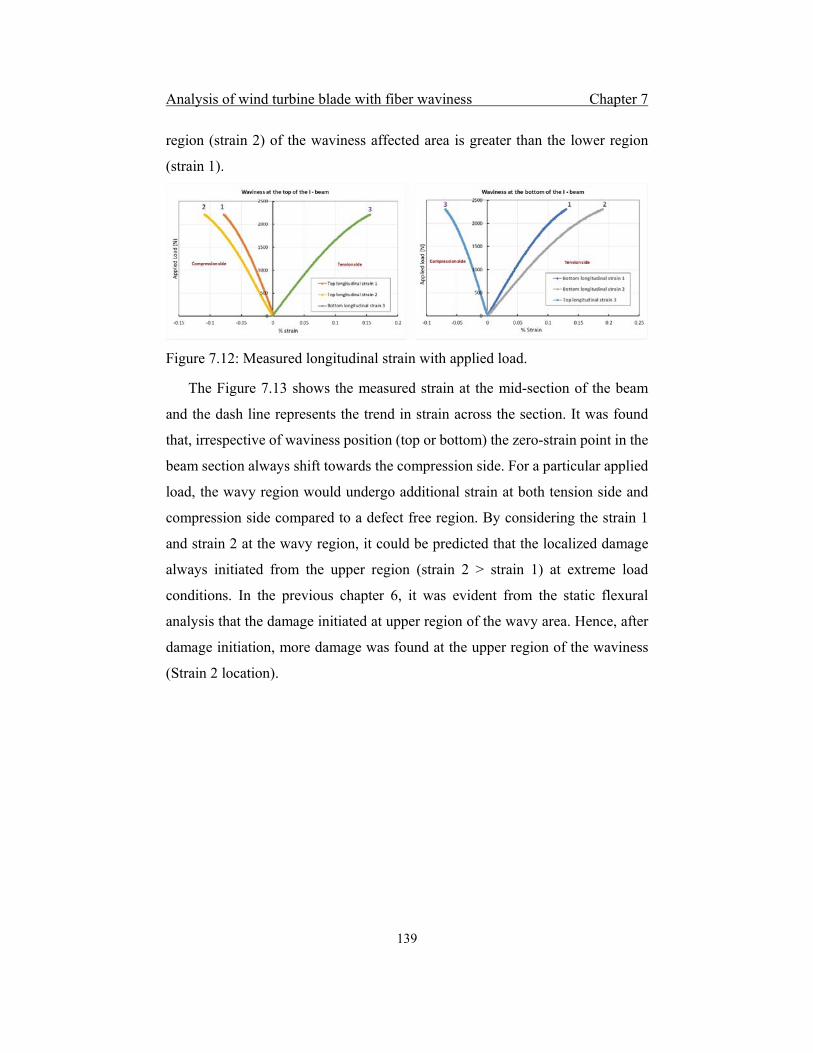
Analysis of wind turbine blade with fiber waviness Chapter 7
139
region (strain 2) of the waviness affected area is greater than the lower region
(strain 1).
Figure 7.12: Measured longitudinal strain with applied load.
The Figure 7.13 shows the measured strain at the mid-section of the beam
and the dash line represents the trend in strain across the section. It was found
that, irrespective of waviness position (top or bottom) the zero-strain point in the
beam section always shift towards the compression side. For a particular applied
load, the wavy region would undergo additional strain at both tension side and
compression side compared to a defect free region. By considering the strain 1
and strain 2 at the wavy region, it could be predicted that the localized damage
always initiated from the upper region (strain 2 > strain 1) at extreme load
conditions. In the previous chapter 6, it was evident from the static flexural
analysis that the damage initiated at upper region of the wavy area. Hence, after
damage initiation, more damage was found at the upper region of the waviness
(Strain 2 location).

Analysis of wind turbine blade with fiber waviness Chapter 7
140
Figure 7.13: Strain along the cross section of the I-beam.
The simple bending theory is only applicable to small deflection. At larger
deflection during bending, the outermost layer strain is greater than that of
innermost layer and causes the neutral axis shift towards the compression side.
For the present experiment, the beam is symmetric with a localized reduction in
stiffness at the waviness effected region. When the waviness comes at top flange
(see Figure 7.13(a)), the compressive strain at the waviness effected top flange
region increases (more negative) and neutral axis shift away from the middle
section. Similarly, when the waviness is at the bottom flange (see Figure 7.13(b)),
the tensile strain at the waviness effected bottom flange region increases (more
positive) and the neutral axis shift towards the compression side. Similar trend
was observed in the cross-sectional strain of ABAQUS blade model (see Figure
7.9).
In Figure 7.14, the numbers 1, 2 and 3 are the measured strain location in the
blade model and the strain gage number in the beam experiment. At compression
side, the strain rate of model was higher than that of experiment, and was due to
the difference in boundary conditions and the applied load. As both load and
boundary conditions were different for model and experiment, the experimental
flexural I - beam analysis helps to understand the strain deformation on a blade
cross section under the influence of fiber waviness.
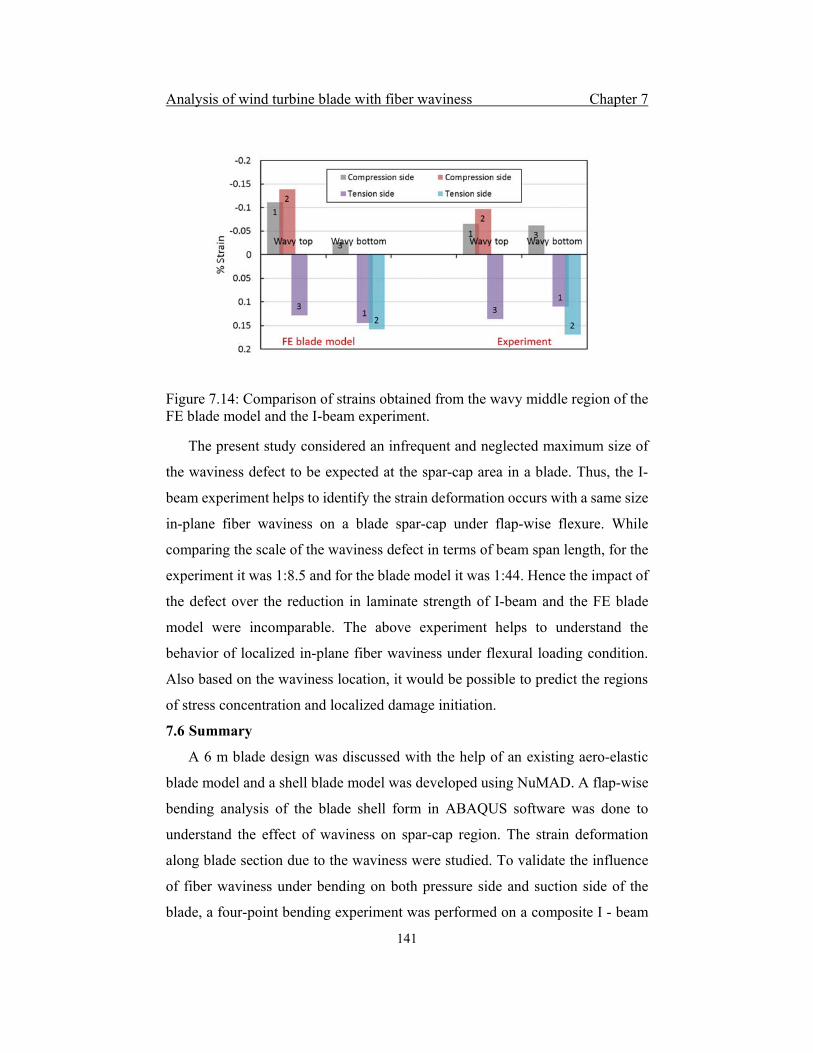
Analysis of wind turbine blade with fiber waviness Chapter 7
141
Figure 7.14: Comparison of strains obtained from the wavy middle region of the FE blade model and the I-beam experiment.
The present study considered an infrequent and neglected maximum size of
the waviness defect to be expected at the spar-cap area in a blade. Thus, the I-
beam experiment helps to identify the strain deformation occurs with a same size
in-plane fiber waviness on a blade spar-cap under flap-wise flexure. While
comparing the scale of the waviness defect in terms of beam span length, for the
experiment it was 1:8.5 and for the blade model it was 1:44. Hence the impact of
the defect over the reduction in laminate strength of I-beam and the FE blade
model were incomparable. The above experiment helps to understand the
behavior of localized in-plane fiber waviness under flexural loading condition.
Also based on the waviness location, it would be possible to predict the regions
of stress concentration and localized damage initiation.
7.6 Summary
A 6 m blade design was discussed with the help of an existing aero-elastic
blade model and a shell blade model was developed using NuMAD. A flap-wise
bending analysis of the blade shell form in ABAQUS software was done to
understand the effect of waviness on spar-cap region. The strain deformation
along blade section due to the waviness were studied. To validate the influence
of fiber waviness under bending on both pressure side and suction side of the
blade, a four-point bending experiment was performed on a composite I - beam
Analysis of wind turbine blade with fiber waviness Chapter 7
142
with fiber waviness on top and bottom flange. The flexural experiment helps to
understand the strain deformation under the influence of in-plane fiber waviness
along the cross section.
References
[1]. I. E. Commission, IEC 61400-1: Wind turbines part 1: Design
requirements, in International Electrotechnical Commission. 2005.
[2]. I. E. Commission, IEC 61400-2:Wind turbines part 2: Small wind
turbines, in International Electrotechnical Commission. 2013.
[3]. J. M. Jonkman and M. L. Buhl Jr, FAST User's Guide-Updated August
2005. 2005, National Renewable Energy Laboratory (NREL), Golden,
CO.
[4]. J. L. Tangler and D. M. Somers, NREL airfoil families for HAWTs. 1995,
National Renewable Energy Lab., Golden, CO (United States).
[5]. D. L. Laird and B. R. Resor, NuMAD User's Manual. 2001: Sandia
National Laboratories.
[6]. J. Mandell, D. Samborsky, and L. Wang. Effects of fiber waviness on
composites for wind turbine blades. in International Sampe Symposium
and Exhibition. 2003. SAMPE; 1999.
[7]. J. W. Nelson, D. S. Cairns, and T. W. Riddle. Manufacturing Defects
Common to Composite Wind Turbine Blades: Effects of Defects. in
Proceedings AIAA Aerospace Science Meeting, Wind Energy Symposium,
Orlando, FL. 2011: p. 1756.
[8]. C. S. Yerramalli, et al. Fiber waviness induced strength knockdowns in
composite materials used in wind turbine blades. in Proceedings of
European wind energy conference and exhibition. 2010.
[9]. H. M. Hsiao and I. M. Daniel, Effect of fiber waviness on stiffness and
strength reduction of unidirectional composites under compressive
loading. Composites Science and Technology, 1996. 56(5): p. 581-593.
Conclusions and future work Chapter 8
143
Conclusions and future work
In this chapter, a summary of the major contributions and
conclusions from all the chapters of this thesis are presented followed
by some recommendations on the future work.
8.1 Conclusions
The thesis was focused on investigating the effects of through thickness in-
plane fiber waviness on the mechanical properties unidirectional FRP laminates.
Coupon level analysis was used to study the various properties in numerical and
experimental method. Finally, a static FE analysis on a blade model was carried
out to understand the waviness effect at the structural level. The main
conclusions from the present investigations are listed below:
Among various types and sizes of waviness defect, a through thickness in-
plane fiber waviness was selected and successfully introduced into
unidirectional laminates. The intensity level of the waviness was represented
with a term called fiber wave severity (Ws). Composite laminates were
prepared with fiber wave severity ranging from 0.01 to 0.075.
o Static compressive analysis of the waviness induced specimens
confirmed that there is a significant reduction in compressive strength as
compared to laminates without waviness defect. Further, the compressive
strength reduced with increase in fiber wave severity. With a severity
level of 0.075, a compressive strength reduction of approximately 75%
were observed.
o Failure characterization was performed on the failed samples using
optical and scanning electron microscopes. As the fiber severity increases,
a transition in failure modes was observed and with increase in fiber wave

Conclusions and future work Chapter 8
144
severity the failure was purely due to micro-bucking followed by fiber
kinking.
Among various failure modes presented in FRP laminates, delamination is a
major mode of failure observed under various loading conditions. The
interlaminar fracture energy of laminates has greater dependence on the
delamination failure.
o A Double Cantilever Beam (DCB) experiment was conducted to
understand the interlaminar resistance for the crack propagation and to
calculate the fracture energy for the crack initiation and crack propagation
under the influence of fiber waviness. For the same, two categories of
specimens were prepared. On one set the waviness defect was at the crack
initiation region and on another set the waviness was at the crack
propagation region. A comparison study was performed with normal
specimens having no waviness defect.
o It was found that compared to normal unidirectional specimens, a
considerable difference in the load-displacement data when the crack
initiate at the waviness region. Fiber waviness causes increase in
compliance of the specimen loading arm. However, no difference in load-
displacement data was observed for specimens with waviness defect at
the crack propagation region.
o Irrespective of waviness defect and the location of defect (initiation
region or propagation region), for the specimens with same geometrical
parameters and initial crack length, unidirectional specimens have
slightly higher average initiation fracture energy compared to waviness
induced specimens.
o Due to waviness, the crack propagation is not uniform along the width of
the specimen. At the upper peak edge of the waviness, crack travels
slowly and at the lower edge crack travels rapidly. There exist a few non-
zero terms in the extensional and bending stiffness matrices due to
waviness. These non-zero terms increase the delamination front curvature

Conclusions and future work Chapter 8
145
compared to normal specimen. A bend-twist coupling exists at the
waviness area due to the non- zero D term in the bending matrix. The
non-uniform crack propagation at the waviness area was due to the
presents of this coupling while bending the loading arm.
An analytical model study was done with the help of constitutive relations
and by considering the fiber waviness as a sinusoidal wave. Effective moduli
were calculated with different fiber wave severity.
The compression experiments were simulated with the help of an FE model
using ABAQUS software. By considering LaRC02 failure criterion, the
failure initiations and instantaneous degradation were successfully predicted
with a final kink band failure. However, at higher fiber severity level, the FE
model showed large differences in the predicted compressive strength.
o A comparison study was done in between analytical, FE model and the
experiment results of the compression analysis. In a compression failure,
shear nonlinearity was one reason for the micro-buckling. A V-notch rail
shear test was conducted to investigate the changes in shear non-linearity
behavior due fiber waviness. The results showed that in-plane shear
behavior does not have much impact on fiber waviness defect. Rather the
failure mode greatly dependent on fiber misalignment.
The major external loads on a wind turbine blade acts in the flap-wise
direction, hence bending is a significant load condition for blades. Both static
and fatigue flexural analyses were performed on standard specimens under
the influence of waviness defect.
o For static flexural analysis, fiber waviness was considered at the middle
region of the standard specimen. The results showed that both bending
stiffness and strength decreases with increase in fiber waviness. For static
experiments at extreme loads, specimen compression side was more
damaged compared to tension side. For waviness defect containing
specimens, kink bands were observed at the compression side. At this
case, the damage initiated at the upper region of the fiber waviness peak.
Conclusions and future work Chapter 8
146
This was explained with the help of bend twist coupling at the waviness
induced region. The twist moment while bending caused a stress
concentration at the peak region of the ‘wave’ followed by damage
initiation.
o Flexural fatigue analysis was performed on the waviness induced
specimens at stress ratios of R = 0.1 and R = 0.5. when the stress ratio
increases from 0.1 to 0.5, the fatigue life increases for both unidirectional
specimen and waviness defect containing specimen. But for a specific
stress ratio and a maximum load, the corresponding fatigue life of wavy
specimen was less than that of unidirectional specimens. At fatigue loads,
for both unidirectional and wavy specimens the observed damages were
more on the tension side as compared to compression side. An X-ray
tomography scanning was performed over the failed area to analyze the
internal damages. For unidirectional specimen, the major damage was
delamination at tension side. Nevertheless, there was no delamination
failure on the defect containing specimen. The major failure were matrix
cracks along the fiber direction and fiber strand debonding.
From these experimental investigations, a specimen level dependency on
waviness under various loading conditions is understood. For understanding
the effects of fiber waviness manufacturing defect at structural level, a static
flexural analysis was performed on an FE blade model. This was based on
calculated design load at extreme wind conditions. Initially a basic wind
turbine blade design was explained and with the help of NuMAD software, a
blade shell model was developed and transferred into Abaqus software for
the static flexural analysis. Based on the optimum tip deflection, the materials
and the layup sequence were finalized from root to tip.
o A fiber waviness defect was introduced in the unidirectional laminates
present at the spar cap region by rotating the elements at the wavy region
along the wavy path. Both transition region and middle region of the
blades at suction side and pressure side were separately analyzed by
Conclusions and future work Chapter 8
147
considering waviness defect. It was found that, during flap-wise bending,
the waviness over the pressure side has greater impact compared to the
waviness over the suction side.
o To validate the above result a bending experiment has been performed on
a composite I-beam with waviness defect at the top flange and bottom
flange separately. The experiment result showed that, at large deflection
conditions the outer flange had more strain deformation compared to the
inner flange. Hence the waviness effected outer flange deform
additionally due to the increase in compliance at the defected region. For
the same load conditions, the strain deformation was lesser when the
waviness presented at the inner flange. Nevertheless, the strain over the
inner flange was more than that of normal unidirectional flange. While
looking on to the strain values over the top and bottom region of the
waviness effected area, the strain was high at the top region of the
waviness peak compared to bottom region. For the blade model at the
waviness effected spar-cap region, the cross-sectional strain trend was
similar to that observed in the experiment.
The present investigation helped to understand the influence of one kind of
fiber waviness manufacturing defect under various loading conditions. The
investigation helps to recognize both level and type of damage that can
possibly happen in unidirectional laminates under compression and bending
loads. Understanding the specimen level material behavior due to these types
of defects is necessary to predict the reliability of a wind turbine blade in
operation. As these defects are expected to be present in a localized region of
a bigger structure, the chances of damage initiations will be high at these
defected regions. The flexural fatigue analysis showed more internal damage
at the waviness effected region. This understanding could help to take extra
care for a future blade maintenance and repair. The static flexural analysis on
blade model showed that additional tip deflection occurs due to waviness
presence at the pressure side. This could be a threat situation for a blade to
Conclusions and future work Chapter 8
148
hit the tower and several previous ‘tower hitting’ incidents were reported. The
choice of downwind turbines over upwind turbines could help to reduce this
issue up to an extent. For the present work, the scale of damage was not a
factor. Depending on the percentage amount of damage upon the total size of
structure, the effect of damage over the material properties of the structure
will be less. That means for the same size of damage presented on a standard
specimen and a blade structure will not make the same impact. However, the
final expected failure modes due to the waviness defect would be the same as
that investigated. The presence of fiber waviness during manufacturing of
composite blade structure is unavoidable, yet an additional care provided
while stacking the fiber fabric with the help of robots could help to minimize
their inclusion up to a considerable amount. The recent advancement in
composite repair technology would be another solution for this issue.
8.2 Contributions
Understanding the effect fiber waviness with known features on failure
behavior of unidirectional laminated composites under various mechanical
loading.
A reliable FE model to predict the compressive strength and failure modes at
small fiber wave severity level.
The behavior of crack during initiation and propagation in a pure opening
mode under the influence of in-plane fiber waviness.
An FE blade model to understand and predict the effect of waviness defect
presented at various spar-cap locations under flap-wise loading.
8.3 Scope for future work
Further investigation related to current scope of the work are follows:
Having a reliable three-dimensional FE model to predict the strength and
failure behavior at all ranges of fiber wave severity. Presently, a single wave
was considered, however it would also be useful to study the waviness defect
with multiple peaks and non-uniform amplitudes.

Conclusions and future work Chapter 8
149
The effect of waviness under static tensile loads were not investigated, hence
effect of different fiber wave severity waviness on both strength and stiffness
need to be analyzed.
Current investigation considered the effect of waviness on mode-I fracture
energy and delamination onset. The effect of waviness on mode-II fracture
energy could be another topic to consider.
A progressive failure model should be developed to understand the influence
of fiber waviness under various fatigue loads.
From the specimen level, flexural fatigue analysis of both unidirectional and
wavy specimens, a difference in failure modes were observed in between
them. Hence a fatigue flap-wise bending FE analysis on the blade model
should be performed to understand the failure modes.
Current investigation focused only on unidirectional laminates with waviness.
It is necessary to understand the effect of waviness on multidirectional
laminates with 0º laminas having fiber waviness defect.
For the present investigation, the existence of other defects was not taken into
consideration. The influence of various other defects along with the fiber
waviness could be another topic to consider.

Conclusions and future work Chapter 8
150
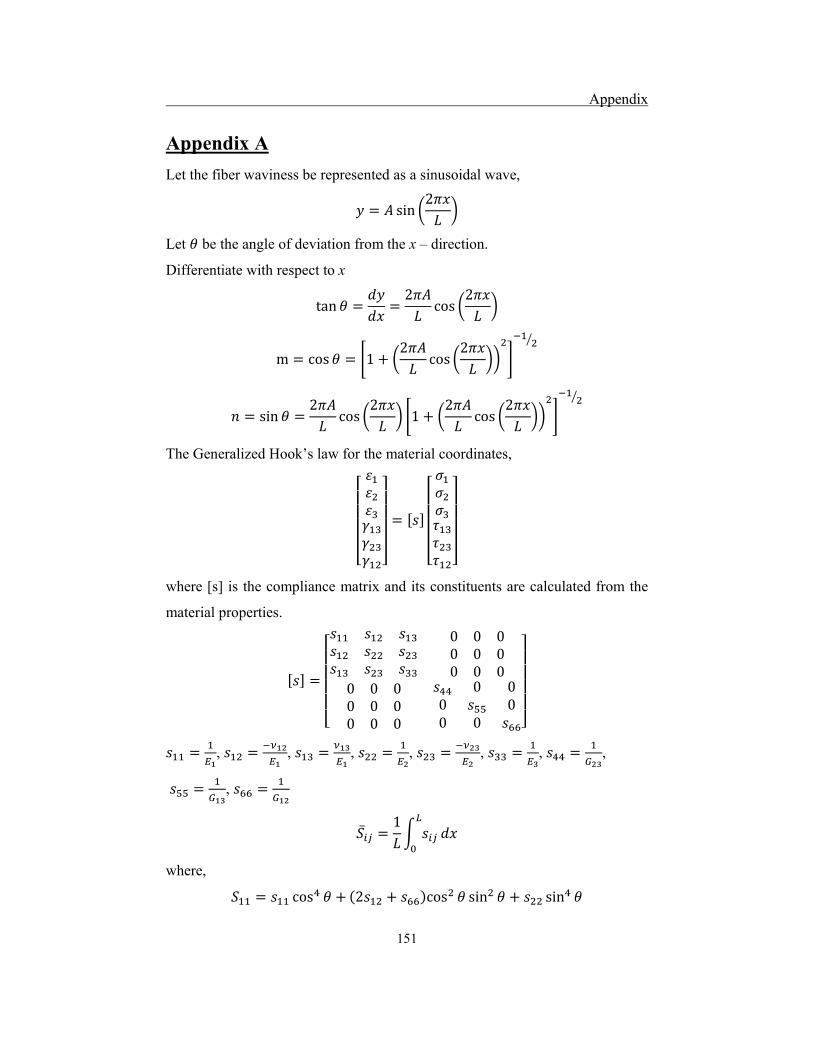
Appendix
151
Appendix A
Let the fiber waviness be represented as a sinusoidal wave,
sin2
Let be the angle of deviation from the x – direction.
Differentiate with respect to x
tan2
cos2
m cos 12
cos2
sin2
cos2
12
cos2
The Generalized Hook’s law for the material coordinates,
where [s] is the compliance matrix and its constituents are calculated from the
material properties.
0 0 00 0 00 0 0
0 0 00 0 00 0 0
0 00 00 0
, , , , , , ,
,
1
where,
cos 2 cos sin sin

Appendix
152
cos cos sin sin
cos 2 cos sin sin
cos sin
cos sin
cos sin
cos sin 4 2 cos sin
cos sin
After integration
2
4 2
1 21
21
11 3 21
1
1

Appendix
153
11
1
2 tan
The stress and strain tensor along the coordinate axis can be represented as,
,
Let [T] be the transformation matrix and [R] be the Reuters matrix.
00
0 0 1
0 0 20 0 20 0 0
0 0 00 0 0
0
00
0 0
1 0 00 1 00 0 1
0 0 00 0 00 0 0
0 0 00 0 00 0 0
2 0 00 2 00 0 2
The global compliance matrix can be written as
And the global stiffness relation can be written as,
1 12