effect of light intensity on the cure characteristics …
TRANSCRIPT

159 East african MEdical Journal May 2012
East African Medical Journal Vol 89 No. 5 May 2012EFFECT OF LIGHT INTENSITY ON THE CURE CHARACTERISTICS OF PHOTO-POLYMERISED DENTAL COMPOSITES B. A. Kassim, BDS, MDS, Lecturer, B. K. Kisumbi, BDS, MPHIL, Senior Lecturer, W. R. Lesan, BDS, MSc, Department of Conservative and Prosthetic Dentistry, College of Health Sciences, University of Nairobi, P. O. Box 19676 - 00202 Nairobi, Kenya and L. W. Gathece, BDS, MPH, PhD, Department of Periodontology, Community and Preventive Dentistry, College of Health Sciences, University of Nairobi, P. O. Box 19676 - 00202 Nairobi, Kenya
Request for reprints to: Dr. B. A. Kassim, Department of Conservative and Prosthetic Dentistry, College of Health Sciences, University of Nairobi, P. O. Box 19676 - 00202 Nairobi, Kenya
EFFECT OF LIGHT INTENSITY ON THE CURE CHARACTERISTICS OF PHOTO-POLYMERISED DENTAL COMPOSITES
B. A. KASSIM, B. K. KISUMBI, W. R. LESAN and L. W. GATHECE
ABSTRACT
Objective: To determine the light intensity emitted by light curing units (LCUs) and its effect on the cure characteristics of composites polymerised with it. Design: A laboratory based cross sectional study.Setting: Public and private dental clinics in Nairobi, Kenya. Results: Thirty five (42.17%) LCUs produced light of intensity ≤300mWcm-2 while 43 (51.8%) LCUs had their intensities between 300 and 1200mWcm-2. Mean DOC and surface hardness for the 0-300mWcm-2 LCUs was 1.34mm and 46.60VHN respectively. The mean DOC increased steadily from the lowest intensity group (1.34mm) to the 1200-1500mWcm-2 group (2.32 mm) and then declined to 1.98mm for the 1500-1800mWcm-2 group. Statistical analysis showed significant differences in the mean DOC (p=0.000) and surface micro-hardness (p=0.002) for the different intensity groups. Conclusion: Light intensity output of LCUs has a significant influence on the cure characteristics of dental composites with both DOC and surface micro-hardness increasing with increase in light intensity up to 1500mWcm-2.
INTRODUCTION
The demand for aesthetic restorative materials has led to a widespread use of photo-activated direct resin composites in many parts of the world (1). Modern dental composite restorations are wholly dependent on the use of Visible Light Curing devices for their polymerisation. The output of these devices is among many interrelated factors that influence the polymerisation and quality of light activated resin composites. The factors include material characteristics, the tooth structure in which the restoration is placed, the light source and how it is used (2-4). The main factors that are of essence in the light source are its intensity output, the band width of the light, curing mode and time, filter quality (where applicable) and light tip characteristics - including diameter, distance from the restoration and direction of the light beam relative to the restoration surface (2, 5-7). Various tests have been employed to assess the cure characteristics of dental composites. These include direct measurement of the degree of double bonds conversion using Fourier Transform Infra Red (FTIR) spectroscopy (8) and linear polymerisation shrinkage and indirectly through micro-hardness and depth of cure measurements (9,10). The micro-
hardness and depth of cure tests are good indicators of carbon-carbon double bonds conversion (11-13). Additionally, the light intensity output of a curing light could be measured using a visible light meter. Naturally, the desire among restorative dentists is to produce an optimally polymerised (cured) composite restoration within a short time for patient comfort and to save chair-time so as to hold the string on costs. This desire is what has fuelled the search for light curing machines with ideal output characteristics for the last three decades. The focus in this search has been to increase the light intensity output and to narrow the band width in order to cut out unnecessary heat and glare. The outcome has been the arrival of light curing devices with very high intensities, some as high as 3000mWcm-2 (9, 14). Despite the gains made, the down side of this has been the occurrence of the now familiar problem of heat generation and temperature increases within the unit and in the restoration. This heat not only contributes to the deterioration of the unit but is also injurious to the pulp (15). Concerns have equally been raised about the effect of the high intensity on the cure properties of the material (16-21). In order to shine more light on these factors which influence the polymerisation and quality of light activated resin composite restorations, this study
EAMJ EFFECT MAY 2012.indd 159 6/11/13 1:48:41 PM

May 2012 East african MEdical Journal 160
set out to determine the light intensity emitted by light curing units (LCUs) in dental clinics in Nairobi and study its effect on the cure characteristics (depth of cure and surface micro-hardness) of composites polymerised with it.
MATERIAL AND METHODS
The study was laboratory based, cross-sectional and analytical. Eighty three light curing units, which were in use in private and public dental health facilities in Nairobi, Kenya, were studied. The intensity of the light emitted by the LCUs and depth of cure and surface micro-hardness of composites specimens polymerised with the lights were measured as described below.
Light intensity: The LCU was switched on and allowed to run for about five seconds (Figure 1). The tip of the fibreoptic light guide was then made to contact a sensor on the light meter which then displayed the light intensity reading on a screen in mWcm-2. The measurement was repeated three times to ensure reliability.
Fabrication of specimens: A single batch of a commonly used resin based composite (Amelogen Plus, Ultradent, South Jordan, Utah, USA) was used to fabricate the specimens for DOC and surface micro-hardness test. The shade and composition of the material were controlled so as to exclude the influence of material factors on the variables being measured. Light curing units in the sampled clinics were used to cure the composite specimens, which were all cylindrical. The one for micro-hardness evaluation measured eight millimetres in diameter and three millimetres in height while the other for depth of cure evaluation measured four millimetres in diameter and six millimetres deep. Split brass moulds made to these specifications were used to fabricate the specimens (Figures 2 and 3). The mould was positioned on a mylar strip supported underneath by a glass slab. The resin composite was then filled into the mould using a plastic instrument and a condenser. The filled mould was then covered with another mylar strip and finger-pressed with a microscope slide to give an even top surface. Any excess material that extruded during the pressing was removed before curing so as to give a constant depth for all the specimens. The specimens were cured only from the top with the light guide angulated at 900 to the resin surface. Irradiation times of 40 seconds for Light Emitting Diodes (LEDs) and Quartz-Tungsten Halogen (QTH) and 10 seconds for Plasma Arc Curing (PAC)LCUs were applied. Throughout the curing period, the tip of the light guide was in contact with the mylar strip covering the top surface of the specimen. Thus the light source-restoration distance was constant and
equivalent to the thickness of the Mylar strip (100µm). After curing, the specimen was retrieved from the mould, inspected and the procedure repeated if it was found to have been defective. Each specimen was then placed in a serialised envelope and immediately stored in a light-proof cooler box at room temperature to await conduction of the tests.
Evaluation of surface micro-hardness and depth of cure: Surface micro-hardness evaluation was done after 24 hours in a laboratory using a Vickers’s micro-hardness tester (V-tester 2, Amsler Otto Wolpert-Werkke, GMBH). (Figure 4) using a load of 200 g and a dwell time of 15 seconds. Three indentations were made on the top surface of each specimen by a diamond indenter and the hardness determined by measuring the diagonals of each indentation with a measuring light microscope (×200 magnification). The measurements were then converted into Vickers Hardness Numbers (VHNs) using conversion tables. The average of the three measurements was taken as the Vickers Hardness Number of the specimen and recorded. The depth of cure was measured, within six to seven hours of specimen fabrication. The uncured material at the bottom of the specimen was removed by shaking it in 99% acetone for 15 seconds using a capsule and a mixing device (Ultramat 2, SDI, Australia). The acetone removed all the uncured material and left a macroscopically even surface. The remaining length of the composite cylinder was measured using a digital Vanier Calliper (Shengya Machine & Tools Co., Ltd. China). In line with the ISO 4049 recommendations, the DOC was taken as a half of the remaining length of the cylinder.
RESULTS
Distribution of light curing units according to light intensity output: Table 1 shows the LCUs grouped according to the light intensity they emit in spans of 300 mWcm-2. Thirty five (42.17%) LCUs produced light intensities of 0-300 mWcm-2. Fourty three (51.8%) of the LCUs had their intensities between 300 and 1200 mWcm-2. The mean DOC and surface hardness for the 0-300mWcm-2 was 1.34 millimetres and 46.60 VHN respectively. This group had the lowest mean DOC and surface hardness. The mean DOC increased steadily from the lowest intensity group (1.34 mm) to the 1200-1500 mWcm-2 group (2.32 mm) and then declined to 1.98 millimetres for the 1500-1800 mWcm-2 group. One way ANOVA showed a statistically significant difference in the mean DOC for the different intensity groups (P=0.000). Post Hoc tests showed that the mean DOC for the 0-300 m Wcm-2 group differs significantly from all other groups (p=0.000) while the mean DOC for the 301-600 mWcm-2
EAMJ EFFECT MAY 2012.indd 160 6/11/13 1:48:42 PM

161 East african MEdical Journal May 2012
group significantly differed from that of all other groups except the 1501-1800 mWcm-2 group (0.322). One way ANOVA also showed that the mean VHN for the different light intensity groups significantly differ (P=0.002).
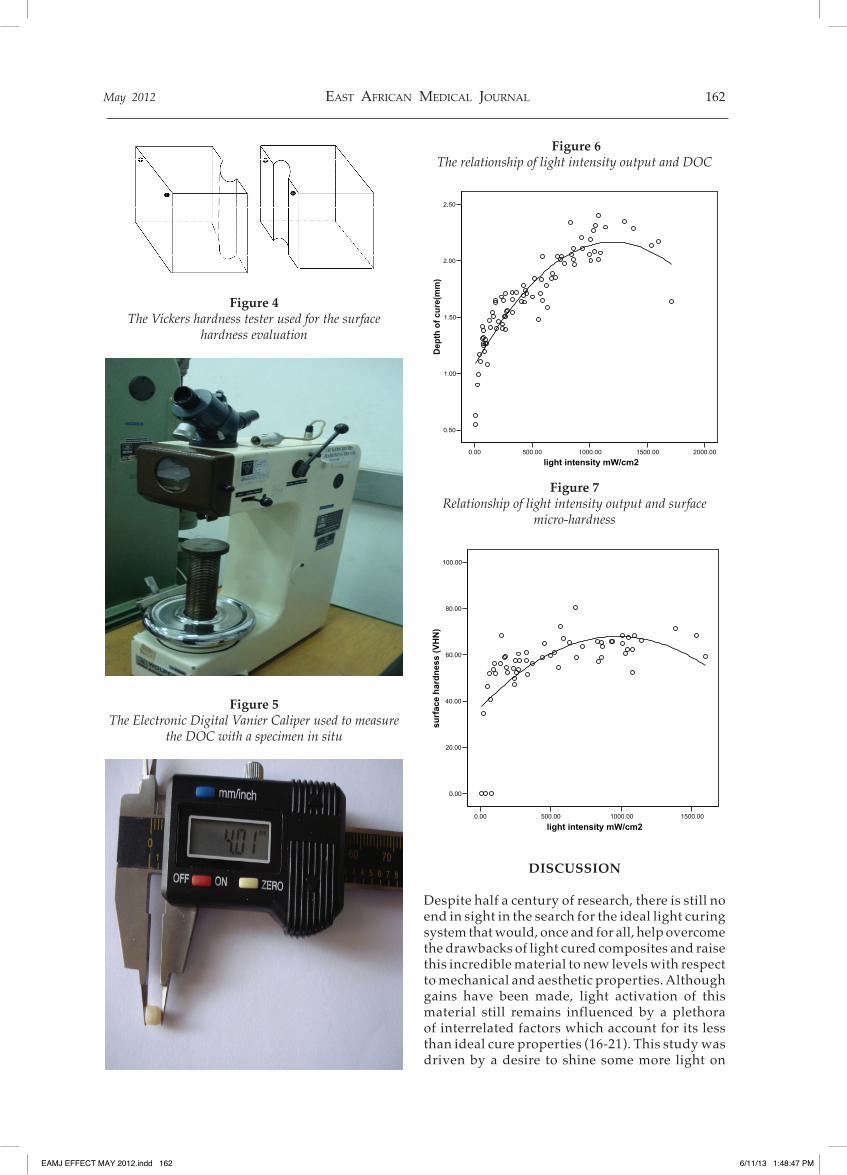
Relationship of light intensity with DOC and surface micro-hardness: The relationship between light intensity, DOC and surface micro-hardness was also investigated in their continuous form. The relationship was curvilinear. It was noted that there was an initial exponential rise in DOC with increase in the light
intensity up to an intensity of about 800mWcm-2 (Figure 6). Above this intensity, the rise became gradual and nearly plateaued between 1000 and 1500mWcm-2. Although the number of units which had intensity of above 1500 mW/cm2 was small, the plot showed that there was a slight decline in the DOC above this level of intensity. For the surface hardness, it may be estimated from the scatter plot that above an intensity of about 500 m Wcm-2, there is only minimal increase in surface micro-hardness with increase in intensity (Figure 7).
Table 1Light intensity frequencies and associated mean DOC and surface micro-hardness
Light intensity Depth of cure (mm) Surface micro-hardness(mWcm-2) n mean SD n mean SD 0- 300 35 1.34 0.27 24 46.60 19.17301-600 17 1.71 0.12 11 60.47 5.89601 - 900 14 1.97 0.17 9 64.34 6.82901 - 1200 12 2.17 0.13 11 64.11 4.571201 - 1500 2 2.32 0.04 1 71.60 -1501 - 1800 3 1.98 0.30 2 63.85 6.43
Figure 1Visible light curing meter used for light intensity
measurement
Figure 2A sketch of the split mould used for fabrication of the
micro-hardness test specimen
Figure 3A sketch of the split mould for fabricating the depth of
cure specimen
EAMJ EFFECT MAY 2012.indd 161 6/11/13 1:48:44 PM
May 2012 East african MEdical Journal 162
Figure 4The Vickers hardness tester used for the surface
hardness evaluation
Figure 5The Electronic Digital Vanier Caliper used to measure
the DOC with a specimen in situ
Figure 6The relationship of light intensity output and DOC
0.00 500.00 1000.00 1500.00 2000.00
light intensity mW/cm2
0.50
1.00
1.50
2.00
2.50
Dep
th o
f cu
re(m
m)
Figure 7Relationship of light intensity output and surface
micro-hardness
0.00 500.00 1000.00 1500.00
light intensity mW/cm2
0.00
20.00
40.00
60.00
80.00
100.00
surf
ace
har
dn
ess
(VH
N)
DISCUSSION
Despite half a century of research, there is still no end in sight in the search for the ideal light curing system that would, once and for all, help overcome the drawbacks of light cured composites and raise this incredible material to new levels with respect to mechanical and aesthetic properties. Although gains have been made, light activation of this material still remains influenced by a plethora of interrelated factors which account for its less than ideal cure properties (16-21). This study was driven by a desire to shine some more light on
EAMJ EFFECT MAY 2012.indd 162 6/11/13 1:48:47 PM

163 East african MEdical Journal May 2012
these factors. The results show that the relationship between light intensity and surface micro-hardness and DOC of composites is curvilinear (Figures 6 and 7). The DOC increased with increase in light intensity output up to about 1500mWcm-2 then decreased at intensities above this level. The figures also show that the increase in DOC with intensity becomes gradual above the intensity of 800mWcm-2 and nearly plateaus between 1000 - 1500mWcm-2. These results suggest that using LCUs with intensities above 1500mWcm-2 carries no advantage, by way of increased DOC. On the contrary, light intensities above this level may be counterproductive. The scenario is similar for the surface micro-hardness (Table 1) which shows a gradual increase with light intensity up to about 1500mWcm-2 and a decline thereafter. It is, however, impossible to postulate how far the decline would be as the study did not encounter LCU s with intensities higher than 180mWcm2. Nevertheless, this outcome concurs with what Pilo et al (22) reported on the relationship between light intensity and surface hardness. Additionally, it has been reported before that very high light intensities, such as those produced by Plasma Arc Curing (PAC) lamps, have the potential to compromise the physical and mechanical properties of composite restorations (21). It can be seen in this study, as it was in other studies, (21-24), that LCUs with very high intensities give low DOC and surface micro-hardness. Previous reports have also laid out a sound scientific basis for the unexpectedly low cure properties at such high light intensities. The rapid polymerisation associated with the very high intensity is thought to result in shortened lifespan of the free radicals responsible for polymer chain growth, (8) thus causing saturated curing at the resin composite surface, trapping of unpolymerised monomer within the polymerised matrix and shorter polymer chains (21) Moreover, rapidly saturated curing at the resin surface may hinder light transmission to deeper layers of the restoration, thus compromising the DOC and other bulk properties. As the results clearly show, low light intensities do not present a cosier picture either. Light intensities below 900mWcm-2 produced DOCs that are lower than the traditionally accepted 2 millimetres at exposure times of 40seconds. Notably, this is also higher than what previous authors (25-28) have recommended for use as effective minimum light intensities. It is important to interpret the findings of this study with previous reports. For example, Lohbauer et al (23) reported that very high light
intensity will result in superior surface related properties such as the degree of conversion and the initial surface strength but poor bulk properties and that moderate light intensities result in more favourable bulk properties. Gritsch et al. (4) who evaluated the influence of energy density (intensity and time) and light intensity on the cure characteristics of composites also concluded that above a certain light intensity threshold (400mWcm-2) the energy density is more important than the light intensity in achieving a proper cure. The latter reported that an energy density of 16Jcm-2 yields the best micro-hardness at both the top and bottom surfaces of the specimen. Although this could be correct, it should not be seen to reduce the relevance of light exposure duration as an important factor, on its own, since time spent on the dental chair is an important contributor to the cost of treatment. A number of important questions arise at this stage. What then are the ideal light exposure factors to be employed? Where does all these take the decades-long search for the ideal Visible Light Curing system in terms of light intensity, band width and exposure time? On the surface, a study of the frequency table and the scatter plots (Figures 6 and 7) illustrates that, generally, any light intensity above 600mWcm-2 yields acceptable surface micro-hardness but only intensities above 900 mWcm-2 will result in DOCs of 2 millimetres or above. This may imply that, perhaps, units with intensities below 900 mWcm-2 require exposure times longer than the traditional 40 seconds to produce the acceptable cure depth of 2 millimetres.From the forgoing, it may be reasonable to say that the decades-long search for a super Light Curing device has reached an opportune time to take stock of the gains and losses made and chart a new future for research into Visible Light Curing processes.
In conclusion, Light intensity output of LCUs has a significant influence on the cure characteristics of dental composites with both DOC (P=0.000) and surface micro-hardness (P=0.002) increasing with increase in light intensity up to 1500mWcm-2. Light curing units with intensities below 900mWcm-2 require exposure times longer than the traditional 40 seconds to produce the acceptable cure depth of 2 millimetres. It is, therefore, recommended that only LCUs with intensities of 900-1500mWcm-2 be used with exposure time of 40 seconds to achieve the acceptable cure characteristics for dental composites.
EAMJ EFFECT MAY 2012.indd 163 6/11/13 1:48:48 PM

May 2012 East african MEdical Journal 164
ACKNOWLEDGEMENTS
Acknowledgements go to The University of Nairobi for allocating the authors time to carry out the study, and the following groups of people for their support in different ways: colleagues Dr. J. Nyaga, M. Ndungu-Mwasha and E. Kagereki of the Ministry of Medical Services, Kenya; Professor M. Chindia of the University of Nairobi, all the dental clinics that participated in the study, the staff of the department of Conservative and Prosthetic Dentistry, University of Nairobi, our families and friends.
REFERENCES
Bala, O., Olmez, A. and Kalaya, S. Effect of LED 1. and halogen light curing on polymerization of a resin based composites. J. of Oral Rehab. 2005; 32: 134 -140. Ralph Rawls, H. and Esquivel-Upshaw, J . 2. Restorative resins, in; Anusavice, K. J., editor, Philips’ Science of Dental materials 11th edn. Elsevier Science (USA) St. Louis, Missouri 2003. pp 399-441. Rahiotis, C., Kakaboura, A., Loukidis, M. and 3. Vougioukiakis, G. Curing efficiency of various light curing units. Eur. J. oral Sci. 2004; 112: 89-94. Gritsch, K., Souvannasot, S., Schembri, C., 4. et al. Influence oflight energy and power density on the microhardness of two nanohybrid composites Eur J Oral Sci. 2008; 116: 77-82. Ratith, D. N., Palmara, J. E. A. and Messer, H. 5. H. Temperature change, dentinal fluid flow and cuspal displacement during resin composite restoration. J. of Oral Rehab. 2007; 34: 693-701. Martin, F. E. A survey of the efficiency of visible 6. light curing units. J. of Dent. 1998; 26: 239 - 243. Vandewalle, K. S., Roberts, H. S., Andrus, J. L. anf 7. Dunn, W. I. Effect oflight dispersion of LED curing lights on resin composite polymerization. J. of Esthetic and Restorative Dent. 2005; 17: 244-255. Feng, L., Carvalho, R. and Suh, B. I. Insufficient cure 8. under the condition of high irradiance and short irradiation time. Dent Mater. 2009; 25: 283-289. Rahiotis, C., Kakaboura, A., Loukidis, M. and 9. Vougioukiakis, G. Curing efficiency of various light curing units. Eur J oral Sci. 2004; 112: 89-94. Kleverlaan, C. J. and de Gee, A. J. Curing efficiency 10. and heat generation of various resin composites cured with high- intensity halogen lights. Eur J oral Sci. 2004; 112: 84 - 88. Hofmannm N,, Hugom, B. and Klaiber, B. Effect of 11. Irradiation type (LED or QTH) on photo activated composite shrinkage strain kinetics, temperature rise and hardness. Eur J Oral Sci. 2002; 110: 471- 479.
Ferracane, J. L. Correlation between hardness and 12. degree of conversion during the setting reaction of unfilled dental restoration resins. Dent mater 1985; 1: 11- 14. Rueggeberg, F. A. and Craig, R. G. Correlation of 13. parameters used to estimate monomer conversion in a light- cured composite. J. Dent Res . 1988; 67: 932 - 937. Deb, S., Mallet, R. and Millar, B. The effect of 14. curing with plasma light on the shrinkage of dental restoration materials. J. of Oral Rehab. 2003; 30: 723-728. Zach, L. and Cohen, G. Pulp response to externally 15. applied heat. Oral Surg. Oral Med. Oral Pathol. 1965; 19: 515- 530. Knezevic, A., Tarle, Z. , Meniga, A., 16. et al . Photopolymerization of composite resins with plasma light. J. of Oral Rehab. 2002; 29:782-786. Feilzer, A. J., Doreen, L. H., de Geee, A. J. and 17. Davidson, C. L. Influence of light intensity on polymerization shrinkage and integrity of restoration-cavity interface. Eur. J. Oral Sci. 1995; 103: 322-326. Hofmann, N., Hugo, B., Schubert, K. and Klaiber, 18. B. Comparison between plasma arc light source and conventional halogen curing units regarding flexural strength, modulus and hardness of photo activated resin composites. Clin. Oral Invest. 2000; 4: 140-147. Janda, R., Rowet, J. F., Latta, M., 19. et al. Color stability of resin-based filling materials after aging when cured with plasma or halogen light. Eur. J. Oral. Sci. 2005; 113: 251257. Curtis, J. W., Rueggeberg, F. A. and Lee, A. J. 20. Curing efficiency of the turbo tip. Gen Dent. 1995; 43: 428-433. Campbell, j. M. Introduction to synthetic polymers. 21. Science publications, Oxford, 1994. Pilo, R., Oelgiesser, D. and Cardash, H. S. A Survey. 22. of output intensity and potential for depth of cure among light-curing units in clinical use. J. of Dent. 1999; 27: 235 - 241. Lohbauer, D., Rahiotis, C., Kramer, N., 23. et al.. The effect of different light curing units on fatigue behaviour and degree of conversion of resin composite. Dent. Mater. 2005; 21: 608-615. Peutzfeldt, A., Sahafi, A. and Asmussen, E. 24. Characterization of resin composites polymerized with plasma arc curing units. Dent Mater. 2000; 16: 330-336. Caughman, W. F., Rueggeberg, F. A. and Curtis, J. 25. W. Clinical guidelines for photocuring restorative resins. J. of Amer. Dent. Asso. 1995; 126: 1280- 1286. Lee, S. Y. and Greener, E. H. Effect of excitation 26. energy on dentin bond strength and composite properties. J. of Dent. 1994; 22: 175 -181.
EAMJ EFFECT MAY 2012.indd 164 6/11/13 1:48:49 PM

165 East african MEdical Journal May 2012
Manga, R. K. and Charlton, D. G. Wakefield 27. CWo In Vitro evaluation of a curing radiometer as a predictor of polymerization depth. General Dentistry. 1995; 43: 241 - 243.
Rueggenberg, F. A., Caughman, W. F. and Curtis, J. W. 28. Effect of light intensity and exposure duration on cure of composite resin. Opera. Dent. 1994; 19: 26 - 32.
EAMJ EFFECT MAY 2012.indd 165 6/11/13 1:48:50 PM