effect of mixing mach number and mixing efficiency
TRANSCRIPT
Effect of mixing Mach number and mixing efficiency on the preliminary cycle design ofmixed high-BPR turbofans
Bjorn Cleton, Eduardo Anselmi*, Alvise Pellegrini, Vassilios Pachidis, PanagiotisLaskaridis
Propulsion Engineering Centre, Cranfield University, Bedfordshire, MK43 0AL, UnitedKingdom
* Corresponding author. Email: [email protected] Tel. +44(0) 123475 8167
Abstract
This article presents the implementation of an updated analytical flow mixing model in astate-of-the-art, non-dimensional gas turbine cycle performance simulation and optimisationtool. The model considers three separate streams in the mixer, each expanding through itsown ‘virtual’ nozzle. The use of three streams, compared to one single stream, allows for amore realistic simulation of a mixed exhaust gas turbine. This approach is used in aparametric study to assess the effect of the choice of mixing efficiency and mixer inlet Machnumber on the preliminary design of mixed-exhaust, high-bypass ratio turbofan engines. Itwas found that in terms of best thermal performance, a trade-off exists between mixer inletMach number and mixer effectiveness. The findings of this research establish some usefulguidelines for the accurate selection of these two parameters to achieve robust cycle designs.
Keywords: mixing efficiency, parametric study, mixer inlet Mach number, theoretical thrustgain
Nomenclature
BPR Bypass Ratio [-]FPR Fan Pressure Ratio [-]
FPR�� Fan Pressure Ratio optimum [-]
OPR Overall Pressure Ratio [-]CET Combustor Entry Temperature [K]TET Turbine Entry Temperature [K]LPT Low Pressure Turbine [-]SpT Specific Thrust [-]TR Temperature Ratio between hot and cold stream [-]P� Total pressure mixer inlet pressure cold stream [kPa]P� Total pressure mixer inlet pressure hot stream [kPa]F� Thrust [N]���� Mixing efficiency [-]
T� Temperature mixer inlet cold stream [K]T� Temperature mixer inlet hot stream [K]M� Mach number inlet mixer hot stream [-]W� Mass flow mixer inlet cold stream [kg/s]W� Mass flow mixer inlet hot stream [kg/s]M� Mach number inlet mixer hot stream [-]
Please do not include headers and footers
� Perimeter of line contact between both flows at the mixer chamberentry [m]
��� Length of the mixing chamber [m]��� Hydraulic diameter of the mixing chamber [m]�� Nozzle discharge coefficient [-]γ� Heat capacity ratio cold stream [-]γ� Heat capacity ratio hot stream [-]
1 Introduction
Mixed exhausts have commonly been used in gas turbines for military purposes, as well as ina wide range of civil aero gas turbines, such as the CFM56-5C, RB211-524G/H, RB211-535E4, and Trent 700[1]. The foundation of this type of gas turbine comes from researchperformed in the 1960s by Frost[2], Pearson[3] and Hartman[4]. At the same time,Holmes[5][6][7][8] conducted pioneering experimental research on the performance of forcedmixed-exhaust turbofans. Early work in this field from the National Aeronautics and SpaceAdministration (NASA) is dated in the 1970s [9][10], however it was in the 1980s when studieswere conducted into different mixer types, as well as the performance benefits of theseconfigurations (e.g., Kuchar and the E3 program)[11][12][13][14][15]. Since the 1990s, publishedresearch has been primarily focused on understanding the flow behaviour (eddy losses)within the flow stream (using CFD and various experimental arrangements)[16][17][18][19][20][21].During all these years, identifying potential benefits in performance, when comparing mixed-exhaust turbofans against separate-exhaust, has always been of interest.
The underlying idea is that exhaust mixing enables the core exhaust stream (hot/fast) totransfer energy to the bypass exhaust flow (cold/slow), without the use of a heat exchanger ormechanical means. The goal is to increase thrust at design point, but also at other operatingpoints. This is done by increasing the temperature of the bypass stream, therefore increasingthe average exit velocity of the flow through the common nozzle [20].
The thrust increase achieved by the mixed exhaust is commonly referred to as theoreticalthrust gain. Previous research has shown that the theoretical thrust gain that can be achievedthrough the use of a mixer can be between 2-3% in ideal conditions when comparing itagainst the same configuration but with a separate exhaust system[2]. The amount ofachievable theoretical thrust gain highly dependents on engine design parameters for fixedthrust requirements. These cycle design parameter are: fan pressure ratio (FPR), overallpressure ratio (OPR), bypass ratio (BPR), combustor entry temperature (CET), turbine entrytemperature (TET) and specific thrust (SpT).
Previous research[22] has shown the importance of choosing the correct cycle designparameters. However, it has not fully shown the influence of mixing efficiency and axialMach number at the mixer inlet on the six other parameters mentioned previously. Moreimportantly, a complete analytical method of how to model mixing efficiency correctly in anon-dimensional (0D) cycle analysis code has not been presented up to now in the publicdomain. In many instances, mixing efficiency is not considered. When it is considered, usersare driven to specify either fixed percentages of theoretical thrust gain, or fixed fractions foreach mixing stream. In both cases, industrial experience or experimental insight is requiredwhich may not be available or practical in a research environment.
Please do not include headers and footers
This manuscript discusses how to model a mixed-exhaust, high-BPR turbofan engine whiletaking mixing efficiency into account. The scope of this parametric study focuses on theinterdependence of the mixing efficiency and the axial Mach number at the mixer inlet, andtheir relationship with the ratio of mixer inlet total pressures at design point. The method andresults presented are important from a scientific and research point of view, as traditionally,when designing a theoretical mixed-exhaust turbofan cycle, those two parameters are chosenalmost arbitrarily from previous experience or based on outdated literature.
2 Theoretical background
In a mixed-exhaust turbofan engine, the core stream is mixed with the bypass prior to ejectionthrough a common nozzle. In a civil turbofan engine, with a medium to high BPR (i.e. BPR 4~ 6), a significant temperature ratio exists between the core and bypass stream, where forexample, at cruise the core stream can be as much as 2.5-3 times hotter than the bypassstream. The core stream is expanded to a relatively high velocity through a core nozzle. Thehigh velocity of the core is detrimental to propulsive efficiency, as well as a major source ofnoise. The residual heat in the core exhaust is an unavoidable consequence of a practicalBrayton cycle, as well as a function of the losses in the system. In a mixed-flow engine, thewaste heat is partially transferred to the bypass stream, which for a realistic cycle can lead toa reduction of energy needed to be transferred by the shaft and therefore, reduced lossesacross the fan and low-pressure turbine.
In a separate-flow turbofan engine, for a given fuel flow, BPR and fan mass flow rate, thereexists an optimum bypass-to-core nozzle jet velocity ratio which yields the maximum grossthrust. The ratio of bypass-to-core nozzle jet velocity is approximately equal to the transferefficiency[22] and can be proven analytically for a simplified turbofan ignoring the effect ofduct losses. For an equivalent optimum jet velocity in a mixed-flow engine, it has been foundthat the jet velocity ratio should be determined in the mixing plane and that this correspondsto the hot stream (core) to cold stream (bypass) ratio of total pressures. The optimum ratio oftotal pressures in the mixing plane is a function of the fundamental pressure losses in themixing plane, the temperature ratio in the mixing plane and the transfer efficiency.
Different authors[2][3][23][24] have proven that a ratio of mixer inlet total pressures that isapproximately equal to unity typically yields the highest thrust for a given fuel flow.Pearson[3] suggested that if a mixer is modelled as an ideal heat exchanger, a thrust gain(when compared with a separate-flow exhaust engine) can be obtained at a ratio of totalpressures slightly higher than 1.0. This would occur as heat from the core stream would betransferred to the higher pressure bypass stream resulting in a useful energy gain. Typically,the condition of equal total pressures in the mixing plane is imposed in order not to incurexcessive off-design pressure losses in the mixing process and so to improve mixeroperability across the operating envelope. Rayee et al.[25] demonstrated that the FPRop for amixed turbofan is fixed by this condition.
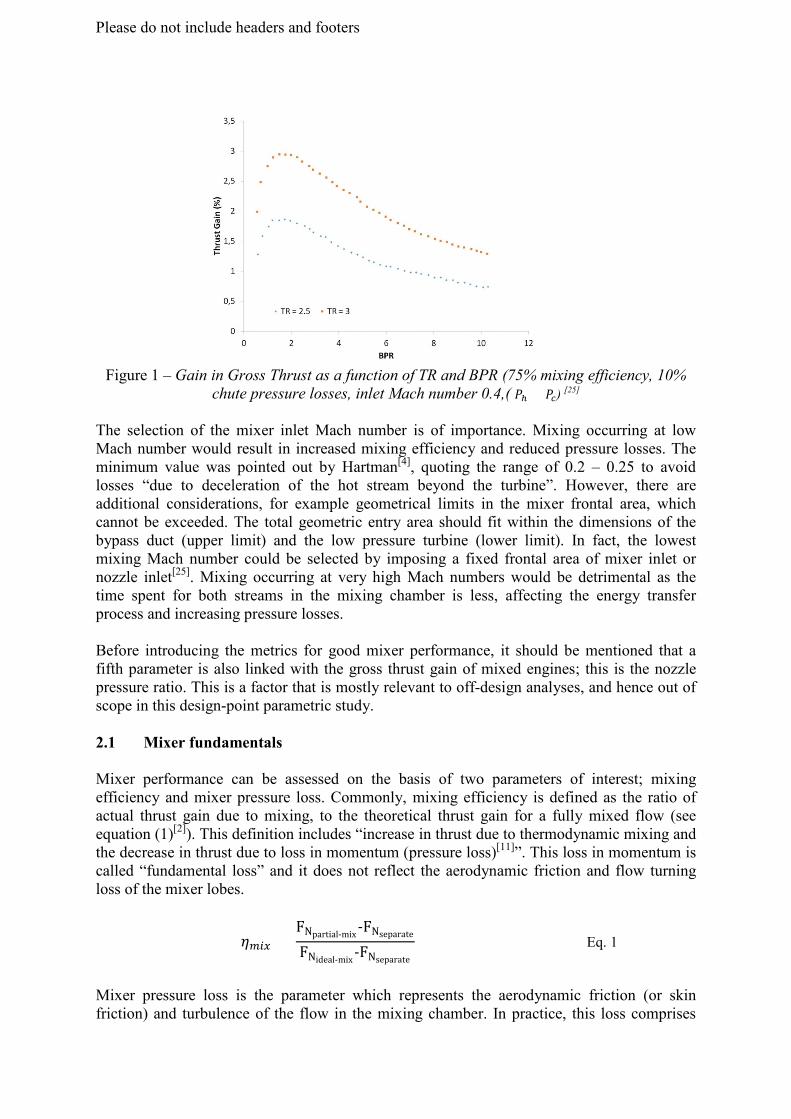
Apart from the total pressure ratio, it is commonly quoted that the degree of gross thrust gainis also a function of temperature ratio, mixer inlet Mach number and BPR. Figure 1, adaptedfrom Rayee et al.[25], shows for example that gross thrust gain from mixing is increased as thetemperature ratio (TR) between the two streams is increased at the mixing chamber inlet (asimilar graph can be also found in[26]). Also of interest is the fact that the gain in gross thrustpeaks at low BPR while at higher BPR it is substantially less. This gives a clue as to whymixed-exhaust engines are no longer attractive for ultra-high BPR engine applications.
Please do not include headers and footers
Figure 1 – Gain in Gross Thrust as a function of TR and BPR (75% mixing efficiency, 10%chute pressure losses, inlet Mach number 0.4,( �� = ��) [25]
The selection of the mixer inlet Mach number is of importance. Mixing occurring at lowMach number would result in increased mixing efficiency and reduced pressure losses. Theminimum value was pointed out by Hartman[4], quoting the range of 0.2 – 0.25 to avoidlosses “due to deceleration of the hot stream beyond the turbine”. However, there areadditional considerations, for example geometrical limits in the mixer frontal area, whichcannot be exceeded. The total geometric entry area should fit within the dimensions of thebypass duct (upper limit) and the low pressure turbine (lower limit). In fact, the lowestmixing Mach number could be selected by imposing a fixed frontal area of mixer inlet ornozzle inlet[25]. Mixing occurring at very high Mach numbers would be detrimental as thetime spent for both streams in the mixing chamber is less, affecting the energy transferprocess and increasing pressure losses.
Before introducing the metrics for good mixer performance, it should be mentioned that afifth parameter is also linked with the gross thrust gain of mixed engines; this is the nozzlepressure ratio. This is a factor that is mostly relevant to off-design analyses, and hence out ofscope in this design-point parametric study.
2.1 Mixer fundamentals
Mixer performance can be assessed on the basis of two parameters of interest; mixingefficiency and mixer pressure loss. Commonly, mixing efficiency is defined as the ratio ofactual thrust gain due to mixing, to the theoretical thrust gain for a fully mixed flow (seeequation (1)[2]). This definition includes “increase in thrust due to thermodynamic mixing andthe decrease in thrust due to loss in momentum (pressure loss)[11]”. This loss in momentum iscalled “fundamental loss” and it does not reflect the aerodynamic friction and flow turningloss of the mixer lobes.
���� =FNpartial-mix
-FNseparate
FNideal-mix-FNseparate
Eq. 1
Mixer pressure loss is the parameter which represents the aerodynamic friction (or skinfriction) and turbulence of the flow in the mixing chamber. In practice, this loss comprises
Please do not include headers and footers
phenomena such as; i) the viscous effect of the flow over the surfaces of the mixer lobes, ii)the drag effect of the flow velocity field encountering the installed chute (lobes and pylon) inthe fan duct and finally, iii) the viscous effects over the inner walls of the mixing chamber,the jet pipe and the nozzle. These losses are experimentally not easy to determine. These twoperformance metrics of the mixer chamber require complex and advanced techniques to becomputed or measured.
Although the mixing efficiency definition given by equation Eq. 1 is widely used, it shouldbe emphasized that this definition is not the only one available. This thrust-based definition isbuilt on the assumption that a specified proportion of the theoretical mixing gain could beachieved. There is also the concept of thermal mixing efficiency, which is defined in terms ofthe mass-weighted, square root values of the relevant temperatures[12]. As it can be seen inEq. 2, it is a metric which combines experimental measurements of the total temperature atthe actual nozzle exit stream and the calculation of the unmixed and fully mixed streamtemperatures at mixer inlet conditions.
���� =(�� + ��)(������� ���)
��� − ���(��)
��� + ��(��)
��� �
(�� + ��)(������ ���)��� − ���(��)
��� + ��(��)
��� �
Eq. 2
In reality, when actual exit stream values are integrated from experimentation, the mixingefficiency becomes the mixing function “K4” from Frost[2], which can be linked with thesimplified expression of Eq. 1. The next section provides a deeper discussion on mixingmodels for completeness.
2.2 Mixing models
Current publications about mixed-flow engines have their foundations in classical low-BPRengine research from the 1960s, such as Pearson in 1962[3], and Frost in 1966[2], andsubsequent developments[16][19][27]. In general, it could be said that these are methods forcomputing mixing in a constant area duct, assuming adiabatic and inviscid flow evolution. Inthese methods, the condition of equal static pressures in both streams at chute exit requires aniterative solution of energy momentum and mass flow balance. To maximize the potentialbenefits of mixing, optimum mixing conditions need to be expressed in terms of the ratio oftotal pressures at design point, and either the Mach number of the cold stream, or the Machnumber of the hot stream at design point (Sanghi et al.[28]).
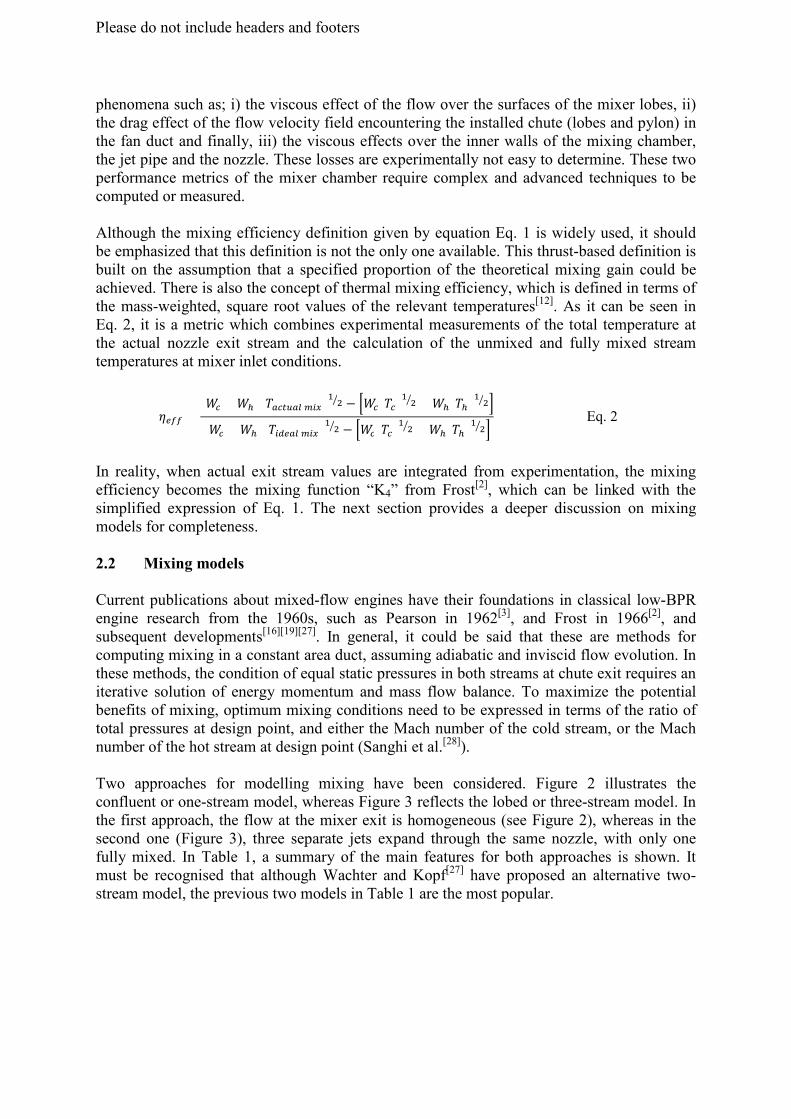
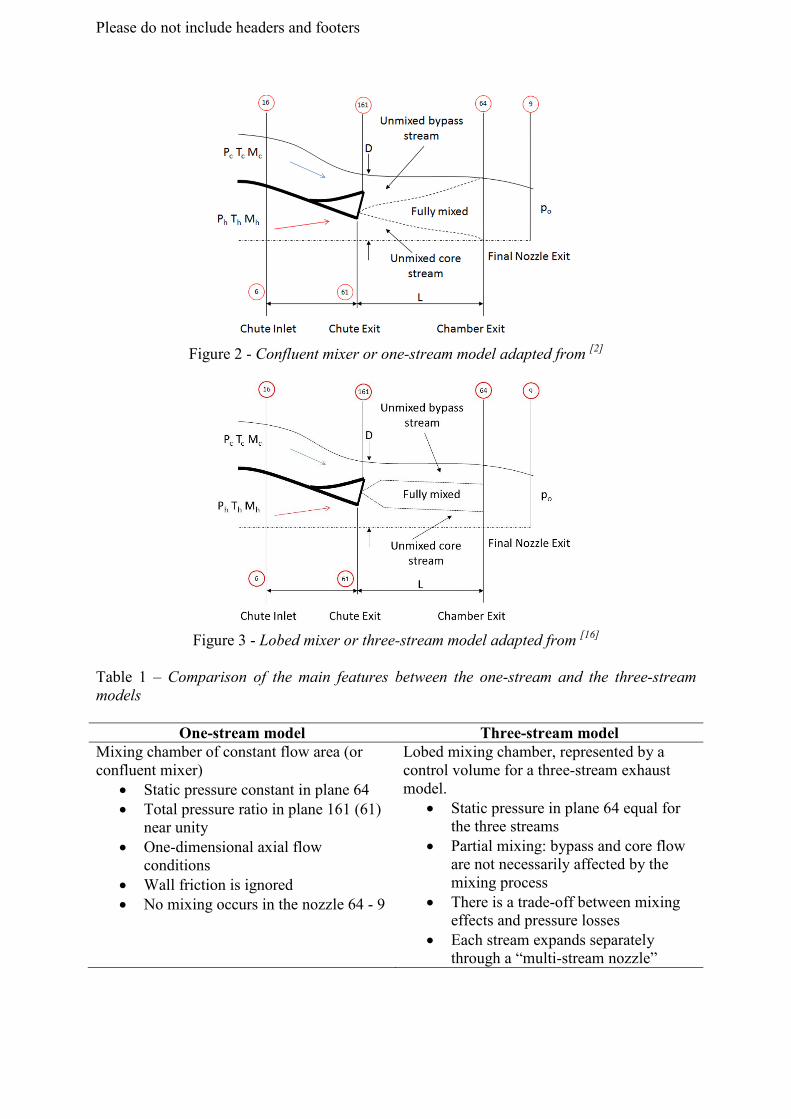
Two approaches for modelling mixing have been considered. Figure 2 illustrates theconfluent or one-stream model, whereas Figure 3 reflects the lobed or three-stream model. Inthe first approach, the flow at the mixer exit is homogeneous (see Figure 2), whereas in thesecond one (Figure 3), three separate jets expand through the same nozzle, with only onefully mixed. In Table 1, a summary of the main features for both approaches is shown. Itmust be recognised that although Wachter and Kopf[27] have proposed an alternative two-stream model, the previous two models in Table 1 are the most popular.
Please do not include headers and footers
Figure 2 - Confluent mixer or one-stream model adapted from [2]
Figure 3 - Lobed mixer or three-stream model adapted from [16]
Table 1 – Comparison of the main features between the one-stream and the three-streammodels
One-stream model Three-stream modelMixing chamber of constant flow area (orconfluent mixer)
• Static pressure constant in plane 64• Total pressure ratio in plane 161 (61)
near unity• One-dimensional axial flow
conditions• Wall friction is ignored• No mixing occurs in the nozzle 64 - 9
Lobed mixing chamber, represented by acontrol volume for a three-stream exhaustmodel.
• Static pressure in plane 64 equal forthe three streams
• Partial mixing: bypass and core floware not necessarily affected by themixing process
• There is a trade-off between mixingeffects and pressure losses
• Each stream expands separatelythrough a “multi-stream nozzle”
Please do not include headers and footers
Mixing efficiency and mixing pressure losses can be inter-related through a ‘mixing interfacefunction’. This interface function can be defined for example as per Table 2,
Table 2 – Examples of expressions for the interface function
Frost[2] Walsh & Fletcher[26]
������
(���)�(2)
���
���(3)
Where;� Perimeter of line contact between both flows at the mixer chamber entry��� Length of the mixing chamber��� Hydraulic diameter of the mixing chamber�� Nozzle discharge coefficient
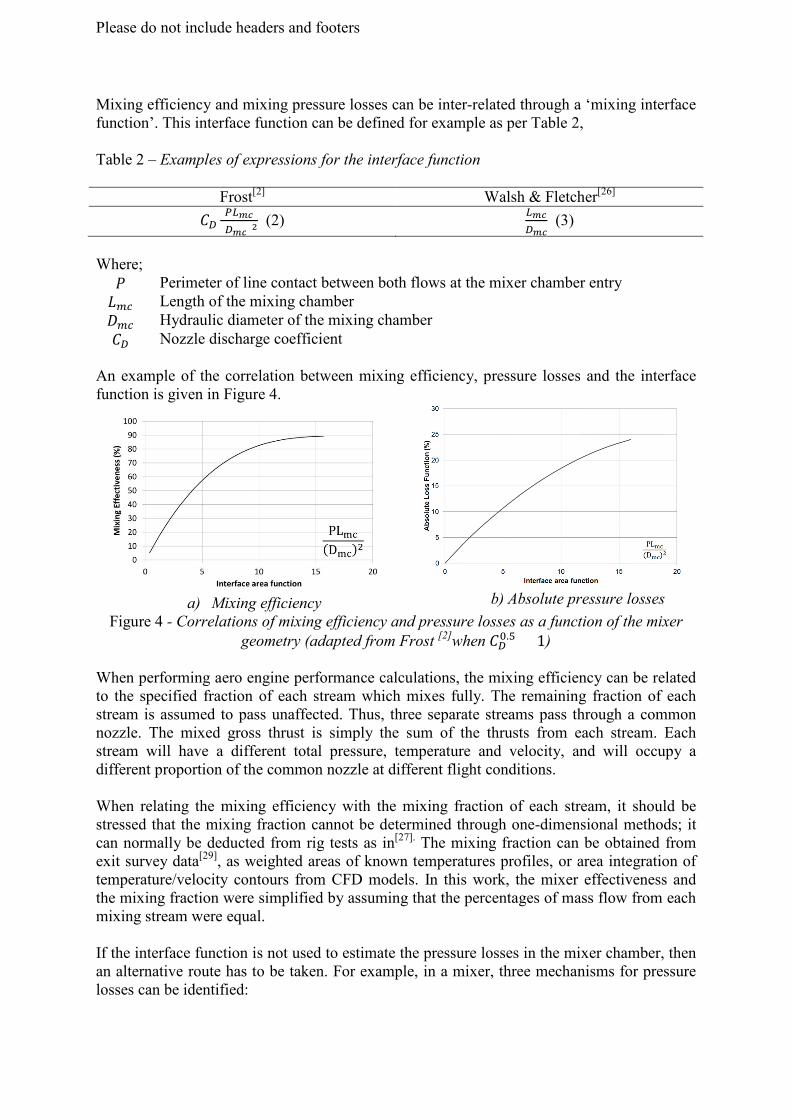
An example of the correlation between mixing efficiency, pressure losses and the interfacefunction is given in Figure 4.
a) Mixing efficiency b) Absolute pressure losses
Figure 4 - Correlations of mixing efficiency and pressure losses as a function of the mixergeometry (adapted from Frost [2]when ��
�.� = 1)
When performing aero engine performance calculations, the mixing efficiency can be relatedto the specified fraction of each stream which mixes fully. The remaining fraction of eachstream is assumed to pass unaffected. Thus, three separate streams pass through a commonnozzle. The mixed gross thrust is simply the sum of the thrusts from each stream. Eachstream will have a different total pressure, temperature and velocity, and will occupy adifferent proportion of the common nozzle at different flight conditions.
When relating the mixing efficiency with the mixing fraction of each stream, it should bestressed that the mixing fraction cannot be determined through one-dimensional methods; itcan normally be deducted from rig tests as in[27]. The mixing fraction can be obtained fromexit survey data[29], as weighted areas of known temperatures profiles, or area integration oftemperature/velocity contours from CFD models. In this work, the mixer effectiveness andthe mixing fraction were simplified by assuming that the percentages of mass flow from eachmixing stream were equal.
If the interface function is not used to estimate the pressure losses in the mixer chamber, thenan alternative route has to be taken. For example, in a mixer, three mechanisms for pressurelosses can be identified:
Please do not include headers and footers
• Skin frictional losses due to the viscous effects in the boundary layer,• Fundamental loss, due to the irreversible mixing process of two gas streams with
different properties in the mixer,• The loss incurred by the mixer (LPT exhaust) because it is a drag in the flow.
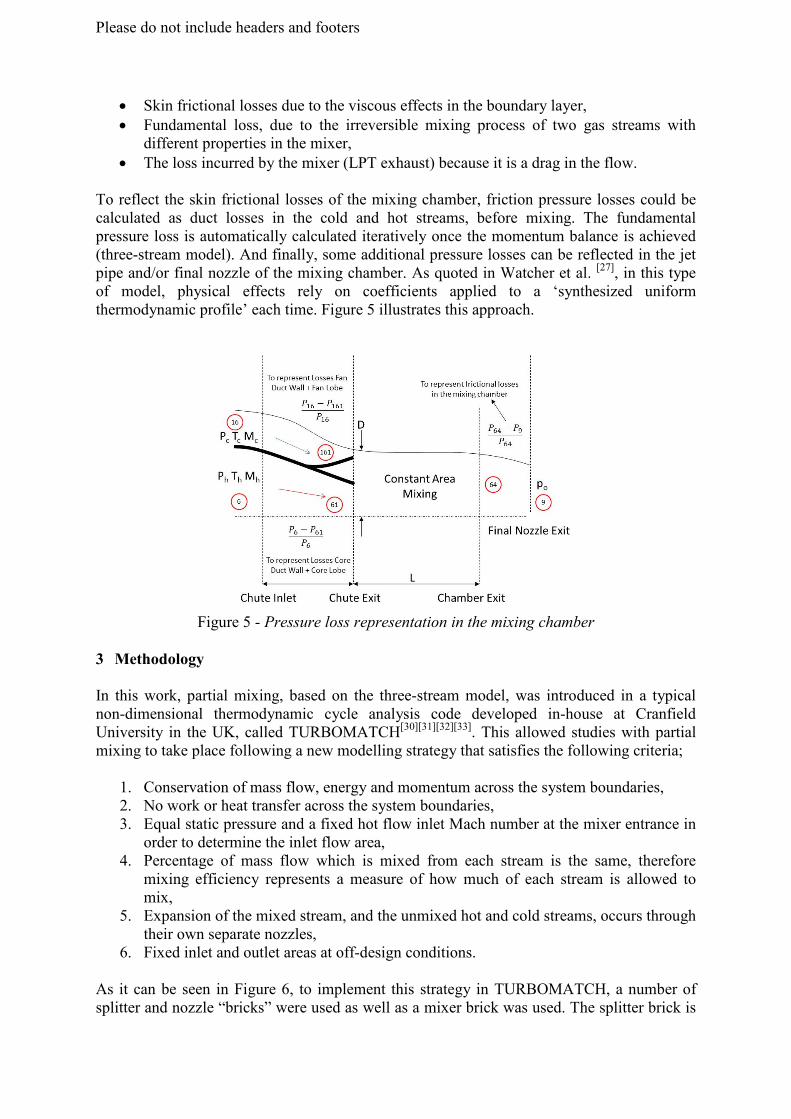
To reflect the skin frictional losses of the mixing chamber, friction pressure losses could becalculated as duct losses in the cold and hot streams, before mixing. The fundamentalpressure loss is automatically calculated iteratively once the momentum balance is achieved(three-stream model). And finally, some additional pressure losses can be reflected in the jetpipe and/or final nozzle of the mixing chamber. As quoted in Watcher et al. [27], in this typeof model, physical effects rely on coefficients applied to a ‘synthesized uniformthermodynamic profile’ each time. Figure 5 illustrates this approach.
Figure 5 - Pressure loss representation in the mixing chamber
3 Methodology
In this work, partial mixing, based on the three-stream model, was introduced in a typicalnon-dimensional thermodynamic cycle analysis code developed in-house at CranfieldUniversity in the UK, called TURBOMATCH[30][31][32][33]. This allowed studies with partialmixing to take place following a new modelling strategy that satisfies the following criteria;
1. Conservation of mass flow, energy and momentum across the system boundaries,2. No work or heat transfer across the system boundaries,3. Equal static pressure and a fixed hot flow inlet Mach number at the mixer entrance in
order to determine the inlet flow area,4. Percentage of mass flow which is mixed from each stream is the same, therefore
mixing efficiency represents a measure of how much of each stream is allowed tomix,
5. Expansion of the mixed stream, and the unmixed hot and cold streams, occurs throughtheir own separate nozzles,
6. Fixed inlet and outlet areas at off-design conditions.
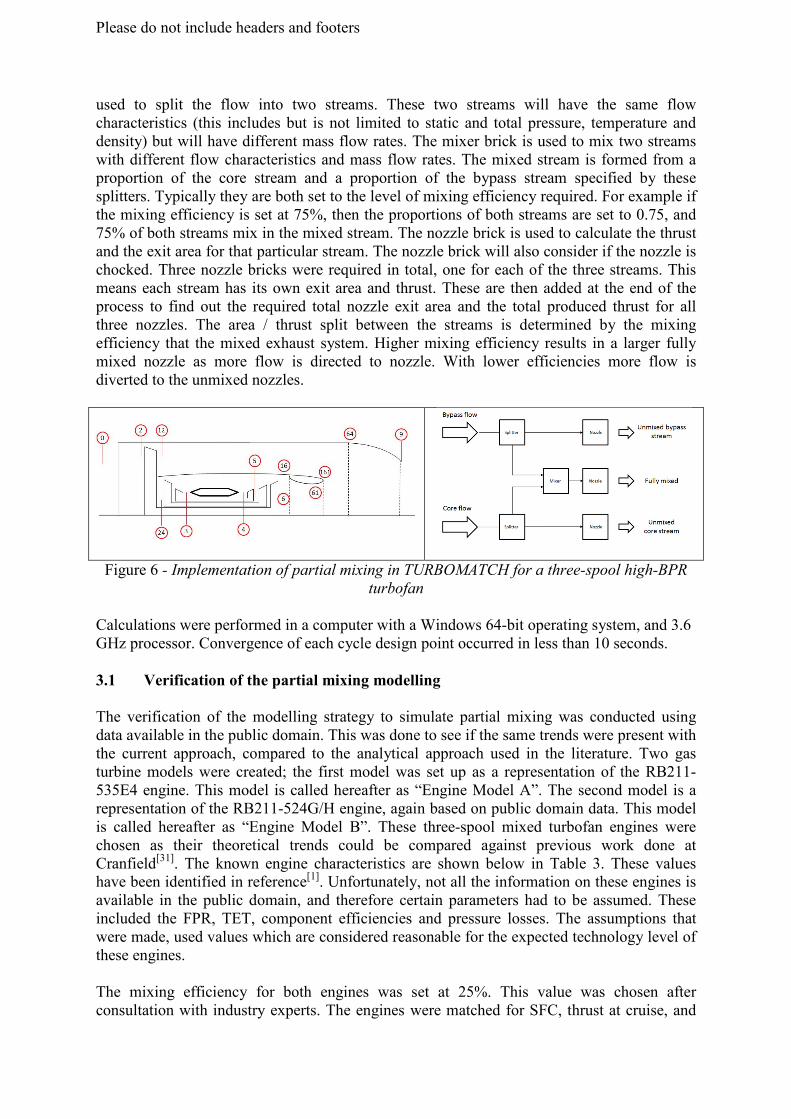
As it can be seen in Figure 6, to implement this strategy in TURBOMATCH, a number ofsplitter and nozzle “bricks” were used as well as a mixer brick was used. The splitter brick is
Please do not include headers and footers
used to split the flow into two streams. These two streams will have the same flowcharacteristics (this includes but is not limited to static and total pressure, temperature anddensity) but will have different mass flow rates. The mixer brick is used to mix two streamswith different flow characteristics and mass flow rates. The mixed stream is formed from aproportion of the core stream and a proportion of the bypass stream specified by thesesplitters. Typically they are both set to the level of mixing efficiency required. For example ifthe mixing efficiency is set at 75%, then the proportions of both streams are set to 0.75, and75% of both streams mix in the mixed stream. The nozzle brick is used to calculate the thrustand the exit area for that particular stream. The nozzle brick will also consider if the nozzle ischocked. Three nozzle bricks were required in total, one for each of the three streams. Thismeans each stream has its own exit area and thrust. These are then added at the end of theprocess to find out the required total nozzle exit area and the total produced thrust for allthree nozzles. The area / thrust split between the streams is determined by the mixingefficiency that the mixed exhaust system. Higher mixing efficiency results in a larger fullymixed nozzle as more flow is directed to nozzle. With lower efficiencies more flow isdiverted to the unmixed nozzles.
Figure 6 - Implementation of partial mixing in TURBOMATCH for a three-spool high-BPRturbofan
Calculations were performed in a computer with a Windows 64-bit operating system, and 3.6GHz processor. Convergence of each cycle design point occurred in less than 10 seconds.
3.1 Verification of the partial mixing modelling
The verification of the modelling strategy to simulate partial mixing was conducted usingdata available in the public domain. This was done to see if the same trends were present withthe current approach, compared to the analytical approach used in the literature. Two gasturbine models were created; the first model was set up as a representation of the RB211-535E4 engine. This model is called hereafter as “Engine Model A”. The second model is arepresentation of the RB211-524G/H engine, again based on public domain data. This modelis called hereafter as “Engine Model B”. These three-spool mixed turbofan engines werechosen as their theoretical trends could be compared against previous work done atCranfield[31]. The known engine characteristics are shown below in Table 3. These valueshave been identified in reference[1]. Unfortunately, not all the information on these engines isavailable in the public domain, and therefore certain parameters had to be assumed. Theseincluded the FPR, TET, component efficiencies and pressure losses. The assumptions thatwere made, used values which are considered reasonable for the expected technology level ofthese engines.
The mixing efficiency for both engines was set at 25%. This value was chosen afterconsultation with industry experts. The engines were matched for SFC, thrust at cruise, and
Please do not include headers and footers
thrust at SLS. To find the optimum FPR for these engines, the FPR was varied, whilemaintaining fixed OPR and the power distribution between the IPC and HPC. Once theengines were matched, the mixer was removed, and the process was carried out again. Thisproduced the optimum separate-jet configuration, which provided a baseline to compareagainst. With the baseline determined, the mixing efficiency of the mixed engine was variedparametrically to establish the performance trends of the authors’ modelling strategy andcompare against public domain data. The results of this verification are shown in the Figure8. In that figure the results of the two engine models are compared against the data fromRayee et al[25] and Frost[2]. This is further enhanced by Table 4. Due to lack of data a one toone comparison is not possible however one can compare the percentage of thrust reductionobserved in those papers when looking at mixing efficiency.
Table 3 – Engine model performance characteristics for the verification of incomplete mixingmodelling [1]
Engine Engine Model A Engine Model B UnitsSFC mid-cruise 17.48 16.20 mg/NsThrust cruise 38.7 52.5 kNThrust at SLA 192 269.6 kNOPR 28.0 34.5 -BPR 4.3 4.1 -Fan diameter 1.882 2.192 mMass flow rate 522 738.5 kg/s
4 Evaluation
This section explores the uninstalled performance of the two engine models previouslymentioned. It assumes a free mixing process evolving in a constant area duct, and completeuniformity of each stream before expansion in the corresponding expansion nozzles.
4.1 Comparison of numerical results against thermodynamic model
A verification of the global performance trends was conducted to test the modelling strategyused to represent the mixing efficiency. This was essential to assure that using “splittingblocks” would produce accurate results when taking mixing efficiency into account. Thisstrategy was already shown in Figure 6. The turbofan engine models used for this verificationstudy were shown in Table 3. Pressure losses in these engine models were considered fixed,therefore the mixing efficiency is independent of the losses in this study.
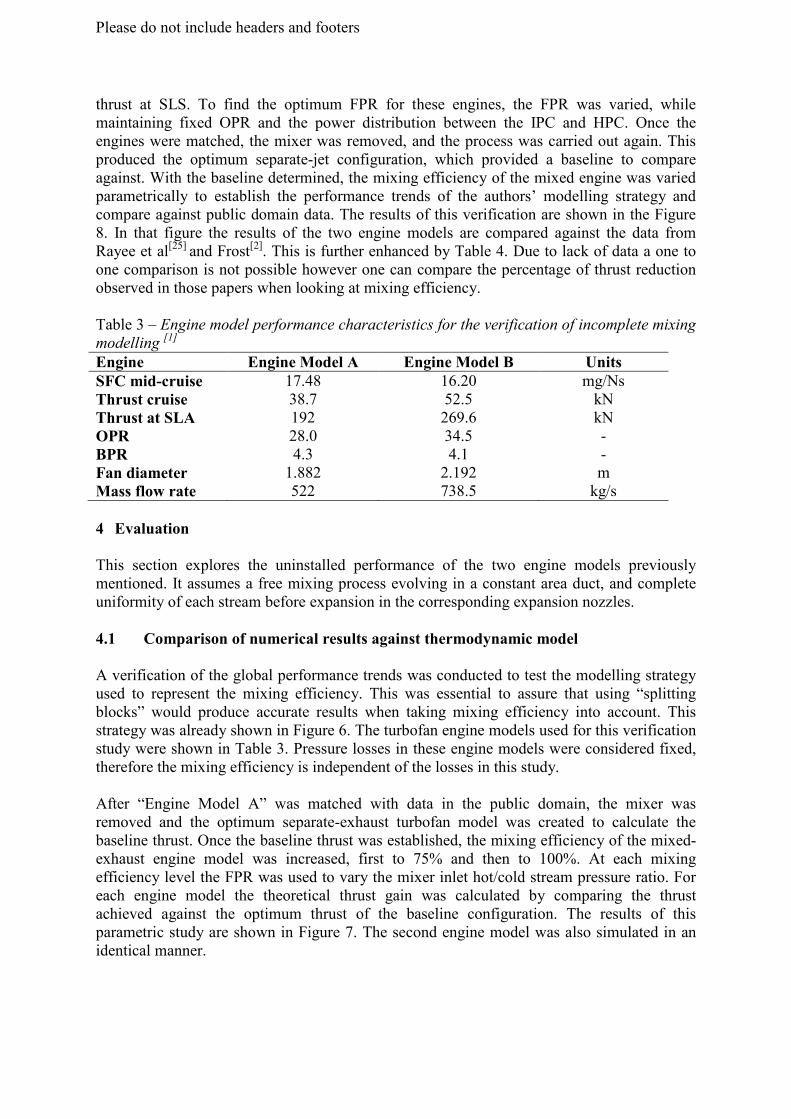
After “Engine Model A” was matched with data in the public domain, the mixer wasremoved and the optimum separate-exhaust turbofan model was created to calculate thebaseline thrust. Once the baseline thrust was established, the mixing efficiency of the mixed-exhaust engine model was increased, first to 75% and then to 100%. At each mixingefficiency level the FPR was used to vary the mixer inlet hot/cold stream pressure ratio. Foreach engine model the theoretical thrust gain was calculated by comparing the thrustachieved against the optimum thrust of the baseline configuration. The results of thisparametric study are shown in Figure 7. The second engine model was also simulated in anidentical manner.
Please do not include headers and footers
Figure 7 –Mixed nozzle cruise performance vs. mixing efficiency of “Engine Model A” and“Engine Model B” both at mixer entry Mach number = 0.5, �� ��⁄ ≈ 2
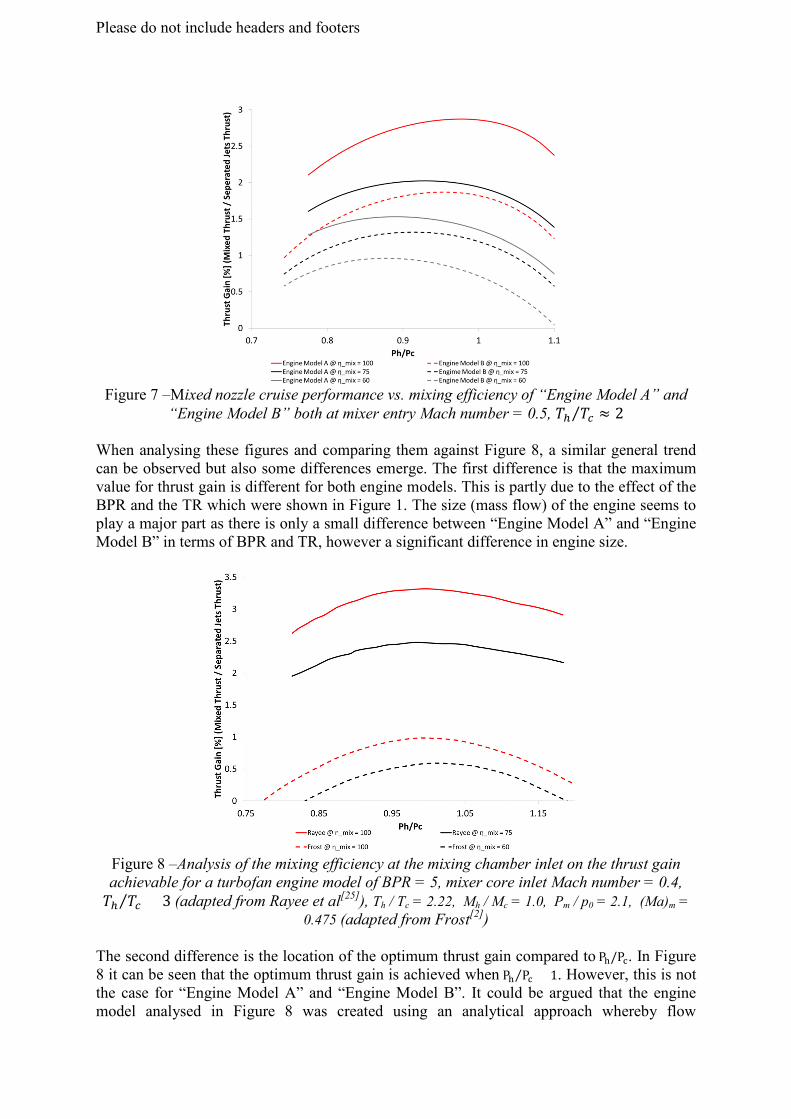
When analysing these figures and comparing them against Figure 8, a similar general trendcan be observed but also some differences emerge. The first difference is that the maximumvalue for thrust gain is different for both engine models. This is partly due to the effect of theBPR and the TR which were shown in Figure 1. The size (mass flow) of the engine seems toplay a major part as there is only a small difference between “Engine Model A” and “EngineModel B” in terms of BPR and TR, however a significant difference in engine size.
Figure 8 –Analysis of the mixing efficiency at the mixing chamber inlet on the thrust gainachievable for a turbofan engine model of BPR = 5, mixer core inlet Mach number = 0.4,�� ��⁄ = 3 (adapted from Rayee et al[25]), Th / Tc = 2.22, Mh / Mc = 1.0, Pm / p0 = 2.1, (Ma)m =
0.475 (adapted from Frost[2])
The second difference is the location of the optimum thrust gain compared to P�/P�. In Figure8 it can be seen that the optimum thrust gain is achieved when P� P�⁄ = 1. However, this is notthe case for “Engine Model A” and “Engine Model B”. It could be argued that the enginemodel analysed in Figure 8 was created using an analytical approach whereby flow
Please do not include headers and footers
characteristics at the inlet of the mixer could be set directly. Also the effect of inlet Machnumber was not taken into account, as it was fixed at 0.4. The axial Mach number at themixer inlet has an effect on the optimum mixer P�/P� ratio as it was demonstrated by Guha[22].
Table 4 – Comparing theoretical thrust gain from different engine models against Rayee etal[25], and Frost[2]
Engine η��� = 100 η��� = 75 η��� = 60 ∆ [%]
Rayee[25] 3.3 2.5 - ≈ 25Frost[2] 1.0 - 0.6 ≈ 40Engine Model A 2.8 2.1 - ≈ 28Engine Model A 2.8 - 1.6 ≈ 41Engine Model B 1.8 1.3 - ≈ 27Engine Model B 1.8 - 1.0 ≈ 44
The common trend that can be observed in the two figures and from Table 4 is that engineperformance drops in a similar manner. This is despite the fact that the maximum value forthrust gain and the location of that value with respect to P�/P� are different for all three enginemodels. Furthermore, when comparing the delta in thrust gain between the optimum valuesfor 60%, 75% and 100% mixing efficiency respectively, it can be seen and calculated thatthere is a reduction of thrust gain of approximately equal to the reduction in mixingefficiency. This is consistent for all three engines.
4.2 Mixing efficiency parametric study
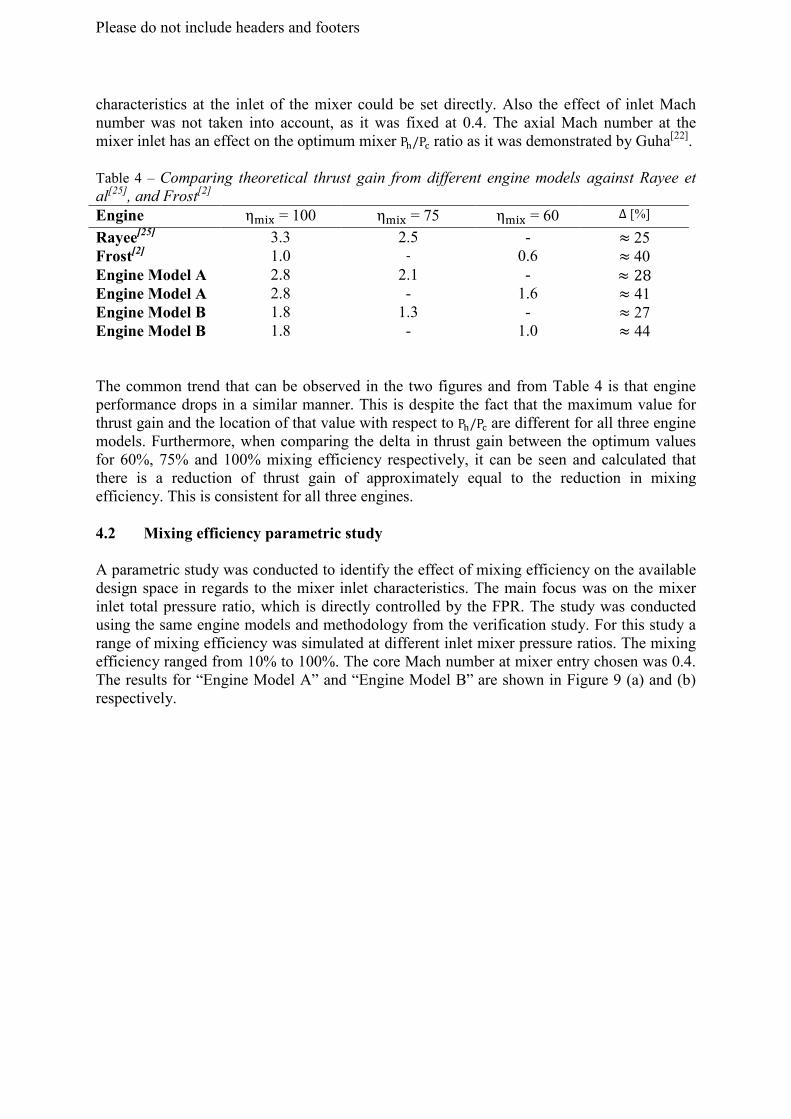
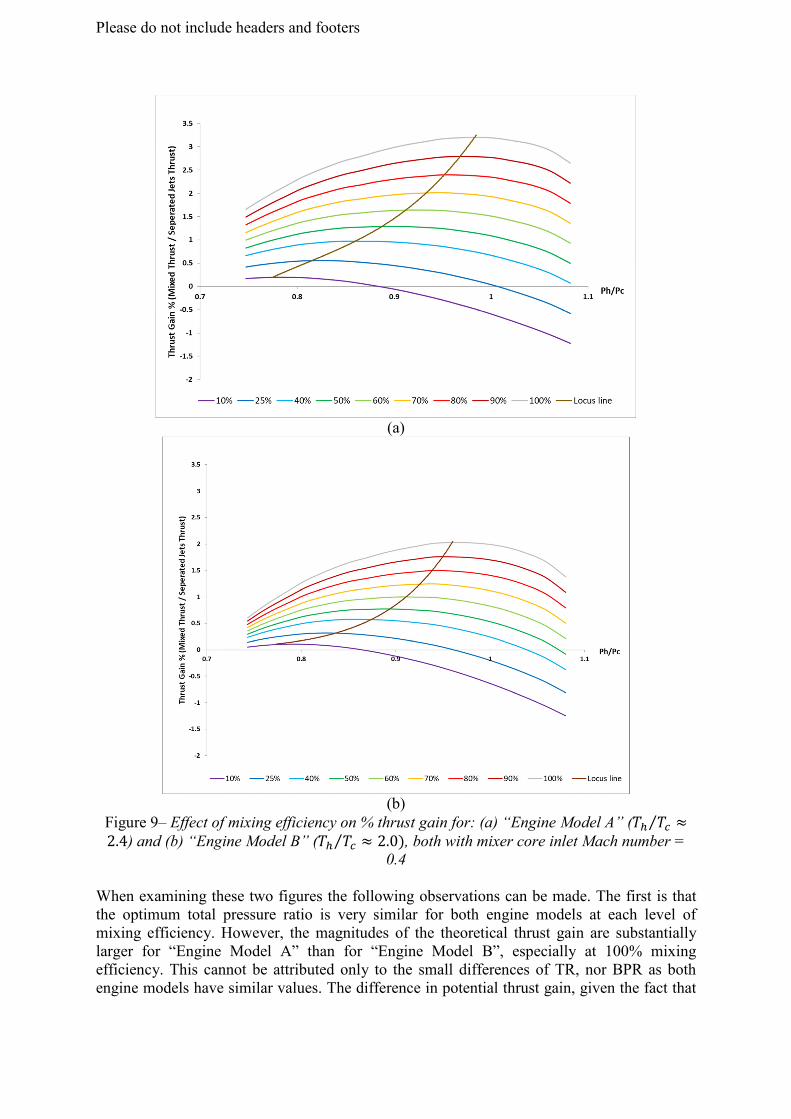
A parametric study was conducted to identify the effect of mixing efficiency on the availabledesign space in regards to the mixer inlet characteristics. The main focus was on the mixerinlet total pressure ratio, which is directly controlled by the FPR. The study was conductedusing the same engine models and methodology from the verification study. For this study arange of mixing efficiency was simulated at different inlet mixer pressure ratios. The mixingefficiency ranged from 10% to 100%. The core Mach number at mixer entry chosen was 0.4.The results for “Engine Model A” and “Engine Model B” are shown in Figure 9 (a) and (b)respectively.
Please do not include headers and footers
(a)
(b)Figure 9– Effect of mixing efficiency on % thrust gain for: (a) “Engine Model A” (�� ��⁄ ≈2.4) and (b) “Engine Model B” (�� ��⁄ ≈ 2.0), both with mixer core inlet Mach number =
0.4
When examining these two figures the following observations can be made. The first is thatthe optimum total pressure ratio is very similar for both engine models at each level ofmixing efficiency. However, the magnitudes of the theoretical thrust gain are substantiallylarger for “Engine Model A” than for “Engine Model B”, especially at 100% mixingefficiency. This cannot be attributed only to the small differences of TR, nor BPR as bothengine models have similar values. The difference in potential thrust gain, given the fact that
Please do not include headers and footers
for each engine model the values of TET, OPR and Specific Thrust were fixed, should belinked to the size of each engine and their points of comparison.
The potential thrust gain that a mixed-exhaust engine can have is numerically associated withthe reduction in FPR and LPT pressure ratios compared to a separate-jets engine with thesame Specific Thrust. For a given turbofan, the optimum FPR relates to a certain amount ofenergy conveyed between the core and the by-pass flow. In a separate-exhaust turbofan thisenergy needs to be transferred through the LPT and the fan where some losses take place.However, for a mixed-exhaust turbofan some of the conveyed energy can be transferredthrough the mixer, increasing the transmission efficiency, and therefore reducing the LPTpressure ratio and the optimum FPR. The difference in magnitude between the optimumFPRs for both configurations (given the same Specific Thrust), will frame the potential thrustgain when mixer installation effects are not taken into account.
The reason for the reduction in thrust gain for lower specific thrust, like for “Engine ModelB” with roughly the same BPR than “Engine Model A”, should be investigated at theircorresponding points of comparison. “Engine Model B” has about 40% more inlet mass flowthan the “Engine Model A”; roughly estimated through fan diameter; 2.192m against1.882m[1] respectively. A similar low Specific Thrust separate-jets engine as “Engine ModelB” would be designed (considering the same scale thrust-fan diameter) with a low FPR;therefore the impact of reducing the LPT pressure ratio and FPR through mixing would beless pronounced.These parametric results also show that even though the mixer inlet pressure ratio is the samein both engine models, the FPRop for “Engine Model A” is larger than for “Engine Model B”,which is expected, given the bigger specific thrust of the first [22]. It was also numericallyreproduced that the total pressure ratio at the mixer inlet, is strongly influenced by the FPRselection, as it is shown by the shape of the potential thrust gain curves.
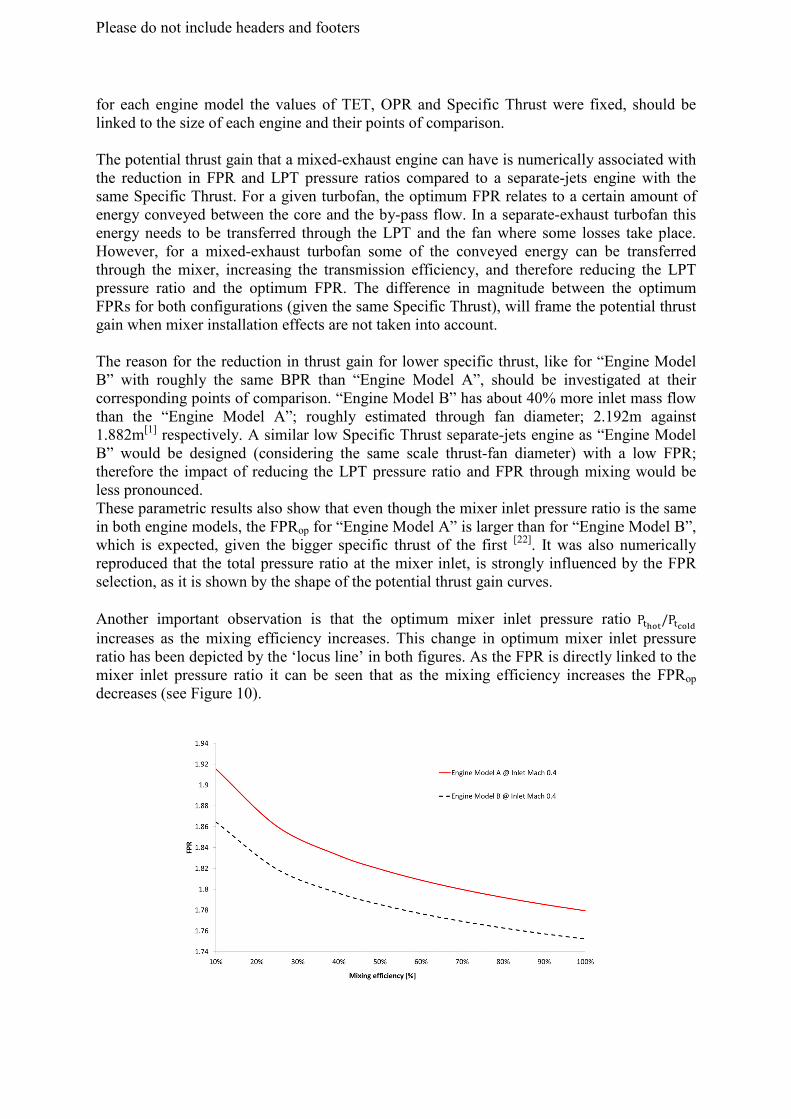
Another important observation is that the optimum mixer inlet pressure ratio P����/P�����increases as the mixing efficiency increases. This change in optimum mixer inlet pressureratio has been depicted by the ‘locus line’ in both figures. As the FPR is directly linked to themixer inlet pressure ratio it can be seen that as the mixing efficiency increases the FPRop
decreases (see Figure 10).
Please do not include headers and footers
Figure 10– Effect of mixing efficiency on FRP in “Engine Model A” (�� ��⁄ ≈ 2.4) and“Engine Model B” (�� ��⁄ ≈ 2.0), both with mixer core inlet Mach number = 0.4
The reason for this is that the FPR is primarily determined by the conditions at which mixingoccurs, and according to Guha[22], the FPRop is greatly influenced by the Specific Thrust (notthe BPR) of a mixed-exhaust engine. In the same work, it was demonstrated that the SpecificThrust is a linear function of the mixing efficiency (equation 23 of [22]); therefore increasingmixing efficiency will have the same monotonic relationship with the optimum FPR.
4.3 Mixer inlet Mach number parametric study
The second parametric study conducted was on the mixer inlet Mach number of the hotstream. The reason for this parametric study was to gain a clearer understanding of theinfluence the mixer inlet Mach number has on the stability of the thermodynamic enginemodel. Since Hartmann [4], selecting a value of around 0.4 for the mixing inlet Mach numberhas become a common convention at design point; however, it is important to understand theinfluence the mixer inlet Mach number has on inlet flow characteristic and the ratio of totalpressures at the mixer inlet. Guha[22], looked at the effect of mixer inlet Mach number onFPRop, he changes the mixer inlet Mach number from 0.2 to 0.6. He only looked at thisparameter very briefly but did not draw any substantial conclusions from the result. Thisstudy advances from the analysis of Mach number impact reported in Guha[22].
For this study, the same engine models as in the previous parametric study were used. Theengines were simulated using different inlet Mach numbers for the hot stream ranging from0.1 to 0.5. Furthermore, the engine models were also run over a mixing efficiency range from10 to 100%. It needs to be pointed out that the losses were fixed in this study as well. Thismeans that the increased diameter of the mixer due to the lower Mach numbers did not affectthe losses experienced in the mixer.
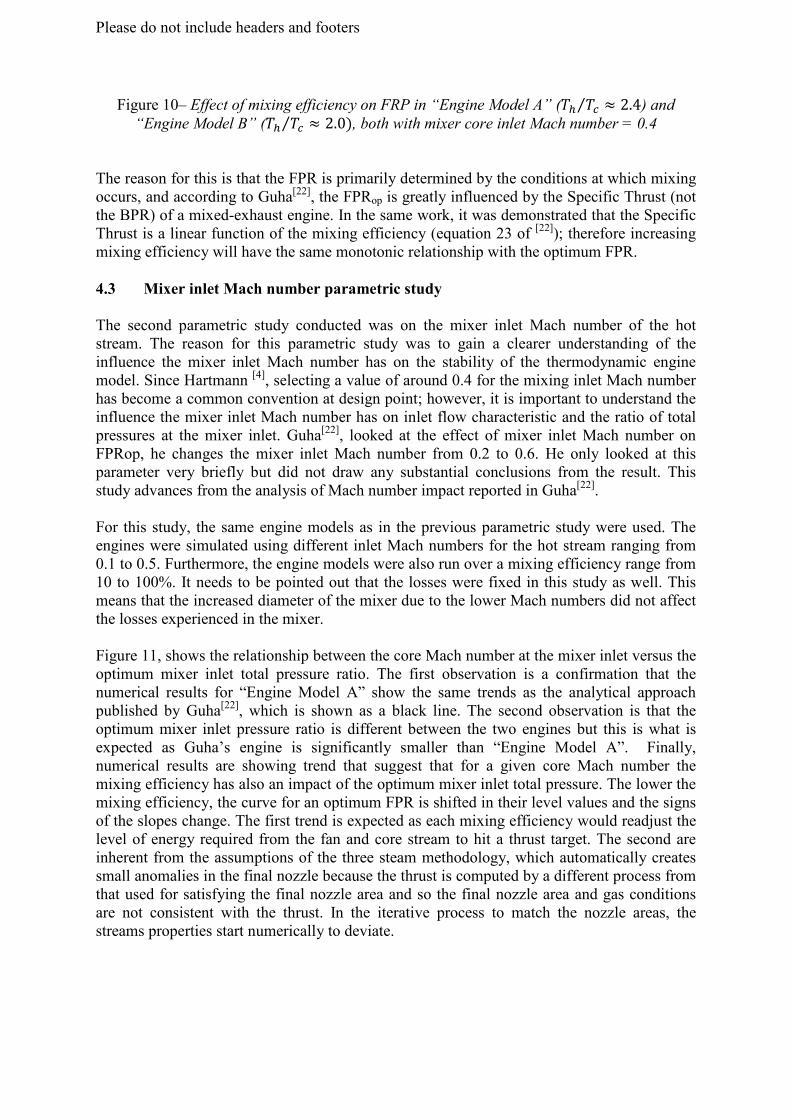
Figure 11, shows the relationship between the core Mach number at the mixer inlet versus theoptimum mixer inlet total pressure ratio. The first observation is a confirmation that thenumerical results for “Engine Model A” show the same trends as the analytical approachpublished by Guha[22], which is shown as a black line. The second observation is that theoptimum mixer inlet pressure ratio is different between the two engines but this is what isexpected as Guha’s engine is significantly smaller than “Engine Model A”. Finally,numerical results are showing trend that suggest that for a given core Mach number themixing efficiency has also an impact of the optimum mixer inlet total pressure. The lower themixing efficiency, the curve for an optimum FPR is shifted in their level values and the signsof the slopes change. The first trend is expected as each mixing efficiency would readjust thelevel of energy required from the fan and core stream to hit a thrust target. The second areinherent from the assumptions of the three steam methodology, which automatically createssmall anomalies in the final nozzle because the thrust is computed by a different process fromthat used for satisfying the final nozzle area and so the final nozzle area and gas conditionsare not consistent with the thrust. In the iterative process to match the nozzle areas, thestreams properties start numerically to deviate.
Please do not include headers and footers
Figure 11 – Effect of mixer core inlet Mach number on optimum mixer inlet pressure ratio for“Engine Model A” at mixing efficiency of 100%, 80%, 40% and 25%
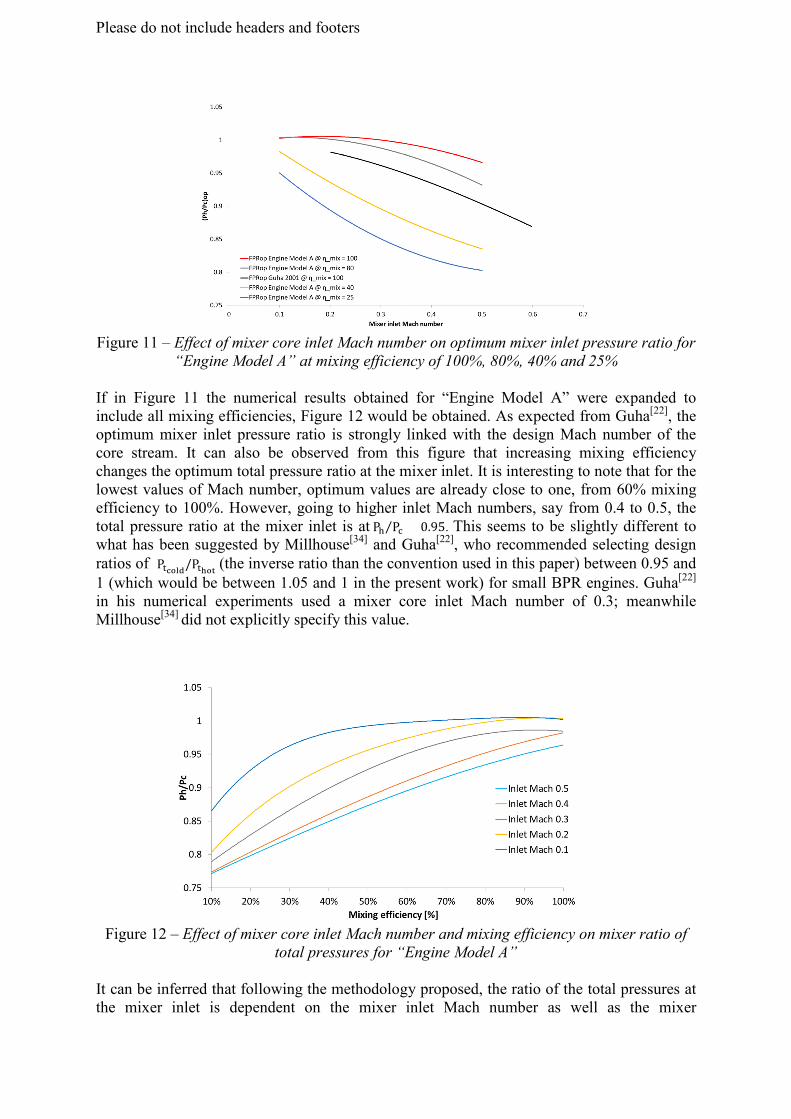
If in Figure 11 the numerical results obtained for “Engine Model A” were expanded toinclude all mixing efficiencies, Figure 12 would be obtained. As expected from Guha[22], theoptimum mixer inlet pressure ratio is strongly linked with the design Mach number of thecore stream. It can also be observed from this figure that increasing mixing efficiencychanges the optimum total pressure ratio at the mixer inlet. It is interesting to note that for thelowest values of Mach number, optimum values are already close to one, from 60% mixingefficiency to 100%. However, going to higher inlet Mach numbers, say from 0.4 to 0.5, thetotal pressure ratio at the mixer inlet is at P� P�⁄ = 0.95. This seems to be slightly different towhat has been suggested by Millhouse[34] and Guha[22], who recommended selecting designratios of P�����/P���� (the inverse ratio than the convention used in this paper) between 0.95 and1 (which would be between 1.05 and 1 in the present work) for small BPR engines. Guha[22]
in his numerical experiments used a mixer core inlet Mach number of 0.3; meanwhileMillhouse[34] did not explicitly specify this value.
Figure 12 – Effect of mixer core inlet Mach number and mixing efficiency on mixer ratio oftotal pressures for “Engine Model A”
It can be inferred that following the methodology proposed, the ratio of the total pressures atthe mixer inlet is dependent on the mixer inlet Mach number as well as the mixer
Please do not include headers and footers
effectiveness. Furthermore, at design point for a fixed core inlet Mach number the mixer inletpressure ratio increases significantly with the increase in mixing efficiency.
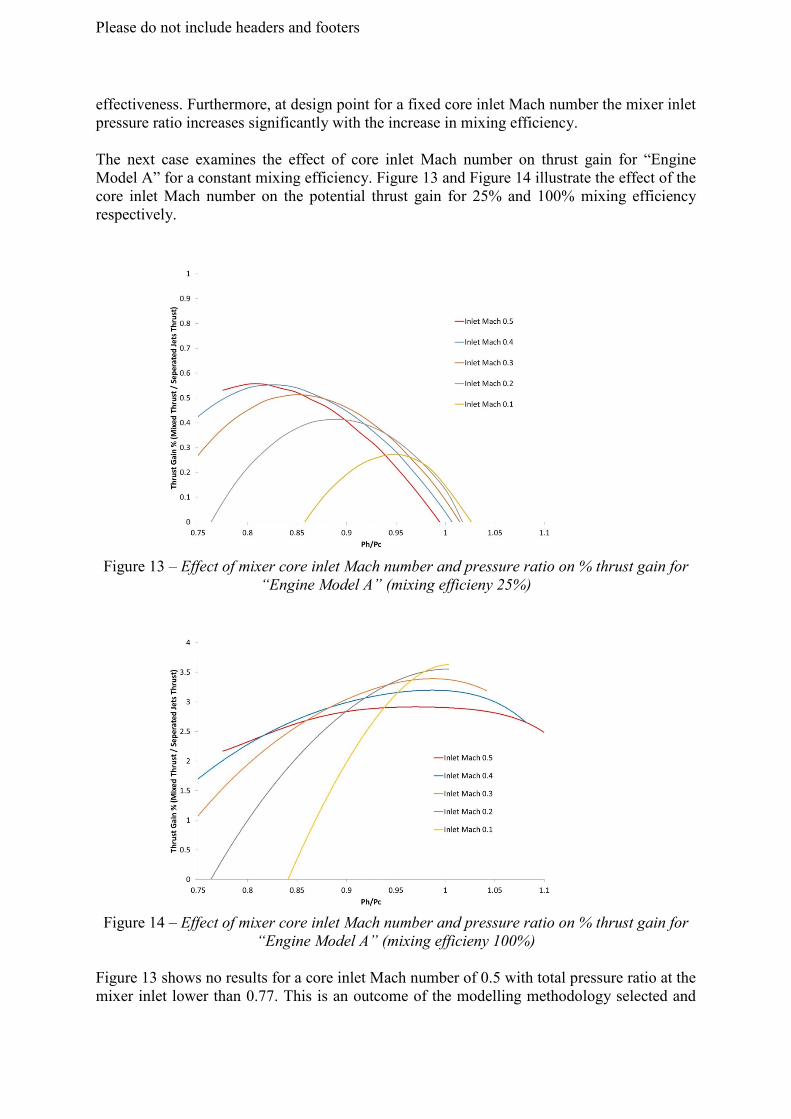
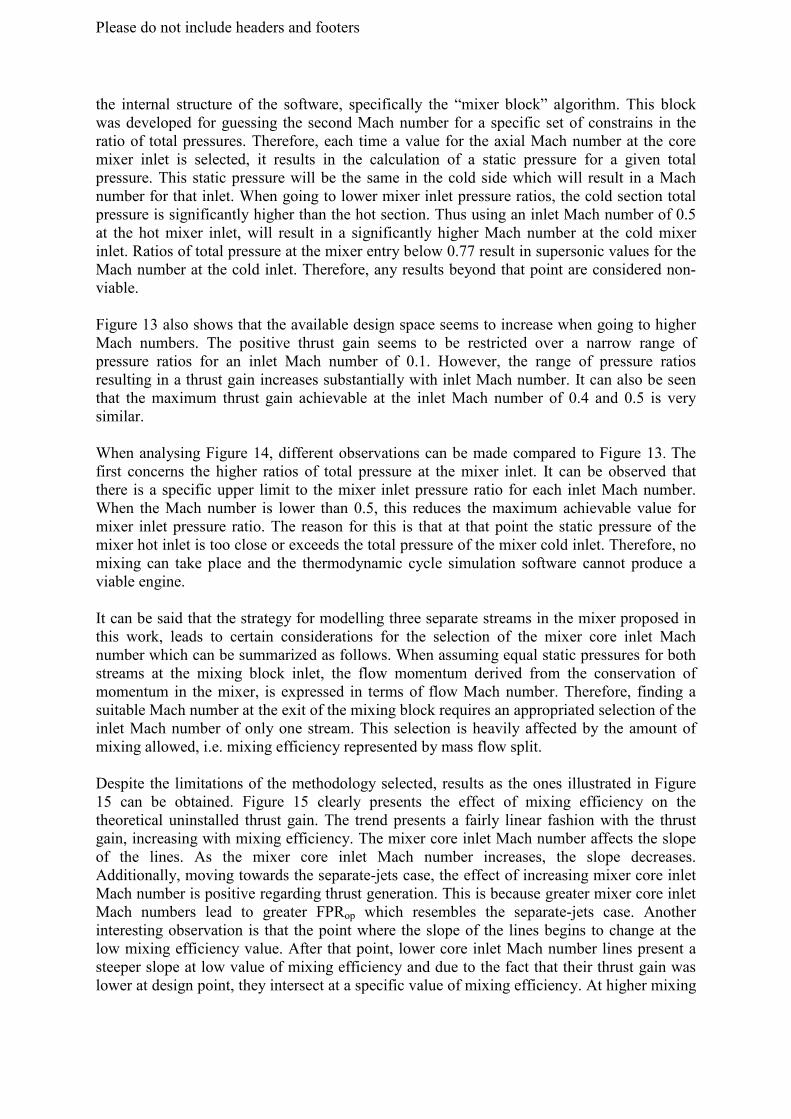
The next case examines the effect of core inlet Mach number on thrust gain for “EngineModel A” for a constant mixing efficiency. Figure 13 and Figure 14 illustrate the effect of thecore inlet Mach number on the potential thrust gain for 25% and 100% mixing efficiencyrespectively.
Figure 13 – Effect of mixer core inlet Mach number and pressure ratio on % thrust gain for“Engine Model A” (mixing efficieny 25%)
Figure 14 – Effect of mixer core inlet Mach number and pressure ratio on % thrust gain for“Engine Model A” (mixing efficieny 100%)
Figure 13 shows no results for a core inlet Mach number of 0.5 with total pressure ratio at themixer inlet lower than 0.77. This is an outcome of the modelling methodology selected and
Please do not include headers and footers
the internal structure of the software, specifically the “mixer block” algorithm. This blockwas developed for guessing the second Mach number for a specific set of constrains in theratio of total pressures. Therefore, each time a value for the axial Mach number at the coremixer inlet is selected, it results in the calculation of a static pressure for a given totalpressure. This static pressure will be the same in the cold side which will result in a Machnumber for that inlet. When going to lower mixer inlet pressure ratios, the cold section totalpressure is significantly higher than the hot section. Thus using an inlet Mach number of 0.5at the hot mixer inlet, will result in a significantly higher Mach number at the cold mixerinlet. Ratios of total pressure at the mixer entry below 0.77 result in supersonic values for theMach number at the cold inlet. Therefore, any results beyond that point are considered non-viable.
Figure 13 also shows that the available design space seems to increase when going to higherMach numbers. The positive thrust gain seems to be restricted over a narrow range ofpressure ratios for an inlet Mach number of 0.1. However, the range of pressure ratiosresulting in a thrust gain increases substantially with inlet Mach number. It can also be seenthat the maximum thrust gain achievable at the inlet Mach number of 0.4 and 0.5 is verysimilar.
When analysing Figure 14, different observations can be made compared to Figure 13. Thefirst concerns the higher ratios of total pressure at the mixer inlet. It can be observed thatthere is a specific upper limit to the mixer inlet pressure ratio for each inlet Mach number.When the Mach number is lower than 0.5, this reduces the maximum achievable value formixer inlet pressure ratio. The reason for this is that at that point the static pressure of themixer hot inlet is too close or exceeds the total pressure of the mixer cold inlet. Therefore, nomixing can take place and the thermodynamic cycle simulation software cannot produce aviable engine.
It can be said that the strategy for modelling three separate streams in the mixer proposed inthis work, leads to certain considerations for the selection of the mixer core inlet Machnumber which can be summarized as follows. When assuming equal static pressures for bothstreams at the mixing block inlet, the flow momentum derived from the conservation ofmomentum in the mixer, is expressed in terms of flow Mach number. Therefore, finding asuitable Mach number at the exit of the mixing block requires an appropriated selection of theinlet Mach number of only one stream. This selection is heavily affected by the amount ofmixing allowed, i.e. mixing efficiency represented by mass flow split.
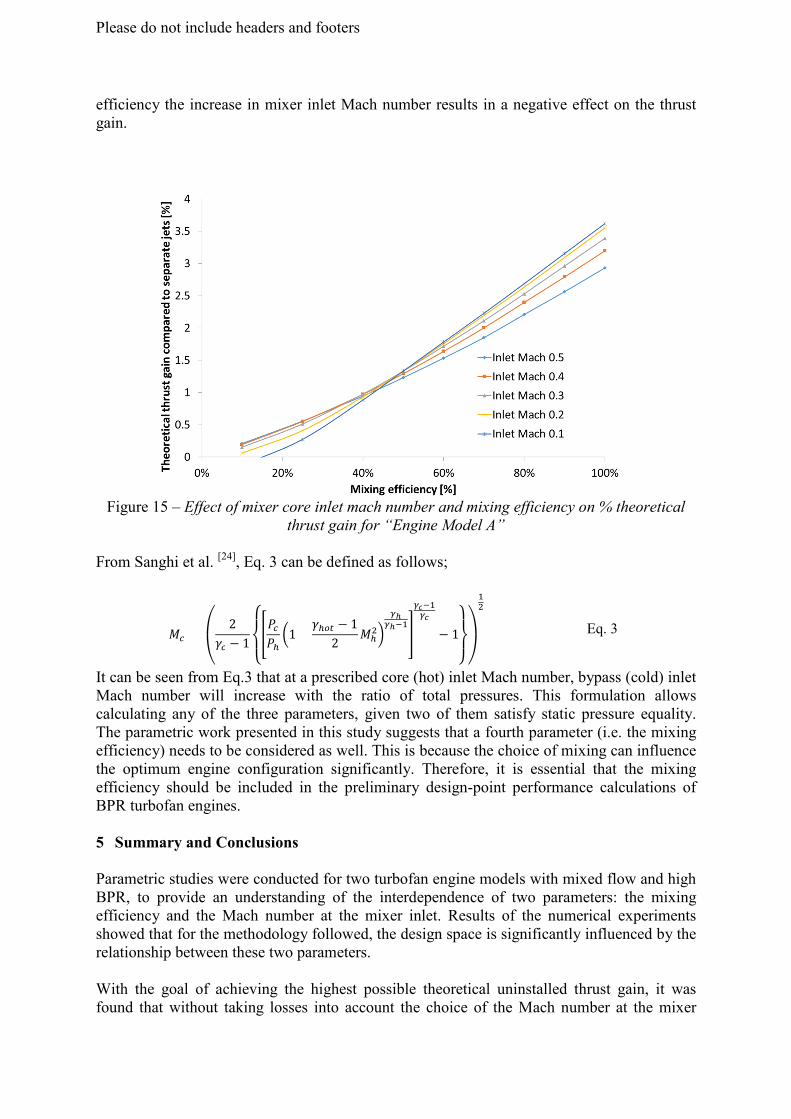
Despite the limitations of the methodology selected, results as the ones illustrated in Figure15 can be obtained. Figure 15 clearly presents the effect of mixing efficiency on thetheoretical uninstalled thrust gain. The trend presents a fairly linear fashion with the thrustgain, increasing with mixing efficiency. The mixer core inlet Mach number affects the slopeof the lines. As the mixer core inlet Mach number increases, the slope decreases.Additionally, moving towards the separate-jets case, the effect of increasing mixer core inletMach number is positive regarding thrust generation. This is because greater mixer core inletMach numbers lead to greater FPRop which resembles the separate-jets case. Anotherinteresting observation is that the point where the slope of the lines begins to change at thelow mixing efficiency value. After that point, lower core inlet Mach number lines present asteeper slope at low value of mixing efficiency and due to the fact that their thrust gain waslower at design point, they intersect at a specific value of mixing efficiency. At higher mixing
Please do not include headers and footers
efficiency the increase in mixer inlet Mach number results in a negative effect on the thrustgain.
Figure 15 – Effect of mixer core inlet mach number and mixing efficiency on % theoreticalthrust gain for “Engine Model A”
From Sanghi et al. [24], Eq. 3 can be defined as follows;
�� =
⎝
⎛2
�� − 1
⎩⎨
⎧
������1 +
���� − 1
2��
��
������
�
������
− 1
⎭⎬
⎫
⎠
⎞
��
Eq. 3
It can be seen from Eq.3 that at a prescribed core (hot) inlet Mach number, bypass (cold) inletMach number will increase with the ratio of total pressures. This formulation allowscalculating any of the three parameters, given two of them satisfy static pressure equality.The parametric work presented in this study suggests that a fourth parameter (i.e. the mixingefficiency) needs to be considered as well. This is because the choice of mixing can influencethe optimum engine configuration significantly. Therefore, it is essential that the mixingefficiency should be included in the preliminary design-point performance calculations ofBPR turbofan engines.
5 Summary and Conclusions
Parametric studies were conducted for two turbofan engine models with mixed flow and highBPR, to provide an understanding of the interdependence of two parameters: the mixingefficiency and the Mach number at the mixer inlet. Results of the numerical experimentsshowed that for the methodology followed, the design space is significantly influenced by therelationship between these two parameters.
With the goal of achieving the highest possible theoretical uninstalled thrust gain, it wasfound that without taking losses into account the choice of the Mach number at the mixer
Please do not include headers and footers
inlet is heavily influenced by the mixing efficiency and vice versa. More specifically, itwould be more beneficial with regards to the theoretical thrust gain to choose a relativelyhigher mixer inlet Mach number at lower mixer effectiveness and a lower mixer inlet Machnumber at higher mixer effectiveness. The numerical results of this study do not take intoaccount the effects on mixer size, weight and design complexity to achieve various levels ofmixing efficiency.
The selection of the Mach numbers at the mixer inlet influences the selection of the optimumFPR through the dependent parameter of mixer total pressures ratio; however the level ofmixing efficiency, or the fraction by which each stream mixes, also plays a significant part indetermining the optimum value for FPR, as that is directly linked to the mixer inlet pressureratio and specific thrust.
The optimum value of total pressure ratio at the mixer inlet (Ph/Pc), would lay between thevalues of 1 to 1.05, only for 100% mixing efficiency and moderate inlet mixer Mach numbers.Following the methodology presented in this article, the maximum theoretical uninstalledthrust gain depends not only on the optimum level of Mach number of each stream, but alsoof the percentage of mass flow which could be mixed from each stream (mixer effectiveness).
It can also be concluded that the engine size influences the potential thrust gain available forthe mixed-exhaust engine. However, this influences the FPRop and not the ratio of totalpressures at the mixer inlet. Furthermore, the mixing efficiency plays a significant part indetermining the optimum value for FPR as that is directly linked to the total pressure ratioand specific thrust.
It can be concluded that the thermodynamic performance of an engine cycle with a mixedexhaust should be derived on the basis of not only by the parameters which are mostconventionally used, such as FPR, BPR, OPR and TR, but also by the selection of the Machnumbers at the mixer entry and the mixer effectiveness.
AcknowledgementThe authors would like to thank William Camilleri, Anthony Jackson and Andrew Rolt fortheir useful input in this research effort.
References
[1] Daley, M. (2010), “Jane’s Aero-Engines”, Issue 28, IHS Jane’s, IHS Global Limited,
Great Britain.
[2] Frost, T. H. (1966), “Practical bypass mixing systems for fan jet aero engine,” The
Aeronautical Quarterly, May, pp. 141.
[3] Pearson, H. (1962), “Mixing of exhaust and bypass flow in a bypass engine,” Journal
of Royal Aeronautical Society, Vol. 66, pp. 528.
[4] Hartmann, A. (1968), "Theory and test of flow mixing for turbofan engines." Journal
of Aircraft, Vol. 5, No. 6, pp. 522.
Please do not include headers and footers
[5] Holmes, M., (1964), “An Investigation Into Mixing Between By-pass Air and Turbine
Exhaust Gases – Part 1”, Ministry of Aviation, National Gas Turbine Establishment,
England, N.G.T.E. Report. No. R. 261.
[6] Holmes, M., (1964), “An Investigation Into Mixing Between By-pass Air and Turbine
Exhaust Gases – Part 2”, Ministry of Aviation, National Gas Turbine Establishment,
England, N.G.T.E. Report. No. R. 262.
[7] Holmes, M., (1964), “An Investigation Into Mixing Between By-pass Air and Turbine
Exhaust Gases – Part 3”, Ministry of Aviation, National Gas Turbine Establishment,
England, N.G.T.E. Report. No. R. 263.
[8] Holmes, M., (1965), “An Investigation Into Mixing Between By-pass Air and Turbine
Exhaust Gases – Part 4”, Ministry of Aviation, National Gas Turbine Establishment,
England, N.G.T.E. Report. No. R. 277.
[9] Leitham, J. J., Kulik , R. A., Weinstein, H., (1969) , “turbulence in the mixing region
between ducted coaxial streams”, NASA, July, 1969.
[10] Ghia, K. N., Torda, T. P., Lavan, Z., (1970), “Turbulent mixing in the initial region of
heterogeneous axisymmetric coaxial confined jets”, NASA, May, 1970.
[11] Kuchar, A.P., Chamberlin, R., (1980), “Scale model performance test investigation of
exhaust system mixers for an energy efficient engine (E3) propulsion system”, AIAA-
80-0229, AIAA, New York
[12] Cullom,R.R., Bobula, G.A. and Burkardt, L.A. (1981), “Mixing efficiency test of an
exhaust gas mixer in a high bypass turbofan at altitude”, NASA TM 82663, NASA,
Cleveland, OH.
[13] Rowe, K. Kuchar, A.P., (1982), “Scaled mixer performance report” NASA CR
167947, NASA, Cleveland, OH.
[14] Oates, G. C., (1985) "Performance estimation for turbofans with and without
mixers", Journal of Propulsion and Power, Vol. 1, No. 3, pp. 252-256.
[15] Barber, T., Moore, G.C., Blatt, J.R., (1988), “Turbofan forced mixer lobe flow
modelling”, NASA, Washington
[16] Babbit, R.R., Cohn, J.A. and Fleming, K.J. (1991), “Advance high bypass mixed-flow
exhaust system design study”, AIAA-91-2242, AIAA, Washington, DC.
[17] Booher, M.E., Kwon, O., Barta, A.B., (1993), “Development of an advanced exhaust
mixer for a high bypass ratio turbofan engine”, AIAA, Washington, DC.
[18] Tsui,Y., Wu, P.W., (1996),”Investigation of the mixing flow structure in multilobe
mixers”, AIAA Journal, vol 34, no. 7, pp. 1386-1391
Please do not include headers and footers
[19] Barta, A.B., Vittal, B.R. and Dalton, W.N. (1997), “Experimental verification of the
exhaust mixing process in turbofan engines”, AIAA, Washington
[20] Mundt, Ch., Lieser, J., (2001), “Performance improvement of propulsion systems by
optimization of the mixing efficiency and pressure loss of forced mixers”, 8th
European Propulsion Forum, 26-28 March 2001, Nottingham, United Kingdom.
[21] Sheng, Zhi-quiang, (2017) “Jet mixing of lobed nozzles with spoilers located at lobe
peaks”, Applied Thermal Engineering, Vol 119, pp 165-175.
[22] Guha, A. (2001), “Optimum fan pressure ratio for bypass engines with separate or
mixed exhaust streams”, Journal of Power and Propulsion, vol. 17, no. 5, pp. 1117.
[23] Millhouse PT, Kramer SC, King PI, Mykytka EF. (2000) “Identifying optimal fan
compressor pressure ratios for the mixed-stream turbofan engine”. Journal of Power
and Propulsion. Vol 16, No 1, February; p. 79-86.
[24] Sanghi V, Lakshmanan BK. (2002) “Optimum mixing of core and bypass streams in
high-bypass civil turbofan”. Journal of Power and Propulsion, Vol 18, No 4, July-
August, p. 907-911
[25] Rayee, T., Verstraete, D. and Hendrick, P. (2008), "Development of a mixer model to
compare mixed and unmixed HBPR turbofans", AIAA 2008-4963/44th
AIAA/ASME/SAE/ASEE Joint Propulsion Conference & Exhibit, 21-23 July 2008,
Harftord, CT
[26] Walsh, P. and Fletcher, P. (2004), “Gas turbine performance”, 2nd ed, Blackwell
Science Ltd, Great Britain.
[27] Wachter,J. and Kopf, F.(2009), “Advance exhaust performance modelling of mixed
turbofan engines – Less is more”, Proceedings of the 2009 ASME Turbo Expo, Vol.1,
8-12 June 2009, Orlando, FL,pp.155-164.
[28] Vivek Sanghi and Lakshmanan, B.K. (2002), “Optimum Mixing of Core and Bypass
Streams in High-Bypass Civil Turbofan”, Journal of Propulsion and Power, Vol 18,
No.4, July-August 2002.
[29] Kuchar, A.P. and Chamberlin, R. (1985), “Subscale-model and full-scale engine
mixed-flow exhaust system performance comparison”, Journal of Aircraft, vol. 22,
no. 11, pp. 950 – 955
[30] MacMillan, W.L. (1974), “Development of a modular-type computer program for the
calculation of gas turbine off-design performance (PhD Thesis)”, Cranfield
University, Cranfield Press, UK
Please do not include headers and footers
[31] Van den Hout, F. (1991), “Gas turbine performance simulation improvements to the
Turbomatch scheme”, Cranfield University, Cranfield Press, UK.
[32] Palmer, J. (1999), “The Turbomatch scheme for aero/industrial gas turbine engine
design point/off design performance calculation”, (unpublished), Cranfield
University, UK
[33] Igie, U., Diez-Gonzalez, P., Giraud, A. Minervino, O., (2016), “Evaluating gas
turbine performance using machine-generated data: Quantifying degradation and
impacts of compressor washing”, Journal of Engineering for Gas Turbines and Power,
Vol 138, Issue 12
[34] Millhouse, P.T., Kramer,S.C., King, P.I. and Mykytka, E.F. (2000), “Identifying
optimal fan compressor pressure ratios for the mixed-stream turbofan engine”, Journal
of Propulsion and Power, Vol 16, No 1, pp. 79-86.