effect of nano-additives on epoxy compositesethesis.nitrkl.ac.in/6237/1/110cr0613-16.pdf · effect...
TRANSCRIPT

Page | 1
EFFECT OF NANO-ADDITIVES ON EPOXY COMPOSITES
A Thesis Submitted to
National Institute of Technology
Rourkela
In Partial fulfillment of the requirement for the degree of
Bachelor of Technology
in
Ceramic Engineering
By
GAURAV MISRA
110CR0613
Department of Ceramic Engineering
National Institute of Technology
Rourkela -769 008 (India)
2014

Page | 2
EFFECT OF NANO-ADDITIVES ON EPOXY COMPOSITES
A Thesis Submitted to
National Institute of Technology
Rourkela
In Partial fulfillment of the requirement for the degree of
Bachelor of Technology
in
Ceramic Engineering
By
GAURAV MISRA
110CR0613
Under the guidance and supervision of
Prof. S. K. PAL
Department of Ceramic Engineering
National Institute of Technology
2014

Page | 3
Rourkela -769 008 (India)

Page | 4

Page | 5
Abstract
Nanoparticle incorporation is a convenient way to enhance the mechanical properties of polymer
matrices. In the last number of years abundant research has been done published concerning the
enhancement of the mechanical properties of nanoparticle filled polymers. This work analyses
the influence of nano clay and nano carbon reinforcement on the behavior of epoxy matrices.
The nanoparticles were dispersed into the epoxy resin using a direct mixing method. Specimen
preparation and testing were carried out as per ASTM standards. The investigation reveals that,
due to incorporation of nano additives in epoxy composite to some extent give encouraging
results when compared with the neat epoxy. After a certain amount of addition of additives these
properties do not get enhanced and in some cases on further addition of additives the properties
get depleted/deteriorated.
Keywords: Nanoparticles, epoxy composite, direct mixing method

Page | 6
Table of Contents CHAPTER-1 ................................................................................................................................... 9
1. INTRODUCTION ............................................................................................................... 10
1.1 DEFINITION OF COMPOSITE: ............................................................................................................. 10
1.2 Classification ..................................................................................................................................... 11
1.2.1 Classification based on reinforcing material .................................................................................. 11
1.2.2 Classification based on matrix material ........................................................................................ 12
2. LITERATURE SURVEY : ................................................................................................ 15
3. EXPERIMENTAL WORK: ............................................................................................... 20
3.1 Procedure ........................................................................................................................................ 20
3.2 Nanoclay reinforced epoxy composite samples preparation ...................................................... 22
3.2.1 2% nanoclay reinforced sample preparation : ........................................................................... 22
3.2.2 4% nanoclay reinforced sample preparation : ........................................................................... 22
3.2.3 6% nanoclay reinforced sample preparation : ........................................................................... 23
3.3 Nanocarbon reinforced epoxy composite samples preparation .................................................. 23
3.3.1 2% nanocarbon reinforced sample preparation : ...................................................................... 23
3.3.2 4% nanocarbon reinforced sample preparation : ...................................................................... 23
4. RESULTS AND DISCUSSION :...................................................................................... 25
4.1 Density and void content calculation: ........................................................................................... 25
4.2 3 point bending/Flexural Test : ................................................................................................... 27
4.3 Tensile Test : ................................................................................................................................. 33
4.4 Vicker’s Hardness Test : ................................................................................................................ 36
5. CONCLUSION : .................................................................................................................. 40
REFERENCES : ......................................................................................................................... 41
Page | 7
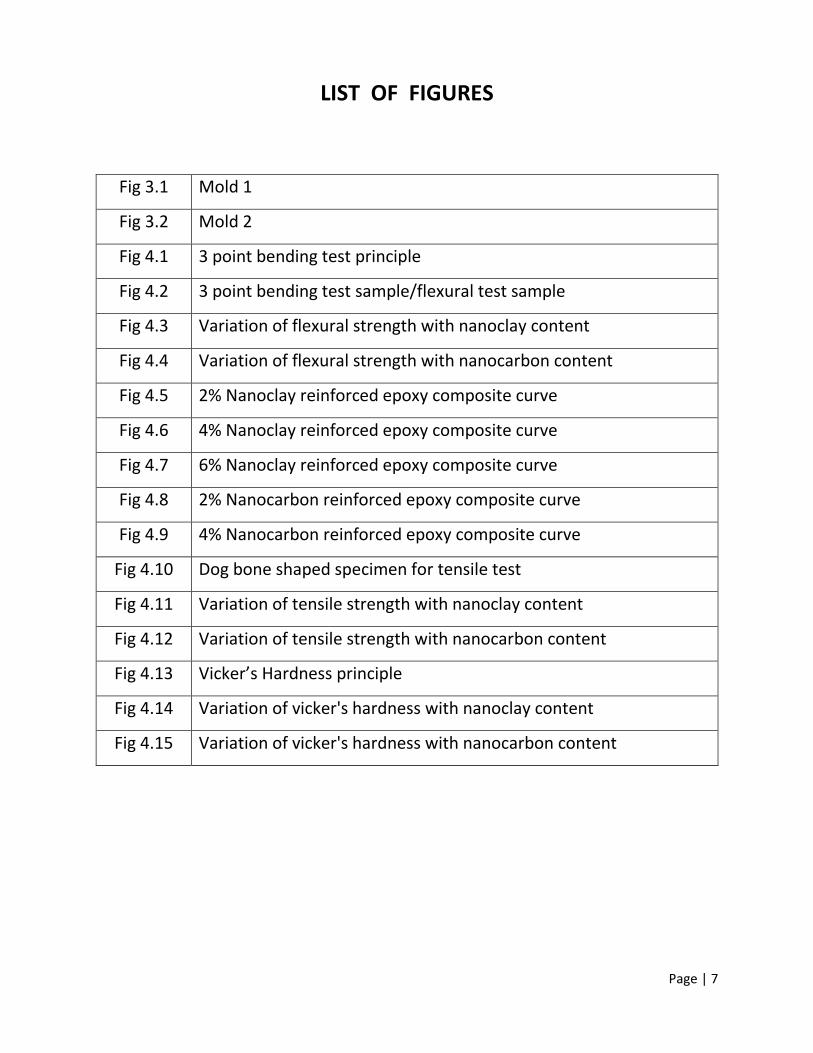
LIST OF FIGURES
Fig 3.1 Mold 1
Fig 3.2 Mold 2
Fig 4.1 3 point bending test principle
Fig 4.2 3 point bending test sample/flexural test sample
Fig 4.3 Variation of flexural strength with nanoclay content
Fig 4.4 Variation of flexural strength with nanocarbon content
Fig 4.5 2% Nanoclay reinforced epoxy composite curve
Fig 4.6 4% Nanoclay reinforced epoxy composite curve
Fig 4.7 6% Nanoclay reinforced epoxy composite curve
Fig 4.8 2% Nanocarbon reinforced epoxy composite curve
Fig 4.9 4% Nanocarbon reinforced epoxy composite curve
Fig 4.10 Dog bone shaped specimen for tensile test
Fig 4.11 Variation of tensile strength with nanoclay content
Fig 4.12 Variation of tensile strength with nanocarbon content
Fig 4.13 Vicker’s Hardness principle
Fig 4.14 Variation of vicker's hardness with nanoclay content
Fig 4.15 Variation of vicker's hardness with nanocarbon content

Page | 8
LIST OF TABLES
Table 4.1 Actual Density and Void Content in nanoclay reinforced epoxy
composite
Table 4.2 Actual Density and Void Content in nanocarbon reinforced epoxy
composite
Table 4.3 Flexural strength of nanoclay reinforced epoxy composites
Table 4.4 Flexural strength of nanocarbon reinforced epoxy composites
Table 4.5 Tensile strength of nanoclay and nanocarbon reinforced epoxy
composites
Table 4.6 Vicker’s Hardness of nanoclay and nanocarbon reinforced epoxy
composites

Page | 9
CHAPTER-1
Introduction

Page | 10
1. INTRODUCTION :
Polymer composite materials have generated wide interest in various engineering fields,
particularly in aerospace applications, because these materials exhibit high specific strength and
stiffness as compared to monolithic metal alloy [6]. Due to the ease of fabrication and low cost,
polymer composite materials find different application such as helicopter rotor blades, pipe line
carrying sand slurries in petroleum refining, pump impeller blades[7,8], high-speed vehicles and
aircraft operating in desert environments, water turbines, and aircraft engine blades.[9]
Natural fiber materials are dime a dozen in nature. Researchers are still working in this field to
achieve composite materials with unique properties with low cost and environment friendly. For
advanced composite matrix, thermosetting polymer i.e. epoxy resin is widely used for its good
stiffness, dimensional stability and chemical resistance characteristic [10]. Natural lingo-cellulosic
fillers (bamboo, flax, jute, hemp, etc.) are environmentally friendly in nature as compared to
conventional reinforcing fibers (glass, carbon).[11,12] Luo and Netravali[13] studied the tensile
and flexural properties of the green composites with different pineapple fiber content and
compared with the virgin resin. Belmares [14] found that sisal, henequen, and palm fiber have
very similar physical, chemical, and tensile properties.
1.1 DEFINITION OF COMPOSITE:
The most widely used meaning is the following one, which has been stated by Jartiz [2] “Composites
are multifunctional material systems that provide characteristics not obtainable from any discrete
material. They are cohesive structures made by physically combining two or more compatible
materials, different in composition and characteristics and sometimes in form”. Accordingly one may
classify among the composite materials nearly all substances such as bones, wood, shell etc., and also
some man-made materials such as certain powder metallurgy products, electrical insulators, resin
bonded magnetic materials, powder charged plastics, paper laminates etc..
The weakness of this definition resided in the fact that it allows one to classify among the composites
any mixture of materials without indicating either its specificity or the laws which should give it which
distinguishes it from other very banal, meaningless mixtures.

Page | 11
Kelly [3] very clearly stresses that the composites should not be regarded simple as a combination of
two materials. In the broader significance; the combination has its own distinctive properties. In
terms of strength to resistance to heat or some other desirable quality, it is better than either of the
components alone or radically different from either of them.
Berghezan [4] defines as “The composites are compound materials which differ from alloys by the
fact that the individual components retain their characteristics but are so incorporated into the
composite as to take advantage only of their attributes and not of their short comings”, in order to
obtain improved materials.
1.2 Classification
Composite materials can be classified in different ways [5].
1.2.1 Classification based on reinforcing material
Particulate Composites
The reinforcement is of particle nature (platelets are also included in this class). In this type of
composites, 1μm to 200μm size particles are dispersed in the matrix. It may be spherical, cubic,
tetragonal, a platelet, or of other regular or irregular shape, but they are equiaxed. Generally particles
are not very effective in improving fracture resistance but they enhance the stiffness of the composite
to a limited extent. Particle fillers are extensively used to improve the properties of matrix materials
such as to modify the thermal and electrical conductivities, improve performance at elevated
temperatures, increase wear, reduce friction and abrasion resistance, improve machinability,
increase surface hardness and reduce shrinkage.
Fibrous composites
A fiber is characterized by its length being much greater than its dimension of cross section. The
dimensions of the reinforcement determine its capability of its properties to the composite.
Fibers play very effective role in improving the fracture resistance of the matrix since a
reinforcement having a long dimension discourages the growth of incipient cracks normal to the
reinforcement that might otherwise lead to ultimate failure, particularly with brittle matrix
composites.

Page | 12
1.2.2 Classification based on matrix material
1) Metal matrix composites
Metal matrix composites possess better properties, when compared with organic matrices.
These include (i) can retain their strength even at higher temperatures, (ii) higher transverse
strength, (iii) better electrical and thermal conductivities,(iv) better erosion resistance etc. Major
disadvantage of metal matrix composites is higher densities and low specific mechanical
properties when compared to polymer matrix composites. Another notable difficulty is
requirement of very high energy for fabrication.
2) Polymer matrix composites
A very large proportion of polymeric materials consisting of both thermosetting and
thermoplastic, are used as matrix materials in the preparation composites. The resinous binders
(polymer matrices) are selected taking fatigue resistance, adhesive strength, heat resistance,
chemical and moisture resistance etc into account. The resin must have mechanical strength with
that of the reinforcement. It should be easy to be employed in the fabrication process selected
and also satisfy the service conditions. On the other hand, the resin matrix must have the
capability of wetting and penetrating into the bundles of fibers which provide the reinforcement,
replacing the dead air spaces with in and offering those physical characteristics capable of
enhancing the performance of fibers.
3) Ceramic matrix composites
Ceramic fibers, such as alumina and SiC (Silicon Carbide) have better results in very high temperature
applications, and also where the environment attack is a major problem. Since ceramics show poor
properties in tension and shear, most of its applications as reinforcement are in the particulate form

Page | 13
(e.g. zinc and calcium phosphate). Ceramic Matrix Composites (CMCs) used in very high temperature
environments, these materials use a ceramic material as the matrix and reinforce it.
Composites as engineering materials normally characterized by
1. These are artificially made (thus, excluding natural material such as wood).
2. These consist of at least two different species with a well-defined interface.
3. Their properties are influenced by the volume percentage of ingredients.
4. These have at least one property not possessed by the individual constituents.

Page | 14
CHAPTER-2 Literature Survey

Page | 15
2. LITERATURE SURVEY :
Epoxy is the cured final result of epoxy resins, and an everyday name for the epoxide functional
group. Epoxy is additionally a typical name for a kind of strong adhesive utilized for sticking things
together and covering surfaces [15], regularly two resins that need to be combined before
utilization.
Epoxy resins, otherwise called polyepoxides are a class of reactive prepolymers and polymers
which hold epoxide groups. Epoxy resins may be responded (cross-connected) either with
themselves through reactant homopolymerisation, or with an extensive variety of co-reactants
including polyfunctional amines, acids (and acid anhydrides), phenols, alcohols, and thiols. These
co-reactants are frequently alluded to as hardeners or curatives, and the cross-joining response
is regularly alluded to as curing. Reaction of polyepoxides with themselves or with polyfunctional
hardeners structures a thermosetting polymer, regularly with great mechanical properties and
additionally high temperature and compound safety. Epoxy has an extensive variety of modern
provisions, including metal coatings, use in electronic and electrical parts, high pressure electrical
separators, fiber-strengthened plastic materials, and structural glues. Epoxy sap is utilized to tie
gutta percha in some root waterway procedures [16].
J.a.m. Ferreira , L.p. Borrego , J.d.m. Costa, C. Capela [19] reported that fatigue quality
diminished with the nanoclay joining into the matrix. Fatigue life of nanoclay filled composites
was altogether lessened by the score impact and by the submersion in water.
Jeena Jose Karippal, H.n. Narasimha Murthy, K.s. Rai, M. Sreejith and M. Krishna [20] reported
that mechanical properties, for example, tensile strength, Young's modulus, flexural quality,
flexural modulus, interlaminar shear quality, and microhardness of the cross breed composites
expanded with expansion in nanoclay stacking up to 5 wt%. Glass transition temperature
expanded barely at 2 wt% nanoclay stacking and the same diminished for further incorporation
of the filler. The tensile-fractured examples were considered to inspect the mode of
disappointment utilizing filtering electron magnifying instrument

Page | 16
JAM Ferreira, PNB Reis, JDM Costa, and MOW Richardson [21] reported that the addition of
nanoclays reduced static strength and increased the stiffness in both tension and bend loading.
Filled composites exhibited tensile fatigue strengths 12% higher than unfilled matrices, but in
three-point bending the fatigue strength of filled composites was lower. The filler used was an
organoclay Cloisite 30B after applying an appropriate silane treatment and other proprietary
chemicals to improve the dispersion and interface adhesion. Twelve ply laminates, all in the same
direction, of woven bidirectional Kevlar 292, were prepared by hand lay-up, using an SR 1500
epoxy resin. The composite sheets were produced by a vacuum moulding process.
Andrea Dorigato, Stefano Morandi, and Alessandro Pegoretti [22] reported that the shaping of
intercalated microstructures prompted significant changes of the thermal (glass transition
temperature) and mechanical (fracture toughness) properties of the epoxy matrix. E-glass
fiber/matrix interfacial shear quality was assessed by the single-fiber microdebonding system.
The presentation of organo-changed clays prompted the arrangement of a stronger fiber-matrix
interface, with an expansion of the interfacial shear quality of about 30%. Simultaneously, the
assessment of the fiber/matrix contact edge uncovered an enhanced wettability when organo-
adjusted clays were included.
Arun K. Subramaniyan and C.t. Sun [23] reported that a decrease in interlaminar fracture
toughness (both mode I and mode II) was seen in the nanoclay strengthened fiber composites.
Arrangement of nanoclay along the fiber pivot was discovered to be a conceivable explanation
behind this diminishment. Mode I and mode II tests were led to measure the interlaminar
fracture toughness of nanoclay strengthened composites.
S. Zainuddin, M.v. Hosur, Y. Zhou, Alfred T. Narteh, Ashok Kumar, S. Jeelani [18] reported that
ideal upgrade in 2 wt.% doped framework in both thermal and mechanical properties when
contrasted with the perfect framework. X-ray diffraction (XRD) and transmission electron
microscopy (TEM) effects showed blended intercalation and shedding of clay platelets in 2 wt.%
framework. Scanning electron micrographs (SEM) of 2 wt.% specimens demonstrated rougher

Page | 17
fracture surface in correlation to slick epoxy tests. In view of the trial comes about, a non-straight
harm model utilizing flexural modulus and Weibull parameters was built to portray the stress–
strain relationship. These recreated strain–strain relationship facilitated well with the test comes
about and demonstrate that the Weibull scale parameter, expanded though the Weibull shape
parameter, stayed harsh with increasing clay content.
Shafi Ullah Khan, Arshad Munir, Rizwan Hussain, Jang-Kyo Kim [24] reported that the fuse of
nanoclay into CFRP composites not just enhances the mechanical properties of the composite in
static stacking, additionally the fatigue life for a given cyclic burden level and the leftover
mechanical properties after a given time of cyclic fatigue. The relating fatigue harm zone is
altogether lessened because of nanoclay. Nanoclay serves to stifle and postponement
delamination harm development and inevitable disappointment by enhancing the fiber/matrix
interfacial bond and through the structuring of nanoclay-induced dimples.
A.Haque, M. Shamsuzzoha, F. Hussain, and D.Dean [25] reported significant improvements in
mechanical and thermal properties of conventional fiber reinforced composites with low loading
of organo silicate nanoparticles. By dispersing 1% by weight nanosilicates, S2-glass/epoxy-clay
nanocomposites attributed to almost 44, 24 and 23% improvement in interlaminar shear
strength, flexural strength and fracture toughness in comparison to conventional S2-glass/epoxy
composites. Similarly, the nanocomposites exhibit approximately 26 C higher decomposition
temperatures than that of conventional composites. This improved properties of fiber reinforced
polymer nanocomposites are achieved mostly due to increased interfacial surface areas,
improved bond characteristics and intercalated/exfoliated morphology of the epoxy-clay
nanocomposites. The TEM observations provide evidence of detailed morphology of the polymer
layered-clay nanocomposites.
Jia-Lin Tsai and Ming-Daw Wu [26] reported the organoclay impact on the mechanical properties
of glass/epoxy nanocomposites. To exhibit the organoclay impact, three separate loadings, 2.5,
5 and 7.5wt% of organoclay were scattered in the epoxy resin utilizing a mechanical blender took

Page | 18
after by sonication. The relating glass/epoxy nanocomposites were ready by embeddings the
organoclay epoxy mixture into the dry glass fiber through a vacuum hand lay-up methodology.
Tensile tests uncovered that longitudinal elasticity diminishes as organoclay stacking increases;
then again, transverse tensile strength increments with the increment of the organoclay. Besides,
SEM perception on the transverse disappointment examples shows that the improved
component is because of the enhanced interfacial holding between the fibers and the
encompassing matrix changed by organoclay. The expanding propensity was likewise found in
the transverse flexural quality of the nanocomposites. Then again, mode I fracture tests showed
that with the expansion of the organoclay, the comparing fracture strength of the
nanocomposites diminishes considerably. For the semi-isotropic glass/epoxy overlays, since the
disappointment is commanded by fiber crack, the quality is not affected altogether by the
organoclay.

Page | 19
CHAPTER 3 Experimental Work

Page | 20
3. EXPERIMENTAL WORK:
Aim:
To find the effect of nano-additives, here nanoclay and naocarbon are used as nano-additives on
epoxy composite.
Principle Involved:
On addition of nano additives in epoxy composite mechanical properties to some extent get
enhanced when compared with the neat epoxy. After a certain amount of addition of additives
these properties do not get enhanced and in some cases on further addition of additives the
properties get depleted/deteriorated.
Chemical ingredients used:
1. Epoxy Composite
2. Hardener
3. Silicon Spray
4. Pervex Sheet
5. Nanoclay
6. Nanoclay
3.1 Procedure:
a) Mold Preparation : The mold was prepared on wooden boards with help of beads. The
shape of the mold was rectangular.

Page | 21
Fig. 3.1 Mold 1
Fig. 3.2 Mold 2
Size of mold :
Breadth of the mold = 150mm
Length of the mold = 130mm
Height upto which the casting is to be done = 5mm

Page | 22
After mold preparation casting of neat epoxy is done first. The neat epoxy is mixed with hardener
in 1:10 ratio then the mixture is poured into the mold and kept for 24 hours at room temperature
under the application of weights so as to impart strength to the settled epoxy.
Volume of sample = Volume of composite (Vc ) + Volume of nano- additive(Va)
In case of neat epoxy sample, Va = 0
Vs = Vc
Vs = 150mm*130mm*5mm
= 97500mm3
= 97.5cm3
Density of epoxy composite = 1.15gm/cm3
Mass of epoxy composite poured into the mold1 sample = 1.15*97.5 = 112.25gm
Therefore, hardener required = 112.25/11= 10.21gm
Mass of neat epoxy used = (112.25-10.21)gm = 102.04gm
Hence, the mass of neat epoxy sample prepared has to be around 115gms.
After the preparation of neat epoxy samples, nanoclay reinforced matrixs are prepared.
3.2 Nanoclay reinforced epoxy composite samples preparation
Commercially available organoclay was used as the nanoclay which is reinforced into the epoxy
matrix in the present work, density of this clay is 1.82gm/cm3.
Density of nanoclay = 1.82gm/cm3
3.2.1 2% nanoclay reinforced sample preparation :
2% of 97.5cm3 = 1.95cm3
Mass of nanoclay used = 1.82*1.95= 3.55gm
Mass of epoxy composite with hardener = (112.25-3.55)gm = 108.7gm
Mass of hardener used = 108.7/11 =9.88gm
Mass of neat epoxy used = (108.7-9.88)gm = 98.82gm
3.2.2 4% nanoclay reinforced sample preparation :
4% of 97.5cm3 = 3.90cm3
Mass of nanoclay used = 1.82*3.90= 7.10gm
Mass of epoxy composite with hardener = (112.25-7.10)gm = 105.15gm

Page | 23
Mass of hardener used = 105.15/11 = 9.56gm
Mass of neat epoxy used = (105.15-9.56)gm = 95.60gm
3.2.3 6% nanoclay reinforced sample preparation :
6% of 97.5cm3 = 5.85cm3
Mass of nanoclay used = 1.82*5.85= 10.65gm
Mass of epoxy composite with hardener = (112.25-7.10)gm = 101.6gm
Mass of hardener used = 101.6/11 = 9.23gm
Mass of neat epoxy used = (101.6-9.23)gm = 92.37gm
3.3 Nanocarbon reinforced epoxy composite samples preparation :-
Commercially available nanocarbon N115 was used as the nanocarbon which is reinforced into
the epoxy matrix in the present work, density of this nanocarbon is 1.5gm/cm3.
Density of nanocarbon = 1.5gm/cm3
3.3.1 2% nanocarbon reinforced sample preparation :
2% of 97.5cm3 = 1.95cm3
Mass of nanoclay used = 1.5*1.95= 2.93gm
Mass of epoxy composite with hardener = (112.25-2.93)gm = 109.32gm
Mass of hardener used = 109.32/11 = 9.94gm
Mass of neat epoxy used = (109.32-9.94)gm = 99.38gm
3.3.2 4% nanocarbon reinforced sample preparation :
4% of 97.5cm3 = 3.90cm3
Mass of nanoclay used = 1.5*3.90= 5.85gm
Mass of epoxy composite with hardener = (112.25-5.85)gm = 106.40gm
Mass of hardener used = 106.4/11 = 9.67gm
Mass of neat epoxy used = (106.4-9.67)gm = 96.73gm
Plates with a dimension of 150 × 130 × 5 mm were moulded, from which the specimens were
machined with the desired dimensions.

Page | 24
CHAPTER 4 Results and Discussion
Page | 25
4. RESULTS AND DISCUSSION :
The following tests were conducted on nanocomposite plates:
1) Density and void content
2) 3 point bending/Flexural test
3) Tensile test
4) Vicker’s hardness test
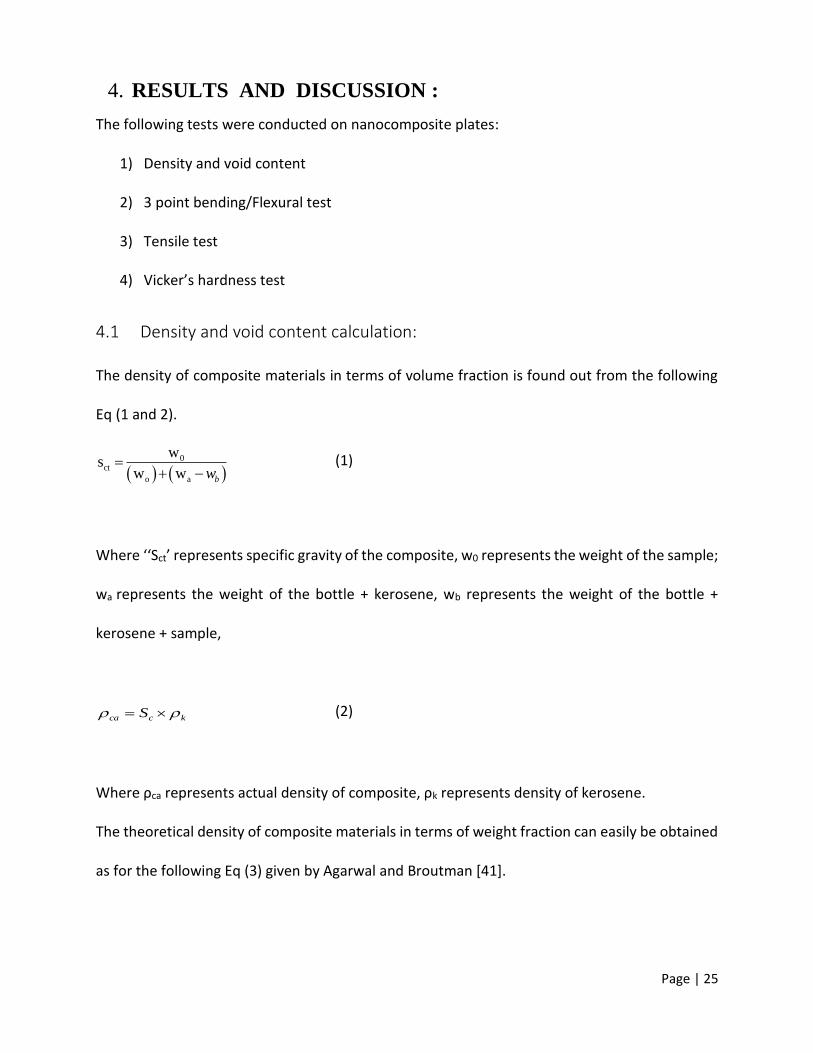
4.1 Density and void content calculation:
The density of composite materials in terms of volume fraction is found out from the following
Eq (1 and 2).
0
ct
o a
ws
w w bw
(1)
Where ‘‘Sct’ represents specific gravity of the composite, w0 represents the weight of the sample;
wa represents the weight of the bottle + kerosene, wb represents the weight of the bottle +
kerosene + sample,
kcca S (2)
Where ρca represents actual density of composite, ρk represents density of kerosene.
The theoretical density of composite materials in terms of weight fraction can easily be obtained
as for the following Eq (3) given by Agarwal and Broutman [41].

Page | 26
m
m
f
fct
ww
1 (3)
Where W and ρ represent weight fraction and density. The suffix f, m and c stand for the fiber,
matrix and the composite materials, respectively.
The void content of composite sample has been determined as per ASTM D-2734-70 standard
procedure respectively. The volume fraction of voids (Vv) in the composites was calculated by
using Eq (4).
ct
cactv
(4)
Where ρct and ρca are the theoretical and actual density of composite respectively.
The actual density of the nanocomposite can also be calculated directly by using pycnometer.
The principle involved in calculating the actual density by pycnometer is as follows :
First, we need to measure the weight of pycnometer together with inserted object
m0+ms. We add water and determine the weight m′H2O (measured weight minus m0+ms). The
volume of added water V′H2O can be obtained as
The volume of measured solid object VS is the difference between the volume of water
that fills the empty pycnometer V and volume V’H2O
Density of measured object ρs can be then calculated as
The following table shows us the values of the actual density and void content present in nano
clay reinforced epoxy composites:

Page | 27
Table 4.1 Actual Density and Void Content in nanoclay reinforced epoxy composite
%
Filler
Density of
Nanoclay
(gm/cm3)
Density of
Neat Epoxy
(gm/cm3)
Theoretical
Density
(gm/cm3)
Actual
Density
(gm/cm3)
Void
Content
(in %)
2 1.82 1.15 1.11 1.15 3.8
4 1.82 1.15 1.12 1.17 4.5
6 1.82 1.15 1.130 1.18 6.2
The following table shows us the values of the actual density and void content present in nano
clay reinforced epoxy composites :
Table 4.2 Actual Density and Void Content in nanocarbon reinforced epoxy composite
%
Filler
Density of
Nanocarbon
(gm/cm3)
Density of
Neat Epoxy
(gm/cm3)
Theoretical
Density
(gm/cm3)
Actual
Density
(gm/cm3)
Void
Content
(in %)
2 1.5 1.15 1.11 1.14 3.54
4 1.5 1.15 1.11 1.17 5.86
The above two tables show that with increase in the percentage of fillers the void content
increases because with increase in the percentage of filler nanovoids increase into the
nanocomposite plates.
4.2 3 point bending/Flexural Test :
Flexural tests were conducted on universal testing machine(UTM) used for in accordance with
ASTM D2344-84. Specimens of 140 mm length and 15 mm wide were cut and were loaded in
three points bending with a recommended span to depth ratio of 16:1 as shown in Fig.4.1. The
test was conducted using a load cell of 10 kN at 2 mm/min rate of loading. The flexural stress in
a three point bending test is found out by using equation.

Page | 28
)(
)3(2
maxmax
bh
LP (5)
Where Pmax is the maximum load at failure (N), L is the span (mm), b and h is the width and
thickness of the specimen (mm), respectively.
Fig 4.1 3 point bending test principle
Fig 4.2 Three point bending test sample/flexural test sample

Page | 29
The following table shows us the values of the flexural strength of the nano clay reinforced epoxy
composites :
Table 4.3 Flexural strength of nanoclay reinforced epoxy composites
S.No. Type of Sample Flexural Strength (Mpa)
1. Neat Epoxy 57.50
2. 2% Nanoclay + Epoxy 65.19
3. 4% Nanoclay + Epoxy 64.60
4. 6% Nanoclay + Epoxy 56.21
The above table and the curve show that 2% nanoclay and 4% nanoclay reinforced matrices have
better flexural strengths as compared to neat epoxy but 4% nanoclay has inferior flexural
strength when compared to 2% nanoclay reinforced composite. 6% nanoclay reinforced
composite has lowest flexural strength and it is lower than that of the neat epoxy as well this is
due to the increase in the agglomerates, inhomogeneities and nanovoids with increasing amount
of the fillers.
45
45.5
46
46.5
47
47.5
48
48.5
0 0.5 1 1.5 2 2.5 3 3.5 4 4.5
Flex
ura
l str
engt
h (
MP
a)
% of nanoclay filler
Fig 4.3 Variation of flexural strength with nanoclay content

Page | 30
The following table shows us the values of the flexural strength of the nano carbon reinforced
epoxy composites :
Table 4.4 Flexural strength of nanocarbon reinforced epoxy composites
S.No. Type of Sample Flexural Strength (Mpa)
1. Neat Epoxy 57.50
2. 2% Nanocarbon + Epoxy 59.93
3. 4% Nanocarbon + Epoxy 58.29
The above table and the curve clearly show that 2% and 4% nanocarbon reinforced composites
have better flexural strengths as compared to that of the neat epoxy but 4% nanocarbon
reinforced matrix has inferior flexural strength than that of 2% nanocarbon reinforced epoxy
composite this is due to the incorporation if nanovoids into the matrix on increasing the filler
content.
45
45.5
46
46.5
47
47.5
48
48.5
0 0.5 1 1.5 2 2.5 3 3.5 4 4.5
Flex
ura
l Str
engt
h (
MP
a)
% of nanocarbon filler
Fig 4.4 Variation of flexural strength with nanocarbon content

Page | 31
The following graphs depict the reinforcement content on the flexural strength of the epoxy
composite:
Fig 4.5 2% Nanoclay reinforced epoxy composite curve
Fig 4.5 4% Nanoclay reinforced epoxy composite curve

Page | 32
Fig 4.7 6% Nanoclay reinforced epoxy composite curve
Fig 4.8 2% Nanocarbon reinforced epoxy composite curve

Page | 33
Fig 4.9 4% Nanocarbon reinforced epoxy composite curve
4.3 Tensile Test :
The tension test is generally performed on flat specimens. The most commonly used specimen
geometries are the dog-bone specimen (Fig. 4.8) and straight-sided specimen with end tabs. The
standard test method as per ASTM D 3039-76 has been used; length of the test specimen used is
140 mm. The tensile test is performed in universal testing machine. A rate of loading of 10
mm/min was used for testing. Tests were conducted on nanoclay reinforced and nanocarbon
reinforced epoxy composite samples. For each stacking sequence, 4 identical specimens were
tested and average result is obtained.

Page | 34
Fig 4.10 Dog bone shaped specimen for tensile test
The tensile strength is calculated using the following formula :
Tensile strength = Maximum Load / Cross sectional area
where,
Cross sectional area = Thickness*Gauge section length
The following table shows us the values of the tensile strength of the nano clay and nanocarbon
reinforced epoxy composites :
Table 4.5 Tensile strength of nanoclay and nanocarbon reinforced epoxy composites
S.No. Type of Sample Tensile Strenght (MPa)
1. Neat Epoxy 46.7
2. 2% Nanoclay + Epoxy 49.01
3. 4% Nanoclay + Epoxy 45.81
4. 6% Nanoclay + Epoxy 41.63
5. 2% Nanocarbon + Epoxy 48.04
6. 4% Nanocarbon + Epoxy 45.57

Page | 35
The above table and the curves show that with increase in percentage of fillers form 0 to 2% the
tensile strength increases and it again decreases below that of the neat epoxy on further
increasing the percentage of both nanoclay and nanocarbon fillers. This happens due to the
formation of nanovoids into the reinforced epoxy and the agglomeration of the filler also takes
place into the reinforced epoxy which is another cause of the deterioration of the tensile strength
of the reinforced epoxy matrices.
41
42
43
44
45
46
47
48
49
50
0 1 2 3 4 5 6 7
Ten
sile
Str
engt
h (
MP
a)
% of nanoclay filler
Fig 4.11 Variation of tensile strength with nanoclay content
45
45.5
46
46.5
47
47.5
48
48.5
0 0.5 1 1.5 2 2.5 3 3.5 4 4.5
Ten
sile
tre
ngt
h (M
Pa)
% of nanocarbon
Fig 4.12 Variation of tensile strength with nanocarbon content

Page | 36
4.4 Vicker’s Hardness Test :
The Vickers hardness test method consists of indenting the test material with a diamond
indenter, in the form of a right pyramid with a square base and an angle of 136 degrees between
opposite faces subjected to a load of 1 to 100 kgf. The full load is normally applied for 10 to 15
seconds. The two diagonals of the indentation left in the surface of the material after removal of
the load are measured using a microscope and their average calculated. The area of the sloping
surface of the indentation is calculated. The Vickers hardness is the quotient obtained by dividing
the kgf load by the square mm area of indentation.
Fig. 4.13 Vicker’s Hardness principle

Page | 37
F=Load in kgf
d = Arithmetic mean of the two diagonals, d1 and d2 in mm
HV = Vickers hardness
When the mean diagonal of the indentation has been determined the Vickers hardness may be
calculated from the formula, but is more convenient to use conversion tables. The Vickers
hardness should be reported like 800 HV/10, which means a Vickers hardness of 800, was
obtained using a 10 kgf force. Several different loading settings give practically identical hardness
numbers on uniform material, which is much better than the arbitrary changing of scale with the
other hardness testing methods. The advantages of the Vickers hardness test are that extremely
accurate readings can be taken, and just one type of indenter is used for all types of metals and
surface treatments. Although thoroughly adaptable and very precise for testing the softest and
hardest of materials, under varying loads, the Vickers machine is a floor standing unit that is more
expensive than the Brinell or Rockwell machines.
The following table shows us the values of the vicker’s hardness of the nano clay and nanoclay
reinforced epoxy composites :
Table 4.6 Vicker’s Hardness of nanoclay and nanocarbon reinforced epoxy composites
S.No. Type of Sample Vicker’s Hardness (HV)
1. Neat Epoxy 20.2
2. 2% Nanoclay + Epoxy 22.5
3. 4% Nanoclay + Epoxy 23.2
4. 6% Nanoclay + Epoxy 24
5. 2% Nanocarbon + Epoxy 22
6. 4% Nanocarbon + Epoxy 22.6

Page | 38
The above table and the curves indicate that with the increase in the percentage of the fillers
(both nanoclay and nanocarbon) the vicker’s hardness value of the reinforced epoxy composite
matrices keeps on increasing, the presence of nanoclay/nanocarbon clusters and the size of the
agglomerates formed can be responsible for this kind of behavior.
20
20.5
21
21.5
22
22.5
23
23.5
24
24.5
0 1 2 3 4 5 6 7
Vic
ker'
s H
ard
nes
s (H
V)
% of nanoclay
Fig 4.14 Variation of vicker's hardness with nanoclay content
20
20.5
21
21.5
22
22.5
23
0 0.5 1 1.5 2 2.5 3 3.5 4 4.5
Vic
ker'
s H
Ard
nes
s
% of nanocarbon
Fig 4.15 Variation of Vicker's Hardness with nanocarbon content

Page | 39
CHAPTER-5 Conclusion

Page | 40
5. CONCLUSION:
Based on the tests carried out on the nano filler reinforced composites the following conclusions
can be listed:
1) By incorporation of nanoclay and nanocarbon as fillers the mechanical properties such as
flexural strength and tensile strength to some extent give encouraging results when
compared with the neat epoxy but after a certain amount of addition of additives these
properties get depleted/deteriorated.
2) The void content in reinforced epoxy matrices increases on increasing the percentage of
filler content.
3) The hardness of the reinforced epoxy composites matrices also increases on increasing
the percentage of filler contents.

Page | 41
REFERENCES:
1) http://en.wikipedia.org/wiki/Tribology
2) Jartiz, A.E., Design 1965, p.18.
3) Kelly, A. Sci. American 217, (B), (1967): p. 161.
4) Berghezan,A.Nucleus,8(5),1966,(Nucleus A Editeur,1,rhe,Chalgrin,Paris, 16(e).
5) Suchetclan Van, Philips Res. Repts.Volume 27, (1972): p. 28
6) Tewari US, Harsha AP, Ha¨ ger AM, et al. Solid particle erosion of unidirectional carbon
fibre reinforced polyetheretherketone composites. Wear 2002; 252: 992–1000 Pool KV,
Dharan CKH and Finnie I. Erosive wear of composite materials. Wear 1986; 107: 1–12.
7) Kulkarni SM and Kishore. Influence of matrix modification on the solid particle erosion
of glass/epoxy composites.
8) Polym Polym Compos 2001; 9: 25–30.
9) Aglan HA and Chenock Jr. Erosion damage features of
polyimide thermoset composites. SAMPEQ 1993; 24: 41–47.
10) Liu W, Qiu Q, Wang J, et al. Preparation and properties of one epoxy system bearing
fluorene moieties. J Appl Polym Sci 2009; 113: 1289–1297.
11) Hattotuwa G, Premalal B, Ismail H, et al. Comparison of
the mechanical properties of rice huskpowder filled polypropylene
composites with talc filled polypropylene composites. Polym Test 2002; 21: 833–839.
12) Ismail H, Nizam JM and Abdul khalil HPS. The effect of a compatibilizer on the
mechanical properties and mass swell of white rice husk ash filled natural rubber/linear
low density polyethylene blends. Polym test 2001; 20: 125–133.
13) Luo S and Netravali AN. Mechanical and thermal properties of environmentally friendly
green composites made from pineapple leaf fibers and poly (hydroxybutyrate-
covalerate) resin. Polym Compos 1999; 20: 367–378.

Page | 42
14) Belmares H, Barrera A and Monjaras M. New Composite materials from natural hard
fibers. Part 2.Fatigue studies and a novel fatigue degradation model. Ind Eng Chem Prod
RD 1983; 22: 643–652.
15) (Definition of epoxy resin, noun, from the Cambridge Advanced Learner's Dictionary &
Thesaurus, Cambridge University Press)
16) M. A. Marciano, R. Ordinola-Zapata, T. V. R. N. Cunha, M. A. H. Duarte, B. C. Cavenago,
R. B. Garcia, C. M. Bramante, N. Bernardineli, I. G. Moraes (April 2011). "Analysis of four
gutta-percha techniques used to fill mesial root canals of mandibular
molars". International Endodontic Journal 44 (4): 321–329.
17) Gujjala Raghavendra, Shakuntala Ojha , SK Acharya and SK Pal. Jute fiber reinforced
epoxy composites and comparison with the glass and neat epoxy composites.
18) S. Zainuddin , M.V. Hosur , Y. Zhou , Alfred T. Narteh , Ashok Kumar , S. Jeelani.
Experimental and numerical investigations on flexural and thermal properties of
nanoclay–epoxy nanocomposites.
19) J.A.M. Ferreira , L.P. Borrego , J.D.M. Costa , C. Capela. Fatigue behaviour of nanoclay
reinforced epoxy resin composites
20) Jeena Jose Karippal, H.N. Narasimha Murthy, K.S. Rai, M. Sreejith, and M. Krishna. Study
of mechanical properties ofepoxy/glass/nanoclay hybrid composites.
21) JAM Ferreira, PNB Reis, JDM Costa, and MOW Richardson. Fatigue behaviour of
Kevlar composites withnanoclay-filled epoxy resin.
22) Andrea Dorigato, Stefano Morandi, and Alessandro Pegoretti. Effect
of nanoclay addition on the fiber/matrix adhesion in epoxy/glass composites. Journal
of Composite Materials, June 2012; vol. 46, 12: pp. 1439-1451.
23) Arun K. Subramaniyan and C.T. Sun. Interlaminar Fracture Behavior
of NanoclayReinforced Glass Fiber Composites. Journal of Composite Materials, October
2008; vol. 42, 20: pp. 2111-2122.
24) Shafi Ullah Khan a, Arshad Munir b, Rizwan Hussain b, Jang-Kyo Kim. Fatigue damage
behaviors of carbon fiber-reinforced epoxy composites containing nanoclay.
Page | 43
25) A. Haque, M. Shamsuzzoha, F. Hussain, and D. Dean. S2-Glass/Epoxy Polymer
Nanocomposites: Manufacturing, Structures, Thermal and Mechanical Properties.
Journal of Composite Materials, October 2003; vol. 37, 20: pp. 1821-1837.
26) Jia-Lin Tsai and Ming-Daw Wu. Organoclay Effect on Mechanical Responses of
Glass/Epoxy Nanocomposites. Journal of Composite Materials, March
2008; vol. 42, 6: pp. 553-568.
′