effect of oil production and drilling operations on
TRANSCRIPT

EFFECT OF OIL PRODUCTION AND DRILLING OPERATIONS ON THE ECOLOGY OF
PHYTOPLANKTON IN THE OEI STUDY AREA
by Kenneth W. Fucik and Sayed Z. El-Sayed
ABSTRACT
Between June 1972 and January 1974, twelve cruises were made to study photosynthetic rates and the standing crop of phytoplankton off the Louisiana coast. Data from a production platform were compared with data from a control station 6 miles northeast of the platform, with regard to photosynthetic activity of phytoplankton, chlorophyll a as a measure of the standing crop, species composition, and nutrient salts.
Seasonal variations in all categories were observed at the platform and control station. Chlorophyll a values were lowest in November 1972 and January 1973. Highest standing crop values were recorded in April 1973, during the bloom of Skeletonema costatum.
The OEI study area is considered one of the most productive areas of phytoplankton in the Gulf. Our investigation showed no deleterious effects from the oil production platform.
INTRODUCTION
The Gulf of Mexico is one of our most valuable national resources. It provides energy, transportation, and recreation; but its productive continental shelves, noted for their economically valuable shrimp, oyster, and menhaden fisheries, are also the sites of thousands of offshore oil
Sayed El-Sayed is with the Department of Oceanography, Texas A&M University. At the time of this study, Kenneth Fucik was also with Texas A&M University.

326 RICE UNIVERSITY STUDIES
fields, and the routes of heavy ship traffic. In recent years, we have witnessed an increasing public awareness of
the deterioration of the marine environment caused by dumping toxic pollutants in domestic and industrial wastes, and of the widespread threat of pollution caused by production and transport of oil and petroleum products. The S.S. Torrey Canyon oil spill disaster heightened public apprehension and sensitivity to the threat of oil in the marine environment; it also sharpened the conflict over the multiple uses of the Gulf's resources by oil and gas producers and the protectors of the environment.
Field observations of the effects of the actual oil spills on phytoplankton are limited and often contradictory. Soto et al. (1975) observed some kill among the phytoplankton following the Torrey Canyon disaster. Smith (1968), following the Torrey Calzyon spill, ob- served that most of the stations that were studied showed healthy populations; at one station, however, there was a film of oil on the water and harmful effects were apparently suffered by members of the unicellular Prasinophyceae. The Santa Barbara blowout, according to Straughan (1973), also produced detectable harmful effects in phytoplankton productivity.
Besides the oil spill investigations (see Wheeler [I9781 for review of recent literature), a few field and laboratory studies suggested that petroleum and its derived products could affect photosynthesis and growth of phytoplankton. For instance, the photosynthetic rate of marine phytoplankton could be stimulated or depressed by the level of hydrocarbon present and by means and duration of exposure. Galstoff et aI. (1935), Mirnov and Lanskaya (1969), and Strand et al. (1971) reported that the growth of marine phytoplankton was retarded by the presence of oil in seawater. Gordon and Prouse (1973) studied the effect of low concentrations of three oils (Venezuelan crude oil, No. 2 fuel oil, and No. 6 fuel oil) on the photosynthetic activity of natural phytoplankton communities from Bedford Basin (Nova Scotia) and the open oceat? between Halifax and Bermuda. Their results showed that while the hydrocarbon levels in the Bedford Basin area were sufficiently high to depress photosynthetic activity of the phytoplankton by a few percent, the levels of hydrocarbon present in the open ocean were not of sufficient magnitude t o depress such activity. Pulich, Winters, and van Baalen (1974) also reported that soluble fractions of No. 2 fuel oil in concentrations of 0.04 to 0.40 pm/l reduced photosynthesis of the diatom Thalassiosira pseudonana and affected the photosynthetic activities of certain green and blue-green algae.
There seems to be a dearth of information, however, on the effects of oil drilling and production operations in marine ecosystems in which

ECOLOGY OF PHYTOPLANKTON 327
disastrous spills or blowouts have not occurred. We know very little about the chronic effects of low-level discharges of oil and gas into the marine environment, or about the ability of marine ecosystems to cope with slowly increasing background levels of oil.
The OEI was conducted between June 1972 and January 1974 in Timbalier Bay and the offshore region. Its main objective was to assess the cumulative ecological effects of 40 years of oil and gas drilling and production operations in that 400-square-mile area. Of major concern were the possible effects of prolonged low-level discharges of hydrocarbons and heavy metals (attributable to those operations) on the ecological health of the marine environment,
This paper addresses the effects of the prolonged low-level discharges of hydrocarbons and heavy metals on the phytoplankton populations off the Louisiana coast. The experimental strategy focused on a comparison between point source effects (in this case the Exxon Production Platform 54A, also known as HOR-54A) and an "unim- pacted" (control) area experiencing the same natural variabilities as those of the "impacted" regions. While this study emphasized the in- tercomparability of the phytoplankton populations of the production platform region and the "control" (ambient) site, the occurrence of the 100-year maximum flood of the Mississippi River during this study produced some unexpected results, which will also be discussed.
MATERIALS AND METHODS
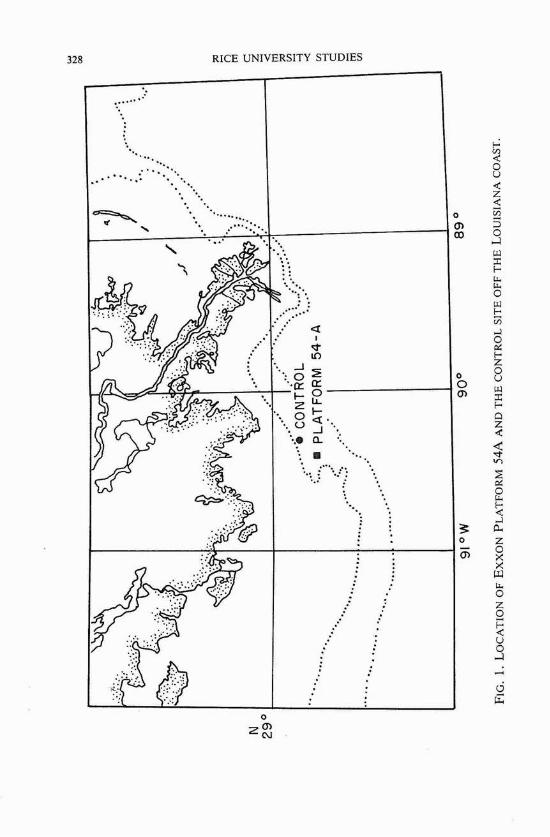
The locale chosen for the OEI contained a very high density of coastal and offshore production and marine pipeline operations, which had been functioning for 40 years. The production platform (hereafter referred to as the platform) was located in 20 m of water approximately 50 miles from the Southwest Pass of the Mississippi River. The control area (hereafter referred t o as the control) was located six miles northeast of the platform (figure 1). Its selection as a control site was made on the basis of (1) minimal or no petroleum activity, and (2) its location up- stream from the platform.
Twelve cruises aboard the R/Vs Alarninos, Longhorn, Southwest Rese~rcher, and Tursiops were made between June 1972 and January 1974. The amount of chlorophyll a, which was used as an estimate of the phytoplankton standing crop, was determined spectrophotometrically (Strickland and Parsons 1970). The fluorometric method of Yentsch and Menzel (1963) with the modification of Holm-Hansen et al. (1965) was used for estimation of both chlorophyll a and phaeopigments (degra- dation products of chIorophyl1).
328 RICE UNIVERSITY STUDIES
ECOLOGYOF PHYTOPLANKTON 329
The photosynthetic activity of phytoplankton was determined by in situ experiments using the C i 4 uptake method of Steemann Nielsen (1952) as modified by Strickland and Parsons (1970). Measurements of sub- marine light penetration were made using a Secchi disc before Local Apparent Noon (LAN). The water samples were collected at loo%, 50070, 25%, 12%, and 1% of surface light intensity. These water samples were inoculated with C14-labeled bicarbonate, lowered to the depths from which they were taken, and incubated between LAN and sunset. In cases where the euphotic depth (depth receiving 1% of surface light intensity) was very shallow, sampling depths were determined by the position of the halocline or thermocline. Occasionally, samples were taken below the euphotic zone to estimate chlorophyll presence and primary production.
During the R/V Alaminos cruises, inorganic nutrients (phosphates, silicates, and nitrates) were detected according to the methods outlined in Strickland and Parsons (1970) by using the Technicon Auto-Analyzer. When other research vessels were used, the water samples were frozen and shipped to the Texas A&M University campus for later analysis. The physical data, other than those taken on board the R/V Alaminos cruises, were furnished by The University of Texas Marine Science In- stitute and the Southwest Research Institute.
RESULTS
Phytoplankton standing crop The pertinent physical, chemical, and biological data collected be-
tween June 1972 and January 1974 are given in El-Sayed's (1974) report to GURC.
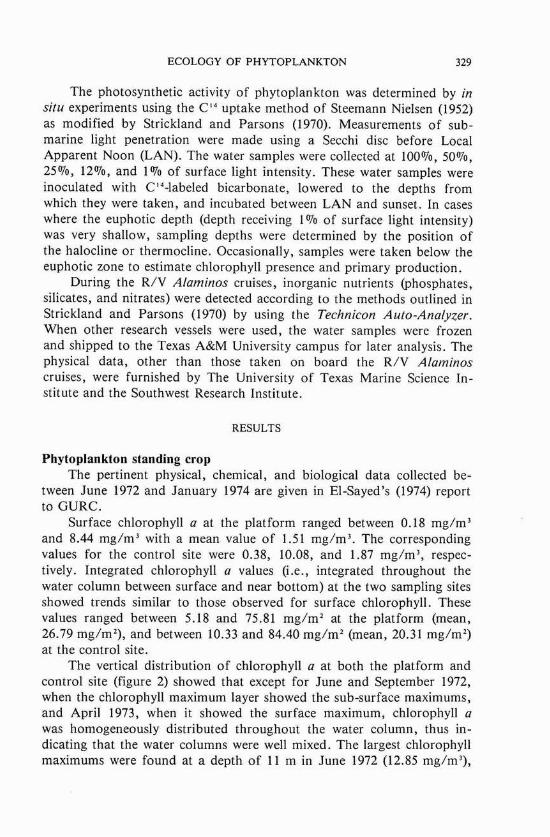
Surface chlorophyll a at the platform ranged between 0.18 mg/m3 and 8.44 mg/m3 with a mean value of 1.51 mg/m3. The corresponding values for the control site were 0.38, 10.08, and 1.87 mg/m3, respec- tively. Integrated chlorophyll a values (i.e., integrated throughout the water column between surface and near bottom) at the two sampling sites showed trends similar t o those observed for surface chlorophyll. These values ranged between 5.18 and 75.81 mg/m2 at the platform (mean, 26.79 mg/m2), and between 10.33 and 84.40 mg/mz (mean, 20.31 mg/mz) at the control site,
The vertical distribution of chlorophyll a at both the platform and control site (figure 2) showed that except for June and September 1972, when the chlorophyll maximum layer showed the sub-surface maximums, and April 1973, when it showed the surface maximum, chlorophyll a was homogeneously distributed throughout the water column, thus in- dicating that the water columns were well mixed. The largest chlorophyll maximums were found at a depth of 11 m in June 1972 (12.85 mg/m3),
RICE UNIVERSITY STUDIES

ECOLOGYOFPHYTOPLANKTON 33 1
at 19 m in September 1972 (9.36 mg/m3), and at the surface in April 1973.
The vertical distribution of chlorophyll at the control site displayed a pattern very similar to that found at the production platform. In June 1972 and July 1973, however, the vertical distributions of chlorophyll at the control site were markedly different from those at the platform. While the June I972 vertical distribution showed a relatively homogeneous distribution of chlorophyll a at the control site, the distribution at the platform was characterized by a conspicuous maximum at 11 m. In July 1973 the chlorophyll maximum layer was located near the bottom of the control site, while at the platform, chlorophyll was homogeneously distributed throughout the water column, and no maximum concentration was discernible.
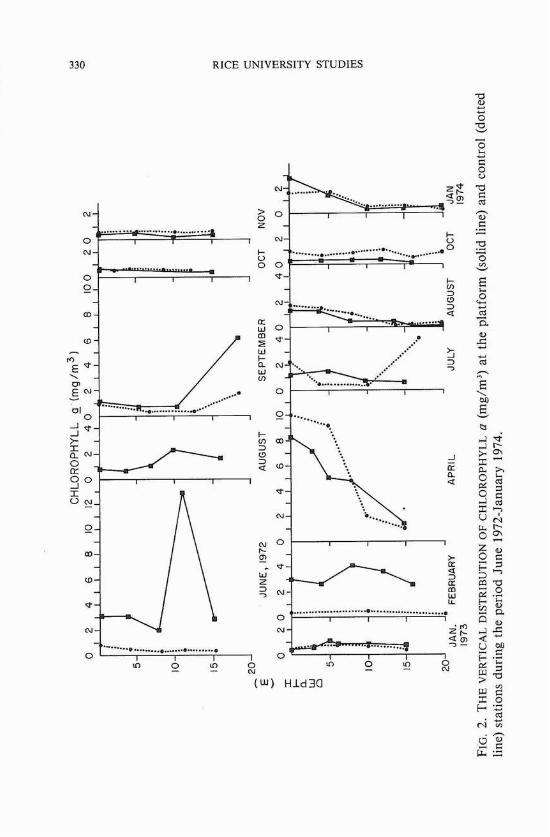
Phaeopigment distribution The distribution of phaeopigments at both the platform and the
control site (figure 3) presented a picture not very different from that of chlorophyll. The only noticeable variations occurred in April and July 1973. The high standing crops of phytoplankton that were recorded at the platform and control sites in April 1973 corresponded to very low phaeopigments at both localities. On the other hand, the rather low values of chlorophyll in July 1973 corresponded to high phaeopigment values recorded for that month.
The average surface phaeopigment value at the platform (1.06 mg/m3) was nearly the same as that at the control site (1.02 mg/m3). In integrated values, the average value at the platform (18.25 mg/m2) was slightly higher than at the control (16.96 mg/m2). Subsurface phaeopigment levels were generally low, except for the September I972 and July 1973 values. With a few exceptions, however, subsurface values were generally higher than surface ones.
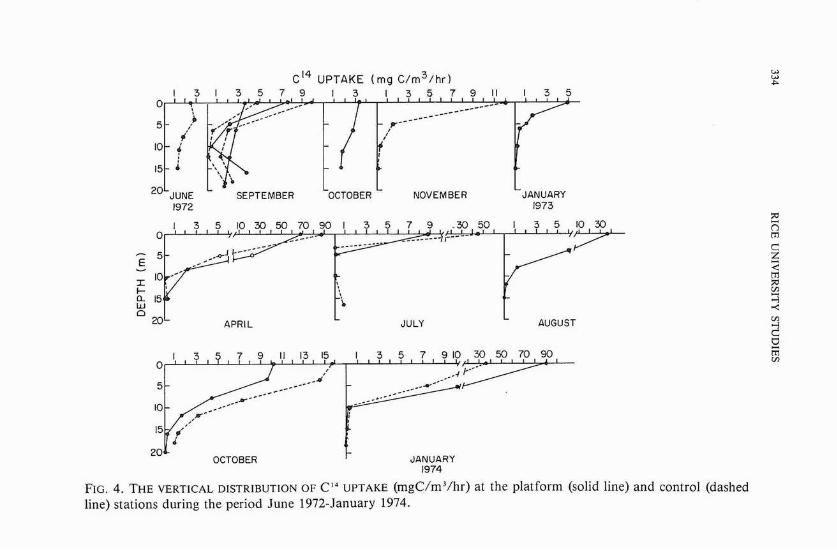
Primary production Surface primary production was generally low during June and
October 1972 and January 1973. During these months, productivity was less than 5 mgC/m3/hr, A much higher value (12.04 mgC/m3/hr) was obtained during November 1972. Between April 1973 and January 1974, surface primary production was conspicuously higher than during the preceding period. The average primary production was 26.04 mgC/m3/hr for surface water samples collected at the platform, and 27.03 mgC/m3/hr for those collected at the control site.
Average primary productivity values of the water column were slightly higher at the platform (101.04 mgC/m2/hr) than at the control site (96.08 mgC/m2/hr). These integrated primary production values
RICE UNIVERSITY STUDIES

ECOLOGY OFPHYTOPLANKTON 333
showed trends similar to those exhibited by the surface water samples. Between June 1972 and January 1973, integrated values were much lower than the values obtained between April 1973 and January 1974. Primary production reached maximum levels during April 1973 at both the plat- form (283.89 mgC/m2/hr) and the control site (247.57 mgC/m2/hr). On the whole, the average values of primary production at the platform and the control site did not vary appreciably.
With very few exceptions (June 1972), primary production was maximized at the surface and decreased rapidly with depth (figure 4). Very low photosynthetic activities were recorded near the bottom of the platform and control site. However, a noticeable increase in the photosynthetic activity was found just above the bottom of the platform in September 1972.
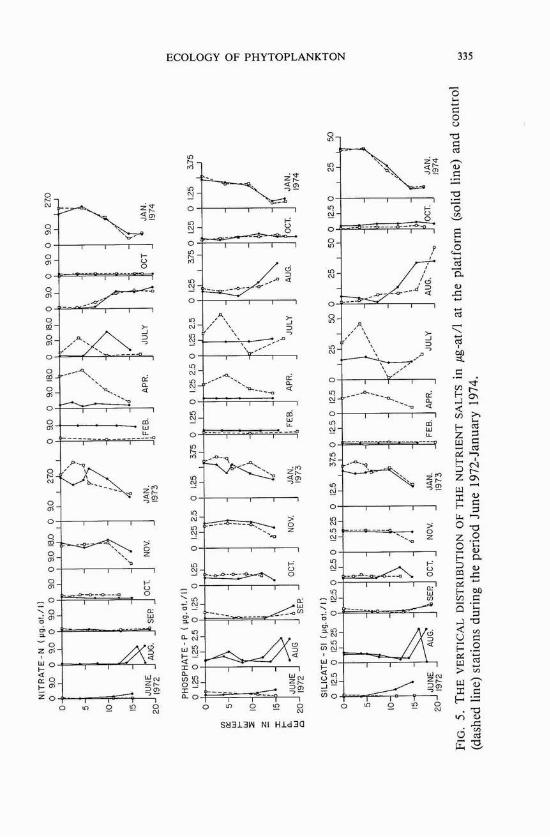
Distribution of inorganic nutrients The vertical distributions of silicates, phosphates, and nitrates
showed, in general, similar trends at the production platform and the control site throughout the study period (figure 5). Major differences in the distribution of the inorganic nutrients were found in April and July 1973.
Seasonal variations of chlorophyll a, phaeopigments, and primary production at the production platform and the control site
Figure 6 shows the month-to-month variations in surface chlorophyll a at both the platform and the control site. After reaching a high surface chlorophyll value of 3.0 mg/m3 in June 1972, the phytoplankton stand- ing crop at the platform between August 1972 and January 1973 remained below 1.0 mg/m3. The standing crop values seemed to reach their lowest ebb during November 1972 and January 1973. This was followed by a marked increase during February 1973, which culminated in the bloom of Skeletonema costatum in April 1973, resulting in the highest chlorophyll value recorded at the platform. In July and August 1973, the chlorophyll a values decreased to about one-fifth the preceding April values. A further decrease in October was followed by a higher value during January 1974. The monthly distributions of chlorophyll a at the control site, with some minor variations (for instance, June 1972 and February 1973), were similar to those at the platform.
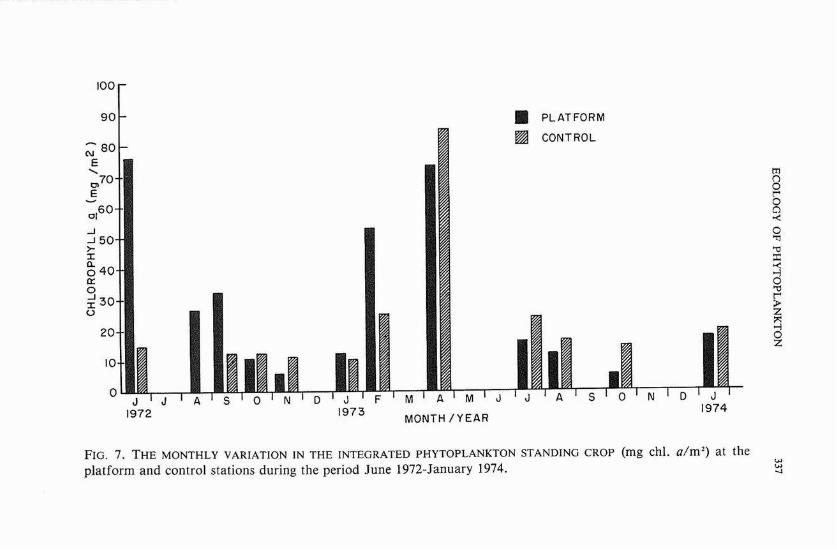
The integrated chlorophyll a values at the platform (figure 7) showed that following the high value recorded during June 1972 there was a steady decline in the period between September 1972 and January 1973. A marked increase in the standing crop was noted in February 1973, with the phytoplankton density reaching a high value in April 1973, com- parable to that of June 1972. A steady decline in the standing crop was
UPTAKE (mg c/m3/hr ) 1 3 1 3 5 7 9
SEPTEMBER 1972
L NOVEMBER JANUARY
1973
OCTOBER I- JANUARY 1974
FIG. 4. THE VERTICAL DISTRIBUT~ON OF C L 4 UPTAKE (rngC/m3/hr) at the platform (solid line) and control (dashed line) stations during the period June 1972-January 1974.
ECOLOGY OF PHYTOPLANKTON

RICE UNIVERSITY STUDIES
PLATFORM
FIG. 7. THE MONTHLY VARIATION IN THE INTEGRATED PHYTOPLANKTON STANDING CROP (mg chl. d m 2 ) at the w
platform and control stations during the period June 1972-January 1974. W 4

338 RICE UNIVERSITY STUDIES
noted the following July and August, with integrated chlorophyll reaching its lowest value during October. A slight increase in the standing crop was recorded from October 1973 to January 1974. In general, the monthly distributions of chlorophyll u at the control site closely followed those at the platform; notable exceptions were the values for June and September 1972 and February and October 1973.
Monthly variations of surface primary production at both the plat- form and the control site are plotted in figure 8. The photosynthetic rate at both sites was very low between June 1972 and January 1973. Very high C ' h p t a k e values were recorded at both places in April 1973, during the bloom of Skeletonemu costatum. Following the high April values was a marked decline in the photosynthetic activity of the phytoplankton at the platform in July, which was in marked contrast to the high primary production at the control site during the same month. The C'' uptake showed an increase in August at the platform (no productivity measurements were made at the control site during that month), and then a decrease in October. The highest primary productivity value during this study was encountered at the platform during January 1974 (90 mgC/m3/hr).
Figure 9 shows the marked contrast between the generally low water column productivity values obtained between June 1972 and January 1973, and the high values recorded between April 1973 and January 1974. Note the remarkable similarity (except for July 1973) in the distribution of the monthly CI4 uptake values between the platform and the control site.
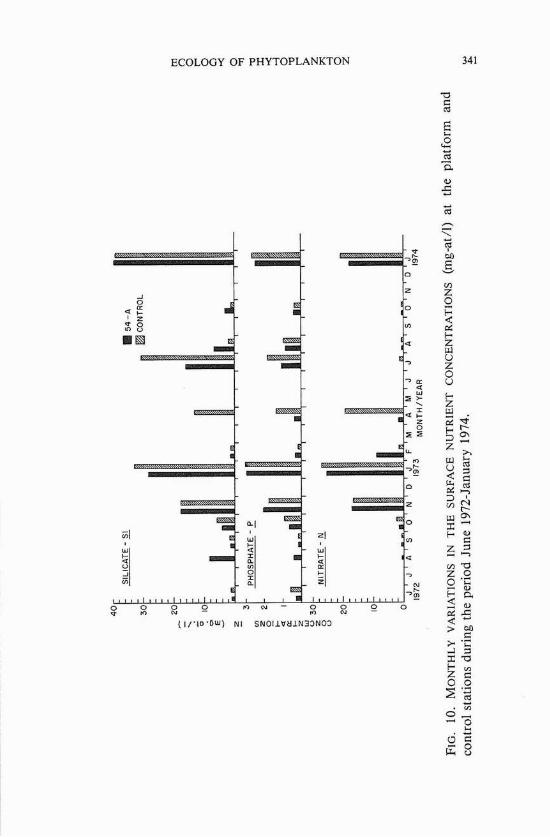
Work on seasonal distribution of the nutrients showed that high levels generally occurred in winter and low levels occurred during the rest of the year (figures 10 and 11). The unusually heavy rains in the spring of 1973 resulted in an increase in the discharge of the Mississippi River in the spring and summer of that year, and phosphate and silicate con- centrations were much higher in the summer of 1973 than in the previous year. Data collected on nitrates during the winter and fall cruises were not sufficient to allow generalizations to be made on their seasonal variability. Integrated nutrient values showed monthly distributions similar to those at the surface. Nutrient concentrations were consistently higher at the control site than at the platform.
The distribution of inorganic nutrients observed during the summer and fall lends support to the conclusion by Thomas and Simmons (1960) that the availability of nitrogen probably limits phytopIankton growth during these seasons. The present study also corroborates the findings of Riley (1937), and Thomas and Simmons (1960), who reported high concentrations of phosphates in the plume waters of the Mississippi River.
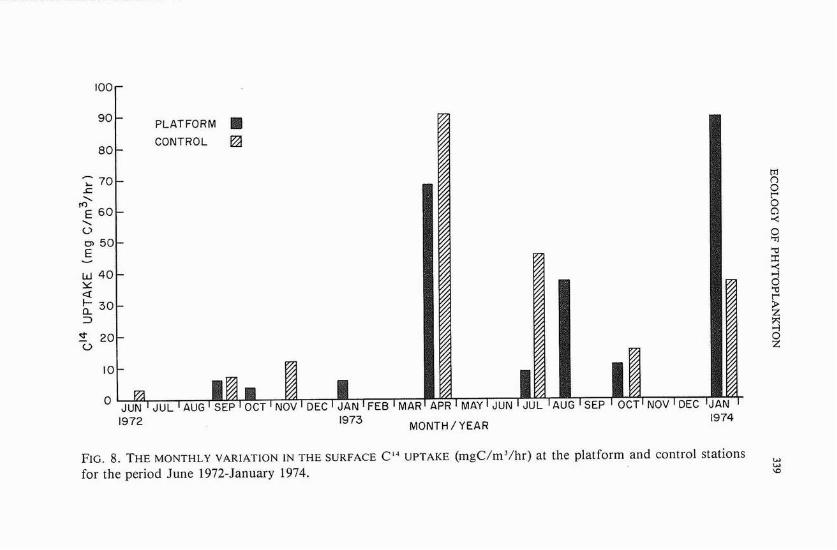
FIG. 8. THE MONTHLY VARIATION IN THE SURFACE C'WPTAKE (mgC/m3/hr) at the platform and control stations bJ for the period June 1972-January 1974. w

300 2 5 0 F PLATFORM .
1972 1973 1974 MONTH / YEAR
FIG. 9. THE SEASONAL VARIATIONS IN THE MONTHLY INTEGRATED C14 UPTAKE (mgC/mZ/hr) at the platform and control stations for the period June 1972-January 1974.
ECOLOGYOFPHYTOPLANKTON

RICE UNIVERSITY STUDIES

ECOLOGY OF PHYTOPLANKTON 343
Species composition and relative abundance of phytoplankton Throughout most of the study period, diatoms constituted over 90%
of the phytoplankton populations in the OEI study area (table I) . The number of species of diatoms was always greater than that of the dinoflagellates. The dinoflagellates reached their greatest abundance during September 1972, when they contributed about 28% of the total population at the control site.
Diatom abundance was very pronounced at the platform in Sep- tember 1972 and April 1973. During these months a single species, Skeletonema costatum, contributed between 75% and 97% of the total cell counts (in excess of 9 x lo6 celIs/liter in September 1972). The dominance of this species in the study area was apparent throughout much of the year, as it made up 40% of the total phytoplankton biomass in January 1973 and 74% in October 1973.
Other diatom species that made significant contributions to the standing crop at certain times of the year were the Cyclotella-Melosira complex (greater than 90% in July 1973); Rhizosolenia fragillissima (greater than 86% in August 1973); and t o different degrees at various times, Nifzschia pungens and N. subfraudulenta. The most dominant dinoflagellate was Exuviella compressa, which was present during much of the year. Gonyaulax monilata and G. turbynei also showed periods of dinoflagellate dominance.
Phytoplankton numbers were lowest in October and November 1972; these values correlated well with the low chlorophyll a values recorded during the same time period. In general, the phytoplankton cell counts paralleled the estimates of chlorophyll a.
The composition of the phytoplankton populations at the platform and control sites was similar. The diatom populations encountered in this study were also similar to those reported by Simmons and Thomas (1962) in the eastern delta region. The diatom species encountered were nearly identical in both sampling programs, so the scheme presented in Sim- mons and Thomas' study for identifying and delineating water masses in the eastern delta region should also be valid for the region west of the river mouth. This scheme utilized the Melosira-Cyclofella complex to identify the river and plume river waters, and the Nitzschia, Thalassiothrix, Thalassionema , Skeletonema , Chaetoceros, and As- terionella associations to indicate the more saline Gulf waters. Our stud- ies and those of Simmons and Thomas clearly indicate that, in general, the dinoflagellates do not significantly contribute to the phytoplankton standing crop or primary production in the study area.

344 RICE UNIVERSITY STUDIES
TABLE 1. Species Composition and Percent Contribution of the Ten Most Abundant Species in the Phytoplankton Samples Collected at the Production Platform and the Control Site.
Percent Month Sampling Site Species Contribution
June 24, 1972* Platform
June 24, 1972* Control
August 2, 1972* Platform
Sept. 20, 1972 Platform
Nitzschia pungens Chaetoceros curvisetus Guinardia flaccida Rhizosolenia delicatula C. a f f in i s Thalassionema nitzschioides C. laciniosus C. decipiens R. setigera Bacteriastrum delicatulum
Nitzschia pungens Rhizosolenia delicatula Chaetoceros a f f in i s C. lorenzianus C. atlanticus Thalassionema nitzschioides C. messanensis C. pseudocurvisetus C. didymus Bacteriastmm delicatulum
Guinardia flaccida Nitzschia sp. Rhizosolenia stolterfothii R. styliformis Thalassiosira oestmpii
Skeletomena costatum Nitzschia pungens Thalassionema nitzschioides Rhizosolenia setigera R. fragilissima Thalasslothris mediterranea N. closterium R. delicatula Thalassiosira oestrupii Guinardia flaccida
Sept. 20, 1972 Control (surface) Rhlzosolenia dellcatula 59% Gonyaulax monilata 15 G. turbynei 4 Chaetoceros pelagicus 4 Skeletonema costatum 2 G, polygramma < 1 Exuviaella compressa < 1 Ceratium fusus < 1 Thalassiosira oestmpii .C 1 Thalasstonerna nitzschioides 1 -
*Samples were taken by a 35 p net haul (vertical); no quantitative studies were made during these months.

ECOLOGY OF PHYTOPLANKTON
TABLE 1 continued
Oct. 20 , 1972 P l a t fo rm ( s u r f a c e ) Nitzschia closteriurn Rhizosolenia shrubsolei Thalassionerna nitzschioides Peridiniurn trochoideurn N. pungens N . sp . Guinardia flaccida Denticula elegans
Oct. 20, 1972 Con t ro l ( s u r f a c e ) Rhizosolenia shwbsolei Denticula elegans Skeletonerna costaturn Thalassionerna nitzschioides Melosira sp . Nitzschia closteriurn N. vitrea N . subfraudulenta R. setigera Gonyaulax turbynei Prorocentrurn gracile
Nov. 24, 1972 P l a t fo rm ( s u r f a c e ) Synedra acus Nitzschia subfraudulenta Skeletonerna costaturn Thalassiosira eccentrica Melosira sp . Navicula hyalina Nitzschia sp. N. closteriurn Coscinodiscus centralis Plewosigrna naviculaceurn Dictyocha fibula
Nov. 24, 1972 Con t ro l ( s u r f a c e ) Thalassionerna nitzschioides Thalassiosira eccentrica Melosira sp . Asterionella japonica Exuviaella cornpressa Coscinodiscus centralis
Jan . 10 , 1973 P l a t fo rm ( s u r f a c e ) Skeletonerna costaturn Leptocylindrus danicus Rhizosolenia delicatula Asterionella glacialis Thalassiosira decipiens Eucarnpia cornuta Nitzschia subfraudulenta Chaetoceros affinis Thalassiosira aestivalis Cerataulina pelagica Herniaulus chinensis

RICE UNIVERSITY STUDIES
TABLE 1 continued
Jan. 11, 1973 Control (surface) Skeletonerna costaturn Rhizosolenia delicatula Melosira sp. Thalassiosira aestivalis Corethron criophilurn Leptocylindrus danicus T. rotula T. eccentrica Herniaulus chinensis Nitzschia closteriurn
Aprll 9, 1973 Platform (surface)
April 11, 1973 Control (surface)
July 9, 1973 Platform (surface)
~ u l y 11, 1973 Control (surface)
Skeletonerna costaturn Nitzschia pungens N . subfraudulenta Chae toceros curvisetus C. decipiens Exuviaella cornpressa Leptocylindrus danicus Thalassionerna nitzschioides Thalassiothrix rnediterranea C. af f inis
Skeletonerna costaturn Nitzschia subfraudulenta N. pungens Chaetoceros Leptocylindrus danicus Asterionella japonica C. atlanticus Exuviaella cornpressa Thalassionerna nitzschioides Thalassiosira rotula
Cyclotella striata Thallassionerna nitzschioides Cerataulina pelagica Melosira sp. Coscinodiscus radiatus Nitzschia subfraudulenta N . pungens Thalassiosira eccentrica Rhizosolenia alata R. calcar-avis
Cyclotella striata Melosira sp. Coscinodiscus radiatus Pleurosigrna naviculaceurn Rhizosolenia shrubsolei Nitzschia pungens R. calcar-avis R. alata N. subfraudulenta Thalassiosira eccentrica

ECOLOGY OFPHYTOPLANKTON
TABLE 1 continued
Oct. 1, 1973 Con t ro l ( s u r f a c e ) Skeletonema costatum Chaetoceros comwressus Rhizosolenia delibatula C. affinis Thalassiothrix mediterranea Nitzschia subfraudulenta R. stolterfothii Biddulphia mobiliensis R. setigera
Jan. 16 , 1974 Pla t form ( s u r f a c e ) Skeletonema costalum Leptocylindrus danicus Cyclotella striata Rhizosolenia delicatula Chaetoceros af f inis Asterionella glacialis Cerataulina pelagica Thalassiosira sp. Nitzschia closterium
Jan. 15 , 1974 Con t ro l ( s u r f a c e ) Leptocylindrus danicus Cyclotella striata Skeletonema costatum Cerataulina pelagica Gonyaulax sp. Thalassiosira eccentrics Asterionella glacialis Exuviaella compressa Nitzschia closterium
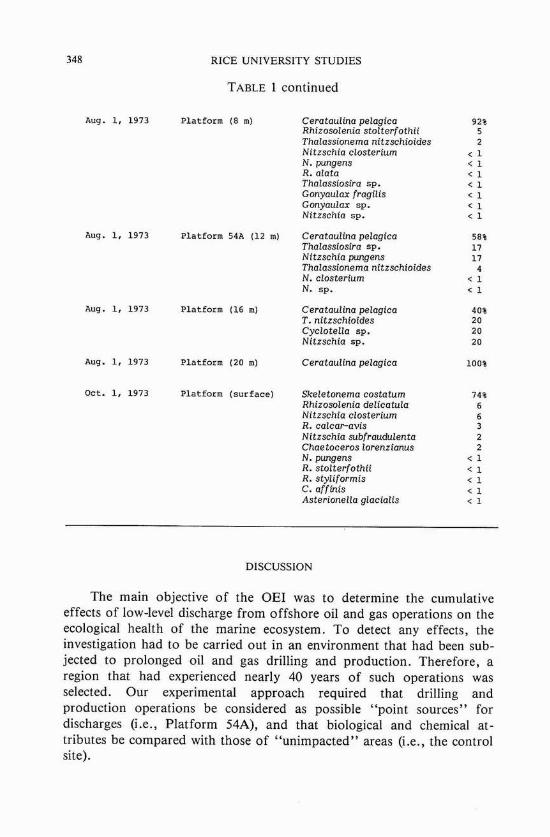
Aug. 1, 1973 Pla t form ( s u r f a c e ) Ceratulina pelagica Thalassionema nitzschioides Nitzschia closterium Thalassiosira sp . Rhizosolenia stolterfothii Nitzschia pungens Cyclotella sp. Nitzschia SP- Peridinium pelIucidum Gonyaulux diegensis
Aug. 1, 1973 Pla t form (4 m) Cerataulina pelagica Rhizosolenia stolterfothii Thalassionema nitzschoides Nitzschia closterium Thalassiosira sp. Nitzschia pungens Rhizosolenia alata Cyclotella SP. N. sP. R. calcar-avis
348 RICE UNIVERSITY STUDIES
TABLE 1 continued
Aug. 1, 1973 P l a t fo rm ( 8 m) Cerataulina pelagica Rhizosolenia stolterfothii Thalassionema nitzschioides Nitzschia closteritlm N. pungens R. alata Thalassiosira sp. Gonyaulax fragilis Gonyaulax sp. Nitzschia sp.
Aug. 1, 1973 P l a t fo rm 54A (12 m) Cerataulina pelagica Thalassiosira sp. Nitzschia pungens Thalassionema nitzschioides N. closterium N. sp.
~ u g , 1, 1973 P l a t fo rm (16 m) Cerataulina pelagica T . nitzschioides Cyclotella sp. Nitzschia sp.
Aug. 1, 1973 P l a t fo rm (20 m) Cerataulina pelagica
Oct. 1, 1973 P l a t fo rm ( s u r f a c e ) Skeletonema costatum Rhizosolenia delicatula Nitzschia closterium R. calcar-avis Nitzschia subfraudulenta Chaetoceros lorenzianus N. pungens R. stolterfothii R. styliformis C. af f inis Asterionella glacialis
DISCUSSION
The main objective of the OEI was t o determine the cumulative effects of low-level discharge from offshore oil and gas operations on the ecological health of the marine ecosystem. T o detect any effects, the investigation had to be carried out in an environment that had been sub- jected to prolonged oil and gas drilling and production. Therefore, a region that had experienced nearly 40 years of such operations was selected. Our experimental approach required that drilling and production operations be considered as possible "point sources" for discharges (i.e., Platform 54A), and that biological and chemical at- tributes be compared with those of "unimpacted" areas (i.e., the control site).

ECOLOGY OF PHYTOPLANKTON 3 49
TmLE 2. Chlorophyll a (chl. a) , Phaeopigments (Phaeo.) , c14 uptake, and the Photosynthetic Index (P.I.) at the Platform and Control Sites during the Period June 1972 to January 1974.
Min. Max. Mean Std.Dev. % Obs.
Surface chl. a 3 Platform 0.18 8.44 1.51 2.03 16
(mg/m ) Control 0.38 10.08 1.87 2.73 11
Int. ch3. a Platform 5.18 75.81 26.79 22.85 17 (mg/m ) Control 8.50 84.40 20.31 21.64 12
Surface Phaeo. Platform 0.19 2.82 1.06 0.79 15 (m9/m3) Control 0.69 2.11 1.02 9.47 11
Tnt. Ph eo. 9 Platform 8.25 47.17 18.25 11.67 15 (m9/m ) Control 8-18 42.56 16.96 10.35 11
Surf ace Platform 3.42 67.92 26.04 22.98 9 Control 2.50 87.98 27.03 31.05 8
14 Int. C Platform 15.29 283.89 101.04 87.44 9 (mgC/m /hr) Control 26.45 247.57 96.08 78.44 8
P.I. Platform 3.74 27.18 11.76 9.49 8 (mgC/mg chl/hr) Control 3.05 20.33 10.95 6.17 7
Table 2 summarizes the surface and integrated (i.e., throughout the water columns) data on the standing crop of phytoplankton, primary production, phaeopigments, and photosynthetic index (P.I.) at the production platform and the control site. There was close similarity be- tween the levels of the parameters at both sites. Of special significance is the close correspondence between the photosynthetic index (calculated as the ratio of primary production to chlorophyll a) at the platform and the control site (11.76 and 10.95 mgC/mg/chl. a/hr, respectively). To the extent that the P.I. values reflect the state of ecological health of the phytoplankton populations (Strickland 1960), the closeness of these values suggests that the production platform has had no detectable harmful effects on the phytoplankton production in the OEI area. The uniformity observed between the vertical profiles of chlorophyll a , phaeopigments, primary production, and nutrients at both the platform and contro1 sites tends to corroborate this finding. Moreover, the lack of variation in the above parameters between the platform and the control indicates that the two sites were influenced by the same factors.
There was no evidence to suggest that the platform operations added large amounts of sediments t o the water columns. Increased sedimen- tation could have attenuated light penetration and decreased the amount of primary production in the water column. While the presence of a turbid layer near the bottom caused some concern in the early stages of

350 RICE UNIVERSITY STUDIES
this investigation, Griffin and Ripy (1973) found no connection between the origin of the turbid layer and the presence of the drilling platform in the study area.
Studies of the toxic metals (Brady and Montalvo 1973) and of barium (Chan and Hanor 1973), which were carried out as components of the OEI program, showed that concentrations of these elements were generally greater near the platform than at the control site. Nevertheless, the similarity in the phytoplankton growth between the two sites suggests that these chemicals had no inimical effect on phytoplankton production in the OEI area.
The results of our investigation would have been more significant if baseline studies had been undertaken prior to the construction of oil plat- forms in the Gulf of Mexico some 40 years ago. Lacking adequate recent baseline data for the OEI area, however, we found the data on phytoplankton production and species composition collected east of the Mississippi delta nearly 20 years ago by Thomas and Simmons (1960) and Simmons and Thomas (1962) to be very useful. Comparisons be- tween the data sets show that the standing crop, primary production, and species composition of phytoplankton remain relatively unchanged. Further, variations in the seasonal distribution of the standing crop of phytoplankton and primary production were almost identical to those reported by Thomas and Simmons.
The single most important environmental event during the OEI study was the 100-year maximum flood of the Mississippi River, which oc- curred in April and June 1973. While there is no denial that the Mississippi runoff greatly influences the hydrography, nutrient chemistry, and biological productivity of the north central and western Gulf of Mexico (Fucik and El-Sayed, in preparation), one wonders whether the unusual flood in the spring of 1973 masked possible effects attributable to the offshore platforms. While the river flood waters markedly changed the phytoplankton patterns and greatly contributed to the increase in the phytoplankton standing crop and primary production in the study area, we doubt that the flood waters masked any platform effect. For one thing, the first effect of the flood waters was not observed until July 1973, and prior to this time, normal phytoplankton cycles were observed. The surface bloom observed in September 1972 and the massive bloom of Skeletonema costatum in April 1973 took place without influence from the flood waters or occurred just as the plume waters began to reach the area. The effect of the spring 1973 flood could still be detected in the OEI area as late as January 1974. During this month, primary productivity was an order of magnitude higher than it had been the previous year. How long beyond January 1974 these productivity levels remained above normal we do not know. However, Sklar (1976), in a
ECOLOGY O F PHYTOPLANKTON
TABLE 3. Average Values of Chlorophyll 5 and c14 Uptake in the OEI Study Area Compared with the Gulf of Mexico.
OEI Gulf of Parameter platform Control Mexico
A~erage~chlorophyll 5 (surface) 1.51 1.87 0.20 (mg/m )
Average chlorophyll 5 (integrated) 26.79 20.31 12.42 (mg/m2)
Average s14 uptake (surface) 26.04 27.03 17.5 (mgC/m /hr)
Average s14 uptake (integrated) 101.04 96.08 6.63 (mgC/m /hr)
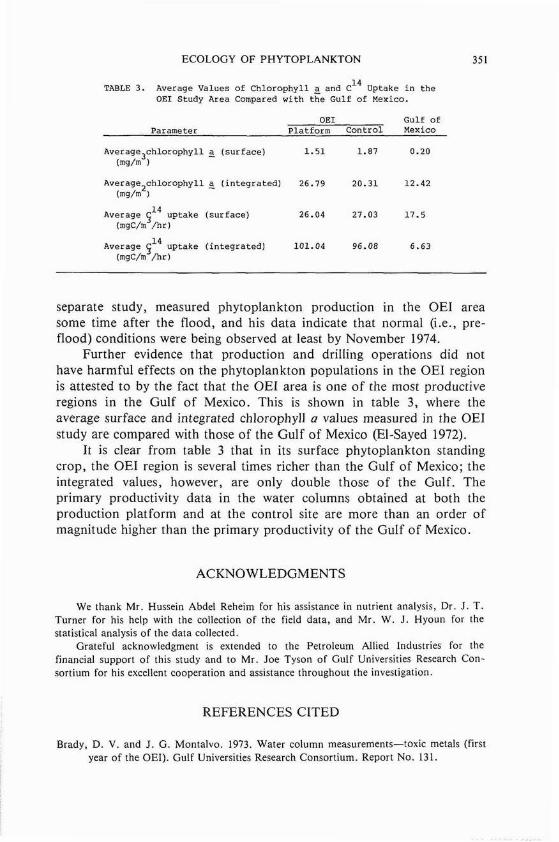
separate study, measured phytoplankton production in the OEI area some time after the flood, and his data indicate that normal (i.e., pre- flood) conditions were being observed at least by November 1974.
Further evidence that production and drilling operations did not have harmful effects on the phytoplankton populations in the OEI region is attested to by the fact that the OEI area is one of the most productive regions in the Gulf of Mexico. This is shown in table 3, where the average surface and integrated chlorophyll a values measured in the OEI study are compared with those of the Gulf of Mexico (El-Sayed 1972).
It is clear from table 3 that in its surface phytoplankton standing crop, the OEI region is several times richer than the Gulf of Mexico; the integrated values, however, are only double those of the Gulf. The primary productivity data in the water columns obtained at both the production platform and at the control site are more than an order of magnitude higher than the primary productivity of the Gulf of Mexico.
ACKNOWLEDGMENTS
We thank Mr. Hussein Abdel Reheim for his assistance in nutrient analys~s, Dr. J . T. Turner for his help with the collection of the field data, and Mr. W. J. Hyoun for the statistical analysis of the data collected.
Grateful acknowledgment IS extended to the Petroleum Allied Industries for the financial support of this study and to Mr. Joe Tyson of Gulf Universities Research Con- sortium for his excellent cooperation and assistance throughout the investigation
REFERENCES CITED
Brady, D. V. and J. G. Montalvo. 1973. Water column measurements-toxic metals (first year of the OEI). Gulf Universities Research Consortium. Report No. 131.

352 RICE UNIVERSITY STUDIES
Chan, L. H , and J . Hanor. 1973. Input of barium into the marine environment as a result of offshore drilling operations. Gulf Universities Research Consortium. Report No. 131.
El-Sayed, S. Z. 1972. Primary productivity and standing crop of phytoplankton. In V . C. Bushnell, ed., Chemistry, Primary Productivity, and Benthic Algae of the Gulf of Mexico. New York: American Geographic Society, Folio 22, pp. 8-13.
-. 1974. Effect of oil production on the ecology of phytoplankton off the Louisiana coast. Gulf Universities Research Consortium. Appendix t o Report No. 138.
Fucik, K. W. and S. Z. El-Sayed. Impact of the 1973 spring flood of the Mississippi River on phytoplankton productivity of offshore Louisiana. (In preparation)
Galtsoff, P . S., H. F. Prytherch, R. 0. Smith, and V. Koehrlng. 1935. Effects of crude oil pollution on oysters in Louisiana waters. Bulletin of the Bureau of Fisheries 18:143- 210.
Gordon, D. C , and N. J. Prouse. 1973. The effects of three oils on marine phytoplankton photosynthesis. Marine Biology 22:329-333.
Griffin, G. M. and B. J . Ripy. 1973. Horizontal and vertical distribution of turbidity on the Louisiana Shelf south of Timbalier Bay-August, 1972-July, 1973. Gulf Universities Research Consortium. Report No. 131.
Holm-Hansen, O., C . J . Lorenzen, R. W. Holmes, and J . D. H. Strickland. 1965. Fluorometric determination of chlorophyll. Journal du Conseil (Conseil Permanent lnternational Pour L'Exploration de la Mer, Denmark) 30:3-15.
Mlrnov, 0. G. and L. A. Lanskaya. 1969. Growth of marine microscopic algae In seawater contaminated with hydrocarbons. (In Russian) Biologiya Morya 17:31-38.
Pulich, W. M., Jr., K. Winters, and C. van Baalen. 1974. The effects of a No. 2 fuel oil and two crude oils on the growth and photosynthesis of microalgae. Marine Biology (Berlin) 28:87-94.
Riley, G. A. 1937. The significance of the Mississippi River drainage for biological con- ditions in the northern Gulf of Mex~co. Journal of Marlne Research 1:60-74.
Simmons, E. G. and W. H . Thomas. 1962. Phytoplankton of the eastern Mississippi delta. Publications of the lnstitute of Marine Science, The University of Texas 8:269-298.
Sklar, F. H . 1976. Primary productivity In the Misslsslppi delta bight near a shallow bay estuarine system in Louisiana. M.S. thesis, Louisiana State University.
Smith, J . E., ed. 1968. Torrey Canyon-Pollution and Marine Life. Report by the Plymouth Laboratory of the Marine Biological Association of the United Kingdom. Cambridge: Cambridge University Press.
Soto, C., J . A. Hellebust, and T. C. Hutchinson, 1975. Effect of naphthalene and aqueous crude oil extracts on the green flagellate Chlamydotnonas angulosa. 11. Photosyn- thesis and the uptake and release of naphthalene. Canadian JournaI of Botany 53:118-126.
Steemann Nielsen, E. 1952. The use of radioactive carbon (C'" for measuring organic production In the sea. Journal du Conseil (Conseil Permanent International Pour L'Exploration d e la Mer: Denmark) 18:117-140.
Strand, J . A., W. L. Templeton, J . A. Lichatovich, and C. W. Apts. 1971. Development of toxicity test procedures for marine phytoplankton. In Proceedings of the Joint Conference on Prevention and Control of Oil Spills, January 15-17. Washington, D.C.: American Petroleum lnstitute, pp. 279-286.
Straughan, D. 1973. Biological studies of the Santa Barbara oil spill. Santa Barbara Channel Region revisited. AAPG Trip 3, 1973, Annual Meeting American Associat~on of Petroleum Geologists, SEPM. SEG. pp. 4-16.
Strickland, J . D. H. 1960. Measuring the production of marine phytoplankton. Bulletin 122, Fisheries Research Board of Canada.

ECOLOGY O F PHYTOPLANKTON 353
and T. R. Parsons. 1970. A Practical Handbook of Sea-Water Analysis. Ottawa, Canada: Fisheries Research Board, Queen's Printer.
Thomas, W. H. and E. G. Simmons. 1960. Phytoplankton production in the Mississippi delta. In Recent Sediment Northwestern Gulf of Mex~co, 1951-1958. Tulsa, Oklahoma: American Association of Petroleum Geologists, pp. 103-1 16.
Yentsch, C. S. and D. W. Menzel. 1963. A method for the determination of phytoplankton chlorophyll and phaeophytin by fluorescence. Deep-Sea Research 10:221-231.
Wheeler, R. B. 1978. The fate of petroleum in the marine environment. Exxon Production Research Company. Special Report, August.