effect of operating parameters on the growth rate … · 2017-10-21 · effect of operating...
TRANSCRIPT

EFFECT OF OPERATING PARAMETERS ON THE GROWTH RATE OF
SOLUTION GROWN CRYSTALS
By
Kumar Vedantham
A Thesis
Submitted to the Faculty of
Mississippi State University
in Partial Fulfillment of the Requirements
for the Degree of Master of Science
in Chemical Engineering
in the Dave C. Swalm School of Chemical Engineering
Mississippi State, Mississippi
August 2004

EFFECT OF OPERATING PARAMETERS ON THE GROWTH RATE OF
SOLUTION GROWN CRYSTALS
By
Kumar Vedantham
Approved: ________________________ ________________________
Priscilla J. Hill Rudy E. Rogers Assistant Professor of Chemical Professor of Chemical Engineering Engineering (Director of Thesis and (Committee Member) Major Professor) ________________________ ________________________
Judy Schneider Mark E. Zappi Assistant Professor of Mechanical Texas Olefins Professor of Engineering Chemical Engineering (Committee Member) (Graduate Coordinator of the Dave C. Swalm School of
Chemical Engineering)
________________________
Robert P. Taylor Interim Dean of the College of Engineering

Name: Kumar Vedantham
Date of Degree: August 7, 2004
Institution: Mississippi State University
Major Field: Chemical Engineering
Major Professor and Director of Thesis: Dr. Priscilla Hill
Title of Study: EFFECT OF OPERATING PARAMETERS ON THE GROWTH RATE OF SOLUTION GROWN CRYSTALS Pages in Study: 88
Candidate for Degree of Master of Science
In this work, crystallization experiments were carried out on four separate
aqueous solutions of adipic acid, ammonium sulfate, urea and L-glutamic acid to
measure the growth rate of these crystals under varying values of temperature, stirrer
speed, cooling rate and holding time.
All experiments were carried out in the Mettler Toledo LabMax, which is an
automated laboratory reactor. A polarized light microscope was used to capture the
images of the crystals and Image Pro Plus software was used for the analysis of
crystal samples.
Due to technical difficulties, the data could not be measured for adipic acid,
ammonium sulfate or urea. L-Glutamic acid was much easier to work with and it was
possible to obtain data. The growth rate for the β form of L-glutamic acid was
estimated from the experimental data using a numerical simulation.

ACKNOWLEDGEMENTS
I would like to thank Dr. Priscilla J.Hill, my major professor for her valuable
guidance and support through out my graduate program. I would also like to express
my gratitude to Dr. Rudy Rogers and Dr. Judy Schneider of Mechanical Engineering
department for being in my committee and providing valuable guidance and
suggestion for my thesis. I would like to thank the Dave C. Swalm school of
Chemical Engineering, Mississippi State University for sponsoring my research work.
ii

TABLE OF CONTENTS
Page ACKNOWLEDGEMENTS.................................................................................. ii LIST OF TABLES................................................................................................ v LIST OF FIGURES ..............................................................................................vi CHAPTER I INTRODUCTION ....................................................................................1 II THEORY AND BACKGROUND ...........................................................5
2.1. Theory ................................................................................................5 2.1.1. Thermodynamics..........................................................................5 2.1.2. Crystallization Kinetics Mechanisms ..........................................9 2.2. Crystal Shape ................................................................................... 14 2.3. Impurity Effect on Nucleation and Crystallization.......................... 15 2.3.1. Impurity Incorporation Mechanism ........................................... 18 2.4. Types of Crystallizers ...................................................................... 18 2.5. Crystal Growth................................................................................. 20 2.6. Shape factor ..................................................................................... 21 2.7. Background...................................................................................... 23 2.7.1. Crystal Habit Modeling.............................................................. 25 III EXPERIMENTAL METHODS AND MATERIALS............................ 30
3.1. Crystallization and Sampling........................................................... 30 3.1.1. Major Equipment ....................................................................... 30 3.1.2. Labmax Operation ..................................................................... 33 3.2. Preparation of Saturated Solution .................................................... 36 3.3. General Procedure for Crystallization Experiment.......................... 37 3.4. Concentration Measurement ............................................................ 39 3.5. Filtration Unit................................................................................... 41 3.6. Analysis............................................................................................ 42 3.6.1. Polarized Light Microscope....................................................... 42 3.6.2. Image Pro Plus ........................................................................... 43
iii

CHAPTER Page 3.6.3. Slide Preparation........................................................................ 44 3.6.4. Measurements Procedure ........................................................... 45 IV RESULTS AND DISCUSSION............................................................. 46
4.1. Adipic acid ....................................................................................... 46 4.2. Ammonium sulfate........................................................................... 47 4.3. Urea.................................................................................................. 53 4.4. Glutamic acid ................................................................................... 58 V CONCLUSION....................................................................................... 83 REFERENCES .................................................................................................. 85
iv

LIST OF TABLES
TABLE Page 1 Different kinds of crystal shapes encountered in industries and problems associated with them ............................................................... 4 2 Some microscopical shape descriptors and their formula.........................23 3 Experiments for ammonium sulfate conducted with distilled water ........50 4 Experiments for ammonium sulfate performed using deionized water ....52 5 Data taken for urea at 100 rpm .................................................................54 6 Data taken for urea at 150 rpm .................................................................55 7 Solubility for glutamic acid in water taken from literature.......................59 8 Data from the measured value of solubility..............................................59 9 Data for glutamic acid for the sample taken at 63°C................................63 10 Data for glutamic acid for the sample taken at 57°C................................67 11 Major axis data for glutamic acid at 57°C ................................................72 12 Area data for glutamic acid at 57°C..........................................................73 13 Minor axis data for glutamic acid at 57°C................................................74 14 Major axis data for glutamic acid at 63°C ................................................76 15 Area data for glutamic acid at 63°C..........................................................77 16 Minor axis data for glutamic acid at 63°C................................................78
v

LIST OF FIGURES FIGURE Page 1 Types of nucleation...................................................................................10 2 Sites for impurity adsorption on a growing crystal (a) kink; (b) step; (c) ledge or face..........................................................17 3 Schematic diagram of the process.............................................................32 4 The Mettler Toledo LabMax (automated laboratory reactor) with the chiller to its side ........................................................................35 5 Anton Parr density meter with a syringe in the side that feeds the sample in to it ...................................................................................40 6 Filtration assembly....................................................................................41 7 Polarized Light Microscope (PLM) with a DP12 camera at the top.................................................................................................43 8 An image of adipic acid crystal taken at 100x magnification...................47 9 Photograph of urea crystal taken at 100x magnification indicating that the growth is too large and crystal is out of field of vision in microscope .............................................................................................56 10 The image of a broken urea crystal caused primarily due to excess growth rate .............................................................................................57 11 Solubility graph obtained by plotting data from literature and from experiment ..............................................................................60 12a Plot of number fraction versus major axis for the samples taken at 63°C .......................................................................................................65 12b Plot of number fraction versus major axis for sample taken at 63°C .......................................................................................................66
vi

FIGURE Page 13 Plot of number fraction versus major axis for sample taken at 57°C .......68 14 Plot of supersaturation versus time for a sample at 63°C .........................70 15 Image of glutamic acid taken at 100x magnification................................71 16 Plot of major axis versus different holding time for sample taken at 57 °C ......................................................................................................72 17 Plot of area versus different holding time for sample taken at 57°C .......................................................................................................73 18 Plot of minor axis versus different holding time for sample taken at 57°C ...................................................................................................74 19 Plot of major axis versus holding time for sample taken at 63°C.............76 20 Plot of area versus holding time for sample at 63°C ................................77 21 Plot of minor axis versus holding time for 63°C ......................................78 22 Plot of aspect ratio versus holding time at 63°C.......................................79 23 Comparison of number fraction between the experimental values and the values obtained from simulation ...............................................80
vii

CHAPTER I
INTRODUCTION
Crystallization is the formation of solid particles within a homogeneous phase,
where the solid molecules are arranged in a repeating lattice structure. It may occur
as formation of solid particles in a vapor (as in snow), as solidification from a liquid
melt (as in the manufacture of large single crystals), or as crystallization from liquid
solution.
Crystallization is significant because it is widely used in many industries such
as the pharmaceutical, fertilizer, dyes and pigments, biotech and other specialty
chemicals industries. This technique must be performed in a controlled manner since
it affects product quality. A product with uniform and narrow size distribution and
large mean crystal size is often desired in industry. The industrial challenge is to
produce crystals of the desired size and bulk density in the most economic manner.
Crystal morphology affects the efficiency of downstream processes (such as
filtering, washing and drying) and influences material properties such as bulk density
and mechanical strength, which play a major role in storage and handling. The
morphology also affects the flowability, agglomeration and mixing characteristics of
particulates (Doherty, 1998). Recently, polymorphs have gained importance in
pharmaceutical industries. Polymorphs arise when molecules of a compound
crystallize into chemically identical forms that are structurally different. This can
1

2
occur when molecules stack in the solid state in distinct ways, when molecules form
different lattice structures, or when they have different lattice parameters.
Abbot Laboratories’ produced a drug for patients with aids. But the drug
developed a late-appearing polymorph that changed the shape from needles to big
faceted crystals with different solubility properties (Rouhi, 2003). This difference in
solubility of the drug can affect its bioavailability. Phenomenon like this makes
crystallization an important issue in industry.
Though much work has been done on crystal size distribution and
mechanisms to predict kinetics, relatively little work has been focused on crystal
shape. One feature, which distinguishes crystals from most other particles, is their
tendency to form well-defined shape. This is important for the measurement of their
size since it places them between spherical particles and shapes that are usually
complex. For most crystalline materials, the situation is further complicated since
crystal shape changes with crystallization conditions such as temperature,
supersaturation and purity.
In industry some form of habit modification procedure is necessary to control
the type of crystal produced. This may be done by controlling the rate of
crystallization; that is, by choosing the operating conditions such as the rate of
cooling, the degree of supersaturation, the temperature, or the solvent; or by adjusting
the solution pH, adding a habit modifier, or removing or deactivating some impurity
that already exists in solution.
This work studies how the two compounds urea and L-glutamic acid form
crystals under varying operating conditions. Urea is widely used in fertilizer

3
industries, and glutamic acid is an amino acid that exists in two chiral forms as L-
glutamic acid and D-glutamic acid. For the present work the L form is taken. L-
glutamic acid has two polymorphs - α and β. In this research, the desire is to produce
the stable β form.
Table 1 gives an idea of the different crystal shapes obtained in industry and
the problems associated with them. The optimum shape for industries would be a
sphere as it can be easily filtered and transported. But in some cases other shapes are
produced because the crystals might be more stable in that form. For example, the β
form of L-glutamic acid is needle in shape, but still it is produced because that is the
stable form in which glutamic acid can exist.
Chapter 2 provides a review of terminology used in crystallization and gives a
brief literature survey of what has been done in this area. Chapter 3 focuses on the
equipment and techniques involved in carrying out the experiments. Chapter 4
provides a detailed description of the experiments performed and discusses the data
obtained from experiments. This is followed by the conclusion chapter.

4
Table 1: Different kinds of crystal shapes encountered in industries and problems associated with them
Crystal Shape Problems Encountered
Long needle like type Easily broken during centrifugation and drying
Flat, plate like Low filtration rates
Cubical or other compact shapes Caking
Complex or twinned crystals Easily broken during transport

5
CHAPTER II
CRYSTALLIZATION THEORY AND BACKGROUND
2.1 Theory:
Before proceeding to the next chapter it is essential to know some of the
crystallization terms that will be used often in this thesis. These include
thermodynamic concepts such as solubility, supersaturation and metastable zone
width, as well as kinetic concepts such as nucleation and growth.
2.1.1 Thermodynamics:
Solubility:
In order to operate a crystallizer, it is first necessary to know what conditions
will produce crystallization. This information depends on solubility. Solubility is the
maximum amount of solute that will dissolve in a given amount of solvent at a given
temperature to produce a stable solution. When the maximum amount of solute has
been dissolved in a solvent and the equilibrium is attained, then the solution is termed
a saturated solution. The concentration of dissolved solute in a saturated solution is
the same as the solubility of solute. If the solute concentration is less than the
5

6
saturation amount, the solution is subsaturated. If the solution contains more solute
than the saturation amount then it is supersaturated.
Two factors that mainly control the solubility are pressure and temperature.
Generally temperature is the major factor that influences the solubility of solids in
liquids. This effect of temperature on solubility is governed by LeChatelier’s
principle, which states “a change in any of the factors determining an equilibrium will
cause the system to adjust in order to reduce or counteract the effect of change” (Kotz
and Purcell, 1991).
Before performing crystallization experiments, it is necessary to have the
solubility data for the system of interest in order to prepare the saturated solution.
The solvent plays a significant role in the system’s solubility. For example, a
compound’s solubility in water may be very different from its solubility in alcohol.
The solubility of urea in water at 20°C is 101 g per 100 g water, whereas the
solubility in methyl alcohol is 22 g per 100 g methyl alcohol and in ethyl alcohol it is
5.4 g per 100 g ethyl alcohol at the same temperature.
Supersaturation:
A second factor in crystallization is the driving force or supersaturation. It is
the concentration difference between that of supersaturated solution in which the
crystal is growing and that of a saturated solution. “Supersaturation refers to the
quantity of solute present in solution compared with the quantity which would be
present if the solution were kept for a very long period of time with solid phase in
contact with the solution” (Perry, 1997).

7
Generally, supersaturation is expressed in a number of ways (Mullin 2001) as
shown below.
∆c = c – c* (1)
S = c / c* (2)
σ = ∆c / c* = S – 1 (3)
where,
c is the solution concentration
c* is the equilibrium saturation
S is the supersaturation ratio
∆c is the concentration driving force
σ is the absolute or relative supersaturation.
Each of these equations defines supersaturation in a different way. Eq. (1) express it
as a concentration difference, while both Eqs. (2) and (3) express it as a ratio. One
key difference is that in Eq. (1) it has the same units as concentration, while it is
dimensionless in the other two cases.
Like supersaturation, concentration can also be expressed in many ways
depending on whether or not the substance forms a hydrate and whether or not the
solvent is water. Some expressions of concentration are as follows:
kg of anhydrous substance/kg of water
kg of anhydrous substance/kg of solution
kg of hydrate/kg of ‘free’ water
kg of anhydrous substance/m3 of solution
kg of hydrate/m3 of solution

8
kmol of anhydrous substance/m3 of solution
When using concentrations, it is important to know which expression is used. For
example, solubility data can be reported using any of these expressions.
Metastable Zone:
Nucleation cannot occur unless a solution is supersaturated. However,
nucleation does not necessarily begin as soon a solution becomes supersaturated. The
metastable zone refers to a supersaturated zone where nucleation is unlikely to occur.
There is a limit as to how supersaturated the solution can be and still not nucleate.
This is called the metastable limit. At concentrations above the metastable limit,
nucleation is highly probable. Crystallizers are often operated in this region by the
addition of a seed crystal.
The knowledge of the metastable zone width (MSZW) and the factors
affecting it can be a major factor in the design of crystallization processes and may
help to improve the reproducibility of the process. The temperature at which the first
speck of particle appears corresponds to the width of the metastable zone.
The width of the metastable zone is calculated by the polythermal method. In
this method a solution is cooled at a constant rate from a saturated temperature down
to a temperature at which the first visible nuclei appears. The difference in these
temperatures is generally termed as maximal supercooling (∆Tmax). Generally, the
higher the zone width, the greater will be the stability of solution. To achieve a
uniform crystal size distribution in batch crystallizers, they should be operated within

9
this metastable zone in a range where growth is supported and nucleation is negligible
(Genck, 2000).
Much research has been done on the effect of impurities on crystal growth.
Sayan and Ulrich (2001) studied the effect of Ca+2, Mg+2, Cr+3, Fe+2 ions on the
MSZW of boric acid. They concluded that the zone width decreased with the
addition of impurities.
The MSZW for a particular compound varies with different operating
conditions (Rajesh, et al., 2001). This was observed in all the experiments conducted
for the present work with urea and glutamic acid where there was remarkable change
in the temperature at which the first nuclei appeared when the cooling rate and stirrer
speed was changed.
The seed crystal that is added influences the MSZW. Ramasamy, et al. (2001)
studied the effect of addition of urea on the MSZW and nucleation parameters of
ammonium dihydrogen orthophosphate. It was observed that at lower temperatures
enhancement of zone width is good, but at higher temperatures the enhancement of
zone width is narrow.
2.1.2 Crystallization Kinetics Mechanisms:
There are several mechanisms to account for changes in crystal size during
crystallization: nucleation, growth, breakage, and agglomeration. Nucleation refers to
the formation of a new crystal from solution, growth refers to the process of an
existing crystal increasing in size, breakage refers to the fracture or attrition of a
crystal, and agglomeration refers to two or more particles colliding and sticking

10
together. Since this work focuses on nucleation and growth, these mechanisms are
discussed in more detail.
Nucleation:
Nucleation is the birth of a new particle, embryo or nucleus that act as a center
of crystallization. Nucleation may occur spontaneously or it may be induced
artificially by agitation, mechanical shock, friction, etc. Nucleation can be classified
as shown in Figure 1.
Homogeneous (spontaneous)
Primary
Nucleation Heterogeneous (induced by foreign particles)
Secondary (induced by crystals)
Figure 1: Types of nucleation
Homogeneous Nucleation:
Homogeneous nucleation is the formation of new particles without the
influence of any solids including the wall of the container or even the minute particles
of foreign substances. Supersaturation is the only driving force for nucleation of this
sort to occur.
Nucleation occurs in several stages. Initially, several atoms or molecules in
solution associate together to form a cluster. If enough particles associate together,
then it marks the beginning of lattice arrangement and formation of separate phases
called embryos. But sometimes these embryos are unstable and revert back to

11
clusters. However, if supersaturation is strong enough, an embryo can grow and
become thermodynamically stable in solution. This stable form is called a nucleus,
and this grows to form a crystal (McCabe et al., 1993). If a nucleus loses units it
dissolves; if it gains units, it forms a crystal. This evolution of a crystal is explained
by the following hierarchy.
Cluster Embryos Nuclei Crystal
The fundamental expression for the rate of nucleation was first given by
Volmer and Weber (Genck and Larson, 1972). They proposed an Arrhenius type
relationship
B0 = c exp (-∆G*/kT) (4)
where,
∆G* is the free energy of formation of nucleus
k is the Boltzmann’s constant
T is the absolute temperature
c is the proportionality constant
This expression incorporates the temperature effect into the nucleation rate. This
expression is difficult to use because the free energy of formation of a nucleus is
needed. The rate of nucleation can be also be expressed by
B0 = A exp [- (16πγ3ν2) / (3k3T3(ln S)2) ] (5)
where,
B0 is the rate of nucleation
S is the degree of supersaturation
γ is the interfacial tension

12
T is the absolute temperature
ν is the molecular volume
k is the Boltzmann constant
This expression incorporates the effects of both supersaturation and temperature.
Heterogeneous nucleation:
Heterogeneous nucleation is the formation of new crystal nuclei under the
influence of foreign particles such as impurities. The size of these heteronuclei is
important and it is found that the most active heteronuclei fall in the range of 0.1 to 1
µm (McCabe et al., 1993).
Secondary nucleation:
The formation of new crystals under the influence of existing macroscopic
crystals in the mother liquor is called secondary nucleation or breeding of nuclei.
There are different mechanisms by which secondary nucleation or breeding of nuclei
can occur.
Initial breeding occurs when a crystal, which is not treated before, is
introduced into a supersaturated solution. These are attributed to the impurity
particles that are present on the surface of the seed crystal as the impurity particles are
washed off and grow as new crystals. To avoid this an extensive pretreatment of the
seed crystal is required.

13
Needle breeding occurs when a crystal is held stationary in a highly
supersaturated solution, and needles or dendrites tend to grow out of the body of
crystal, which in turn breaks off and cause breeding.
Polycrystalline breeding occurs at higher supersaturation where the crystal
grows as a polycrystalline mass that breaks and gives rise to further crystals.
Collision breeding occurs when a crystal collides or slides into other solids in
the supersaturated solution. This is the most common type of nucleation that occurs
in most of the agitated seeded crystallizers. Supersaturation is the driving force, and
the number of crystals increases with increase in supersaturation. Clontz and
McCabe (1971) studied the growth mechanism of magnesium sulfate heptahydrate
under collision breeding. It was inferred that instead of well formed normal crystals,
abnormally grown dendrites formed as supersaturation increased. The aspect ratios of
those crystals increased drastically at higher supersaturation. So it is observed that
well-defined crystals were obtained only within a certain supersaturation range where
collision breeding is active.
In addition to the various mechanisms, the factors affecting secondary
nucleation must be considered. These may include:
• Degree of supersaturation:
Since this is the driving force for crystallization, it is an important parameter
in controlling the rate of nucleation. Increasing the supersaturation results in a
larger nuclei population. Depending on the degree of nucleation, this can
enhance crystallization or can produce too many fine particles.
• Temperature:

14
For many systems it has been found that nucleation decreases with increase in
temperature. Therefore, this can be used to control the nucleation rate.
• Impurities:
Impurities can either increase or decrease the solubility, which in turn affects
the supersaturation. So a definite conclusion cannot be derived for the effect
of impurities on nucleation. It depends on the system that is considered. For
example, ammonium sulfate is very sensitive to impurities, and even a trace
amount of impurity can alter its solubility data.
Kitamura, et al. (1992) studied the effect of chromium ions on the
crystal growth of ammonium sulfate. The growth rate of three faces (010),
(100) and (001) faces were studied. It was seen that after a certain
concentration of chromium was reached the growth ceased. This is achieved
by the stepwise adsorption mechanism of chromium on the surface of crystal.
• Seeding:
Seeding is the process of inducing crystallization by inoculating a
supersaturated solution with small particles of the material to be crystallized.
In industry, deliberate seeding is frequently employed to have control over
the product size distribution. Generally, presence of seed increases the rate of
nucleation and gives more reproducible results.
2.2 Crystal Shape:
The external appearance of a crystal, the crystal morphology, is partially
dependent on the crystal habit. The crystal habit can be described in terms of faces,

15
their relative areas, the length of the axes in three directions, and the angles between
the faces. The crystal morphology is often described by shape factors. The relative
area is an essential factor that determines crystal habit. Two crystals that have the
same face and internal structure can have different habit if the relative areas of the
faces are not the same. Factors that influence the crystal habit and shape include the
choice of solvent, the impurities and tailor made additives and the processing
conditions under which crystals are grown. Crystal shape varies drastically with
crystal growth rate and nucleation. Much research has been done to theoretically
predict crystal morphology. Some of these methods are
1) Bravais-Friedel-Donnay-Harker (BFDH) method
2) Periodic bond chain theory
3) Attachment energy method
4) Issing temperature method
In all these theoretical methods only vapor-grown crystals were considered and the
solvent effect was not considered (Mullin, 2001). But solvent can greatly influence
the crystal habit by hindering the attachment of additional molecules.
2.3 Impurity Effect on Nucleation and Crystallization:
Any substance other than the one that is crystallizing is termed an impurity in
crystallizing operations. According to this definition, even a solvent is termed an
impurity and influences the whole process of crystallization. Impurities are generally
present in the crystallizer or added on purpose (additives). It is important to
understand the effect of these impurities in order to design tailor-made additives.

16
Impurities have a profound effect on growth rate of a crystal. The accepted
mechanism for the effect of impurity or solvent on the growth rate is that they absorb
on the face of a surface and decrease the growth rate. It is a well-known fact that
slower growing faces always control shape. At slow growth rates, the shape of the
crystal is determined by the thermodynamic equilibrium condition of a minimum
value ΣσiAi, where σi is the surface free energy and Ai is the corresponding area.
Generally, this condition is rarely attained. So under real conditions the kinetics
drives the final crystal shape more than thermodynamics (Winn, 1998).
There are three sites where an impurity can be absorbed on a crystal. It can
be absorbed on a Kink, on a step or at a ledge or face of a crystal as shown in Figure
2. The effect is different for each of these different sites. Growth is affected even at
a very low impurity level at a kink site. But more impurity is needed at a step site and
face to see an effect on growth (Mullin, 2001).

17
(a) Kink
(b) Step
(c) Ledge or Face
Figure 2: Sites for impurity adsorption on a growing crystal (a) kink; (b) step; (c) ledge or face

18
2.3.1 Impurity Incorporation Mechanism:
Solvent or impurity effects also depend on the face of a crystal. Different
faces exhibit different chemical properties because of the specific arrangement of
molecules in the lattice. So each face exhibits specific chemical and structural
attributes that affect the interaction with the solvents or impurity. For an impurity
atom to attach to the crystal lattice, it has to physically displace the host molecules
from their respective sites. This is not feasible unless the impurity is of the same size
and chemical nature. If there are imperfections in the crystal lattice, then this
condition is easily achieved. But in normal cases, it is hard for the impurity to
achieve this type of bonding to the crystal lattice.
The other way is binding to the lattice without disturbing it. This occurs when
the impurity interacts with the surface through van der Waals forces or through
hydrogen bonding. Additives are generally selective in attaching to the faces. This
type of bonding causes crystals to grow to a new shape, the case in low concentration
impurities.
2.4 Types of Crystallizers:
There are different types of crystallizers used in industry. Crystallizers can be
broadly classified as the following types:
• Batch or Discontinuous crystallizer:

19
A batch crystallizer is a closed vessel or a container where the feed is charged
at the top and allowed to crystallize and the product taken out. The cooling can be
done either by using atmospheric cooling without any stirring or by using artificial
cooling with stirring. The equipment used for this work has artificial cooling, where
a separate chiller is used to maintain and carry out the crystallization. The advantage
of artificial cooling crystallizers over atmospheric cooling ones is that greater crystal
density and corresponding smaller sizes are obtained. Also, aggregation is less and
size distribution is more uniform. With batch crystallizers temperature control
devices are essential since the large temperature drop across the cooling surface
during early stages can cause scaling and reduces the cooling efficiency of the
crystallizer (Mullin and Nylvt, 1971).
• Continuous crystallizer:
A continuous crystallizer is one where the feed is continuous fed into the unit
and product is continuously removed. These crystallizers may be operated at steady
state with a constant temperature and supersaturation. In general, seeding isn’t
required for continuous crystallizers except during start-up. The reason for this is that
once they are running they always have crystals in them.
• Crystallization systems
In both batch and continuous crystallizers, the product from one crystallizer
can be fed to the next, so that first crystallizer’s product acts as seed for the second
crystallizer. Both batch and continuous crystallizers can be operated in series and in
parallel.

20
2.5 Crystal Growth:
Crystal growth consists of the following three basic steps:
Diffusion of solute molecules from the bulk of the solution to the crystal-
solution interface
Reaction at surface where the solute molecules arrange themselves into crystal
lattice
Diffusion of heat of crystallization from the crystal solution interface back
into the bulk of solution
In most crystallization processes the heat of crystallization is relatively low, and
hence the effect of third step on the overall growth process is probably small
compared to other two steps (Abegg, et al., 1968).
Crystal growth is generally governed by ∆L law of crystal growth proposed by
McCabe. This law states that at uniform supersaturation and at the same temperature,
all crystals are invariant and have the same growth rate independent of size (McCabe,
1993). This is called the ∆L law in crystallization, and it is a widely used
generalization for crystal growth. It can be expressed as
∆L = G∆t (6)
The assumptions made in this law were that all crystals have the same shape,
no nucleation occurs, no size classification occurs and the relative velocity between
crystals and mother liquor remain constant. But in reality, growth rate is size-
dependent and the relation that is most widely used expressing the size dependent
growth rate is the Abegg, Stevens and Larson equation (Mullin, 2001).
G (L) = G0 (1+γL)b b<1 (7)
21
where γ, b and G0 are experimentally determined constants.
Larger crystals have higher growth rates if the process is diffusion controlled.
This is because larger particles have higher terminal velocity. Crystals of near
nucleic size have extremely slow rates because of lower supersaturation owing to
their higher solubility. Another factor that determines the size dependent growth rate
is the surface kinetics. Larger particle have more momentum because of their larger
mass. Therefore they cause more surface damage when they collide.
2.6 Shape Factor:
Shape factors are dimensionless numbers that describe features of a particle’s
shape. They fall into two main classes. The simplest are those that may be calculated
directly from geometric shape. For example, aspect ratios are ratios of characteristic
lengths of particles. Frequently an equivalent sphere diameter is used. This
equivalent sphere diameter is the diameter of a sphere that has a same volume as the
particle of interest. Similarly, an equivalent sphere surface area is the surface area of
a sphere with the same volume. Sphericity is defined as the ratio of the equivalent
sphere surface area to a particle’s surface area. Sphericity can be applied to finite
particles of any shape.
The second class includes factors that emerge from the mathematical structure
of a phenomenon or class of phenomena (Buffham, 2000). The behavior of imperfect
crystals during size measurement cannot be analyzed using simple geometric
arguments. The use of shape factor is one approach to quantify and relate the size of
crystals with imperfection to near perfect crystals.

22
Morphology has an important effect on particle size measurement. For
example, a sphere is the only object that is defined by a single size parameter, the
diameter. For any deviation from sphericity, other size parameters must be accounted
for, like the length, breadth and thickness. For this reason, a shape factor that is a
combination of different size parameters is used (Pons, et al., 1999). These
researchers studied the use of image analysis to quantify the morphology of particles.
Basically, three steps that are needed to do this are visualization, image treatment and
image characterization. In the visualization step the analog image as seen by human
eye is transformed first into an electronic image by camera and then into a digital
image. The next step in the image treatment removes any occlusions in the objects.
The final step is the segmentation where the separation of the object of interest from
the background is done. This is the critical step in the particle characterization.
Some of the shape descriptors used are mentioned in the following Table 2.

23
Table 2: Some microscopical shape descriptors and their formula
SHAPE DESCRIPTOR FORMULA COMMENTS Form factor P2 / 4πS or 4πS / P2 This factor compares the
surface of the object S to the surface of the disc of same perimeter (P)
Roundness 4S / πF2max = Deq / Fmax
Compares surface of the object S to the surface of the disc of same diameter Fmax
Aspect Ratio Fmax / Fmin Elongation LG / E
This is a substitute for aspect ratio for very elongated particle
Curl Fmax / LG
For very elongated objects
Convexity P / PC
Pc is the perimeter of the convex bounding polygon
Solidity S / Sc Sc is the surface of the convex bounding polygon
Compactness (Roundness)^0.5
2.7 Background:
Crystallization is characterized by simultaneous occurrence of nucleation and
crystal growth, which forms crystals of various sizes. Both the nucleation rate and
the crystal growth rate are of primary importance in determining the crystal size
distribution (CSD). Crystal growth and nucleation are important in design and sizing
of crystallizers and therefore are important to finishing processes such as filtration,
drying and centrifugation. Kulin, et al., (1997) used CSD analysis and growth rate to
bypass the difficulties in determining nucleation kinetics for urea in water solution.
Variation of shape with super-cooling of different temperatures was studied, and the
shape was always needle-type for urea in water. The paper also discussed the effect

24
of stirring and suspension density on nucleation rate. Garside and Shah (1980)
reviewed the crystallization kinetics research for many systems in continuous Mixed
Suspension Mixed Product Removal (MSMPR) crystallizers. They discussed the
effect of impurities, crystallizer hydrodynamics, temperature, supersaturation, and
magma density on crystallizer kinetics.
Crystal Characterization:
A lot has been spoken about crystal characterization in recent past. Pons and
Vivier (1991) used quantitative image analysis to obtain information on crystal shape
either by individual analysis or by distribution. The paper discusses usage of image
analysis and compares it with Fourier analysis and the geometric method.
C. J. Price (1993) observed the importance of particle characterization in order
to determine crystallization kinetics. The various methods of characterizing crystals
was mentioned with the advantages and disadvantages of every method. For batch
crystallizers, a series of size distributions were measured and compared and from the
differences between successive distribution, the growth rate and nucleation rate can
be calculated. Also, Price (1993) worked on change of crystal habit and perfection
with conditions such as temperature, supersaturation and purity and characterizing
crystal shape. Optical microscopy permits measurements in the x, y, and z direction.
Sieving can also be used to characterize crystals if crystals are nearly perfect.
However, nearly perfect crystals are rarely encountered and always effects of
imperfections are considered. Information was given on different types of
imperfections like adhering fragments, twinned, agglomerate and broken crystals.
Image analysis gives the automated categorization on basis of number distributions.

25
It was mentioned that use of shape factors is one approach to quantify the effect of
imperfections and trying to relate the imperfections to near perfect crystal. Recently,
image analysis techniques have been applied to optical microscopy for morphological
studies with the advantage that a large number of crystals can be surveyed (Maguin,
1993).
2.7.1 Crystal Habit Modeling
Winn and Doherty (1998) found a new technique for predicting the shape of
solution-grown organic crystals. An approach was made to include the crystal shape
in the overall design and organization of organic solids processes. The technique was
successfully used to predict the shape of adipic acid grown from water, biphenyl from
toluene and ibuprofen from polar and non-polar solvents. But the method they
proposed was only applicable when there is dispersive or van der Waals forces
between the solvent and crystal at kinks and steps or where there are known to be
very specific electrostatic interactions (such as water-carboxyl group). This method
cannot handle situations where forces are mostly coloumbic (such as inorganics) or
where there is ionic bonding between solvent and crystal. The modeling also took
into account of additives on crystal shape.
Urea:
Mougin, et al., (2002) used the Ultrasonic Attenuation Spectroscopy (UAS)
technique to measure crystallization growth rates of urea from aqueous solution. It
was seen that the particle size distribution (PSD) obtained by data inversion of UAS

26
gave some insight into shape of the formed crystal. It was observed that the bimodal
distribution obtained from data inversion of UAS is due to the needle like shape of
urea crystals.
Toyokura and Ohki (1991) investigated the growth of fixed needle crystals of
urea and measured the latitudinal and longitudinal growth in a MSMPR crystallizer.
Equations were proposed for estimating the CSD and mean longitudinal to latitudinal
length ratio with a continuous MSMPR crystallizer, and thus concluded that the
values obtained from the derived equation matched with the experimental ones.
Ammonium Sulfate:
Bamforth (1974) studied the effect of attrition and breakage on crystal shape
of ammonium sulfate. Also, Bamforth deals with the effect of impurities on crystal
shape. Kubota, et al., (2000) studied the combined influence of supersaturation and
impurity concentration on crystal growth. The growth behavior of ammonium sulfate
was analyzed numerically. Kitamura, et al., (1992) observed that impurities have a
tremendous influence on habit of crystals. The shape of ammonium sulfate crystals is
modified even by small traces of impurity. It was observed that crystal growth rate
was greatly reduced by the presence of chromium ions.
Glutamic Acid:
Mougin, et al., (2002) used the Ultrasonic Attenuation Spectroscopy (UAS) to
determine particle size during the crystallization of L-glutamic acid in its two
polymorphic forms. Both α and β forms are orthorhombic where the length of each

27
face is different and the angle between the edges of each face is 90°. It is mentioned
that the α form can be achieved by rapid cooling of aqueous solution of L-glutamic
acid. Under fast cooling rates (0.75°C/min and 0.4°C/min) and cooling up to 15°C
the α form is found to be predominant, but at 0.1°C/min the β form is favored. The
crystallization of both forms is discussed separately. For the α form at 25.4°C and
0.75°C/min, the mean size was 2.6 µm, but at 21.1°C a bimodal distribution due to
secondary nucleation was obtained with a mean size of 180 µm. For β particles, the
distribution is bimodal throughout. Unlike the α particles whose bimodal distribution
reflects a tail of finer particles commonly found at the end of crystallization, the
modes of distribution of β particles do not evolve independently of each other. This
can be seen from the ratio of geometric mean throughout the crystallization. At the
beginning, this ratio is higher but otherwise it is constant throughout the process. The
length of the crystals is around 200 µm and width is around 15-40 µm.
Kitamura and Ishizu (1999) studied the growth kinetics and morphological
change of α and β crystals of L-glutamic acid using the single crystal method. The
growth rate of both α and β crystals is by the Nuclei above Nuclei (NAN)
mechanism. Crystallization of polymorphs depends on temperature. With a decrease
in temperature, α crystals are formed. It is observed that solution velocity does not
affect the growth rate, and the growth is controlled by the surface reaction process.
The morphological change of the α crystal during growth is observed, i.e. the shape
of crystal changed from rhomboid to hexagonal and thickness of crystal increases
with supersaturation. The growth of β is mostly in the x (1 0 0) direction, and it is

28
less in the y (0 1 0) and z (0 0 1) directions. It is concluded that morphological
change of α crystals is due to differences in dependence of growth rate on super-
saturation between (1 1 1) and (1 1 0) faces. The higher growth rate of α was due to
a large kinetic factor and a low edge free energy of α.
Kitamura (2002) also investigated the effect of L-Phenylalanine on the growth
rates and morphologies of L-glutamic acid and L-histidine by the single crystal
method. It is noticed that the temperature effect on shape was seen only in some
polymorphs. For example, temperature does not influence polymorphs of L-
hystidine, and this is due to the difference in molecular orientation between the
polymorphs.
Kitamura and Ishizu (1998) studied the additive effect of L-Phenylalanine(L-
Phe) on growth kinetics of L-glutamic acid. It is inferred that at 318 K with L-
phenylalanine the precipitation of β crystal is suppressed, suggesting L-Phe
preferentially suppresses both nucleation and growth rate of β L-glutamic acid. But
at 298 K, crystallization rates of α crystals are retarded and morphological change of
α crystals are induced. With increase in L-Phenylalanine concentration, more than
3.9E-04 mol/l growth rate becomes irregular. This suggests that the growing process
of L-glutamic acid becomes complicated because the adsorption of L-Phenylalanine
is not uniform all over the crystal surface. At constant L-Phenylalanine concentration
the growth increases with increase in supersaturation. For α crystals, growth rate was
affected only in the x (1 0 0) direction.
Regarding glutamic acid, most of the reported work focused on the
transformation from unstable alpha form to the stable beta form. Though it is a well-

29
known fact that alpha form is preferred in industries due to its ease of separation from
mother liquor (Mougin 2002), it is essential to know the growth characteristics of beta
form since lower cooling rates produce beta form. There are data published for the
growth rate of alpha form but no such data exist for beta form. Only the facial growth
on a single crystal was studied before and no work has been done on a bulk of
crystals as explained before in this chapter.

CHAPTER III
EXPERIMENTAL METHODS AND MATERIALS
This research includes the formation of crystals from supersaturated solutions and the analysis of the resulting crystals. The equipment and the experimental techniques used are described in detail in this chapter. This discussion is divided in-to two major sections
• Crystallization and sampling • Analysis
The crystallization and sampling section discusses the particle formation procedures, while the analysis section discusses the analysis of the particles 3.1 Crystallization and Sampling 3.1.1 Major Equipment: LabMax:
The Mettler Toledo LabMax is a laboratory reactor that is used to perform
chemical reactions automatically. It is designed in accordance with state-of-the-art
technology with regard to safety and product quality. This automated reactor is
controlled and run by CAMILE TG software. It includes a reactor with a stirrer, a
30

31
computer and sensors for data acquisition, and temperature control.
Reactor:
The reactor is made up of a 1 liter jacketed glass vessel and can operate at
ambient pressure and at a vacuum of 50 mbar. It includes a PT-100 temperature
sensor and a glass stirrer. It has ports in the top for analysis equipment and a valve at
the bottom to remove the vessel contents. A collection tray is installed below the
reactor and serves to collect reactor contents. There is a plastic shield in front of the
reactor vessel to protect the reactor from damage and to prevent the user from contact
with the hot reactor. Figure 4 shows the LabMax unit with the stirrer motor mounted
above the reactor vessel. The stirrer can be set to run at speeds up to 850 rpm.
The computer includes a flexible menu driven program for operating LabMax.
Specifically, it allows the user to determine what operations the unit will perform
during an experiment. It can be programmed as a series of steps where variables such
as the temperature, agitation rate, and operating time of each step can be set. It also
allows the user to set safety parameters. For example, if the temperature goes above
or below set limits, the experiment will automatically abort. The computer also
collects data during operation. Figure 3 shows the schematic diagram of the entire
process.

32
Stirrer
Temperature probe
Chiller
To Vacuum filter Figure 3: Schematic diagram of the process
For proper operation, process control is important. In fact, it is critical to
control the temperature of the vessel contents since solution crystallization can be
sensitive to temperature. The LabMax control system basically comprises the 3
modules:
• Thermostatting unit
• Controller unit
• Thermostat
Each one of these is described below in more detail.
The thermostatting unit is located between the sensors and the computer. It
includes a microprocessor control, the measurement system and the power electronics
and electromechanical control. The microprocessor receives parameters and set
values from the computer, acquires measured values from the sensors, and controls
the temperature and stirrer speed in the reactor. If the connection to the PC is

33
interrupted the microprocessor adjusts the temperature to the predefined default
value.
The controller unit is used to control the pumps, valves and other external
devices; and to acquire additional measurement data. This unit includes a
microprocessor system that measures inputs and outputs for measured value sensors.
The microprocessors of the external devices receive a set of measured values
(temperature of reactor contents, oil temperature, coolant temperature, stirrer speed)
every two seconds. The controller unit controls the dosing operations and pH. The
dosing operations were not used for this work.
The thermostat controls the temperature of the reactor contents. Silicon oil,
which is used as heat transfer medium, is pumped through the jacket of the reactor to
keep the temperature at the set value.
Chiller:
Since LabMax does not have a built in cooling unit, cooling fluid must be
supplied. A Julabo chiller was used to provide cooling fluid for the LabMax. The
chiller has provisions to enter the high temperature limit (up to a limit of 400°C), low
temperature limit (down to a limit of -50°C) and working temperatures.
3.1.2 Labmax Operation:
Safety parameter values need to be set before programming the experiment.
Safety parameter values define the operating limits of the LabMax unit. If the

34
experimental conditions go beyond the safety parameters, then the program will abort
the experiment.
Next the experiment is programmed into LabMax. It is programmed as a
series of steps or stages. Any number of stages can be set for an experiment and the
LabMax performs each stage consecutively in the order in which it is entered. For
each stage of the experiment, the reactor temperature, stirrer speed and duration of the
stage is set and varied accordingly to requirement of the experiment. There are
options to view and modify the program and save it when it is modified. If the data
entered in the program is out of the range of safety parameters, then an emergency
program is triggered.

35
Figure 4: The Mettler Toledo LabMax (automated laboratory reactor) with the Chiller to its side

36
3.2 Preparation of Saturated Solution:
To prepare a saturated solution at a given temperature, the solubility at the
given temperature is used. A fixed amount of solvent is added to the vessel; and then
the amount of solute required to saturate the solution is added. The solution is heated
above the saturation temperature and held at this elevated temperature to ensure that
all of the solute dissolves. Then the solution is gradually cooled to the saturation
temperature.
For illustration purposes, consider the case where a saturated solution of urea
in water is prepared for a saturation temperature of 30.7°C. The solubility of urea at
this temperature is 162 g/100 g water (Seidell, 1928). About 203.1g of urea and 150g
of deionized water are weighed using an electronic balance that has accuracy up to
two decimal places and added to the reactor vessel. Deionized water is used for the
experiment since the presence of impurities in the water may affect the shape of
crystals formed and the solubility. The vessel contents are then heated above 30.7°C
to dissolve all of the solids. Then the vessel is gradually cooled to 30.7°C to form a
saturated solution.
In all the runs that were performed the reactor contents were taken 10-15 °C
ahead of the saturation temperature to make sure the contents are completely
dissolved. This value is completely dependent on the system studied. Since urea is
readily soluble in water an increase of 10-15°C is enough but for substance like
ammonium sulphate we may have to take to 30 – 35°C more than saturation
temperature. After the contents are dissolved the reactor is cooled at a desired rate

37
and stirrer speed set in the recipe. About 0.04 gms of urea was seeded in the reactor
for all the experiments at 29°C. A filter flask connected to the vacuum filter was
placed below the stopcock at the bottom of the reactor vessel. Once the desired
temperature was reached the stopcock was opened and turning on the vacuum filter
filtered a small sample of the contents. The sample was taken for at least at two
different temperatures for a given set of operating conditions in order to make
comparisons. The collected sample is then taken for microanalysis.
3.3 General Procedure for Crystallization Experiment:
Step 1:
A mixture of solute and solvent is prepared that is saturated at the set
saturation temperature. The amount of solute needed for 150 g of deionized water is
calculated and weighed and then added to the vessel. A funnel is used for adding the
solute to the reactor vessel. Then the deionized water is weighed and added to vessel.
Step 2:
The next step is to program the LabMax. The stirrer speed was set as desired.
The mixture was heated to 10°C – 15°C above the saturation temperature and given
around 40 minutes to heat. Then the contents are held at this temperature for around
20 min just to make sure that the solute is completely dissolved. Some substances do
not dissolve immediately and need to be maintained above saturation temperature for
some time before everything can be dissolved. The solution is then gradually cooled
to the saturation temperature. If seeding is used, the seeds are added at the saturation

38
temperature. The solution was then cooled to the desired final temperature at the
desired cooling rate. The reactor vessels are observed to see if anything crystallizes
before the saturation temperature. If there is some problem with the way the
experiment is conducted; the experiment is then repeated from step 1. At the
saturation temperature, a small sample of liquid (about 2 ml) is taken with the help of
syringe from reactor and added to the sample bottle. The sample bottle is prepared as
described in the following section 3.4.
Step 3:
At the end of operation, the slurry is held at the temperature at which the
sample is to be taken. The stopcock at the bottom of the vessel is opened and
material is taken and filtered. The stopcock is left opened until enough material is
collected. The filtration apparatus is already set up just beneath the nozzle from
which the sample is taken and the contents pass directly to the filter from the LabMax
as shown in Figure 6.
Step 4:
Finally the solid sample was prepared for microanalysis as mentioned later in
this chapter in slide preparation section. The above-mentioned procedure can be used
for any material by changing the saturation temperature and other operating
parameters as desired for the experiment.

39
3.4 Concentration Measurements
A density meter (Anton Parr DMA 4500) as shown in Figure 5 was used to
find the concentration of the solution at the saturation temperature. Density data for
ammonium sulfate was taken from CRC handbook of chemistry. Our experimental
procedure was verified by checking the density of the solution to see whether it
coincided with the data from literature. This procedure consisted of three steps:
preparation of the sample bottle, taking the sample, and analyzing the sample in the
density meter.
Sample bottle preparation:
Normally, a sample would be added to an empty sample bottle. However,
since samples from the crystallizer are often above room temperature, there was a
possibility of crystal formation in the sample bottle as the sample cooled. To prevent
this, the sample was diluted. Also the density readings were taken at 20°C inside the
density meter, which is again much less than the reactor temperature and could
support crystal formation. So required amount of water was weighed and added to
avoid this crystal formation.
The sample was diluted by the following procedure. An empty sample bottle
was weighed. Then the amount of water needed to avoid crystallization was
calculated. The required amount of water was added along with additional half
milliliter of water. Then the bottle is weighed with the water. This was done to
determine the amount of dilution.

40
Sampling procedure:
The sample is taken from the reactor with a syringe. Immediately it is
injected in to the sample bottle with water. Now the bottle is weighed with the
sample. The mixture is allowed to cool and then injected in to the density meter for
readings. Three such bottles were prepared. It is a common practice to rinse the
density meter with deionized water after getting each reading in order to get an
accurate result.
Figure 5: Anton Parr density meter with a syringe in the side that feeds the sample in to it.

41
3.5 Filtration Unit:
In order to avoid any crystals coming out or growing on the filter paper,
filtration must be done quickly. Vacuum filtration was preferred to other types of
filtration since it had to be accomplished quickly. A standard filtering funnel was
placed on a filtering flask. The filtering flask was connected to the vacuum filter and
was placed below the stopcock at the bottom of the reactor vessel. Once the desired
temperature was reached, the vessel stopcock was opened to transfer the vessel
contents to the filtering funnel. The opening of stopcock and turning on the vacuum
pump must be done simultaneously to make the filtration process quick. A 90mm
diameter filter paper was used with a pore size that could retain particles larger than 7
microns.
Figure 6: Filtration assembly

42
3.6 Analysis
Our aim is to measure the size and shape of crystals. So to measure the shape a
Polarized Light Microscope was used. The following paragraphs describe each one
in detail.
3.6.1 Polarizing Light Microscope (PLM):
A polarized light microscope is used for the enhancement of images. An
Olympus BX51 polarizing light microscope was used to capture crystal images. The
microscope has a DP12 camera at the top, which records the magnified images and
sends it to a digital camera adapter that can be used with the microscope. The adapter
stores all the images in a smart media card, which is a storage device. The DP12 has
a LCD monitor through which the magnified image of the crystal that is being
focused can be viewed simultaneously. It gives a clear idea of how the picture might
look after it is sent to the computer and downloaded for analysis. The mode button
allows the user to record pictures and play them back later. The pictures can be
downloaded to a computer that is connected to the DP12 control box or getting real
time images. The DP12 control box allows the user to erase images after
downloading to provide memory space for storing images for further use. There is a
digital display of number of pictures recorded in the media card. An image can also
be protected from erasing through AE lock protect button in the control box. After
focusing the image to required accuracy, the expose button at the bottom of the
control box is pressed to record the image on the media card. These images are then

43
transferred to a computer for image analysis. Figure 7 shows the picture of a
Polarized Light Microscope that was used for the present work.
Figure 7: Polarized Light Microscope (PLM) with a DP12 camera at the top
3.6.2 Image Pro Plus:
Image Pro Plus gives the state of art imaging and analysis capability for
acquiring, enhancing and analyzing your images. Some of the features include:
• Acquisition of image data from a camera, microscope, or scanner
44
• Image enhancement using powerful color and contrast filters, morphology,
field flattening, background subtraction and other spatial and geometric
operations.
• Tracing and counting of objects manually and automatically. Measurement of
object attributes such as area, perimeter, aspect ratio and roundness.
Calibration of spatial scale to any unit of measure.
• Viewing collected data numerically, statistically or in graphic form and saving
it to a disk.
• Extraction features with spatial tools that isolate an Area of Interest (AOI)
from the rest of the image, or with segmentation tools that extract features by
color or intensity value.
In this work only acquisition, calibration, extraction, measurement, and counting
operations of Image Pro Plus were used. The calibration was done by viewing a
stage micrometer. This is a slide that is marked in microns. The stage
micrometer used had a marking 1 mm long with divisions of 0.01 mm. The
calibration is saved as a file. The final results were exported to MS Excel.
3.6.3 Slide Preparation:
Keeping the sample at room temperature for 5-6 hrs dries the sample from the
crystallizer. The dried crystal sample is then transferred to a microscopic slide to get
a clear image of the crystal. Images cannot be taken directly from the filter paper as
crystals might be lying one above the other and a clear image cannot be obtained.

45
Care should be taken not to break the crystals while transferring from filter paper to
slide. The slide is completely dry when the sample is put on it.
3.6.4 Measurements Procedure:
The slide is observed under a Polarized Light Microscope. The magnification
used for urea, ammonium sulfate, and glutamic acid crystals was 100x. Since urea
crystals were much bigger it was not possible to take pictures at higher
magnifications. The crystal images were captured using a DP12 digital camera on top
of the microscope. The images were then transferred to the computer that has Image
Pro software.
Since the image analysis requires calibration, an image of the stage
micrometer at 100x was used to calibrate the software. Then the crystal image was
opened and from the measure menu in the software the calibration was checked to see
whether it matched the magnification with which the pictures were taken. The
measure menu was chosen and the parameters to be measured like area, aspect ratio,
major axis, minor axis were selected. Then the crystals were colored by using select
color option and then the counting was done. Coloring was done in order to separate
the actual sample from the background. Options were available in the edit menu to
split two objects and merge objects. The data was directly transferred to an excel file
and was saved for future reference. The transferred data was then grouped according
to various size ranges in order to find the number fraction. A graph was plotted
between the number fraction and size range for data collected at various temperatures
in order to see the growth occurring at various temperatures.

CHAPTER IV
RESULTS AND DISCUSSION
Experiments were conducted for several systems. In each case there was one solute with water as the solvent. While the adipic acid/water, ammonium sulfate/water, and
urea/water systems did not work well experimentally, the L-glutamic acid/water
system gave meaningful results. Each system is discussed in more detail individually.
4.1 Adipic acid
In a crystallizer the four mechanisms of growth, nucleation, agglomeration,
and breakage can occur. In this thesis, the goal is to study growth and nucleation. It
is much easier to do this if agglomeration and breakage are negligible for a system.
Adipic acid was chosen because it is a commodity chemical used in
manufacturing nylon. However, it tends to agglomerate. A number of experiments
were performed under different conditions. The saturation temperature chosen for all
the experiments was 40°C, and the solubility of adipic acid in water at this
temperature is 5.12 g of salt per 100 g of water (Seidell, 1941). The stirrer speed used
was 250 rpm and the experiments were performed at various cooling rates ranging
from 0.1°C/min to 10°C/min. However, there was significant agglomeration in all
cases. A typical agglomerate is shown in Figure 8. Due to the severe agglomeration,
this system was abandoned as a test system.
46

47
Figure 8: An image of adipic acid crystal taken at 100x magnification
.2 Ammonium sulfate
e was also considered as a compound for investigation. The
solubili
Crystallization Experiments for Ammonium Sulfate:
ater of ASTM-III purity taken
from th
4
Ammonium sulfat
ty of ammonium sulfate at 40°C is 162g/100g of water (Seidell, 1928). The
saturation temperature of 40°C was used for all the experiments. Several sets of
experiments were performed using distilled and deionized water.
The first set of experiments used distilled w
e chemistry lab. Experimental conditions were as shown in Table 3. Seeding
for all the experiments were done at 40°C and a stirrer speed of 120 rpm was used for

48
most of the experiments. By using distilled water, the salt never dissolved even after
taking the substance to 10°C above the saturation temperature of 40°C and keeping it
at that temperature for about 24 hours. This is shown in Run 7 of Table 3, where the
reactor was maintained at 50°C for 840 min and still the contents were not dissolved
completely. Since ammonium sulfate was not readily soluble in water, one full day
was required to carryout each of these experiments. In each case, the solution was
taken above the saturation temperature and kept at that temperature for at least 6
hours. The same result was obtained even after making successive runs using
distilled water. A few experiments were repeated keeping the same operating
conditions as shown in Table 3 for reproducibility but the results were never
consistent due to reasons explained latter.
As far as the crystal shape was concerned, needles or rods were formed under
slow co
., (1970) worked on the nucleation and growth of ammonium
sulfate
oling rates 0.1°C/min, 0.5°C/min, and 0.2°C/min; and chunky crystals were
formed under higher cooling rates of 1°C/min or 1.5°C/min. Sometimes a mixture of
both was obtained.
Mullin, et al
crystals from aqueous solution and mentioned the use of deionized water for
their experiments. This led us to conclude that ammonium sulfate is very sensitive to
even trace amount of ions present in water. Although other researchers (Kitamura,
Ikemoto, Kawamura and Nakai, 1992) discussed the effect of ions on shape of
crystals formed, no literature was found on the effect of ionic impurities on the
solubility of ammonium sulfate. In general if an impurity is present in a saturated
binary solution, it may either react chemically with the solute to alter the nature of the

49
system, or it might make the solution supersaturated with respect to the solute and
precipitate it, or it might make the solution unsaturated with respect to the solute.
The former phenomenon is termed as ‘salting-out’ while the later one is known as
‘salting-in’ (Mullin, 2001). Since ions had a strong effect on particle shape, they
could also have an effect on solubility.

50
Table 3: Experiments for ammonium sulfate conducted with distilled water
(°C /min) (rpm) temperature which samples Test Number Cooling rate Stirrer speed Saturation Temperature at
(°C) were taken (°C)
40 35 30
3 0.5 150 40 30 4 0.5 100 40 30 5 0.1 120 40 30 6 0.1 120 40 30 7 0.1 120 40 30 ( The
was
reactor maintained at 50°C for 840 min and still the contents were not dissolved completely). 30 30 (crystalsappeared 30 30
12 0.16 120 40 30 13 0.5 120 40 30 14 0.1 120 40 30 15 0.1 120 40 30 16 0.1 120 40 30 17 0.1 120 40 34 18 0.5 120 40 30
(crystals never ) appeared
30 30
21 0.5 120 40 30 22 0.5 100 40 30
1 0.1 100 2 0.1 150 40
8 0.33 120 40 9 0.2 120 40
never )
10 0.2 120 40 11 0.2 120 40
19 0.5 120 40 20 0.5 100 40

51
The second set of experiments used deionized water of ASTM-I purity taken
from the Hand Chemical Laboratory at Mississippi State University. The
experiments performed are shown in Table 4. The deionized water provided
improved results as far as the solubility was concerned, but there were problems
concerning the crystallization once the solution was cooled. Crystals came out of
solution significantly above the saturation temperature during cooling. For example,
the first experiment mentioned in Table 4 used a saturation temperature of 40°C and a
cooling rate of 1°C/min. For the experiments, the contents were heated up to 60°C to
dissolve the ammonium sulfate. Once the solution was observed to be clear, it was
cooled to start crystallization. The crystals started appearing at 43°C, which is
thermodynamically impossible since the solution is still above the saturation
temperature of 40°C. There were many such experiments where the crystals were
clearly visible before the solution had cooled to the saturation temperature. This
indicated that there was some impurity that was altering the solubility.
52
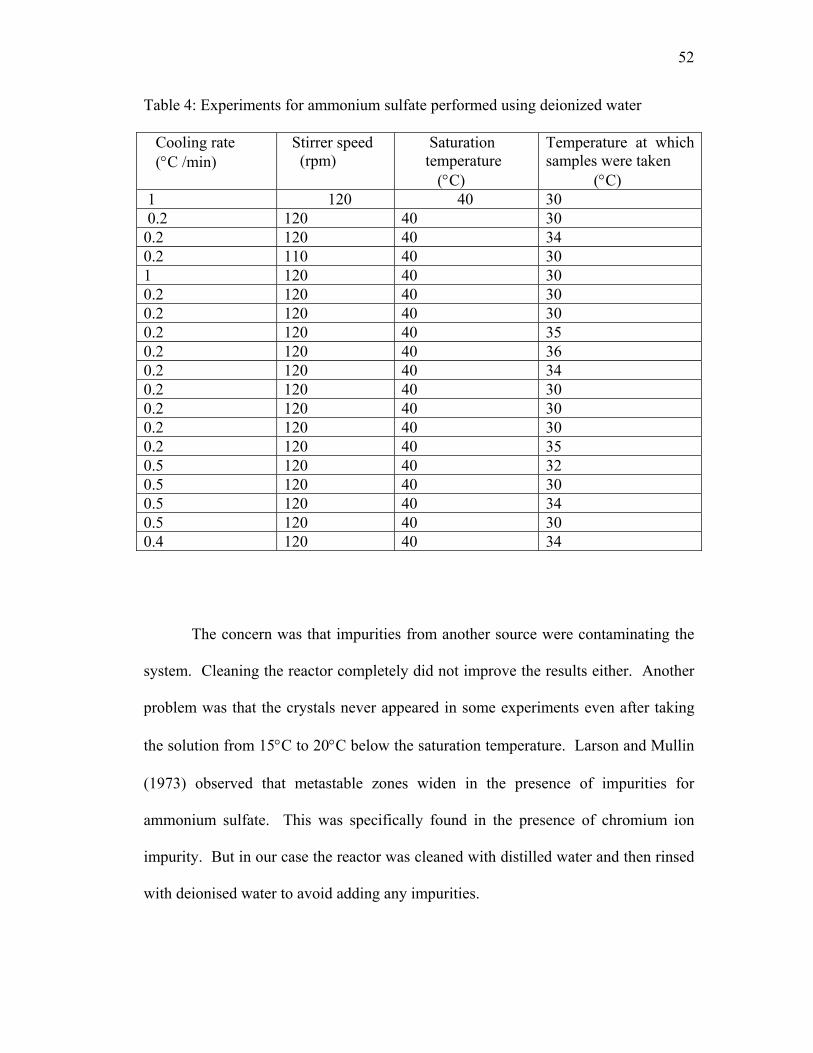
Table 4: Experiments for ammonium sulfate performed using deionized water
(°C /min) (rpm) temperature which
samples were taken Cooling rate Stirrer speed Saturation Temperature at
(°C) (°C) 1 120 40 30
40 30 0.2 120 40 34 0.2 110 40 30 1 120 40 30 0.2 120 40 30 0.2 120 40 30 0.2 120 40 35 0.2 120 40 36 0.2 120 40 34 0.2 120 40 30 0.2 120 40 30 0.2 120 40 30 0.2 120 40 35 0.5 120 40 32 0.5 120 40 30 0.5 120 40 34 0.5 120 40 30 0.4 120 40 34
0.2 120
he concern was that impurities from another source were contaminating the
system
T
. Cleaning the reactor completely did not improve the results either. Another
problem was that the crystals never appeared in some experiments even after taking
the solution from 15°C to 20°C below the saturation temperature. Larson and Mullin
(1973) observed that metastable zones widen in the presence of impurities for
ammonium sulfate. This was specifically found in the presence of chromium ion
impurity. But in our case the reactor was cleaned with distilled water and then rinsed
with deionised water to avoid adding any impurities.

53
Since seeding a metastable solution can cause crystallization, the reactor was
seeded at 40°C, which was the saturation temperature. But seeding the reactor did
not give consistent results either. That is, the results were not reproducible. The
shape of the crystals was a rod one time, chunky the next time and sometimes there
was a combination of both.
4.3 Urea
Urea is a large commodity chemical that is used in fertilizer production.
Unlike ammonium sulfate, urea was not as prone to solubility problems due to
impurities and was readily soluble in water. The solubility data was taken from
Siedell (1928). But urea had its own problem, which made it a difficult compound to
work with. The growth rate was very high for urea and it produced long needles that
readily broke. Toyokura and Ohki (1991) investigated the latitudinal and longitudinal
growth of single crystal of urea. They found that urea crystals had the tendency to
break since they formed needles and so accounted for breakage while modeling the
growth rate. The same problem was encountered in the present work. The size of the
crystals was longer and broke a lot due to which representative data were not
obtained. The cooling rate, sample temperature and the stirrer speed was changed to
see how much the variation affected the growth and the shape. Table 5 shows the
experiments that were conducted at a saturation temperature of 30.7°C with a stirrer
speed of 100 rpm. The seeding temperature was 29°C for these experiments. About
0.04 g of urea was seeded in the reactor for all the experiments at 29°C. This table

54
also shows the resulting mean area, major axis, minor axis and aspect ratio that were
obtained.
Table 5: Data taken for urea at 100 rpm
Cooling rate °C/min
Sample Temperature °C
Area (µm2)
Aspect ratio
Major axis (µm)
Minor axis (µm)
1.4 28.5 3080.02 8.57941 182.111 24.8431 1.4 28 3174.86 10.381 201.204 22.4922 1.4 27 3249.11 11.6275 223.102 20.48 1.2 28 2769.13 13.0088 190.591 19.8271 1.2 28 3101.16 9.20875 188.171 23.7978 1.2 27 2557.92 13.2881 190.565 18.445 1.2 27 4710.3 7.66492 214.388 30.9554 1.2 26 3675.44 10.6709 200.467 21.8702 1.2 26 5711 9.45679 256.801 29.1972
As seen from the Table 5 there was a strong deviation in the data obtained at
27°C and 26°C at 1.2°C/min repeated tests. At 1.4°C/min though, an increase in
major axis was found as the temperature was decreased from 28.5°C to 27°C. The
images of the crystals show that breakage had occurred which made it difficult to
determine the actual growth of crystals as shown in Figure 10.
Table 6 shows the experiments that were conducted at a saturation
temperature of 30.7°C with a stirrer speed of 150 rpm at cooling rates of 1.2°C/min
and 1.4°C/min. The experiments were seeded at 29°C. There was not much increase
in length from 28°C to 27°C. For 1.2°C/min the length was almost the same as
shown in the Table 6, so a definite growth pattern was not seen with the experiments
that were performed for urea. This is probably due to the breakage of the long

55
needles. Also, as shown in Figure 9, there were many crystals that grew much longer
and extended out of the microscope’s field of vision.
Table 6: Data taken for urea at 150 rpm
Cooling rate °C/min
Sample Temperature °C
Area (µm2)
Aspect ratio
Major axis (µm)
Minor axis (µm)
1.4 28 4860.52 10.1034 250.969 26.6197 1.4 27 6462.99 8.35605 257.617 32.5911 1.2 28 4971.38 10.1933 239.508 28.8267 1.2 27 5071.87 7.96911 240.887 30.3017

56
Figure 9: Photograph of urea crystal taken at 100x magnification indicating that the growth is too large and crystal is out of field of vision in microscope

57
Figure 10: The image of a broken urea crystal caused primarily due to excess growth rate

58
4.4 Glutamic acid:
Glutamic acid is another compound that is studied in this thesis. As discussed in the literature review section, many researchers have studied the two different
polymorphic forms of glutamic acid. Unlike ammonium sulfate, glutamic acid is not
that sensitive to impurities. The solubility of L-glutamic acid at 69°C is 3.815 g per
100 g of water (Seidell, 1941). Deionized water is used to prepare the solution.
Since the β form of glutamic acid was desired, a higher saturation temperature and a
lower cooling rate were used as mentioned in the literature (Mougin, Wilkinson, and
Roberts, 2002).
Solubility experiments were run and it was determined that although our data
was close to the literature data, it was a little different. Data obtained for the
solubility of L-glutamic acid from the literature is shown in Table 7, and the corrected
one that was found by conducting test runs by dissolving know amount of salt in a
given amount of solvent at a particular temperature is shown in Table 8. A graphical
comparison is shown in Figure 11. As seen from the graph there was a marked
difference in the data that were seen in the literature from the one measured. Since
the saturation temperature was selected in between 50°C and 75°C the solubility data
in this range was alone verified. This range of saturation temperatures was chosen
because only at high temperatures the β form was produced.

59
Table 7: Solubility for glutamic acid in water taken from literature
Temperature °C
Solubility (Seidell, 1941) (gms of glutamic acid per 100 gms of water)
50
2.186
55 2.632
60 3.169
65 3.816
70 4.594
75 5.532
Table 8: Data from the measured value of solubility
Temperature (±) 1°C
Solubility (gms of glutamic acid per 100 gms of water)
53
2.186
58 2.626
63 3.166
69 3.816
75 4.594

60
0
1
2
3
4
5
6
40 50 60 70 80
Temperature (deg C)
Solu
bilit
y (g
m/1
00 g
m w
ater
)
Lit. dataExpt. data
Figure 11: Solubility graph obtained by plotting data from literature and from experiment
For the growth experiments, the crystallization procedure was followed as
described in Chapter III. For all of these experiments the saturation temperature was
set at 69°C. The solution was taken 10 degrees above the saturation temperature and
maintained at that temperature for 30 to 40 min until all the glutamic acid was
dissolved and then cooled at the required rate to the temperature desired.
Specifically, a cooling rate of 0.5°C/min for all of the experiments that consistently
produced the β form. The crystals obtained in all the experiments were needle
shaped.

61
Three sets of tests were done. In the one set of tests the crystallizer was cooled
to 63°C, While in the other two sets of tests the crystallizer was cooled to 60°C and to
57°C, respectively. In all of the experiments, crystals were not visible until after the
crystallization reached its final temperature. Therefore, it is believed that the
crystallization occurred isothermally at the holding temperature.
It was not possible to go below 57°C since the material coming out of solution
plugged the crystallizer. This is because increasing the difference between the
saturation temperature and the operating temperature increases the driving force.
This causes more crystals to nucleate and also causes the existing crystals to grow
larger, which essentially causes the plugging in the reactor. Also, a sample could not
be taken above 63°C as hardly any sample was observed coming out of solution
above that temperature.
The samples were withdrawn after crystallizing at a constant temperature for
various holding times ranging from 50min to 240min. Experiments did not continue
beyond 240 minutes because the sample coming out of solution caused the
crystallizer to plug at the bottom. Experiments were not conducted below 50 minutes
because there were not any visible crystals inside the reactor before this time. When
samples from residence times less than 50 minutes were filtered, no solid sample was
recovered. At each holding time and operating temperature, the experiments were
repeated thrice in order to account for repeatability. Approximately 0.0125 g
glutamic acid was added for seeding at the saturation temperature. This was added as
soon as the solution reached the operating temperature. The purpose of adding the
seeds was to obtain more consistent experimental results.

62
Table 9 shows the data that were obtained at a sample temperature of 63°C
and conducted at a cooling rate of 0.5°C/min with a stirrer speed of 120 rpm. The
seed crystals were added at 69°C, which is the saturation temperature. The data that
were obtained were the area, length of major axis; length of minor axis; and aspect
ratio, which is the ratio of major to minor axis.
Glutamic acid showed a consistent increase in the length of major axis with
increase in holding time. On the average the aspect ratio was consistently around 10,
which indicated the crystals, grew more in length than width.

63
Table 9: Data for glutamic acid for the sample taken at 63°C
Holding time (min)
Area µm2
Major Axis µm
Minor Axis µm
Aspect ratio
80 40223.24 648.8798 79.87805 8.905317 80 40339.99 642.4966 84.86349 8.492234 80 29409.91 691.5726 62.40599 11.65798 80 29249.52 674.7487 62.54187 11.63982 80 27825.89 605.0302 63.43458 10.14506 50 23023.76 543.7781 61.25718 9.530274 50 18417.64 496.313 53.99261 9.867308 60 23841.81 558.3976 61.98682 9.662191 60 23790.63 540.4651 62.39064 9.34954 70 29114.77 650.4092 61.85469 11.219 70 28449.37 619.3082 63.33846 10.31351 100 33139.53 697.0728 66.30532 11.10185 100 30733.84 658.7085 65.44908 10.79694 120 43815.81 716.7409 85.69912 9.712942 120 43371.99 740.821 82.30549 10.56276 120 37557.32 761.5259 68.84551 11.89258 180 45825.8 776.4951 83.27558 11.08638 180 39933.85 728.898 78.94642 10.94627 180 41434.13 873.1133 70.84307 14.00121
210 59119.67 928.9241 85.42972 13.54874 210 52330.66 791.3247 95.36911 10.02212 210 40741.88 890.8976 63.26765 15.09118 225 59257.3 852.4814 97.29741 10.65782 225 57904.1 726.424 114.2079 7.586533 225 38937.55 824.6123 63.82938 13.2887 240 60865.76 866.0828 93.33111 11.23848 240 66461.97 792.1932 111.4291 8.414369 240 39958.06 885.6026 65.47786 14.7945
Since for all the experiments the value of major axis never exceeded 1700 µm,
the number fraction was obtained by categorizing all the values of major axis between
0 and 1612 µm in 20 intervals using a geometric progression. After calculating the
number of samples that belong to particular interval, the number fraction was
obtained by dividing the number present in one particular interval by the total number

64
in the sample. Then the number fraction was plotted against major axis to see the
CSD.
As seen in Figure 12a, there is a shift of the peak towards the right as we
move from 50 min to 100 min, which indicates growth. But the same pattern was not
seen as the time was increased beyond 100min. In Figure 12b for 240 min, a trimodal
distribution was obtained. Also the curve for 210 min was not as smooth as the other
ones. The physical explanation for the multimodal distributions is that another
mechanism other than growth or nucleation has become active. Observation of
crystals under the microscope indicated that agglomeration was not occurring. Given
the size of the larger crystals, it is quite likely that breakage starts to become
significant after 100 minutes. Therefore, only the tests performed at 100 minutes or
shorter times are considered in determining the growth and nucleation rates.

65
0
0.05
0.1
0.15
0.2
0.25
0.3
0.35
0.4
0.45
0 200 400 600 800 1000
Major Axis (µm)
Num
ber F
ract
ion
50min60min70min80min100min
Figure 12a: Plot of number fraction versus major axis for the samples taken at 63°C

66
0
0.05
0.1
0.15
0.2
0.25
0.3
0.35
0.4
0.45
0 500 1000 1500 2000 2500 3000 3500Major Axis (µm)
Num
ber F
ract
ion
50min60min70min80min100min210min240min
Figure 12b: Plot of number fraction versus major axis for sample taken at 63°C
Table 10 shows the data that were obtained at a sample temperature of 57°C
and conducted at a cooling rate of 0.5°C/min with the stirrer speed of 120 rpm.
Again the saturation temperature was 69°C and the seeds were also added at the
operating temperature.

67
Table 10: Data for glutamic acid for the sample taken at 57°C
Holding time (min)
Area µm2
Major Axis µm
Minor Axis µm
Aspect ratio
50 44755.2 831.078 75.8874 11.8357 50 34907.8 760.508 65.9245 12.3103 72 37920.9 564.504 95.3773 7.02758 72 46178.9 881.795 77.1392 12.3869 72 44175.7 877.306 70.7985 13.0001 120 44506.5 552.83 112.552 5.8351 120 44333.9 892.321 71.526 13.0471 120 52036.9 1023.94 71.6297 15.2279 180 46607.4 614.333 103.61 6.92783 180 79012.7 1250.68 87.2577 15.3913 180 58184.5 954.652 87.0078 11.5875 180 53770.6 879.143 81.789 10.6783 210 59093 803.029 103.438 8.68532 210 68602.8 1068.85 89.2554 12.4144 210 64808.6 969.034 90.8662 10.9639 240 89538.6 924.397 119.985 7.95365 240 75154.7 947.621 104.709 9.44554 240 68302.3 1060.22 85.4137 12.8742
In this set of experiments, much higher values of major axis was obtained
compared to 63°C as expected. The number fraction plot was plotted in the same
manner as explained for 63°C as shown in Figure 13. The aspect ratio was still
around 10 for 57°C.

68
0
0.05
0.1
0.15
0.2
0.25
0 500 1000 1500
Major Axis ( µm )
Num
ber F
ract
ion
79min120min180min210min240min
Figure 13: Plot of number fraction versus major axis for sample taken at 57°C
The curves obtained at 57°C were not as unimodal as obtained for 63°C. The
curve obtained for 210 minutes was very inconsistent with the distributions at other
times. Only the distributions for 79 min and 120 min were unimodal and therefore
reasonable for growth and nucleation only. It was hard to see the growth pattern for
higher holding time, which was the same case as in 63°C.
For glutamic acid, the density meter was not used for getting the concentration
measurements because the data obtained from the density meter was not consistent.
So a different method was used to measure the concentration for glutamic acid. Once
the experiment was completed and sample was ready for filtration, about 2 ml of
sample was taken out using a syringe and transferred to a plastic weighing dish that

69
had already been weighed. The weight of the sample taken was measured. Then the
plastic dish was placed in an oven for about 6 hours to evaporate the water. Once the
water was evaporated the weight of the solid alone was measured. From this we can
calculate the amount of glutamic acid that was present in the solution at the end of
experiment. Since the initial concentration was known, the amount of material that
came out of solution could be calculated.
Figure 14 shows the plot of supersaturation versus time obtained for a sample
taken at 63°C. The concentration was measured to be 0.4325 g per 100 g of solution
at 50min holding time, and 0.0549 g per 100 g of solution at 100 minute holding time.
There was a decrease in supersaturation value as the residence time increased from 50
min to 100 min. But the data obtained at 70 min and 90 min varied significantly and
did not follow this trend. But the other four points clearly showed the decrease in
supersaturation as the holding time was increased. Since the sample was taken down
from the reactor conditions to the room temperature there was continuous evaporation
taking place during the weighing. Even a loss of 0.025 g of sample increased
supersaturation measurement by 0.1 g per 100 g of solution. Therefore the accuracy
is ± 0.1 g per 100 g of solution. So, evaporation of the sample affected the
concentration data obtained.

70
0
0.1
0.2
0.3
0.4
0.5
0 20 40 60 80 100 120
Time (min)
Supe
rsat
urat
ion
(gm
/100
gm o
f sol
ultio
n)
Figure 14: Plot of supersaturation versus time for a sample at 63°C

71
Figure 15: Image of glutamic acid taken at 100x magnification
It is insufficient to do an experiment once. Experiments must be done several
times to determine repeatability. Tabulated data for tests at 57°C are shown in Table
10. Figure 16 shows these graphically. These show the average value of the major
axis of the crystals as a function of residence time in the crystallizer. While there is
good agreement at 50 minutes, the values diverge at longer times. However, the
divergence is smaller for the 2D area of the crystals as shown in Table 12 and Figure

72
17. This 2D area is the area seen in a 2 dimensional image. Also, less divergence is
seen for the minor axis of the crystals as shown in Table 13 and Figure 18.
0
200
400
600
800
1000
1200
1400
0 50 100 150 200 250 300
time (min)
Maj
or A
xis
( µm
)
major 1major 2major3major4
Figure 16: Plot of Major axis versus different holding time for sample taken at 57 °C
Table 11: Major axis data for glutamic acid at 57°C
Time (min) Major axis 1 (µm)
Major axis 2 (µm)
Major axis 3 (µm)
Major axis 4 (µm)
50 831.0777 760.5076 72 564.504 881.295 877.306 120 552.8297 892.3212 1023.936 180 614.3333 1250.684 954.6517 879.1427 210 803.0289 1068.846 969.0342 240 924.3968 947.6211 1060.216

73
0100002000030000400005000060000700008000090000
100000
0 50 100 150 200 250 300
Time(min)
Are
a( µ
m2 )
area1area2area3area4
Figure 17: Plot of area versus different holding time for sample taken at 57°C
Table 12: Area data for glutamic acid at 57°C
Time (min) Area 1 (µm2) Area 2 (µm2) Area 3 (µm2) Area 4 (µm2) 50 44755.18 34907.78 72 37920.93 46178.85 44175.71 120 44506.46 44333.94 52036.95 180 46607.45 79012.72 58184.47 53770.6 210 59092.98 68602.85 64808.64 240 89538.63 75154.71 68302.26

74
0
20
40
60
80
100
120
140
0 50 100 150 200 250 300
Time(min)
Min
or a
xis
( µm
)
minorminorminorminor
Figure 18: Plot of minor axis versus different holding time for sample taken at 57°C
Table 13: Minor axis data for glutamic acid at 57°C
Time (min) Minor axis (µm) Minor axis (µm) Minor axis (µm) Minor axis (µm) 50 75.88738 65.92453 72 95.37726 77.13921 70.79852 120 112.5518 71.52601 71.62971 180 103.6103 87.25769 87.00778 81.78898 210 103.4385 89.25544 90.86617 240 119.9849 104.7087 85.41368
Tabulated data for tests at 63°C are shown in Tables 14, 15 and 16 for the
major axis, 2D area, and minor axis, respectively. Results are shown graphically in
the corresponding Figures 19, 20 and 21. Comparing Figure 19 at 63°C with Figure

75
16 at 57°C, it is clear that there is much less scatter in the data for residence times of
120 minutes or less. Specifically, at 120 minutes and 57°C, the ratio of the largest
average major axis to the smallest average major axis is approximately 1.85. For the
corresponding case at 63°C, this ratio is approximately 1.062. Therefore, the data at
63°C is more reliable for residence times of 120 minutes or less. A similar
improvement can be seen for the minor axis where the ratio at 57°C of 1.57 improves
to 1.25 at 63°C. However, there is little improvement in the area repeatability where
the ratio of the largest average 2D particle area to the smallest average 2D particle
area is compared. After 120 minutes of operating time, the area ratio at 57°C is 1.177
and it is 1.167 at 63°C

76
0
100
200
300
400
500
600
700
800
900
1000
0 50 100 150 200 250 300
Time (min)
Maj
or A
xis
( µm
)
majormajormajor
Figure 19: Plot of major axis versus holding time for sample taken at 63°C Table 14: Major axis data for glutamic acid at 63°C Time (min) Major axis (µm) Major axis (µm) Major axis (µm) 50 598.3825 543.7781 496.313 80 648.8798 642.4966 691.5726 120 716.7409 740.821 761.5259 180 776.4951 728.898 873.1133 210 928.9241 791.3247 890.8976 225 852.4814 726.424 824.6123 240 866.0828 792.1932 885.6026

77
0
10000
20000
30000
40000
50000
60000
70000
0 50 100 150 200 250 300
time (min)
Are
a ( µ
m2 )
area 1area 2area 3
Figure 20: Plot of area versus holding time for sample at 63°C
Table 15: Area data of glutamic acid at 63°C
Time (min) Area (µm2) Area (µm2) Area (µm2) 50 31015.78 23023.76 18417.64 80 40223.24 40339.99 29409.91 120 43815.81 43371.99 37557.32 180 45825.8 39933.85 41434.13 210 59119.67 52330.66 40741.88 225 59257.3 57904.1 38937.55 240 60865.76 66461.97 39958.06

78
0
20
40
60
80
100
120
0 50 100 150 200 250 300
Time (min)
Min
or a
xis(
µm
)
minor 1minor 2minor 3
Figure 21: Plot of minor axis versus holding time for 63°C
Table 16: Minor axis data of glutamic acid at 63°C
Time (min) Minor axis (µm) Minor axis (µm) Minor axis (µm) 50 72.41843 61.25718 53.99261 80 79.87805 84.86349 62.40599 120 85.69912 82.30549 68.84551 180 83.27558 78.94642 70.84307 210 85.42972 95.36911 63.26765 225 97.29741 114.2079 63.82938 240 93.33111 111.4291 65.47786
The shape of the crystals did not change much with increase in holding time.
Figure 22 shows the plot of aspect ratio versus various holding time. It was found
that the aspect ratio was around 10 for all the experiments performed at 63°C at

79
various holding time. This showed that growth was proportionate in both major axis
and minor axis. So, the shape was always needle even when the holding time was
increased from 50 minutes to 240 minutes.
0
2
4
6
8
10
12
14
16
0 50 100 150 200
Time (min)
Asp
ect R
atio
aspect 1aspect 2aspect 3
Figure 22: Plot of aspect ratio versus holding time at 63°C
Since the tests at 63°C were the only ones that seemed reliable, they were
used for estimating the growth rate. As seen in Figure 23 the shift of the peak for the
curves obtained from experimental values is 507 microns corresponding to 50 min to
806 microns corresponding to 100 min. So the growth rate for all the crystals would
fall in the range of 3 to 6 microns/min as the holding time is increased from 50
minutes to 100 minutes. The growth rates were also estimated using an already
existing model that was incorporated into a numerical simulation by Hill (1996). One
difference between this program and other programs is that this program accounted

80
for the needle shape of the β form of the glutamic acid crystals. Specifically, instead
of using the representative diameter of a sphere, the program used the major axis of
the particle with a shape factor. Since the data showed that the aspect ratios at 63°C
varied around 10, this value was used in the simulation. The program was run using
the same parameters as used for the experiment.
0
0.05
0.1
0.15
0.2
0.25
0.3
0.35
0.4
0.45
0 500 1000 1500 2000
Major Axis (µm)
Num
ber F
ract
ion
50100sim50sim100
Figure 23: Comparison of number fraction between the experimental values
and the values obtained from simulation
The model assumed that breakage and agglomeration were negligible. The
growth model used for the simulation was
G(L) = g * Sb (8)
And the rate of nucleation was assumed to be B0 = c * Sm (9) where,

81
G(L) is the growth rate in microns/min g is the growth constant S is the supersaturation in g/liter of solution b is the growth exponent B0 is the rate of nucleation in g/liter of solution c is the nucleation constant m is the nucleation exponent Since it was observed in the experiment that crystals did not appear until the solution
had been at 63°C for 13 minutes, the model was set up to have a 13 minute induction
period before nucleation began.
A trial and error was used to produce simulation results where the PSD peaks
from the simulation are at the same location as those obtained from the experiments.
For this condition, the values of growth constant g and growth exponent b are 0.28
µm/min, and 1.4, respectively. The values for the nucleation constant and exponent
are 5.6E-18 #/liter/min, and 28, respectively.
In all the cases, the number fraction was plotted at the maximum value of a
size interval and the number fraction curve gives the number of particles that fall in
this range of maximum value of size intervals. Both the simulation and experimental
results are shown in Figure 23. The growth rate of glutamic acid obtained from the
simulation varied from 2.53 µm/min at 50 minutes to 0.31 µm/min at 100 minutes.
The nucleation rate varies from 0.7356E02 #/liter/min at 50 minutes to 0.3964E-16
#/liter/min at 100 minutes. This is a significant decrease in the nucleation. However,
as shown in Figure 23, there aren’t any particles smaller than 400 µm after 50

82
minutes of crystallization. This indicates that nucleation has slowed substantially.
Some of the error may be due to the fact that despite the low nucleation rates used in
the simulation, the simulation may still be using higher nucleation rates than those
actually seen in the experiment.

CHAPTER V
CONCLUSION
Experiments were performed with ammonium sulfate, urea and glutamic acid
to investigate crystal growth rate and the effect of processing conditions on crystal
shape.
Ammonium sulfate was very sensitive to the ions present in the water. Even
using ASTM-1 standard deionized water did not yield consistent results, so it was not
possible to measure the growth of ammonium sulfate crystals. It is essential to
measure all the ions present in the water used and the effect of these ions on the
crystallization of ammonium sulphate in order to measure the growth of ammonium
sulphate.
Urea was tried next and urea was not sensitive to impurities. But the growth
rate of urea was much higher. The crystals were much longer even for a solution
saturated at 30.7°C and the sample taken at 28.5°C, 28°C and 27°C. It was hard to go
below that temperature as there was plugging of the reactor. Due to excessive growth
either the crystals broke due to agitation in the reactor or it was hard to take pictures
for analysis. So urea also failed to produce consistent results.
Finally glutamic acid was tried as a third compound in this thesis. Glutamic
acid was also not sensitive to any form of impurity. Instead of changing the cooling
83

84
rate and stirrer speed, the holding time was varied. CSD was measured for various
holding times to determine the crystal growth rate. As seen in the results chapter,
there was a definite increase in the growth of crystals as the residence time was
increased from 50 minutes to 100 minutes. However, beyond 100 minutes there was
some inconsistency in the data obtained. This could be due to the fact that crystals
grew longer with time and started to break, which yielded trimodal distribution for
240 minutes. The same was the case for all the experiments where the sample was
drawn at 57°C. The growth rate of glutamic acid was in the range of 3 to 6
microns/min for a change in holding time from 50 min to 100 min at 63°C. The value
obtained from the simulation varied from 2.53 µm/min at 50 minutes to 0.31 µm/min
at 100 minutes.
The present work on glutamic acid would provide enough preliminary data to
further investigate the growth rate of glutamic acid. In the present work with
glutamic acid, only the holding time was changed keeping all the other operating
parameters constant. In all the cases, rod or needle shaped crystals were obtained;
this is the β form of glutamic acid. The experiments were conducted at 0.5°C/min for
all the experiments. It would be interesting to study the growth at increased cooling
rates at the same saturation temperature to determine whether the β form needles or α
form prismatic crystals are formed.

REFERENCES
Abegg, C. F., J. D. Stevens and M. A. Larson, “Crystal size distributions in continuous crystallizers when growth rate is size dependent,” AIChE J., 14, 1, 118-122 (1968). Bamforth, A. W., “Crystals and crystalliser systems,” The Chemical Engineer, August, 287-288, 455- 457 (1974). Botsaris, G. D., E. G. Denk and J. O. Chua, “Nucleation in an impurity concentration gradient-A new mechanism of secondary nucleation,” In Joseph Estrin (Eds.), “Crystallization from Solution: Nucleation Phenomena in Growing Crystal Systems,” AIChE symposium series, 68, 121, 21-30 (1972). Buffham, B. A., “The size and compactness of particles of arbitrary shape: application to catalyst effectiveness factors,” Chem. Eng. Sci., 55, 5803-5811 (2000).
Cise, M. D., and A. D. Randolph, “Secondary nucleation of potassium sulfate in a continuous flow, seeded crystallizer,” In J. Estrin (Eds.), “Crystallization from Solution: Nucleation Phenomena in Growing Crystal Systems,” AIChE symposium series, 68, 121, 42-56 (1972).
Clontz, N. A., and W. L. McCabe, “Contact nucleation of magnesium sulfate heptahydrate,” In M. A. Larson (Eds.), “Crystallization from Solution: Factors Influencing Size Distribution,” AIChE symposium series, 67, 110, 6-17 (1971). Garside, J., and Mukund B. Shah, “Crystallization kinetics from MSMPR crystallizers,” Ind. Eng. Chem. Proc. Des. Dev., 19, 509-514 (1980).
Genck, W. J., and M. A. Larson, “Temperature effects of growth and nucleation rates in mixed suspension crystallization,” In J. Estrin (Eds.), “Crystallization from Solution: Nucleation Phenomena in Growing Crystal Systems,” AIChE symposium series, 68, 121, 57-66 (1972).
Genck, W. J., “Better growth in batch crystallizers,” Chem. Eng. New York, 107(8), 90-95 (2000).
85

86
Hill, P.J., Simulation of Solids Processes Accounting for Particle Size Distribution, Ph.D. Thesis, University of Massachusetts, Amherst, MA (1996). Kitamura, M., T. Ishizu, “Kinetic effect of L-Phenylalanine on growth process of L-glutamic acid polymorph,” J. Cryst. Growth, 192, 225-235 (1998). Kitamura, M., “Controlling factor of a polymorphism in crystallization process,” J. Cryst. Growth, 237-239, 2205-2214 (2002). Kitamura, M., T. Ishizu, “Growth kinetics and morphological change of polymorphs of L-glutamic acid,” J. Cryst. Growth, 209, 138-145 (2000). Kitamura, M., K. Ikemoto, Y. Kawamura, T. Nakai, “Effect of impurity of Cr3+ on crystal-growth process of ammonium sulfate,” Int. Chem. Eng., 32, 1, 157-163 (1992). Kotz, J. C., and K. F. Purcell, “Chemistry and Chemical Reactivity,” 2nd edition Saunders college, (1991). Kubota, N., M. Yokota, J. W. Mullin, “The combined influence of supersaturation and impurity concentration on crystal growth,” J. Cryst. growth, 212, 480-488 (2000). Larson, M. A., and John W. Mullin, “Crystallization kinetics of ammonium sulphate,” J. Cryst. Growth, 20, 183-191 (1973). Lodaya, K. D., L. E. Lahti, and M. L. Jones, “An investigation in to the nucleation kinetics of urea crystallization in water by means of crystal-size distribution analysis,” Ind. Eng. Chem., Proc. Des. Dev., 16, 3, 294-297 (1977). Maginn, S J., “Characterizing crystal habit and habit modification,” Anal. Proc., 30, 453-454 (1993). Mougin, P., Derek Wilkinson and Kevin J. Roberts, “Insitu measurement of particle size during the crystallization of L-glutamic acid under two polymorphic forms: Influence of crystal habit on ultrasonic attenuation measurements,” Cryst. Growth and Des., 2, 3, 227-234 (2002). Mougin, P., Derek Wilkinson and K. J. Roberts, “Insitu ultrasonic attenuation spectroscopic study of the dynamic evolution of particle size during solution-phase crystallization of urea,” Cryst. Growth and Des., 3, 1, 67-72 (2003). McCabe, W. L., J. C. Smith, P. Harriot, Unit Operations of Chemical Engineering, McGraw-Hill, Inc., New York, 5th edition (1993).

87
Mullin, J. W., Crystallization, Butterworth-Heinemann, Oxford, 4th edition (2001) Mullin. J. W., and J. Nyvlt, “Programmed cooling of batch crystallizers,” Chem. Eng Sci., 26, 369-377 (1971). Mullin, J. W., M. Chakraborty and K. Mehta, “nucleation and growth of ammonium sulphate crystals from aqueous solution,” J. Appl. Chem., 20, December 367-371 (1970).
Pons, M. N., H. Vivier, K. Belaroui, B. Bernard-Michel, F. Cordier, D. Oulhana, J. A. Dodds, “Particle morphology: from visualization to measurement,” Powd. Tech., 103, 44-57 (1999). Pons, M. N., and H. Vivier, “Crystal characterization by quantitative image analysis,” In R. Ramanarayanan, W. Kern, M. Larson, and S. Sikdar (Eds.), “Particle Design via Crystallization,” AIChE symposium series, 87(284), 88-95 (1991).
Price, C. J., “Characterizing crystal habit and perfection: A calibration strategy,” Anal. Proc., 30, 449-450 (1993). Perry, R. H., and D. W. Green, “Perry’s Chemical Engineers Handbook,” McGraw-Hill International editions, New York, 7th edition (1997). Rajesh, N. P., C. K. Lakshmana Perumal, P. Santhana Raghavan, P. Ramasamy, “Effect of urea on metastable zone width, induction time and nucleation parameters of ammonium dihydrogen orthophosphate,” Cryst. Res. Technol., 36, 55-63 (2001). Rouhi, A. M., “The Right stuff-from research and development to the clinic, getting drug crystals right is full of pitfalls,” Chem. Eng. News, 24 (2), 32-34 (2003). Sayan, P., J. Ulrich, “Effect of various impurities on the metastable zone width of boric acid,” Cryst. Res. Technol., 36, 4-5, 411-417 (2001). Seidell, A., “Solubilities of Inorganic and Organic Compounds,” 2nd ed., Van Nostrand, New York, 1928. Seidell, A., “Solubilities of Organic Compounds,” 3rd ed., Van Nostrand, New York, 1941. Strickland-Constable, R. F., “The breeding of crystal nuclei-A review of the subject,” In J. Estrin (Eds.), “Crystallization from Solution: Nucleation Phenomena in Growing Crystal Systems,” AIChE symposium series, 68, 121, 1-7 (1972). Toyokura, K., and K. Ohki, “Size distribution of needle crystals of urea obtained from an MSMPR crystallizer,” Int. chem. Eng., 31, 3, 493-500 (1991).

88
Winn, D., and M. F. Doherty, “A new technique for predicting the shape of solution-grown organic crystals,” AIChE J., 44, 11, 2501-2514 (1998).