effect of plastic money on the financial by evans …
TRANSCRIPT

EFFECT OF PLASTIC MONEY ON THE FINANCIAL
PERFORMANCE OF COMMERCIAL BANKS IN KENYA
BY
EVANS ELIUD WAFULA
D61/71379/2014
A RESEARCH PROJECT SUBMITTED TO THE
UNIVERSITY OF NAIROBI IN PARTIAL FULFILLMENT OF
THE REQUIREMENTS FOR THE AWARD OF MASTER OF
BUSINESS ADMINISTRATION DEGREE DEPARTMENT OF
ACCOUNTING AND FINANCE.
OCTOBER, 2015

DECLARATION
This research project is my original work and has not been submitted for a degree
award in any other university or college.
Signed:…………………………………. Date:………………………………….
Evans Eliud Wafula
D61/71379/2014
This research project has been submitted with my approval as the university
supervisor.
Signed:…………………………………..Date:………………………………….
Prof. Josiah Aduda,
Dean School of Business,
University of Nairobi.
(i)

DEDICATION
This research project is dedicated to my mother, Mary Wafula, who offered
unconditional sacrifice, support and prayer during the course of the entire MBA
programme. Special dedication goes to my family and friends who have always
remained my source of inspiration and desire to excel academically.
(ii)
ACKNOWLEDGEMENT
I feel privileged to have had the opportunity to carry out this study as a demonstration
of knowledge gained during my study for the master’s degree at the University of
Nairobi. I am indebted to various people and organizations without whose material
support or otherwise, this research would not have succeeded. I take this opportunity
to express my sincere gratitude to each of these people. First, I give glory to the
Almighty GOD for the grace He showered unto me and for being with me throughout
the study.
I also want to give special thanks to Professor Josiah Aduda for significant
supervision, advice, encouragement, guidance and mentorship throughout the project.
He kindly read the paper and offered invaluable detailed advice on organization, and
the theme of the paper. Secondly, many thanks to Dr. Kennedy Okiro for moderating
the paper and offering advice and guidelines on the areas that needed smooth lining
and for reproof of the paper, without whose tireless effort the paper wouldn’t come in
this form and format.
Consequently, many thanks to all the other professors who through their lectures
impacted knowledge that made this research report possible. In addition, in my
literature review, I have cited quite a lot of scholarly publications. Some are from
earlier research findings from projects done by other MBA students. I have used
scholarly papers from the wider academia. These are works without which I could not
have had a scholarly insight into this research. Finally, I express utmost gratitude and
special thanks to my family, especially my mother Mary Wafula.
(iii)
ABSTRACT
The study investigated the effect of plastic money on the financial performance of
commercial banks in Kenya, that is; whether plastic money usage increases or
decreases the profitability of commercial banks in Kenya. The outcome of the study
was intended to enable the banking industry to establish the extent of achievement of
the purpose for which plastic money was introduced, and offer information for further
strategy formulation and enhancement to their competitive advantage.
The study adopted descriptive survey research design. Secondary data from the
Central bank annual reports for all commercial banks in Kenya for the period between
2010 and 2014 was used, together with published reports from previous studies in the
same field. Descriptive statistics such as mean score for each variable were calculated.
The analysis involved multiple regression of variables under study that is the financial
performance represented by net profit, number of plastic cards issued by the banks,
number of A.T.M system installations, number of Point of Sale Machines, and
transaction value of plastic cards by the banks. The findings of the study were that
plastic money has a strong and significant effect on the profitability of commercial
banks in the Kenyan banking industry. Thus, there exists positive relationship
between plastic money and bank performance. The significance test showed that the
influence of plastic money on bank profitability was statistically significant meaning
that the combined effect of plastic money in this research is statistically significant in
explaining the profits of commercial banks in Kenya.
The study recommends that commercial banks should revise the commission charged
on plastic cards. This has the end effect of encouraging consumers to increase the
usage of plastic cards. Commercial banks should also collaborate with S.M.E’s to
install ATM/Credit card machines for use by consumers. Banks should also enhance
credit risk management by incorporating high technology to mitigate cases of fraud
and credit loss provisions. Further research needs to be carried out on the relationship
that exists between money and spending, saving or investment patterns. A study
would also be undertaken to show the effects of plastic on money supply.
(iv)
. TABLE OF CONTENTS
DECLARATION…………..…………………………………….………….i
DEDICATION……………………………………………………………..ii
ACKNOWLEDGEMENT………………………………………………….iii
ABSTRACT………………………………………………………………..iv
TABLE OF CONTENTS……………..…………………………………….v
LIST OF TABLES…………………………………………………………viii
LIST OF FIGURES……………………………………………….……….ix
LIST OF ABBREVIATIONS………………………………………...……x
CHAPTER ONE
INTRODUCTION
1.1 Background of the problem……………………………………………..1
1.1.1 Plastic money…………………………………………………………1
1.1.2 Financial performance………………………………….……………..3
1.1.3 The banking industry in Kenya…………………………………..…...4
1.1.4 Effect of plastic money on the financial performance of commercial banks in
Kenya ………………….…............................................................................5
1.2 Statement of the problem…………..…………………………………...6
1.3 Objectives of the study………………………………………………….8
1.4 Significance of the study…………….………………………………….8
CHAPTER TWO-LITERATURE REVIEW
2.1 Introduction…………………………………………………………….10
(v)
2.2 Theoretical Review…………………..………………………………….10
2.2.1 Transaction Cost Theory…………….……………………………....10
2.2.2 The Efficiency Theory…………………………………………….....11
2.2.3 Agency Theory…………………………………………………....…11
2.3 Empirical Review…………………………………………………..….12
2.4 Financial Performance Determinants………………………………….15
2.5 Plastic money……………………………..……………………………16
2.6 Chapter summary………………………………….………….………..18
CHAPTER THREE- RESEARCH METHODOLOGY
3.1 Introduction…………………………………………………………….19
3.2 Research Design…………………………………………………….…..19
3.3 Target Population…………………………………………………….…19
3.4 Sampling Method and Size……………………………………….……..19
3.5 Data Collection………………………………………………………….19
3.6 Data Analysis………………………………………………………..…...20
3.6.1 Analytical Model……………………………………..…………...…..20
CHAPTER FOUR
DATA ANALYSIS AND PRESENTATION OF FINDINGS
4.1 Introduction…………………………………………………………....…22
4.2 Variables………………………………………………………………….22
4.3 Findings…………………………………………………………………...23
4.3.1 Transaction volumes and plastic cards…………………………………23
(vi)
4.3.2 Descriptive statistics………………………………………………24
4.4 Regression analysis……….…………………………………………26
4.5 Summary and interpretation of findings……………………………28
CHAPTER FIVE
SUMMARY, CONCLUSION AND RECOMMENDATIONS
5.1 Summary……………………………………………………………..30
5.2 Conclusion……………………………………………………………31
5.3 Recommendation to policy and practice.……………………………..32
5.4 Limitations of the study………………………………………………34
5.5 Areas for further research……………………………………………..34
REFERENCES………………………………………………………...…i
APPENDIX……………….……………………………............................iv
(vii)

LIST OF TABLES
Table 4.1 Statistics of Variables.......................................................................... 24
Table 4.2 Descriptive Statistics .......................................................................... 25
Table 4.3 Model Summary ..................................................................................26
Table 4.4 ANOVA .............................................................................................. 27
Table 4.5 Coefficients ......................................................................................... 28
(viii)

LIST OF FIGURES
Figure 4.1 Transaction Volumes and Plastic Cards................................................. 23
(ix)

LIST OF ABBREVIATIONS
SWW-Second Word War
CRD- Credit Cards
ATM-Automated Teller Machine
KCB-Kenya Commercial Bank
SCB- Standard Chartered Bank
VIP -Very Important Person
BBK-Barclays Bank of Kenya
E-cash-Electronic Cash
POS- Point of Sale
CBK- Central Bank of Kenya
ICT- Information Communications Technology
MP- Market Power
SME- Small and Medium Enterprises
(x)
CHAPTER ONE
INTRODUCTION
1.1Background of the problem
Plastic money has its roots in the United States of America and its origins can be
traced to the Second World War [SWW]. The evolution of the various types of plastic
money as we know them today already begun with the introduction of the vouchers
system of payment that was used during the Second World War[SWW]. Here in
Kenya the adaption by banks and subsequent use by various consumers has led to the
various plastic monies becoming an integral part of the banking system in Kenya. In
this study the aim is to focus on the manner in which the plastic money has
transformed operations in banks in terms of the revenue that can be attributed to
various forms of plastic money and to answer the question “is plastic money a
necessary evil’’? The various forms of plastic money in Kenya today ranging from
Automated Teller Machine cards to credit cards including connect cards have
definitely had an impact on banks.
A contrast can be drawn between banks that have a wide range of plastic money to
those that have limited or non-existent use of plastic money. Credit and debit card
overdraft loans account for one of the highest rates of consumer debt growth. Credit
card and debit card lending is based on pre-authorized lines of credit that can be
taken down as the consumers take cash or make purchases from merchants who
accept credit cards. Plastic money may be held responsible for inflation, huge
increase in personal indebtedness, the destruction of the basic virtues of thrift
spending and the growth of the acquisitive society. Has this really been good for
commercial banks in Kenya? This study aims to fill the gap begging an answer.
1.1.1 Plastic Money
According to Business Dictionary.com, plastic money is a generic term for all types
of bank cards, credit cards, debit cards, smart cards, Automated Teller Machine cards
and charge cards.
(1)
The term is used predominantly in reference to the hard plastic cards we use every
day in place of actual bank notes. In detail, plastic money refers to plastic cards for
example the credit card. Naim (1995) states that credit card is a contract whereby the
card issuer is committed to credit a certain amount of money for someone who is the
cardholder in order to meet his or her personal purchases from shops that are
associated with the issuer of the card with a contract to accept the fulfillment of
cardholder’s purchases and that is the final settlement after each specified period.
According to (Al- Zubaidi, 2002) credit card was defined as a card that gives the
holder the right to deal with many shops that are consistent with the issuer of the card
to accept the granting of the credit for the cardholder to pay off his purchases, who
will repay the value of purchases to the bank through 25 days from the date of the
purchase. The customer pays no interest to the bank for this service if the payment
was done during the period but if he or she bears an interest of 1.5% on the remaining
balance without a payment, the seller earns a commission of between 3-5% from the
seller of the total value of the invoice.
The Automated Teller Machines (A.T.M), works in conjunction with plastic cards.
A.T.M is an Electro-mechanical device that permits authorized users, typically using
machine-readable plastic cards (ATM cards) to withdraw cash from their accounts
and/or access other services, such as balance enquiries, transfer of funds or acceptance
of deposits. ATMs may be operated either on-line with real-time access to an
authorization database or off-line. Another type of plastic money is the smart card.
These store personal, medical and financial information within a computer chip
implanted in the card. The financial information may contain a section that will hold a
certain shilling value that can be reduced by use, like a debit or charge card, in POS or
ATMs. The ATM can re-charge the amount available as the account balances
increase. (http://www.plastic-cards/stale)
(2)

1.1.2 Financial Performance
Financial performance is a subjective measure of how well a firm can use assets from
its primary mode of business and generate revenues. This term is also used as a
general measure of a firm's overall financial health over a given period of time, and
can be used to compare similar firms across the same industry or to compare
industries or sectors in aggregation. Some useful measures of financial performance
are coined into what is referred to as CAMEL. The acronym "CAMEL" refers to the
five components of a bank's condition that are assessed: Capital adequacy, Asset
quality, Management, Earnings, and Liquidity. A sixth component, a bank's
sensitivity to market risk was added in 1997; hence the acronym was changed to
CAMELS,(Gilbert, Meyer and Vaughan 2000).
One of the benefits banks derive from electronic banking products and service
delivery for example the use of credit cards, debit cards, A.T.M cards, is improved
efficiency and effectiveness of their operations so that more transactions can be
processed faster and most conveniently, which will undoubtedly impact significantly
on the overall performance of the banks. Despite the potential benefits of ICT and e-
commerce, there is debate about whether and how their adoption improves bank
performance. There are positive impacts of e-banking on bank turnover and
profitability and to a lesser extent on employment, most notably when e-commerce is
part of larger business strategies of bank. The use of plastic money can contribute to
improved bank performance, in terms of increased market share, expanded product
range, customized products and better response to client demand. It continues to
influence banks activities and their income structure. Among the activities that may
be subject to stronger pressures for change are those that, up to today, have remained
relatively insulated from ICT developments. This applies mainly to some retail
banking activities that are suitable for standardization, and also to developments in
remote banking Kariuki, ( 2005).
(3)

1.1.3 The Banking Industry In Kenya
According to the Central Bank of Kenya annual report as at 31st December 2012, the
banking sector consisted of the Central Bank of Kenya, as the regulatory authority, 44
banking institutions (43 commercial banks and 1 mortgage finance company -MFC),
5 representative offices of foreign banks, 8 Deposit-Taking Microfinance Institutions
(DTMs), 2 Credit Reference Bureaus (CRBs) and 112 Forex Bureaus. Out of the 44
banking institutions, 31 locally owned banks comprise 3 with public shareholding and
28 privately owned while 13 are foreign owned. The 8 DTMs, 2 CRBs and 112 forex
bureaus are privately owned. The foreign owned financial institutions comprise of 9
locally incorporated foreign banks and 4 branches of foreign incorporated banks. As
indicated in the CBK reports, local banks dominate Kenyan banking sector in terms of
numbers, and account for 66.6% of the sectors total net assets, while foreign owned
banks account for 33.4%.(Market intelligence, 2005).
In Kenya, The Companies Act, the Banking Act, the Central Bank of Kenya Act and
the various prudential guidelines issued by the Central Bank of Kenya (CBK), govern
the banking industry. The banking sector was liberalized in 1995 and exchange
controls lifted. The CBK is responsible for formulating and implementing monetary
policy and fostering the liquidity, solvency and proper functioning of the financial
system. The CBK publishes information on Kenya’s commercial banks and non-bank
financial institutions, interest rates and other publications and guidelines. The
commercial banks have come together under the Kenya Bankers Association (KBA),
which serves as a lobby for the commercial banks’ interests and addresses issues
affecting its members (Kenya Bankers Association Annual Report, 2008).
Any development initiative from the commercial banks requires the endorsement of
the monetary authority, CBK. Key developments emerging from Kenyan commercial
banks include Free ATM Usage by BBK in 2010, Diva Account by SCB in 2007, and
launch of Islamic products by BBK in 2005 among others. Looking at commercial
banks in Kenya, they have exponentially embraced the use of information and
Communication Technologies which plastic money is dependent on, both in their
service provision and as a strategy to ensure their survival.
(4)

They have invested huge amounts in implementing the self and virtual banking
services with the objective of improving quality of customer service. Digital-based
financial services have made significant contribution in covering the cost of offering
financial services. As the banking fraternity continues to make forays into the retail
segment of the market, it is becoming more paramount that customers must be given
value for their hard earned deposits.(Market intelligence, 2005).
1.1.4 Effect of Plastic Money on The Financial Performance of
Commercial Banks In Kenya
According to Padwal 1995, commercial banks assaulted by the pressure of
globalization and competition from non-banking functions must find new ways to add
value to the services. The question “what drives performance?” is at the top in
understanding superior performance and hence striving for it. Substantial research
efforts have gone into addressing this question, starting from the strategic level and
going down to operational details. Banking is no longer regarded as a business
dealing with money transaction alone, but it also seems as a business related to
information on financial transaction. Several innovative services such as Automated
Teller Machines (ATM), Internet banking, Smart cards, Credit Cards, Mobile
banking, Phone banking, Anywhere-Anytime banking have provided a number of
convenient services to the customer so as the service quality improves, the probability
of customer satisfaction increases. Increase in customer satisfaction in turn increases
the mutual understanding, customer retention and a bond of trust between the
customer and bank. The banks which are providing these services at large extent to
customers are more reputed in the eyes of customers. But at the same time technology
based product is different in public and private sector banks.
(5)
Plastic money is an improvement over traditional banking system because it has
reduced the cost of transaction processing, improved the payment efficiency, financial
services and the banker-customer relationship. (Sathye, 1999).
Adoption of plastic money leads banks providing for bad debts, this is because there
is no clear framework in Kenya to follow up credit card defaulters thus some
customers take advantage on this. It also leads to fraud in card business. Fraudsters
come up with counterfeit cards whereby sometimes they successfully manage to steal
from the banks. Issuers rather than individual cardholders bear the initial cost of
fraud. (A.F. Cook - 1990) An example of a fraud is the “Salami technique.” This
involves the slicing of small amounts of money from a computerized transaction or
account. The sliced amounts are then re-routed to the perpetrators accounts If
computer hackers or other criminals were to break into ATMs machines, they could
instantaneously filch the electronic wealth of thousands or even millions of innocent
consumers. (Information Systems and Audit Control Association – 2005).
1.2 Statement of the problem
A relationship exists between plastic money and the financial performance of
commercial banks in Kenya. Banks have received plastic money as an opportunity to
boost performance. According to the US based Business Weekly money can boost a
bank’s earnings by up to14%. Several researchers agree that commercial banks have
promoted the use of plastic money because it overcomes the following problems:
For a long time banks have been characterized by long queues in the banking hall.
This has been costly in terms of time spent to serve a customer and also cost incurred
for hiring Tellers to handle the large numbers. The unfriendly requirement that
individuals only bank at their branches limited individuals’ access to their cash and
other facilities thus denying banks interest income.
(6)

The lack of direct interconnectivity between banks and other retail outlets denied
banks an opportunity to expand customer base through electronic fund transfer. Costs
associated with wear and tear of notes and coins have led to additional expenditure to
Central Bank in printing new notes and coins over the years. Plastic money usage is
expected to increase the profitability of commercial banks, as the plastic card is a very
convenient mode of purchasing goods and very acceptable mode of payment in
merchant outlets hence more profits to the banks through the interchange fees paid by
the merchants, late payment charges to the customers, annual fees, card renewal fees
and the interest charges to the customers.
Recent local studies relating to this research include; Odhiambo (2012) did a research
on credit cards and performance of commercial banks portfolio in Kenya and
particularly Migori town. The study sought to determine the relationship between
adoption of credit cards and credit card holder’s satisfaction and to establish whether
adoption of credit cards has improved commercial banks performance. The results
showed that credit cards have contributed positively to satisfaction of credit card
holders and adoption of credit cards improved commercial banks revenue. This was a
more specific study hence the need to carry out study on the effect of all plastic
money on the financial performance of all commercial banks in Kenya. According to
Fransiscar Kyalo, 2014, in her study on effect of credit card usage on financial
performance of banks, she found that there was 0.612 coefficient of determination
between credit card usage and performance of commercial banks in Kenya. She
recommends that commercial banks should revise the interest rates charged on credit
cards to boost credit card usage. This was a more specific study hence the need to
carry out study on the effect of all plastic money on the financial performance of
commercial banks in Kenya. Hannington Odhiambo (2013) of The University of
Nairobi M.B.A project found that e-banking including credit and debit cards, and
A.T.M cards has a strong effect on the profitability of commercial banks in Kenya. He
found statistical significance between e-banking and profitability. Highly profitable
banks adapted quickly to innovations, thus recommendation to management to adapt
quickly to e-banking. Odhiambo, H (2013). The effect of electronic banking on
financial performance of commercial banks in Kenya.
(7)
Though related to the topic of study, this was an umbrella coverage hence the need for
specific study in relation to effect of plastic money on the financial performance of
commercial banks. Kariuki Joan of The University of Nairobi, in her M.B.A Project
research, finds that new product development impacts positively on the financial
performance of commercial banks in Kenya. However, there was no statistical
significance to her findings and she recommends further research. Wanjiru, J.K
(2012). The effect of product development on the financial performance of
commercial banks in Kenya.
It is in light of the above problems that this study attempts to underscore the
important roles that plastic money has played in boosting banks’ performance in
Kenya. What is the effect of plastic money on the financial performance of
commercial banks in Kenya? This study seeks to answer the questions of whether
plastic money has had a positive impact or negative one on the aspect of growth in
relation to commercial banks. This study attempts to answer the research question: To
what extent has the adoption of plastic money boosted commercial banks’ earnings in
Kenya?
1.3 Objectives of the study
The main objective is to determine the impact of plastic money on the financial
performance of commercial Banks in Kenya. The research objective is to establish the
extent to which the adoption of plastic money has boosted commercial banks’
earnings in Kenya.
1.4 Significance of the study
This study will enable the banking industry to establish the extent of achievement of
the purpose for which plastic money was introduced and offer information for further
strategy formulation and enhancement to their competitive advantage.
This study may enable other service industries to see the effects of strategy
formulation and implementation to the challenges brought about by changes in the
environment they operate. It may also encourage the adoption of plastic money within
their setting.
(8)

To scholars, this study will provide another practical example on the effect of
formulation of strategy marketing plan and their implementation to meet the
challenges they face from the changing environmental factors as they pursue their
objectives. It will also generate and allow for formulation of specific hypothesis and
thereby offer them basis for further research.
This study will benefit management consultants as they ponder on development of
tools for management and quantification of the impact of plastic money.
(9)

CHAPTER TWO-LITERATURE REVIEW
2.1 Introduction
This section discusses literature on plastic money theories and empirical findings on
the effect of plastic money on the financial performance of commercial banks in
Kenya. The chapter reviews the various studies that are relevant to plastic money
usage and commercial banks performance. It also presents the relevant theories that
explain the plastic money usage and organizational performance.
2.2 Theoretical Review
2.2.1 Transaction Cost Theory
This was developed by Schwartz (1974) and it states that suppliers may have an
advantage over the lenders in checking the real financial position or the credit
worthiness of the clients. In relation to plastic money and specifically the credit card
usage, the bank is in better position to know the credit worthiness of a cardholder by
evaluating the six months statements and the pay slip at the point of application of a
credit card. The bank can also decide to review the credit limit of the cardholder by
assessing how the customer has been using the credit card and how the customer has
been making the payment. Trade credit may reduce the transaction costs of paying
bills, according to Ferris (1981).
Rather than paying bills every time goods are delivered, a buyer might want to
cumulate obligations and pay them only monthly or quarterly. This will also enable an
organization to separate the payment cycles from the delivery schedules. There may
be strong seasonality in consumption patterns for a firm’s products. In order to
maintain smooth production cycles, the firm may have to build up large inventories.
This has two costs: the cost of warehousing the inventory and the costs of financing it.
The firm could lower the prices in order to affect early sales but there could be menu
costs in doing this as well as a loss in discretionary ability. By offering trade credit
selectively, both across customers and over time, the firm may be able to manage its
inventory position better (Emery 1987).
(10)
In relation to plastic money, different card products in the bank are due for payment in
different dates during the month. This will make the customer choose a card product
which is convenient as far as making payments is concerned. The bank will divide the
payment cycles within the course of the month so as to utilize the available funds
from the customer.
2.2.2 The Efficiency Theory
Anthanasoglou et .al. (2006) came up with the efficiency hypothesis which posits that
banks earn high profits because they are more efficient than others. There are two
distinct approaches within the efficiency; the X- efficiency and Scale-efficiency
hypothesis. According to the X-efficiency approach more efficient firms are more
profitable because of their lower costs. Such firms tend to gain large market shares
which may manifest in higher levels on market concentration but without any casual
relationship from concentration to profitability .The scale approach emphasizes
economies of scale rather than differences in management or production technology.
Large firms can obtain lower unit cost and higher profits through economies of scale.
This enables firms to acquire large market share which may manifest in higher
concentration and then profitability
In relation to plastic money, firms that adopt plastic money and use it appropriately
will benefit greatly from the large market share which comes about as a result of
higher market concentration.
2.2.3 Agency Theory
According to Jensen and Meckling (1976) described the agency relationship as a
contract in which a person (principal) hires a second person, the agent, to perform an
action. The principal will delegate the decision making authority to the agent. Jensen
and Meckling (1976) began by assuming that each party to the contract consistently
chooses those actions that are likely to satisfy their own interest. Although an agent’s
motivation may include the desire to work hard to achieve the principal’s goals, he
may also be motivated by desire to maintain the prestige or perquisites associated
with the job.
(11)
For the case of plastic money usage, the bank is the principal and the plastic
cardholder is the agent. The bank expects the cardholder to make use of the card
properly making purchases using the card and repaying it on time. This is because it
will be the way the bank can increase the asset levels through the commission they are
paid by the merchants and the interest the cardholder pays at the end of the month.
The cardholder also expects the bank to advise him/ her on any changes done on the
card terms, making sure that the card can be used and that it is properly maintained.
2.3 Review of empirical studies
Several empirical studies have been conducted concerning plastic money usage and
the performance of commercial banks. In Kenya, the first general charge card was
launched in 1967 by the Diners Africa Ltd. Ten years later, commercial bank of
Africa launched the VIP check guarantee card. However plastic money in Kenya is
considered to have reached the take off stage after mid 1998s, when banks and non –
bank companies launched different types of cards. In June 1985 allied cards Ltd
launched a general charge card called senator. In 1986 the merchant card was
launched. In September K.C.B launched its cheque guaranteed card .In the same
month the standard launched guarantee service charge and was introduced into the
money card market. Barclays launched its VIP cheque guarantee scheme in October
1987. Royal edit ad introduced a general snatch card and a credit card in 1989 namely
the royal card and the royal credit respectively. In 1990 BBK launched a general
charge card, the Barclay card. During this same period several private cards were
launched. Professor Aosa, (1992)
Total Oil and Esso fuel cards were introduced in 1987 managed by Diners club .In the
same year shell and B.P cards were introduced managed by allied cards. The Caltex
star card fuel cards for Caltex petrol were launched in 1989 managed by Royal Card
Company developed world. This rapid growth of card companies shows that plastic
money spending is a fast growing trend in Kenya. An increasing number of middle
and high income sophisticated and affluent Kenyans find it safer, convenient and
more prestigious to use plastic money rather than cash. It is regarded today as a sign
of individual and corporate success.
(12)

Initially the pioneer banks installed them as part of their strategic moves towards
obtaining sustainable advantage over their competitors. It was to enable them achieve
their objective of profit maximization. Professor Aosa, (1992)
Edith Cowan University of California Los-Angeles studied the impact of cards on
banking operations. Her study revolved around the smoothing of operations by plastic
cards to banks. Her findings indicated a reduction in the number of teller transactions
as well as improved efficiency in overall banking operations, illustrated by lower
costs incurred in transactions.
According to Douglas Wood (Manchester Business School 2003), he summarized
revenue streams for card issuers. He said that card profitability comprises seven
potential sources of income; annual card fees charged to card holders, cash
withdrawal fees, income from interest charged on outstanding balances which are
rolled over, income from proceeds emerging from the use of the card abroad,
commissions received from acquiring banks (interchange income) and other sources
of income such as printing additional statements. These potential income sources
emphasize the fact that plastic money has a positive impact on profitability of banks.
According to Graham Reginald 2001, most new card entrants have experienced high
level of customer disloyalty because once the introductory offer ended customers
switched to other issuers. But even with a flood of new entrants during the 1990s
Barclay card kept its defection at below 5% per annum. Defection rates for
established participants were low thanks to the inertia of bank customers, which was
historically high. Even for credit cards were the formalities of changing suppliers as
minimal customer retention rates were also high historically.
Muriu (2007) conducted a study on a survey of challenges facing the growth of plastic
credit and debit cards in Kenya. A sample of 30 cardholders was taken. Data analysis
method used was content analysis for the cardholders and qualitative analysis for card
issuer manager. The study found out that marketing is limited for example products
like the credit card are not a mass product. Vetting of new entrants in the credit card is
very restrictive.
(13)
The study also found out that customers do not apply for credit cards because they
fear debt, some are risk averse and others fear fraud for both credit and debit cards .
Mutua (2010) carried out a study on the key success factors and bank strategy in the
credit card industry: a survey of commercial banks issuing credit cards in Kenya. He
studied 12 commercial banks. The research used primary sources of data since the
objective was to identify the perception of commercial banks issuing credit cards on
key success factors and establish the extent to which they have a related strategy for
factors identified. Descriptive statistics were used to transform the data collected into
standard form for relative comparison. The study found out that the key success
factors that were very important in influencing customer use of bank products and
service were service quality, technology, marketing, human resources, pricing,
finance and research and development.
Makio (2010) conducted a survey on the factors affecting the use of credit cards: a
case study of Post bank employees. Data was obtained from 23 staff from other
departments and from post bank card Centre. Data collection was facilitated through a
questionnaire and the respondents were made up of 52% male and 48% female. The
study found out that top management has credit cards while majority of middle
management and lower management do not have credit cards. The survey also found
out that factors affecting the use of credit cards were credit card fraud, awareness
creation, complaints on the predetermined issues like merchant service commissions
fees and the credit card system in the bank among many other factors.
Kibe (2013) carried out a study on the effect of credit card default on the financial
performance of the Kenya Commercial Bank. The independent variables were number
of accounts closed, non-performing loan and bad debts written off and the depended
variables were Earnings per Share, Dividends per Share, Loans to customers, total
assets and customer deposits. The research findings were that Gold card holders are
the majority of the cardholders in KCB at 56%. Further majority of the cardholders
are men with a proportion of 53% and women 47%. In terms of revenue, although
gold card has the highest number of card holders (56), it only contributes 33% of the
revenue collected through credit cards. In terms of credit card default, 100% of all the
holders of local credit cards are defaulters.
(14)

This research concluded that the proportions of credit card holders, revenue collected
as well as the amounts and proportion defaults from credit cards vary between
different types of cards.
Over the period of 1991 and 2001 the volume of credit card transactions grew by 9%
per annum while debit card transactions grew by 31% in the United Kingdom.
Outstanding balances on the other hand tripled between 1993 and 2001. (Bernado
Batiz-Lazo, London South Bank University).
2.4 Financial Performance
Performance is the outcome of all the organization’s operations and strategies
(Wheelen & Hunger, 2002). Organization’s performance is very essential to
management as it is an outcome which has been achieved by an individual or a group
of individuals in an organization related to its authority and responsibility in achieving
the goal legally and conforming to the morale and ethic. Financial performance
emphasizes on variables related directly to financial report. Company’s performance
is evaluated in three dimensions: company’s productivity of processing inputs into
outputs efficiently; profitability dimension or the level at which the company’s
earnings are bigger than its costs and market premium dimension or the level of which
company’s market value is exceeding its book value (Walker,2001). A study was
conducted by Joseph (2013) on determinants of organizational performance by tier
three commercial banks in Kenya where he listed the below factors:
The first is Corporate Governance. Christopher (2009) stated that proper governance
of companies would become as crucial to the world economy as the proper
governance of countries and will converge in associated issues of competitiveness,
corporate citizenship, social and environmental responsibility. The governance of
banks becomes even more pronounced considering their role of financial
intermediation in developing economies. Commercial banks are the main providers of
funds to enterprise and where there is a thin or absent capital market, their failure
becomes the failure of the system.
(15)
Sanda, Mikailu and Garba (2005) examined the relationship between banks ownership
and several governance aspects and found out that increasing ownership stakes for
hired managers and board improves banks performance.
Another determinant of financial performance is technological advancement .Today’s
business environment is very dynamic and experiences rapid changes as a result of
creativity, innovation, technological changes, increased awareness and demands from
customers (Woherem,2006). Business organizations especially the banking industry
of the 21st century operates in a complex and competitive environment characterized
by the changing conditions and highly unpredictable economic climate with
Information and Communication Technology (ICT) is at the center of this global
change curve. Abroad opening has been experienced around the world for banks and
they are currently taking due advantage of these innovations to provide improved
customer services in the face of competition and faster services that enhance
productivity (Ovia ,2005).
Firm Size is yet another determinant of financial performance. If the relative size of
the firm expands, its market power and profit increases. This is the Market- Power
(MP) hypothesis. The hypothesis is also referred to as the Structure- Conduct-
Performance (SCP) hypothesis (Athanasonglouet al., 2008). It has been argued that
the effect of growing size on the bank profitability is significantly positive to a large
extent (Smirlock, 2005). Smirklock (2005) further suggested that the difference in
profitability among large and small banks is due to production technologies and
outputs, which vary across them. The relative efficiency hypothesis (Clarke et al.,
2004) presupposes that larger banks (where size is measured by assets) are more
efficient than smaller ones, and are more profitable as a result of this superior
efficiency.
2.5 Plastic Money
Automated Teller Machine (A.T.M) is an electro-mechanical device that permits
authorized users, typically using machine-readable plastic cards (ATM cards) to
withdraw cash from their accounts and/or access other services, such as balance
enquiries, transfer of funds or acceptance of deposits.
(16)

ATMs maybe operated either on-line with real-time access to an authorization
database or off-line. . (www.plastic-cards/stale)
Credit card is a card indicating that the holder has been granted a line of credit. It
enables him to make purchases and/or draw cash up to a pre-arranged ceiling; the
credit granted can be settled in full by the end of a specified period or can be settled in
part, with the balance taken as extended credit. Interest is charged on the amount of
any extended credit and the holder is sometimes charged an annual fee. (www.plastic-
cards/stale)
Debit Card is a card enabling the holder to have his purchases directly charged to
funds on his account at a deposit taking institution (may sometimes be combined with
another function, e.g. that of a cash card or cheque guarantee card) Today the
purchasing of goods and services is fueled by the ready availability of plastic money.
Charge card is a form of plastic money whereby the holder is allowed an overdraft by
the bank on condition of paying the balance in thirty days. This type of credit is one of
the oldest forms. Actually the roots go back to the general store days when town
people would maintain a charge or tab until their crops or livestock were sold at
season end.
Smart cards store personal, medical and financial information within a computer chip
implanted in the card. The financial information may contain a section that will hold a
certain shilling value that can be reduced by use, like a debit or charge card, in POS or
ATMs. The ATM can re-charge the amount available as the account balances
increase. (http://www.plastic-cards/stale)
A point of sale (POS) terminal is an electronic machine used to process cards for
payment of goods and services. The system typically includes a cash register;
computer, monitor, cash drawer, receipt printer, customer display and barcode
scanner, and a debit or credit card reader. (www.techopedia.com)
(17)
2.6 Chapter summery
In conclusion of this review it can be said that the key issue in implementation of
plastic money as an additional product to the bank is the satisfaction of their
paramount objective of profit maximization. Failure to satisfy this would lead to
rejection, inconsistency in adoption and usage of plastic money and the lack of
involvement by other industry players like financial institutions, other service
providers and customers in these innovations. If fulfilled banks would quickly adopt
and will continuously and frequently use it. This we assume would have a positive
impact to the banks i.e. increase in revenue, which would mean increased
profitability.
(18)
CHAPTER THREE-RESEARCH METHODOLOGY
3.1 Introduction
This chapter contains the methodology that was used to conduct the research. It
describes the research design, the target population, sample, and data collection and
how the data analysis was done.
3.2 Research design
This study used descriptive survey research design. Lavrakas (2008) describes a
descriptive survey research design as a systematic research method for collecting data
from a representative sample of individuals using instruments composed of closed
ended and/or open-ended questions, observations, and interviews. It is one of the most
widely used non-experimental research designs across disciplines to collect large
amounts of survey data from a representative sample of individuals sampled from the
targeted population.
3.3 Target population
According to Mugenda and Mugenda (1999), a population is a complete set of
individuals, cases or objects with some common observable characteristics. The
population of the study consisted of all commercial banks in Kenya, forty four (44),
involved in plastic money use, hence a census, the objective being to determine
whether the use of plastic money by the Kenyan banks has boosted their profitability.
3.4 Data collection
The data collection was secondary involving published results of previous studies in
the same field, and the Central Bank of Kenya journals and financial statements of
various banks was also researched. The data collected covered the period 2010 to
2014.
(19)

3.5 Data analysis
This section specifies technique in data collection. Data analysis is the process of
packaging the collected information in a form that can be understood by the person
who is doing the research. Before analyzing the data it was first edited, coded and
entered into excel worksheet, where the researcher used descriptive statistics and
regression analysis to analyze the data. This was to ensure accuracy of the data.
Frequency tables and charts were used to present the results for easier understanding
and interpretation. Thus the study generated both qualitative and quantitative data
3.5.1 Analytical Model
The regression model to be evaluated is:
Y = Bo + B1X1+ B2X2 + B3X3 + B4X4 + E
Where:
Y = Financial performance of commercial banks represented by net profit
Bo = The constant
B = The correlated volatility of estimated value of Y
X1 = Number of plastic cards issued by banks
X2 = Number of A.T.Ms system installations
X3 = Number of P.O.S machines
X4 = Transaction value of plastic cards by the banks
E = Error term
The multivariate regression model was used to find the value of Bo and B which
explains the relationship between the dependent and the independent variables.
(20)

Under this model, the dependent variable was financial performance which was
measured using profitability. The independent variables were; number of plastic cards
issued by banks, number of A.T.M system installations, number of P.O.S machines,
and the usage level of plastic cards by customers; measured by transaction value of
plastic cards by the banks.
(21)

CHAPTER FOUR
DATA ANALYSIS AND PRESENTATION OF FINDINGS
4.1 Introduction
This chapter addresses the data analysis and research findings on the effect of plastic
money on the financial performance of commercial banks in Kenya and includes
research variables, descriptive statistics, tables and regression analysis. The data was
collected from secondary sources which were the financial statements and CBK
annual reports for the years 2010 to 2014. The data was analyzed using Microsoft
Excel 2010 and SPSS.
4.2. Variables
There were two variables in the study which included the independent variables and
the dependent variable. The dependent variable is the financial performance
represented by profitability (net profit). The independent variables of plastic money
on the financial performance of commercial banks in Kenya was measured by the
number of debit cards/credit cards, prepaid cards/charge cards/ATM cards issued by
banks, number of ATMS systems installed by the banks, number of point of sale
terminals and the transaction value of plastic cards by the banks.
(22)
4.3 Findings
4.3.1 Transaction Volumes and Plastic Cards
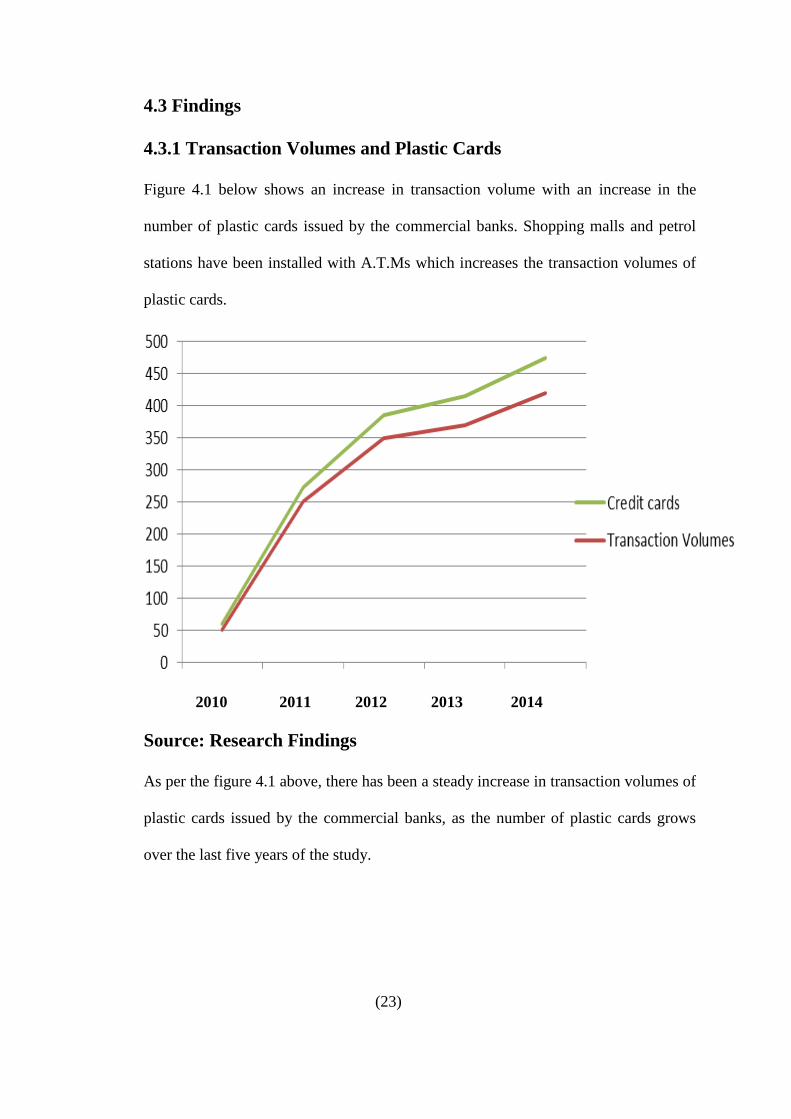
Figure 4.1 below shows an increase in transaction volume with an increase in the
number of plastic cards issued by the commercial banks. Shopping malls and petrol
stations have been installed with A.T.Ms which increases the transaction volumes of
plastic cards.
2010 2011 2012 2013 2014
Source: Research Findings
As per the figure 4.1 above, there has been a steady increase in transaction volumes of
plastic cards issued by the commercial banks, as the number of plastic cards grows
over the last five years of the study.
(23)
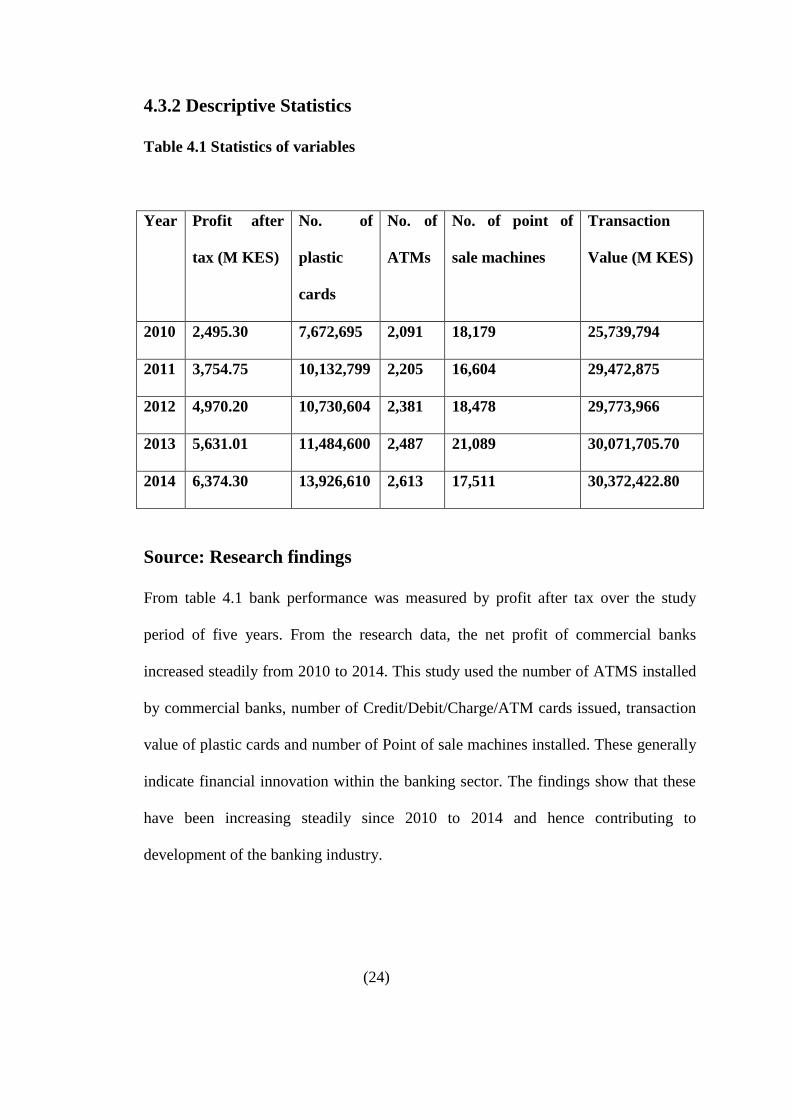
4.3.2 Descriptive Statistics
Table 4.1 Statistics of variables
Year Profit after
tax (M KES)
No. of
plastic
cards
No. of
ATMs
No. of point of
sale machines
Transaction
Value (M KES)
2010 2,495.30 7,672,695 2,091 18,179 25,739,794
2011 3,754.75 10,132,799 2,205 16,604 29,472,875
2012 4,970.20 10,730,604 2,381 18,478 29,773,966
2013 5,631.01 11,484,600 2,487 21,089 30,071,705.70
2014 6,374.30 13,926,610 2,613 17,511 30,372,422.80
Source: Research findings
From table 4.1 bank performance was measured by profit after tax over the study
period of five years. From the research data, the net profit of commercial banks
increased steadily from 2010 to 2014. This study used the number of ATMS installed
by commercial banks, number of Credit/Debit/Charge/ATM cards issued, transaction
value of plastic cards and number of Point of sale machines installed. These generally
indicate financial innovation within the banking sector. The findings show that these
have been increasing steadily since 2010 to 2014 and hence contributing to
development of the banking industry.
(24)
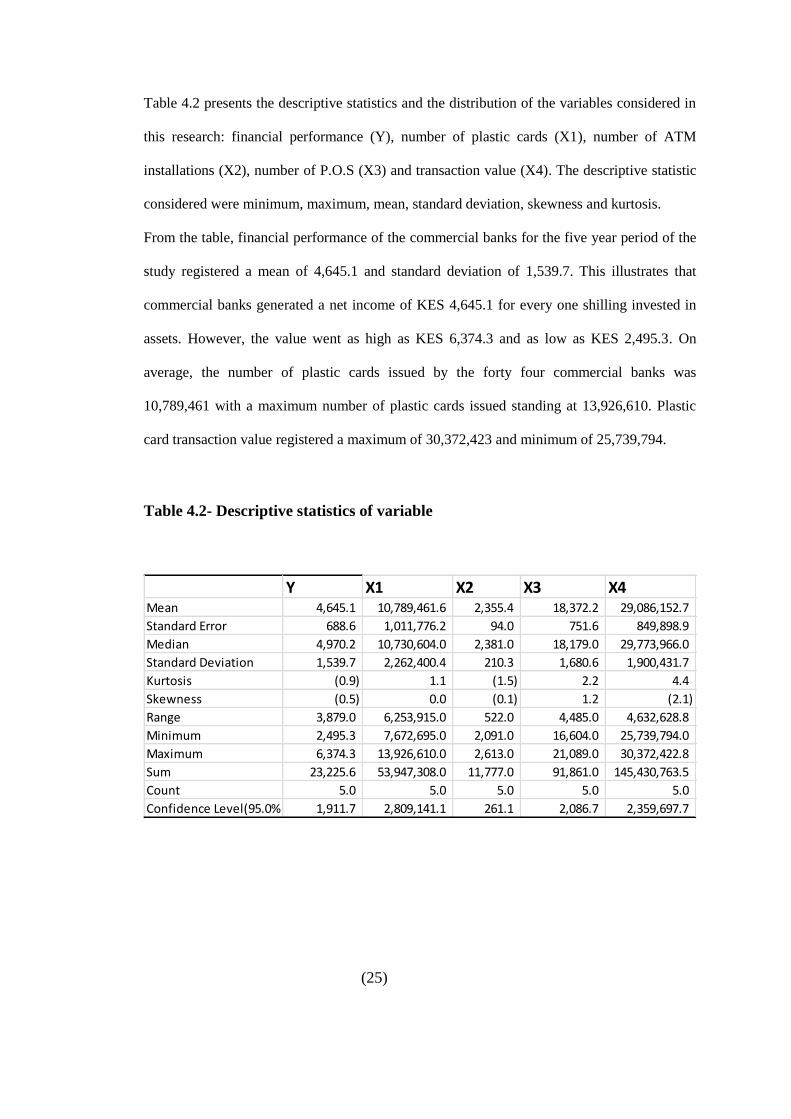
Table 4.2 presents the descriptive statistics and the distribution of the variables considered in
this research: financial performance (Y), number of plastic cards (X1), number of ATM
installations (X2), number of P.O.S (X3) and transaction value (X4). The descriptive statistic
considered were minimum, maximum, mean, standard deviation, skewness and kurtosis.
From the table, financial performance of the commercial banks for the five year period of the
study registered a mean of 4,645.1 and standard deviation of 1,539.7. This illustrates that
commercial banks generated a net income of KES 4,645.1 for every one shilling invested in
assets. However, the value went as high as KES 6,374.3 and as low as KES 2,495.3. On
average, the number of plastic cards issued by the forty four commercial banks was
10,789,461 with a maximum number of plastic cards issued standing at 13,926,610. Plastic
card transaction value registered a maximum of 30,372,423 and minimum of 25,739,794.
Table 4.2- Descriptive statistics of variable
(25)
Y X1 X2 X3 X4Mean 4,645.1 10,789,461.6 2,355.4 18,372.2 29,086,152.7
Standard Error 688.6 1,011,776.2 94.0 751.6 849,898.9
Median 4,970.2 10,730,604.0 2,381.0 18,179.0 29,773,966.0
Standard Deviation 1,539.7 2,262,400.4 210.3 1,680.6 1,900,431.7
Kurtosis (0.9) 1.1 (1.5) 2.2 4.4
Skewness (0.5) 0.0 (0.1) 1.2 (2.1)
Range 3,879.0 6,253,915.0 522.0 4,485.0 4,632,628.8
Minimum 2,495.3 7,672,695.0 2,091.0 16,604.0 25,739,794.0
Maximum 6,374.3 13,926,610.0 2,613.0 21,089.0 30,372,422.8
Sum 23,225.6 53,947,308.0 11,777.0 91,861.0 145,430,763.5
Count 5.0 5.0 5.0 5.0 5.0
Confidence Level(95.0%) 1,911.7 2,809,141.1 261.1 2,086.7 2,359,697.7

4.4 Regression Analysis
Regression method helped to estimate the unknown dependent variable with the help
of several known independent variables.
Table 4.3 Model Summary
Model
R
R Square
Adjusted R
Square
1
0.999
0.9801
65535
Source: Research Findings
Predictors: (Constant), Number of Debit cards/Credit cards/ATM cards/Charge cards
issued by banks, Number of POS terminals installed, Number of ATMs installed by
banks, usage level of plastic cards by customers; measured by transaction value.
Dependent Variable: Profit after tax
Table 4.3 presents the coefficients of model fitness on how plastic money explains
bank profitability .The profitability has an overall correlation with plastic money of
0.9801 which is strong and positive. This means that approximately 98% variations
from profitability are explained by the plastic money variables at 5% level of
significance. The residual, 2%, of the variation is explained by other independent
variables not included in the model and the random error term. These indicate good fit
of the regression equation used.
(26)
Therefore, this is a good indication of the true position that bank performance can be
explained by the number of ATMs installed, number of debit cards/credit cards/charge
cards and ATM cards issued to customers, number of POSs installed, and transaction
value of plastic cards.
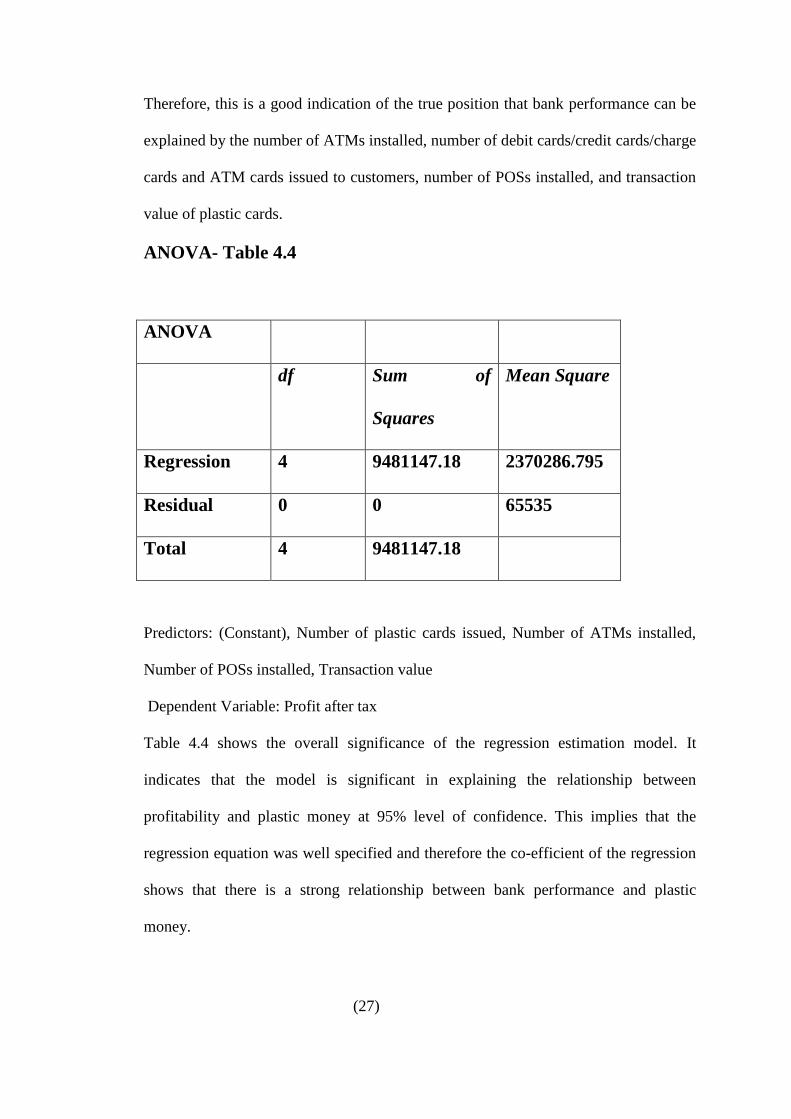
ANOVA- Table 4.4
ANOVA
df Sum of
Squares
Mean Square
Regression 4 9481147.18 2370286.795
Residual 0 0 65535
Total 4 9481147.18
Predictors: (Constant), Number of plastic cards issued, Number of ATMs installed,
Number of POSs installed, Transaction value
Dependent Variable: Profit after tax
Table 4.4 shows the overall significance of the regression estimation model. It
indicates that the model is significant in explaining the relationship between
profitability and plastic money at 95% level of confidence. This implies that the
regression equation was well specified and therefore the co-efficient of the regression
shows that there is a strong relationship between bank performance and plastic
money.
(27)
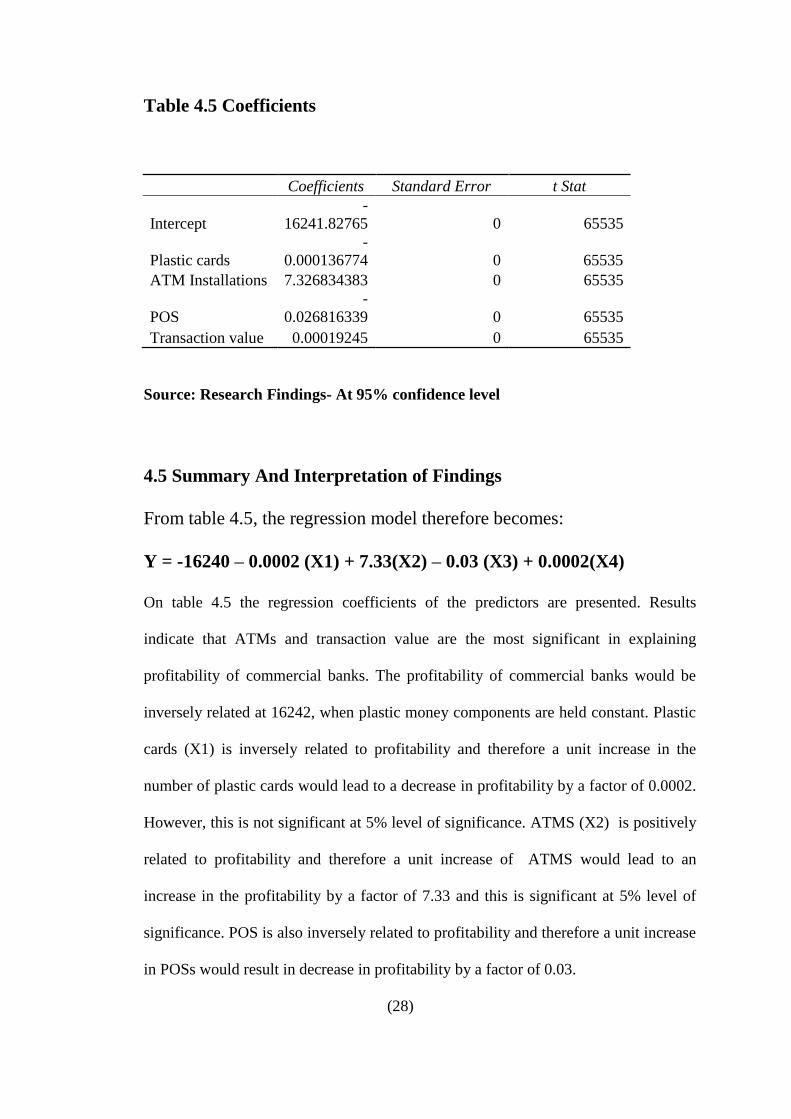
Table 4.5 Coefficients
Coefficients Standard Error t Stat
Intercept
-
16241.82765 0 65535
Plastic cards
-
0.000136774 0 65535
ATM Installations 7.326834383 0 65535
POS
-
0.026816339 0 65535
Transaction value 0.00019245 0 65535
Source: Research Findings- At 95% confidence level
4.5 Summary And Interpretation of Findings
From table 4.5, the regression model therefore becomes:
Y = -16240 – 0.0002 (X1) + 7.33(X2) – 0.03 (X3) + 0.0002(X4)
On table 4.5 the regression coefficients of the predictors are presented. Results
indicate that ATMs and transaction value are the most significant in explaining
profitability of commercial banks. The profitability of commercial banks would be
inversely related at 16242, when plastic money components are held constant. Plastic
cards (X1) is inversely related to profitability and therefore a unit increase in the
number of plastic cards would lead to a decrease in profitability by a factor of 0.0002.
However, this is not significant at 5% level of significance. ATMS (X2) is positively
related to profitability and therefore a unit increase of ATMS would lead to an
increase in the profitability by a factor of 7.33 and this is significant at 5% level of
significance. POS is also inversely related to profitability and therefore a unit increase
in POSs would result in decrease in profitability by a factor of 0.03.
(28)

Transaction value (X4) is positively related to profitability and therefore a unit
increase in transaction value would result in an increase in profitability of commercial
banks by a factor of 0.0002. From the analysis, the overall regression estimation of
the model is significant at 95% level of confidence. It indicates that the model is
significant in explaining the relationship between profitability and plastic money
usage. It indicates that plastic money is significant in explaining profitability of
commercial banks.
Result of data analysis from chapter four indicated that plastic money has strong and
positive relationship with financial performance with determinant of coefficient of
0.9801. This implies that increasing the usage of plastic money will lead to an
increase in the financial performance. Regression result from chapter four also
indicated that plastic money usage is statistically significant in causing the changes in
the financial performance of commercial banks. This is achieved at 95% confidence
level. These findings are corroborated by Kyalo F, (2012). In her study of the effect of
credit card usage on the financial performance of commercial banks in Kenya, she
found that credit card transactions are statistically significant in explaining the
financial performance of commercial banks in Kenya.
These findings are also corroborated by Odhiambo, H (2013). In his study on the
effect of electronic banking on the financial performance of commercial banks in
Kenya, he found from his analysis that electronic funds transfer is significant in
explaining profitability of commercial banks with a significance of 0.02. In his study,
his electronic bank components comprised of number of ATMS and debit cards issued
by the commercial banks, POS machines and the usage level.
(29)

CHAPTER FIVE
SUMMARY, CONCLUSION AND RECOMMENDATIONS
5.1 Summary
This study set out to establish the extent to which the adoption of plastic money has
boosted commercial banks’ earnings. It was also found out that out of all forms of
plastic money, that ranges from charge cards, debit cards, credit cards and smart
cards, ATM cards were the most widely used by the banks’ customers thus produced
the most revenues.
The study investigated the effect of plastic money on the financial performance of
commercial banks in Kenya, that is; whether plastic money usage increases or
decreases the profitability of commercial banks in Kenya. The outcome of the study
was intended to enable the banking industry to establish the extent of achievement of
the purpose for which plastic money was introduced, and offer information for further
strategy formulation and enhancement to their competitive advantage.
The study adopted descriptive survey research design. Secondary data from the
Central bank annual reports for all commercial banks in Kenya for the period between
2010 and 2014 was used, together with published reports from previous studies in the
same field. Descriptive statistics such as mean score for each variable were calculated.
The analysis involved multiple regression of variables under study that is the financial
performance represented by net profit, number of plastic cards issued by the banks,
number of A.T.M system installations, number of Point of Sale Machines, and
transaction value of plastic cards by the banks. The findings of the study were that
plastic money has a strong and significant effect on the profitability of commercial
banks in the Kenyan banking industry.
(30)

Thus, there exists positive relationship between plastic money and bank performance.
The significance test showed that the influence of plastic money on bank profitability
was statistically significant meaning that the combined effect of plastic money in this
research is statistically significant in explaining the profits of commercial banks in
Kenya. The spread or diffusion of plastic money in the banking industry in Kenya can
therefore be said to have resulted from the satisfaction that must have been
experienced by the venturous who tried out the new idea. In Kenya ATMs, Debit
Cards and Credit Cards are capable of generating some income for commercial banks
due to the convenience they offer to bank customers. Banks in Kenya have been
marketing themselves by showcasing their ATM network across the country with an
objective to attract more customers and eventually contribute to bank profits.
5.2 Conclusion
The study results show that plastic money has a big influence on profitability of
commercial banks in Kenya. The analysis produced a coefficient of determination of
98% which shows the percentage of variations in profitability which is explained by
plastic money. The significant test showed that influence of plastic money on bank
profitability was statistically significant. This means that the effect of plastic money
in this research is statistically significant in explaining the profits of commercial
banks in Kenya. However the statistical significance is different for variables tested.
Thus, there exists positive relationship between plastic money and bank performance.
Plastic cards lead to lower hard currency holding by banks, as less money is needed
by the banks to execute the transactions of their customers.
(31)

Moreover plastic cards facilitate electronic processing thus minimizing manual work,
which is coupled with errors. Standardized application procedures for loans is enabled
by plastic cards; this gets rid of non-qualified loan seekers to get loans, as only those
within the required committed level will qualify. Plastic money results to relationship
building between banks and their customers leading to customer loyalty and retention.
The banks appreciate change that makes them adapt the most relevant technology.
Customer retention via round the clock services, as plastic money operations do not
have closing time thus customers are allowed unlimited access to their money. Result
of data analysis from chapter four indicated that plastic money has strong and positive
relationship with financial performance. This implies that increasing the usage of
plastic money will lead to an increase in the financial performance. Regression result
from chapter four also indicated that plastic money usage is statistically significant in
causing the changes in the financial performance of commercial banks.
5.3 Recommendation to Policy and Practice
In terms of Revenue generation, management should put effort to increase the level of
performance in the area of plastic money. This is in order to reduce the big
discrepancy between expectations and perception. Bank management must re-
evaluate their policies regarding the amount of commission charged on plastic money.
Emphasis should be put in increasing the range of plastic money services for instance
cash deposits, credit transfer services and more than one foreign currency
withdrawals. This will go a long way in generating both quantity and quality of
services thus generating more revenue.
(32)
As pertains to Customer Satisfaction, most users know of the existing services offered
by banks. While efforts by banks should still be put into further enhancing their
customer satisfaction, the banks emphasis ought to be aimed at delivering a mix of
services that will boost customer satisfactions. The banks should now start asking
their customers what else they require other than thinking for them. Currently pricing
of plastic money services is not a big issue as it is generally accepted that it is not
expensive to use the services. However there are a significant number of respondents
who still feel that the services are expensive and so remain on the fence. The
underlying issue behind this dissident opinion is that these customers are not
convinced that they get full value for their money. This ought to be addressed quickly
lest over time this number increases to become a big issue.
Commercial banks should also collaborate with SME to install ATM/Credit card
machines for use by consumers. Most transaction by consumers takes place at
shopping malls and petrol stations. However, the cost of installation and technology
might be too expensive for small and medium enterprise. Commercial banks should
expand the market segments for consumers who are qualified to use plastic cards.
However, both standard and enhanced due diligence should be conducted before
issuing cards to consumers. Banks should also enhance credit risk management by
incorporating high technology to mitigate cases of fraud and credit loss provisions.
(33)

5.4 Limitations of the Study
The study faced the challenge of getting some detailed data because of confidentiality
reasons which made the data collection very difficult since most of the commercial
banks could not provide the critical information that was required because of fear that
competitors could use the information for their own gains.
Another challenge to the study was time as this was an academic work which had to
be completed within a limited period of time; this made the research work difficult,
because of the limited time.
This study was for a population of all commercial banks in Kenya hence a census
study. Since the study generalized all the commercial banks in Kenya, inference from
the finding would therefore be general hence misleading for some policy makers
interested in specific information.
The study was conducted spanning from the year 2010 to 2014 making a sample size
of the time of five years. However, in statistical analysis involving regression requires
that the time period should be at least 30 years. This implies that some variables
which are significant might not have been significant if a larger sample size was used.
5.5 Areas for Further Research
The study reveals that there is evidence that plastic money has a positive impact on
the financial performance of commercial banks in Kenya. Further research needs to be
carried out on the relationship that exists between money and spending, saving or
investment patterns. This would be beneficial to the study.
A study would also be undertaken to show the effects of plastic money on money
supply in Kenyan economy.
(34)
This study would boost the study on effect of plastic money on the financial
performance of commercial banks in Kenya.
Data for a research of this nature should be sourced from more than two sources. This
is because financial institutions do not always reveal their true financial position in
the annual financial statements.
Future studies should use a representative sample of the commercial banks in
investigating the effect of plastic money on the financial performance of commercial
banks in Kenya. Further studies should be conducted using quarterly data to improve
on the sample size of the data.
(35)
REFERENCES
Kenya Bankers Association Annual Report, 2008
Kariuki, J.W (2012) The effect of product development on the financial
performance of commercial banks in Kenya. Unpublished MBA project UoN
Ogare, H.O (2013) The effect of electronic banking on the financial performance
of commercial banks in Kenya. Unpublished MBA project UoN
Cooper, D. R., Schindler, P. S.,(1998) ,Business Research Methods 8th Edition
CBK, . "Central Bank of Kenya: Commercial Banks & Mortgage Finance Institutions".
Central Bank of Kenya (CBK). Retrieved 2 August 2014.
Slocum & Mathews, (1970) Social class and income indicators of consumer credit
Derrick Mathews M, (1998) the modern ways of banking. Published MBA
project, the University of California-Costa mesa.
Ndegwa (1996) Analysis of customer service offered by Kenyan commercial
banks. Unpublished MBA project UON
Retail banking research limited. Global plastic money market development of
ATMs and CDs. The world market from 1970-2002
http://www.rbrldn.demon.co.uk/history.htm
Irons (1994) Managing Service Companies, Strategies for Success
Al-Zoubi, Fayez. (1998, Administrative Control in Business Organisation, 1st
Edition, Amman, Jordan.
Addison Wesley Publishing Company
Annual reports and financial statements of Kenyan Banks: CBA, KCB, NBK,
BBK, CO-OP Bank
Bellis M, plastic money services
(i)
Http://www.mi.inf.it/www.plastic-cards/stale/history.html
Onyango GWA (1999) Credit cards in Kenya; an empirical study on the adoption,
growth and marketing strategies of credit cards in Kenya. Unpublished MBA project
UoN
Kyalo F, (2014) The effect of credit card usage on the financial performance of
commercial banks in Kenya. Unpublished MBA project UoN
Maria, Florica and Catalina (2002). Modern Instruments for Measuring
Organizational Performance .Journal of Auditorial Performance and Economics.
Mathews H.L and John W.S (1969). Social Class and Commercial Bank Credit and
Usage. Journal of Marketing , VOL 33 (71-78)
Mugenda OM, Mugenda AG (2003). Research Methods: Quantitative and Qualitative
Approaches. Nairobi: Acts Press .
Moorie, Rosita, (2004).Credit Card Knowledge ,Attitudes and Practices of College
students , Thesis and Dissertation, University of Texas Technology
My FICO.(2012). Credit Stats Retrieved from http://www.Federial
reserve.gov/released/g19/Current/
Naim , Fayez(1995), Credit Cards, Modern Arab Press, Cairo, Egypt
Nash, R.(1993) Assesing the Riskness and Profitability of Credit Cards. Journal of
financial Services Research, 7(2)
Ovia, J. (2005). Enhancing the Efficiency of the Payment System in Nigeria, CBN
Bullion, Vol. 29 (1), p.8-18.
Pavel, Christine, and Paula Binkley. (1987). Costs and Competition in Bank Credit
Cards. Federal Reserve Bank of Chicago Economic Perspectives XI, no. 2:3–13.
Robert, H. Scott. III, (2005). The determinants of Default on Credit Card, Thesis and
Dissertation, University of Missouri-Kansas City
(ii)
Robert De Young and Tara Rice, (2004). How do Banks Make Money a variety of
strategies.
Rotich, B.(2006). Analysis of factors influencing Credit and Default in Kenya: A
Case study of Post Bank. School of Business and Economics- Research and
Publication. Steve, W.(1995). The Cashless Society, Internal Journal of Retail and
Distribution Management Volume:23 issue:7
Sanda, A. U., Mikailu, A. S. & Garba, T. (2005). Corporate Governance Mechanisms
and Firm Financial Performance in Nigeria, Nairobi: AERC Research Paper 149.
Smirklock, M (2005). Evidence on the Relationship between concentration and
Profitability in banking. Journal of Money, Credit, and Banking. 17, 69-83.
Soman, Dilip, (1999). Effects of Payment Mechanism on Spending Behaviour: The
Illusion of Liquidity. Working Paper, Hong Kong University of Science and
Technology, Hong Kong.
Uzhegova, O (2010). The Relative Importance of Bank – Specific factors for Bank
Profitability in the Developing Economies.
Yacuzzi, E.(2005) A Primer On Governance And Performance In Small And
Medium-Sized Enterprises. Journal of Business Management, Vol. 2.
Woherem, E. W. (2006). Information Technology in the Nigerian Banking Industry.
Ibadan, Spectrum.
(iii)
APPENDIX
COMMERCIAL BANKS IN KENYA
1. ABC Bank (Kenya)
2. Bank of Africa
3. Bank of Baroda
4. Bank of India
5. Barclays Bank Kenya
6. CfC Stanbic Holdings
7. Chase Bank Kenya
8. Citibank
9. Commercial Bank of Africa
10. Consolidated Bank of Kenya
11. Cooperative Bank of Kenya
12. Credit Bank
13. Development Bank of Kenya
14. Diamond Trust Bank
15. Dubai Bank Kenya
16. Ecobank Kenya
17. Equatorial Commercial Bank
18. Equity Bank
19. Family Bank
20. Fidelity Commercial Bank Limited
21. First Community Bank
22. Giro Commercial Bank
23. Guaranty Trust Bank Kenya
24. Guardian Bank
25. Gulf African Bank
26. Habib Bank
27. Habib Bank AG Zurich
28. Housing Finance Company of Kenya
29. I&M Bank
(iv)
30. Imperial Bank Kenya
31. Jamii Bora Bank
32. Kenya Commercial Bank
33. K-Rep Bank
34. Middle East Bank Kenya
35. National Bank of Kenya
36. NIC Bank
37. Oriental Commercial Bank
38. Paramount Universal Bank
39. Prime Bank (Kenya)
40. Standard Chartered Kenya
41. Trans National Bank Kenya
42. United Bank for Africa
43. Victoria Commercial Bank
44. Housing Finance Ltd
Reference
CBK, . "Central Bank of Kenya: Commercial Banks & Mortgage Finance
Institutions". Central Bank of Kenya (CBK). Retrieved 2 August 2014.
(v)

CENTRAL BANK OF KENYA
Number of ATMs, ATM Cards, & POS Machinessource: www.centralbank.go.ke
Year ATMs ATM Cards Prepaid Cards Charge Cards Credit Cards Debit Cards POS Machines Total Cards
Jun,2015 2,698.00 240,817.00 1,566,074.00 285.00 220,475.00 12,477,834.00 19,259.00 14,505,485.00
May,2015 2,697.00 239,402.00 1,510,361.00 153.00 230,355.00 12,386,636.00 18,711.00 14,366,907.00
Apr,2015 2,671.00 226,952.00 1,436,367.00 126.00 198,893.00 12,350,423.00 17,326.00 14,212,761.00
Mar,2015 2,656.00 221,105.00 1,279,290.00 28.00 214,076.00 12,282,383.00 17,294.00 13,996,882.00
Feb,2015 2,643.00 220,029.00 1,226,603.00 128.00 200,047.00 12,266,529.00 17,345.00 13,913,336.00
Jan,2015 2,632.00 754,670.00 451,944.00 51.00 186,634.00 12,251,979.00 17,487.00 13,645,278.00
Dec,2014 2,613.00 746,620.00 419,258.00 68.00 208,352.00 12,552,312.00 17,511.00 13,926,610.00
Nov,2014 2,609.00 748,476.00 404,865.00 28.00 239,873.00 12,562,173.00 17,015.00 13,955,415.00
Oct,2014 2,596.00 502,862.00 390,355.00 21.00 204,943.00 12,112,926.00 16,627.00 13,211,107.00
Sep,2014 2,595.00 925,598.00 360,114.00 20.00 203,384.00 11,850,146.00 16,143.00 13,339,262.00
Aug,2014 2,597.00 805,909.00 206,579.00 62.00 185,875.00 11,848,742.00 15,963.00 13,047,167.00
Jul,2014 2,602.00 798,232.00 183,694.00 210.00 207,929.00 11,548,046.00 16,201.00 12,738,111.00
Jun,2014 2,618.00 906,908.00 186,064.00 652.00 187,765.00 11,588,007.00 17,395.00 12,869,396.00
May,2014 2,598.00 1,014,432.00 209,400.00 756.00 186,389.00 11,638,981.00 17,315.00 13,049,958.00
Apr,2014 2,609.00 998,904.00 151,218.00 728.00 179,926.00 11,116,734.00 17,340.00 12,447,510.00
Mar,2014 2,595.00 985,649.00 137,203.00 740.00 167,968.00 10,853,117.00 21,868.00 12,144,677.00
Feb,2014 2,507.00 974,148.00 128,872.00 741.00 162,138.00 10,220,766.00 21,647.00 11,486,665.00
Jan,2014 2,501.00 966,871.00 114,582.00 746.00 160,414.00 10,164,145.00 21,436.00 11,406,758.00
Dec,2013 2,487.00 1,708,639.00 73,395.00 750.00 158,612.00 9,543,204.00 21,089.00 11,484,600.00
Nov,2013 2,488.00 1,710,827.00 85,287.00 753.00 179,795.00 9,543,707.00 20,470.00 11,520,369.00
Oct,2013 2,480.00 1,677,485.00 77,959.00 760.00 177,928.00 9,676,371.00 20,569.00 11,610,503.00
Sep,2013 2,478.00 1,671,118.00 53,092.00 764.00 152,041.00 9,503,862.00 20,046.00 11,380,877.00
Aug,2013 2,472.00 1,650,702.00 46,077.00 764.00 137,299.00 9,356,027.00 19,898.00 11,190,869.00
Jul,2013 2,447.00 1,633,318.00 45,029.00 765.00 135,737.00 9,231,819.00 19,638.00 11,046,668.00
Jun,2013 2,439.00 1,625,895.00 34,405.00 772.00 133,137.00 9,126,946.00 19,204.00 10,921,155.00
May,2013 2,426.00 1,604,795.00 30,210.00 772.00 130,763.00 9,103,589.00 18,796.00 10,870,129.00
Apr,2013 2,413.00 1,584,730.00 29,876.00 772.00 129,494.00 9,008,818.00 18,576.00 10,753,690.00
Mar,2013 2,397.00 1,549,961.00 29,463.00 772.00 140,850.00 9,218,609.00 18,350.00 10,939,655.00
Feb,2013 2,404.00 1,543,291.00 30,908.00 772.00 138,963.00 9,849,025.00 18,195.00 11,562,959.00
Jan,2013 2,390.00 1,535,663.00 28,331.00 786.00 138,057.00 9,162,100.00 18,422.00 10,864,937.00
Dec,2012 2,381.00 1,499,035.00 27,558.00 2,095.00 138,011.00 9,063,905.00 18,478.00 10,730,604.00
Nov,2012 2,361.00 1,491,184.00 25,049.00 2,733.00 137,255.00 8,965,252.00 18,435.00 10,621,473.00
Oct,2012 2,339.00 1,484,838.00 22,747.00 2,733.00 134,672.00 8,819,358.00 17,989.00 10,464,348.00
Sep,2012 2,311.00 1,472,902.00 20,769.00 2,733.00 135,221.00 8,649,282.00 17,702.00 10,280,907.00
Aug,2012 2,295.00 1,665,810.00 22,022.00 2,733.00 135,121.00 8,523,104.00 17,589.00 10,348,790.00
Jul,2012 2,283.00 1,647,822.00 21,738.00 2,733.00 132,455.00 8,225,143.00 17,065.00 10,029,891.00
Jun,2012 2,291.00 1,640,004.00 21,399.00 2,877.00 131,397.00 8,121,460.00 16,630.00 9,917,137.00
May,2012 2,282.00 1,598,000.00 21,350.00 2,841.00 131,298.00 8,003,174.00 16,061.00 9,756,663.00
Apr,2012 2,272.00 1,581,844.00 21,089.00 2,838.00 127,554.00 8,102,099.00 16,034.00 9,835,424.00
Mar,2012 2,252.00 1,567,260.00 21,018.00 2,886.00 125,061.00 7,975,167.00 16,395.00 9,691,392.00
Feb,2012 2,236.00 1,533,098.00 21,090.00 2,707.00 125,058.00 7,736,315.00 16,930.00 9,418,268.00
Jan,2012 2,224.00 1,367,822.00 19,969.00 1,319.00 122,650.00 7,909,474.00 16,705.00 9,421,234.00
Dec,2011 2,205.00 1,438,453.00 22,405.00 1,339.00 122,212.00 8,548,390.00 16,604.00 10,132,799.00
Nov,2011 2,186.00 1,249,401.00 22,113.00 1,342.00 120,272.00 7,672,903.00 16,320.00 9,066,031.00
Oct,2011 2,185.00 1,335,866.00 23,383.00 1,351.00 120,701.00 7,322,126.00 15,922.00 8,803,427.00
Sep,2011 2,217.00 1,357,045.00 22,934.00 1,358.00 120,063.00 7,144,094.00 16,209.00 8,645,494.00
Aug,2011 2,208.00 1,420,417.00 22,382.00 1,404.00 118,990.00 7,131,828.00 16,177.00 8,695,021.00
Jul,2011 2,202.00 1,304,114.00 22,038.00 1,390.00 118,100.00 7,073,241.00 15,909.00 8,518,883.00
Jun,2011 2,183.00 1,439,729.00 21,367.00 1,418.00 119,287.00 7,002,176.00 16,714.00 8,583,977.00
May,2011 2,171.00 1,436,091.00 20,800.00 1,431.00 116,724.00 6,924,961.00 16,545.00 8,500,007.00
Apr,2011 2,162.00 1,506,950.00 20,117.00 1,446.00 115,600.00 6,871,502.00 17,060.00 8,515,615.00
Mar,2011 2,151.00 1,352,232.00 19,648.00 1,457.00 114,582.00 6,721,936.00 17,259.00 8,209,855.00
Feb,2011 2,143.00 1,341,800.00 19,036.00 1,474.00 112,433.00 6,247,178.00 17,998.00 7,721,921.00
Jan,2011 2,106.00 1,336,360.00 18,251.00 1,475.00 113,550.00 6,241,071.00 18,313.00 7,710,707.00
Dec,2010 2,091.00 1,348,236.00 18,750.00 725.00 113,192.00 6,191,792.00 18,179.00 7,672,695.00
Nov,2010 2,052.00 1,321,933.00 19,054.00 714.00 113,789.00 5,746,510.00 18,243.00 7,202,000.00
Oct,2010 2,037.00 1,306,185.00 19,641.00 1,129.00 114,058.00 4,617,459.00 19,279.00 6,058,472.00
Sep,2010 2,025.00 1,339,649.00 19,795.00 749.00 114,204.00 4,539,792.00 20,309.00 6,014,189.00
Aug,2010 1,995.00 1,316,350.00 20,115.00 773.00 112,675.00 4,353,272.00 21,805.00 5,803,185.00
Jul,2010 1,973.00 1,271,823.00 19,701.00 802.00 110,788.00 4,256,198.00 21,934.00 5,659,312.00
Jun,2010 1,943.00 1,252,893.00 16,081.00 791.00 111,383.00 4,156,187.00 19,608.00 5,537,335.00
May,2010 1,940.00 1,165,574.00 16,562.00 817.00 110,147.00 4,067,088.00 19,399.00 5,360,188.00
Apr,2010 1,904.00 1,126,793.00 16,803.00 825.00 112,203.00 3,955,160.00 19,753.00 5,211,784.00
Mar,2010 1,887.00 1,090,092.00 17,250.00 844.00 108,345.00 3,894,580.00 18,582.00 5,111,111.00
Feb,2010 1,865.00 1,069,050.00 17,230.00 2,474.00 107,927.00 3,768,154.00 17,587.00 4,964,835.00
Jan,2010 1,840.00 1,073,052.00 16,870.00 1,579.00 107,682.00 3,659,965.00 17,092.00 4,859,148.00
Dec,2009 1,827.00 1,031,269.00 16,749.00 1,682.00 108,456.00 3,700,646.00 15,871.00 4,858,802.00
Nov,2009 1,807.00 960,647.00 16,742.00 1,566.00 108,683.00 3,570,659.00 15,661.00 4,658,297.00
Oct,2009 1,756.00 422,785.00 16,733.00 1,645.00 107,216.00 3,388,228.00 16,619.00 3,936,607.00
Sep,2009 1,724.00 775,973.00 17,255.00 1,695.00 108,899.00 4,414,666.00 4,382.00 5,318,488.00
Aug,2009 1,711.00 756,635.00 17,249.00 1,624.00 108,911.00 3,904,066.00 4,824.00 4,788,485.00
Jul,2009 1,691.00 741,867.00 280.00 1,679.00 108,049.00 3,280,485.00 5,063.00 4,132,360.00