effect of polyurea interlayer on ballistic performance of
TRANSCRIPT
This document is downloaded from DR‑NTU (https://dr.ntu.edu.sg)Nanyang Technological University, Singapore.
Effect of polyurea interlayer on ballisticperformance of ceramic armor module againstlong rod impact
Luo, Boyang
2020
Luo, B. (2020). Effect of polyurea interlayer on ballistic performance of ceramic armormodule against long rod impact. Doctoral thesis, Nanyang Technological University,Singapore.
https://hdl.handle.net/10356/145914
https://doi.org/10.32657/10356/145914
This work is licensed under a Creative Commons Attribution‑NonCommercial 4.0International License (CC BY‑NC 4.0).
Downloaded on 15 Mar 2022 14:02:07 SGT

Effect of Polyurea Interlayer on Ballistic Performance of
Ceramic Armor Module against Long Rod Impact
LUO BOYANG
SCHOOL OF MATERIALS SCIENCE AND ENGINEERING
2020


Effect of Polyurea Interlayer on Ballistic Performance of
Ceramic Armor Module against Long Rod Impact
LUO BOYANG
SCHOOL OF MATERIALS SCIENCE AND ENGINEERING
A thesis submitted to the Nanyang Technological University in
partial fulfilment of the requirement for the degree of
Master of Engineering
2020

Statement of Originality
I hereby certify that the work embodied in this thesis is the result of
original research, is free of plagiarised materials, and has not been
submitted for a higher degree to any other University or Institution.
08/01/2021
. . . . . . . . . . . . . . . . . . . . . . . . . . . . . . . . . .
Date Luo Boyang


Supervisor Declaration Statement
I have reviewed the content and presentation style of this thesis and
declare it is free of plagiarism and of sufficient grammatical clarity to
be examined. To the best of my knowledge, the research and writing
are those of the candidate except as acknowledged in the Author
Attribution Statement. I confirm that the investigations were
conducted in accord with the ethics policies and integrity standards of
Nanyang Technological University and that the research data are
presented honestly and without prejudice.
08/01/2021
. . . . . . . . . . . . . . . . . . . . . . . . . . . . . . . . . . . . . .
Date Professor Chen Zhong


Authorship Attribution Statement
This thesis does not contain any materials from papers published in
peer-reviewed journals or from papers accepted at conferences in
which I am listed as an author.
08/01/2021
. . . . . . . . . . . . . . . . . . . . . . . . . . . . . . . . . . . . . . . . . . . .
Date Luo Boyang


Acknowledgements
Acknowledgements
The author gives thanks to TL@NTU for their financial support for this project. He
wants to thank Prof Chen Zhong from School of Materials Science and Engineering
and Dr Yuan Jianming from Temasek Laboratory @ NTU for many useful discussion
and support for this work. He wants to thank Dr Goh Wei Liang from School of
Materials Science and Engineering for his valuable suggestions and helping on the
ballistic experiments in Ma Jan High-Speed Dynamics Lab.


Table of Contents
Table of Contents
Abstract .................................................................................................................... xi
Lay Summary .............................................................................................................. iii
Acknowledgements ...................................................................................................... v
Table Captions ............................................................................................................. v
Figure Captions ........................................................................................................... vi
Chapter 1 Introduction ............................................................................................... 1
1.1 Background ........................................................................................................... 2
1.2 Hypothesis ............................................................................................................ 3
1.3 Objective and Scope ............................................................................................. 3
1.4 Dissertation Overview .......................................................................................... 4
1.5 Findings and Outcomes ........................................................................................ 5
References ................................................................................................................... 6
Chapter 2 Literature Review ...................................................................................... 9
2.1 Ballistic Test ....................................................................................................... 10
2.2 Long Rod Penetrator ........................................................................................... 10
2.3 Ceramic Armors ................................................................................................. 11
2.4 Cover Plate in Ceramic Armor Modules. ........................................................... 12
2.5 Polyurea for Protective Applications .................................................................. 13
2.5.1 Effect of Hydrostatic Stress on Shear Yield Behaviour of Polyurea ... 15
2.5.2 Effect of Strain Rate on Polyurea ......................................................... 16
2.6 Constitutive Models for Polyurea, Ceramics and Metals ................................... 17
2.6.1 Johnson Holmquist Model (JH-1) ........................................................ 17
2.6.2 Johnson Cook Model (JC) .................................................................... 19
2.6.3 Mooney Rivlin Model (MR) ................................................................ 20
2.6.4 Piecewise Linear Plasticity Model ....................................................... 21
2.7 Hydrocode Simulation ........................................................................................ 22

Table of Contents
2.8 Gap of Research .................................................................................................. 23
References ................................................................................................................. 23
Chapter 3 Experimental Methodology .................................................................... 33
3.1 Material Preparation ........................................................................................... 34
3.1.1 Planetary Mixer .................................................................................... 35
3.1.2 Preparation of Cover Plate ................................................................... 36
3.2 Material Characterisation ................................................................................... 37
3.2.1 Quasi-Static Tensile, Compression & Shear Test ................................ 37
3.2.2 Hardness Test ....................................................................................... 39
3.2.3 Split Hopkinson Pressure Bar (SHPB) ................................................. 40
3.3 Ballistic Experiment ........................................................................................... 43
3.3.1 Two-Stage Gas Launcher ..................................................................... 43
3.3.2 Experimental Setup of Ballistic Test .................................................... 44
3.3.3 Projectile ............................................................................................... 49
3.3.4 Target Fabrication ................................................................................ 50
3.3.5 Ballistic Performance of Ceramic Armor Module ............................... 52
3.4 Hydrocode Simulation ........................................................................................ 53
3.4.1 Simulation Model for Materials ........................................................... 53
3.4.2 Simulation Model ................................................................................. 54
References ................................................................................................................. 58
Chapter 4 Results and Discussion: Experiment ..................................................... 60
4.1 Quasi-static Test and Hardness Test Results ...................................................... 61
4.1.1 Quasi-static Tensile Test ...................................................................... 61
4.1.2 Quasi-static Compression Test ............................................................. 64
4.1.3 Quasi-static Shearing Test .................................................................... 65
4.1.4 Hardness Test ....................................................................................... 67
4.2 SHPB Test Results .............................................................................................. 67
Table of Contents
4.3 Ballistic Experimental Results ............................................................................ 69
4.3.1 Nominal Impact Experiment ................................................................ 69
4.3.2 Oblique Impact Experiments ................................................................ 73
Chapter 5 Results and Discussion: Simulation ....................................................... 75
5.1 Simulation Results .............................................................................................. 76
5.1.1 Simulation Results of Quasi-static Compression and SHPB test ......... 76
5.1.2 Simulation Results of The Ballistic Experiment .................................. 77
5.2 Defeat Mechanism .............................................................................................. 80
5.2.1 Shock Attenuation ................................................................................ 81
5.2.2 Effect of Polyurea Thickness ............................................................... 82
5.2.3 Effect of Polyurea Strength .................................................................. 83
References ................................................................................................................. 85
Chapter 6 Conclusions and Recommendations for Future Work ........................ 86
6.1 Conclusions ........................................................................................................ 87
6.2 Future Work ........................................................................................................ 88
6.2.1 Optimization of The Cover Plate of Ceramic Armor Modules ............ 88
6.2.2 Effect of Polyurea Interlayer Position on Ballistic Resistance of Ceramic
Armor Modules. ........................................................................................................... 90
6.2.3Effect of Polyurea in Improving The Multi-hit Capability of Ceramic Armor
Modules........................................................................................................................ 90
6.2.4 Effect of Carbon Fiber Reinforcement on Polyurea Interlayer ............ 91
References ................................................................................................................. 93
Abstract
i
Abstract
Improvement of ballistic resistance of ceramic armour against long rod impact is of
great interest to armor designers and researchers. Spray-coating of a layer of polyurea
on the front and/or back surfaces of metallic armor have been widely investigated to
improve the protective performance of the metallic armor subjected to projectile impact.
However, the study on the application of polyurea in ceramic armor for ballistic
performance enhancement against long rod impact at high impact velocity (> 1000 m/s)
is still lacking.
This project investigates the effects of mechanical properties of polyurea on the ballistic
resistance of ceramic armor modules against long rod projectile impact. The effects of
the strength and thickness of polyurea on the ballistic resistance of ceramic armor
modules were studied through experiments and numerical simulations.
Two types of polyurea (PUK&PUD) were successfully synthesised in Ma Jan High-
Speed Dynamics Lab. Quasi-static tensile, compression and shear tests were carried out
to compare the mechanical properties of PUD and PUK polyurea. It reveals that PUK
polyurea has a higher yield strength of 10 MPa and lower elongation of 360%. PUD
polyurea has a lower yield strength of 0.8 MPa and higher elongation of 500%.
Significant increment of shear stress and shear modulus were observed with applying
compressive stress for both types of polyurea.
This study investigated the effect of two primary factors of polyurea on the ballistic
performance of ceramic armor modules; (1) strength of polyurea, (2) thickness of
polyurea interlayer.
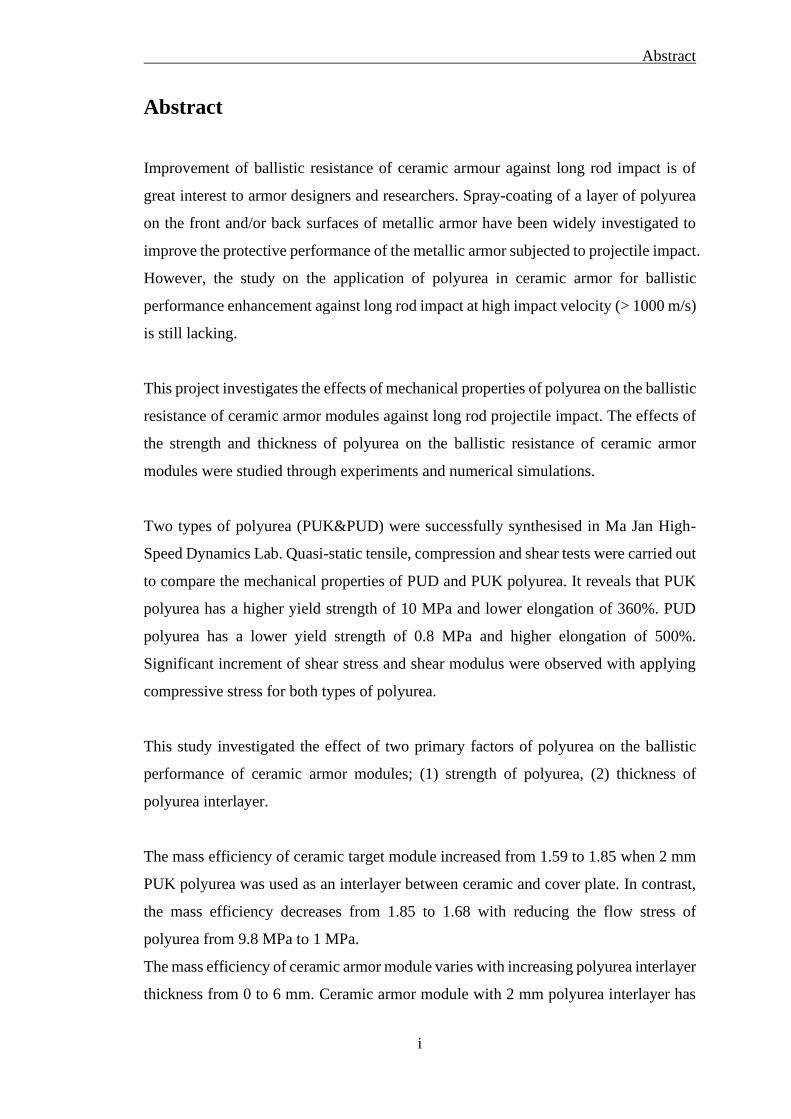
The mass efficiency of ceramic target module increased from 1.59 to 1.85 when 2 mm
PUK polyurea was used as an interlayer between ceramic and cover plate. In contrast,
the mass efficiency decreases from 1.85 to 1.68 with reducing the flow stress of
polyurea from 9.8 MPa to 1 MPa.
The mass efficiency of ceramic armor module varies with increasing polyurea interlayer
thickness from 0 to 6 mm. Ceramic armor module with 2 mm polyurea interlayer has
Abstract
ii
the highest mass efficiency. The mass efficiency reduced with increasing the thickness
of polyurea.
Through these experiments, it can be concluded that: (1) polyurea could improve the
ballistic performance of ceramic amour module by influencing the dwell time. (2)
Polyurea with higher strength would have better ballistic performance. (3) The
optimised thickness of polyurea interlayer is 2 mm.
Simulations for the two types of polyurea under dynamic load were validated through
the quasi-static test, SHPB test and ballistic experiment. It was found that the simulation
model of the ceramic module with polyurea as an interlayer has acceptable accuracy.
According to the simulation results, it has been confirmed that the polyurea interlayer
could enhance the ballistic resistance of ceramic armor module by influencing the dwell
time. With polyurea interlayer, the shock wave caused by projectile impacting ceramic
tile can be attenuated. So the dwell time is increased with proper choice of the material
and thickness.

Lay Summary
iii
Lay Summary
Large number of research have been carried out to understand the application of
polyurea coating in blast mitigation. Some researchers investigated the effect of
polyurea coating in enhancing the ballistic resistance of aluminium armour and ceramic
armour at a velocity lower than 1000 m/s. Limited researches are available for the
investigation of the ability of polyurea interlayer in a ceramic armor subject to high-
velocity impact (> 1000 m/s) of long rod projectiles.
This study attempted to address the gap in knowledge by examining the ability to use
polyurea coating as an interlayer to enhance the ballistic resistance of ceramic armor
module.
The effect of polyurea interlayer in enhancing the ballistic resistance of ceramic armor
modules was investigated by correlating ballistic experiment results and computer
simulation.
This study investigated the effect of two primary factors of polyurea on the ballistic
performance of ceramic armor modules; (1) strength of polyurea, (2) thickness of
polyurea interlayer.
Two types of polyurea (PUD&PUK) were successfully synthesised. Through ballistic
experiments, it was found that polyurea could improve the ballistic performance of
ceramic amour module by influencing the dwell time. The key finding of this study was
to correlate mechanical properties of poylurea interlayer with ballistic resistance of
ceramic armor modules against long rod projectile impact. Increased polyurea strength
could improve ballistic resistance of ceramic armor by extending the dwell time. The
optimised thickness of polyurea interlayer is 2 mm.
Simulations for the two types of polyurea under dynamic load were validated through
the quasi-static test, SHPB test and ballistic experiment. It was found that the simulation
model of the ceramic module with polyurea as an interlayer has acceptable accuracy.

Lay Summary
iv
Accordingly, the ceramic armor module using this simulation model can be used to
optimise the module design.

Table Captions
v
Table Captions
Table 3-1: Chemical contents in Dragon shield Part A .............................................. 34
Table 3-2: Chemical contents in Isonate 143L ........................................................... 34
Table 3-3: Chemical content in Versalink P-1000: ..................................................... 34
Table 3-4: Thickness of cover plate, interlayer, ceramic tile and backing plate. ........ 50
Table 3-5: Parameter of metallic materials in simulation ........................................... 56
Table 3-6: Parameters of JH-1 model for Silicon Carbide F Plus tiles ....................... 57
Table 3-7: Parameters of Piecewise Linear Plasticity for PUD & PUK polyurea ...... 57
Table 4-1: Shore hardness test results for three types of polyurea materials .............. 61
Table 4-2: Shore hardness test results for three types of polyurea materials .............. 67
Table 4-3: Ballistic test results of normal impact test ................................................. 71
Table 4-4: Ballistic test results of oblique test ............................................................ 74
Table 5-1: Experimental and Simulation results for Nominal impact experiments .... 77
Table 5-2: Experimental and Simulation results for oblique impact experiments ...... 77
Table 6-1: Experimental configurations for future work ............................................ 89
Figure Captions
vi
Figure Captions
Figure 2-1: Four phases of high-velocity penetration process [24] ............................ 11
Figure 2-2: Heavy-target configuration to investigate interface defeat of projectile at
ceramic surface [50] ..................................................................................................... 13
Figure 2-3: Penetration process of the projectile into ceramics [50] .......................... 13
Figure 2-4: Shear Modulus of PMMA verses hydrostatic pressure [65] .................... 16
Figure 2-5: Description of JH-1 Model for brittle materials (a) strength model, (b)
damage model of ceramic, (C) pressure model [85] .................................................... 19
Figure 3-1: Polyurea in aluminium model after the mixture ...................................... 35
Figure 3-2: Illustration of the Kakuhunter vacuumed mixer working mechanism ..... 36
Figure 3-3: Comparison of process polyurea between the heated condition and room
temperature condition .................................................................................................. 36
Figure 3-4: Experimental setup for the tensile test ..................................................... 37
Figure 3-5: Drawing of ASTM-D638 tensile test specimen where dimensions were
given in mm ................................................................................................................. 38
Figure 3-6: Test specimens of PUD & PUK polyurea ................................................ 38
Figure 3-7: Typical tensile test result of polymers ..................................................... 38
Figure 3-8: Cylindrical cutter for compression test .................................................... 38
Figure 3-9: Jigs for the shear test ................................................................................ 39
Figure 3-10: Load cell used in the mechanical tests ................................................... 39
Figure 3-11: Drawing for Teclock durometer type-A [16] ......................................... 40
Figure 3-12: Experimental setup of Split-Hopkinson Pressure bar for dynamic
compressive test ........................................................................................................... 41
Figure 3-13: Illustration of opposite half bridge setup for strain gauge and Wheatstone
bridge [3] ...................................................................................................................... 41
Figure 3-14: (a) Compressive stress wave in bars with good alignment and (b) stress
wave in bars with misalignment [4] ............................................................................. 42
Figure 3-15: Drawing of two stage gas launcher in Ma Jan High Speed Dynamics
Laboratory .................................................................................................................... 43
Figure 3-16: Experimental setup of ballistic test ........................................................ 44
Figure 3-17: Image of the aiming system ................................................................... 45
Figure 3-18: Image of target with aiming the impact point ........................................ 45
Figure 3-19: Image of VMS 600 velocimeter for measuring the projectile velocity . 46

Figure Captions
vii
Figure 3-20: Schematic illustration of velocimeter .................................................... 46
Figure 3-21: The trigger foil for flash X-ray system .................................................. 47
Figure 3-22: X-Ray Image for post penetration analysis ............................................ 48
Figure 3-23: Image of recorded high-speed video ...................................................... 48
Figure 3-24: Schematic of conical nosed tungsten alloy long rod .............................. 49
Figure 3-25: Projectile package for the ballistic experiment ...................................... 50
Figure 3-26: Image of projectile in expansion chamber captured by high speed camera
...................................................................................................................................... 50
Figure 3-27: Sectioned view of ceramic target module for ballistic test .................... 51
Figure 3-28: Figure of hydraulic press to compress ceramic into target module ....... 52
Figure 3-29: Illustration for measurement of DOP [10] ............................................. 53
Figure 3-30: Image of a simulation model for ballistic experiment ........................... 54
Figure 3-31: Flow stress of polyurea at 20% strain under different strain rate .......... 57
Figure 4-1: Quasi-static tensile test results for various weight percentage of Isonate
143L ............................................................................................................................. 62
Figure 4-2: Quasi-static tensile test results for 30% Isonate 143L PUK polyurea cured
under different temperatures for 24 hours ................................................................... 62
Figure 4-3: Quasi-static tensile test results for 40% Isonate 143L PUK polyurea cured
under different temperatures for 24 hours ................................................................... 63
Figure 4-4: Quasi-static tensile test results for PUK and PUD................................... 63
Figure 4-5: Quasi-static compression test results for PUK and PUD ......................... 65
Figure 4-6: Quasi-static shear test results for PUK polyurea under pre-compression 66
Figure 4-7: Quasi-static shear test results for PUD polyurea under pre-compression 66
Figure 4-8: Quasi-static shear test results for PUK polyurea under pre-tension ........ 66
Figure 4-9: Quasi-static shear test results for PUD polyurea under pre-tension ........ 67
Figure 4-10: SHPB test results for PUK polyurea ...................................................... 68
Figure 4-11: SHPB test results PUD polyurea............................................................ 68
Figure 4-12: Flow stress of two types of polyurea at the strain of 20% ..................... 69
Figure 4-13: Illustration of oblique ballistic experimental setup ................................ 70
Figure 4-14: X-ray image for post penetration ........................................................... 70
Figure 4-15: Ballistic experimental results ................................................................. 71
Figure 4-16: Witness block for the reference test and PUK6 test .............................. 71
Figure 4-17: Impact Geometry and Normalized penetration versus yaw. Rod L/D = 10
at 1.4 km/s.[1] .............................................................................................................. 73
Figure Captions
viii
Figure 4-18: Illustration of oblique ballistic experimental setup ................................ 73
Figure 5-1: Compression results of PUK polyurea where solid lines represent
experimental results and dot lines represent simulation results ................................... 76
Figure 5-2: Compression results of PUD polyurea where solid lines represent
experimental results and the dotted lines represent simulation results ........................ 77
Figure 5-3: Simulation results of nominal impact experiments with different thickness
of PUD polyurea interlayer .......................................................................................... 79
Figure 5-4: Simulation results of nominal impact experiments with different thickness
of PUK polyurea interlayer .......................................................................................... 79
Figure 5-5: Simulation results of oblique impact experiments with different thickness
of PUK polyurea interlayer .......................................................................................... 80
Figure 5-6: Shape of the projectile at 24 µs ................................................................ 81
Figure 5-7: Stress on ceramic tile versus different thickness of PUK polyurea interlayer
...................................................................................................................................... 82
Figure 5-8: Stress on ceramic tile versus different thickness of PUK polyurea interlayer
...................................................................................................................................... 82
Figure 5-9: Stress on ceramic tile versus different thickness of PUD polyurea interlayer
...................................................................................................................................... 83
Figure 5-10: Stress applied to ceramic tile with 3 mm of polyurea interlayer ........... 84
Figure 5-11: Dwell of ceramic armor module with different thickness of PUK & PUD
polyurea interlayer. ...................................................................................................... 84
Figure 6-1: Section view of 4 ceramic target module ................................................. 91
Figure 6-2: Quasi-static compression test result for PUK polyurea with carbon fibre
reinforcement and without carbon fibre reinforcement [9].......................................... 92

Abbreviations
ix
Abbreviations
AD Area Density
AISI American Iron and Steel Instituted
DOP Depth of Penetration
ME Mass Efficiency
FEM Finite Element Method
SPH Smooth Particle Hydrodynamics
RHA Rolled Homogenous Armor
SiC Silicon Carbide
Introduction Chapter 1
1
Chapter 1 Introduction
This chapter gives a brief introduction to the development of ceramic
armor and application of polyurea. The objectives and outcomes of
this study are also explained in this chapter.

Introduction Chapter 1
2
1.1 Background
Armor protection is one of the most important elements for the survivability of soldiers
in combat. Gen Shergill [1] pointed out that human life has been considered a precious
commodity. Therefore, creative design and armor module optimisation was needed to
provide better protection. Tanks were first used to provide protection for soldiers in
World War I and were widely used in World War II. In the beginning, engineers
improved the protection of tanks by increasing rolled homogenous armor (RHA)
thickness. Tanks with over 100 mm RHA front armor were widely used in the World
War II, such as Tiger I, Tiger II and M4A3E2 Sherman Jumbo. As one of the main
factors for combat effectiveness of tank was its mobility, the weight of the tank was
limited by its power-to-weight ratio. [2]
Weight of armor system was reduced through the introduction of ceramic armor with
metallic and polymeric materials and were widely used since the Vietnam War. [3-6]
The properties of high hardness and low density made ceramic an attractive material in
armor system. Rosenberg et al. was the pioneer in conducting a series of ballistic tests
on ceramic. [7-10] The widely used material model for ceramics was derived by
Johnson et al. and Holmquist et al. [11-14] These works laid the foundation for ceramics
armor system design.
Polyurea is an elastomer material invented in 1959. This material is the reaction product
of synthetic resin and isocyanate component. Taking the advantages of high elongation,
high strain rate sensitivity, fast reactivity and relatively low moisture sensitivity,
polyurea was widely sprayed as a coating or interlayer for protective applications in the
past a few decades. [15]
However, most researches on polyurea focused on blast mitigation. [16-22] The few
studies which applied polyurea for improving the ballistic performance of armor [23-
25] focused on projectiles with impact velocity under 1000 m/s. Study for its role in
higher impact velocity is unavailable, but has become increasingly important. Therefore,
in this study, the application of polyurea as an interlayer in ceramic armor against long
rod projectile penetration with a nominal impact velocity of 1250 m/s will be
investigated.

Introduction Chapter 1
3
Specifically, the effects of mechanical properties (elongation, strength) and layer
thickness of polyurea on ballistic resistance of ceramic target module will be
investigated. As an increase of polyurea strength would reduce its elongation and vice
versa, identifying their roles in ceramic armor is essential for design optimisation. On
top of that, polyurea layer thickness study will be carried out for further optimisation.
The investigation will provide vital information to armor designers to select suitable
polyurea interlayer for ceramic armor modules.
1.2 Hypothesis
“This thesis tests the hypothesis that the strength of polyurea interlayer
could affect the ballistic performance of ceramic armor modules.”
1.3 Objective and Scope
The objective of the research is to
“The present research is concerned with the experiment and simulation
to investigate correlation between polyurea interlayer mechanical
properties and ballistic performance of ceramic armor modules.”
This study aims to investigate the effects of mechanical properties of polyurea and
the interlayer thickness on the ballistic resistance of ceramic armor module.
The work of scope covers
(1) Quasi-static tensile, compression and shear tests, Split Hopkinson Pressure Bar
(SHPB) tests, ballistic experiments, and computer simulation were used to achieve
these objectives. The mass efficiency (ME) was used to assess the ballistic
resistance of ceramic armor module.
(2) The strengthening mechanism of ballistic resistance of ceramic armor modules was
assessed through computer simulations. With the investigation of the effect of
polyurea strength and thickness in ceramic armor modules, the author seeks to
provide practical guidelines for using polyurea to improve the resistance of ceramic
Introduction Chapter 1
4
armor modules to high-speed projectile penetration.
1.4 Dissertation Overview
The thesis addresses:
Chapter 1 presents an overview of polyurea and ceramic armor development and
gaps observed by the authors and then followed with hypothesis and objectives.
Chapter 2 reviews the literature with regards to polyurea and ceramic armors. This
chapter discusses the defeating mechanism of long rod projectile against ceramic
armors, followed with the effect of the cover plate in ceramic armor modules. This
chapter also discusses the mechanical properties of polyurea and the application of
polyurea in protection applications. Then, the simulation models used in this study are
discussed.
Chapter 3 provides the experimental methodology used in the study; including
quasi-static tensile, compression & shear test, dynamic Split Hopkinson Pressure Bar
test and ballistic tests. The detailed simulation model is also described in this chapter.
Chapter 4 presents the experimental results and simulation results. The correlation
between polyurea strength & thickness and ballistic performance of ceramic armors are
discussed. This chapter also presents the strengthening mechanism of using polyurea as
an interlayer in ceramic armor modules through simulation.
Chapter 5 concludes the findings of this study. Recommendations for future work
based on the drawn conclusions are discussed.

Introduction Chapter 1
5
1.5 Findings and Outcomes
This research leads to several different outcomes by:
1. Synthesis and optimised two types of polyurea in Ma Jan High Speed Dynamic
lab. Ballistic experiments show that PUK could enhance the ballistic resistance
of ceramic armor module when it is used as the interlayer.
2. Established the correlation between the ballistic resistance of ceramic armor
module with polyurea strength.
3. Established the correlation between the ballistic resistance of ceramic armor
module with polyurea interlayer thickness.
4. Verified the simulation model of ceramic armor module with polyurea as an
interlayer. Researchers could optimize the ceramic armor design using the
verified simulation model.
Introduction Chapter 1
6
References
[1] Shergill, M.S. Battlefield milieu of the 21st century. In National Symposium on
Battlefield Milieu of the 21st Century – Challenges, edited by T. Balakrishna Bhat &
S.S. Rao. DMRL, Hyderabad, May 1997. pp. 1-6.
[2] Madhu, V., & Bhat, T. B. (2011). Armor Protection and Affordable Protection for
Futuristic Combat Vehicles. Defence Science Journal, 61(4).
[3] Hannon, F. S., & Abbott, K. H. (1968). Ceramic armor stops bullets, lowers
weight. MATER ENG, 68(3), 42-43.
[4] Rolston, R. F., Bodine, E., & Dunleavy, J. (1968). Breakthrough in armor. SPACE
AERONAUTICS, 50(1), 55.
[5] Laible, R. (Ed.). (2012). Ballistic materials and penetration mechanics (Vol. 5).
Elsevier.
[6] Skaggs, S. R. (2003, January). A brief history of ceramic armor development.
In 27th Annual Cocoa Beach Conference on Advanced Ceramics and Composites: A:
Ceramic Engineering and Science Proceedings (pp. 337-349). Hoboken, NJ, USA: John
Wiley & Sons, Inc.
[7] Z. Rosenberg, Y. Yeshurun, and J. Tsaliah, “More on the thick-backing screening
technique for ceramic tile against AP projectiles,” in 12th International Symposium of
Ballistics, 1990, pp. 197–201.
[8] Z. Rosenberg and E. Dekel, “On the role of nose profile in long-rod penetration,”
Int. J. Impact Eng., vol. 22, no. 5, pp. 551–557, 1999.
[9] Z. Rosenberg and E. Dekel, “How large should semi-infinite target be?,” in
Proceedings of the 45th meeting of the aeroballistics range association, 1994.
[10] Z. Rosenberg, S. J. Bless, Y. Yeshurun, and K. Okajina, “A new definition of
ballistic efficiency based on the use of thick backing plates,” in Impact 87, 1987.
[11] G. R. Johnson and T. J. Holmquist, “An improved computational constitutive
model for brittle materials,” in AIP Conference Proceedings, 1994, vol. 309, pp. 981–
984.
[12] T. J. Holmquist and G. R. Johnson, “Response of boron carbide subjected to high-
velocity impact,” Int. J. Impact Eng., vol. 35, no. 8, pp. 742–752, Aug. 2008.
[13] T. J. Holmquist and G. R. Johnson, “Response of silicon carbide to high velocity
impact,” J. Appl. Phys., vol. 91, no. 9, p. 5858, 2002.
[14] T. J. Holmquist and G. R. Johnson, “Characterisation and evaluation of silicon

Introduction Chapter 1
7
carbide for high-velocity impact,” J. Appl. Phys., vol. 97, no. 9, p. 93502, 2005.
[15] Mohotti, D., Ngo, T., Mendis, P., & Raman, S. N. (2013). Polyurea coated
composite aluminium plates subjected to high velocity projectile impact. Materials &
Design (1980-2015), 52, 1-16.
[16] Amini, M. R., Isaacs, J. B., & Nemat-Nasser, S. (2010). Experimental investigation
of response of monolithic and bilayer plates to impulsive loads. International Journal
of Impact Engineering, 37(1), 82-89.
[17] Nemat-Nasser, S. (2010). Dynamic Response and Failure Mechanisms of Layered
Ceramic-Elastomer-Polymer/Metal Composites. California Univ San Diego La Jolla
Center Of Excellence For Advanced Materials.
[18] Ackland, K., Anderson, C., & Ngo, T. D. (2013). Deformation of polyurea-coated
steel plates under localised blast loading. International Journal of Impact
Engineering, 51, 13-22.
[19] Bahei-El-Din, Y. A., Dvorak, G. J., & Fredricksen, O. J. (2006). A blast-tolerant
sandwich plate design with a polyurea interlayer. International Journal of Solids and
Structures, 43(25-26), 7644-7658.
[20] Bahei-El-Din, Y. A., & Dvorak, G. J. (2007). Behavior of sandwich plates
reinforced with polyurethane/polyurea interlayers under blast loads. Journal of
Sandwich Structures & Materials, 9(3), 261-281.
[21] Tekalur, S. A., Shukla, A., & Shivakumar, K. (2008). Blast resistance of polyurea
based layered composite materials. Composite Structures, 84(3), 271-281.
[22] Grujicic, M., Bell, W. C., Pandurangan, B., & He, T. (2010). Blast-wave impact-
mitigation capability of polyurea when used as helmet suspension-pad
material. Materials & Design, 31(9), 4050-4065.
[23] Mohotti, D., Ngo, T., Mendis, P., & Raman, S. N. (2013). Polyurea coated
composite aluminium plates subjected to high velocity projectile impact. Materials &
Design (1980-2015), 52, 1-16.
[24] Xue, L., Mock Jr, W., & Belytschko, T. (2010). Penetration of DH-36 steel plates
with and without polyurea coating. Mechanics of materials, 42(11), 981-1003.
[25] Roland, C. M., Fragiadakis, D., & Gamache, R. M. (2010). Elastomer–steel
laminate armor. Composite structures, 92(5), 1059-1064

Introduction Chapter 1
8

Literature Review Chapter 2
9
Chapter 2
Literature Review
In this chapter, the literature review is carried out on the design of
ceramic armors. The first part summarizes the state-of-the-art
research work on ceramic armor against long rod projectile impact
test methods for armor study and theories of long rod projectile and
ceramic armors. The second part of this chapter covers the
experimental works of polyurea for protective applications. The last
part of this chapter explains the simulation models for ceramics,
metals and polyurea, laying down the foundation for simulation work
in this study.

Literature Review Chapter 2
10
2.1 Ballistic Test
There are many methods to evaluate the ballistic resistance of ceramic armor modules.
Wilkins et al. developed the ballistic limit method in 1968 to evaluate the ballistic
resistance of ceramic against 7.62 mm AP rounds. [1],[2] This method was to find out
the required impact velocity to penetrate an armor module, [3]-[5], i.e. there is 50 %
chance that an armor module would be penetrated at a particular velocity. To obtain
this velocity, a series of experiments are required for each armor configuration due to
material properties fluctuation. As a result, this method is time-consuming and costly.
To reduce the number of experiments required, another method, suggested by
Bless et al. [6] and Rosenberg et al., [7] was widely used to assess the performance of
ceramic armor modules. [8]-[18] In this method, one semi-infinite thick steel, also
known as witness block, is placed behind the ceramic armor modules. The performance
of ceramic armor module is evaluated based on the residual depth of penetration (DOP)
of projectile into the thick backing. To define “semi-infinite” thick steel, Rosenberg
carried out the simulation of tungsten-alloy long rod projectile at impact velocity of
1400 m/s to 2200 m/s.[19] A series of DOP tests of tungsten alloy long rod projectile
were carried out by Littlefield et al. at impact velocity of 1500 m/s. [20] It was
suggested that the diameter of witness block should be larger than 25 times of projectile
diameter. Its thickness was required to be larger than 2 times of penetration depth.
2.2 Long Rod Penetrator
Long rod projectile has length/diameter (L/D) ratio larger than 10. They are made of
high density metals such as tungsten alloy. The penetration of long rod projectiles into
metallic material and ceramics had been systematically studied in the past decades.
[21]-[23] In Figure 2-1, Christman et al. pointed out that the penetration process could
be described by four stages: transient, primary, secondary and recovery. [24] In the
transient phase, the projectile nose impacts the surface of target and generate high
pressure shock wave. After the projectile penetrate into target with depth of few
diameters of projectile, the projectile reaches the primary penetration phase. In this
phase, the projectile has a constant penetration velocity. For long rod projectiles, the
primary phase is relatively long and dominates the depth of penetration. The projectile

Literature Review Chapter 2
11
reaches the secondary penetration phase when it has completely deformed. In this phase,
shear deformation takes places at the wall of crater and the crater expands. As the
pressure decays in the secondary penetration phase, the strain rate response and strength
of material are taken into account. When the energy density behind the expanding shock
wave is insufficient to deform the backing material, the penetration process reaches the
fourth phase: recovery phase. In the recovery phase, the crater contracts and brittle-type
fracture takes place at the crater surface.
Figure 2-1: Four phases of high-velocity penetration process [24]
2.3 Ceramic Armors
It was found that by applying high hardness material as a coating on metals improved
its ballistic performance during World War II. [25] As ceramics has high hardness and
relatively low density, [26]-[31] ceramic-based armor had been developed and serviced
to protect helicopter and aircraft since the Vietnam War. [32]-[35] Many different
ceramic materials were used in armor applications, such as Alumina, Boron Carbide
and Silicon Carbide. [36]-[39] In ceramic-based armor design, its ballistic performance,
weight and manufacturing ability are usually considered. [40] Alumina has low cost as
it could be fabricated by slip casting, pressing and injection moulding. [41] However,
the density of alumina (3.95 g/cm3) is relatively high compared to non-oxide ceramics.
Boron carbide has a low density and excellent ballistic performance at low velocity.
[[42]] However, the shear strength of boron carbide drops when the impact pressure
Literature Review Chapter 2
12
exceeds its Hugoniot elastic limit. [43]-[45] Chen et al. pointed out that this was due to
localised amorphisation of boron carbide. [46] As a result, boron carbide is not suitable
for high-velocity impact applications. Silicon carbide has a relatively low density and
excellent physical properties. [47] The reaction-bonding method allows large-sized
fabrication of silicon carbide with low cost. [48] In this report, silicon carbide grade F
plus was used for the study.
2.4 Cover Plate in Ceramic Armor Modules.
Researchers investigated different configurations to enhance the ballistic resistance of
ceramic armor modules in the past decades. In the study of Hauver et al. in 2005, it was
found that the ballistic resistance of ceramic armor could be improved by applying a
complex cover system. [50] As shown in Figure 2-2, the cover system includes a thick
shock-wave attenuator followed with a metal layer. Weak material, such as graphite
and polytetrafluoroethylene, was applied as an interlayer between the metal cover plate
and ceramic tile. Also, lateral prestress was applied to the ceramic tile by shrink fit of
ceramic tile with the steel frame at 538 C. The authors pointed out that a certain level
of prestressing could improve the dwell time of projectile. Figure 2-3 compares the
penetration process of the projectile into ceramic tiles. The top picture shows that the
projectile directly erodes into the ceramic tile when 6 mm of ceramic was used as a
cover plate. The bottom picture showed the dwell of the projectile when the heavy target
configuration was used. In the study of Andersson et al., 7.5 mm of copper was used
as a cover plate in the reverse ballistic experiments. [52] Holmquist used one copper
plate as a cover plate in his experiment. The copper plate was 20 mm in diameter and
0.5 mm in thickness, expanding the central part of 5.71 mm in diameter and 8 mm in
thickness.[51] It was found that 200 MPa of prestress on ceramic would increase the
required surface load to create damage cone from 13 GPa to 26 GPa. In the study of
Tan, G et al., 2 mm titanium cover with weak interlayer were applied to the ceramic
armor module. [53] They pointed out that such a cover system could attenuate the
dynamic load applied to ceramic tiles and reduce the initial damage on ceramic tiles.
These studies show that a properly designed cover plate in ceramic armor structure
could enhance the ballistic performance of ceramic armor module.
Literature Review Chapter 2
13
Figure 2-2: Heavy-target configuration to investigate interface defeat of projectile at ceramic
surface [50]
Figure 2-3: Penetration process of the projectile into ceramics [50]
2.5 Polyurea for Protective Applications

Literature Review Chapter 2
14
Polyurea is known as elastomeric copolymer via the reaction between difunctional
isocyanate and difunctional amine. The resulting molecular structure consists of soft
segment and hard segment. [54] As the urea linkages are highly polar, hard segments
are self-clustering. Consequently, bulk polyurea contains segregated hard domains
which are surrounded with soft domains. The hard domains have a high glass transition
temperature. Therefore, they are crystalline. The hard domains control the stiffness and
strength of polyurea. The soft domains have a low glass transition temperature, which
makes polyurea ductile. [55]
With proper surface preparation, polyurea could be bond well with metallic materials
and concrete. Polyurea has been used as an outer coating or inter-layer material for
protective applications since decades ago. [49] Xue et al. investigated the effect of
polyurea coating on DH-36 steel plates against rigid projectile experimentally and
numerically. [56] It was found that applying polyurea coating at the back surface can
improve the ballistic resistance of DH-36 steel. Mohotti et al. investigated the effect of
polyurea coating as backing and interlayer for aluminium plates against 5.56×45 mm
projectile at a velocity of 970 m/s to 990 m/s. [49] They pointed out that the residual
velocity of the projectile was reduced with increasing polyurea coating thickness on the
back surface due to increment of energy absorption. In addition, using polyurea as an
interlayer was less effective in reducing the residual velocity of the projectile. Roland
et al. studied the ability to use polyurea coating to enhance the ballistic resistance of
high hardness steel plates against projectile at a velocity of 1000 m/s. [57] It was
pointed out that the ballistic limit velocity of steel plate could be increased by using
polyurea coating as an inter-layer. Amini et al. and Nasser et al. studied the response of
steel-polyurea bi-layer structure under impulsive load. It was found that the interface
bonding strength between polyurea coating and steel was critical for the performance
of steel-polyurea bi-layer structure. [58], [59] Ackland et al. reported that polyurea
coating could be used to mitigate damage in steel and concrete induced by the blast.
[60] Bahei-EL-Din et al. studied the blast mitigation effect of polyurea as interlayer
material between fibrous laminate composite and structural foam core. [61], [62] It was
found that polyurea interlayer could reduce 43% of peak kinetic energy and 38% of
energy dissipated to the foam core compared with the conventional structure. In the
study of Tekalur et al., [63] it was suggested that applying polyurea coating at the
surface facing blast pressure has a better blast-resistance effect. Grujicic et al. applied

Literature Review Chapter 2
15
polyurea coating as a suspension pad material for helmets. [64] Their experiments show
that the polyurea layer could reduce the peak load sustained by the brain from blast
impact.
2.5.1 Effect of Hydrostatic Stress on Shear Yield Behaviour of Polyurea
Numbers of researchers have pointed out that the mechanical properties of polymers
are dependent on the hydrostatic pressure applied. [65]-[70] With increasing the
pressure, the stiffness and yield stress increased for polymethylmethacrylate, [65], [67]
polypropylene [68] and polystyrene [69]. The fracture stress and strain of
polymethylmethacrylate (PMMA) [65] and polystyrene [65],[70],[71] was found to
increase with increasing hydrostatic pressure. Under high pressure, brittle-ductile
transitions have also been found to have changed for various materials [68],[71]. In the
study of Ainbinder et al. it was found that the tensile modulus of various materials
increased with increasing hydrostatic pressure.[65] This increment of Young's modulus
may be caused by three factors: 1) change in the interatomic distance, [72] 2) the
decrease in specific volume and 3) the finiteness of deformation. [65] Base on the
investigation of Grujicic et al. and Birch [73], [74], the relationship between hydrostatic
pressure and Young's modulus can be expressed with the following equation when
considering finiteness and deformation.
𝛥𝐸
𝐸0=
𝜎𝑟
𝐸0𝑓(𝑣) (1)
where E is the increment of Young’s modulus, E0 initial Young’s modulus, r is the
hydrostatic pressure, and 𝑣 the Poisson's ratio.

Literature Review Chapter 2
16
Figure 2-4: Shear Modulus of PMMA verses hydrostatic pressure [65]
In the study of Rabinowitz, as shown in Figure 2-4, the shear modulus of PMMA was
found to increase from 953 MPa to 2179 MPa when the hydrostatic pressure was
increased from 0 MPa to 196 MPa. The fracture stress was increased from 129 MPa to
250 MPa. [69] The yield stress of PMMA has a linear dependency with hydrostatic
pressure, which is expressed with the following equation,
𝜏 = 𝜏0 + 𝛼𝑃 (2)
In the study of Grujicic et al. in 2014, [74] pressure-shearing impact experiments and
simulation were conducted to investigate the shear resistance of polyurea under high
pressure and high strain rate. They pointed out that the shear resistance increases
linearly with increasing of compressive stress in the range of 0 to 20 GPa. When the
compressive stress exceeded 20 GPa, the increment of shear resistance deviated from
the linear behaviour. According to the molecular level computational analysis, Grujicic
et al. pointed out that the shear resistance of polyurea is dependent on the soft-segment
molecular weight.
2.5.2 Effect of Strain Rate on Polyurea
Literature Review Chapter 2
17
Mechanical properties of polyurea are known to be dependent on strain rates. Numerous
studies were carried out to characterise polymer mechanical behaviour concerning
strain rate [75]-[81]. In the study by Qi et al., it was found that the majority of the
irreversible strain of polyurea after unloading would vanish after post-unloading time
[83]. It indicates that polyurea has viscoplastic behaviour. They pointed out that the
probability for thermally activated processes, which results in plastic deformation,
would be reduced with increasing strain rate. At the same time, the elastic response is
increased. Amirkhizi accounted for the strain rate dependency of polyurea with the
time-temperature superposition principle. [82] The material is un-relaxed when the
imposed deformation is shorter than the relaxation time. Hence, the material shows
strain rate dependency. In the study of Jiao et al. in 2009 [84], they found that, at a high
shearing rate of 10-5 s-1, the shearing resistance was not sensitive to the shearing rate.
On the other hand, the shear resistance of polyurea increased with increasing of pressure.
2.6 Constitutive Models for Polyurea, Ceramics and Metals
In this section, the material models for simulation work in this study are described.
Johnson Holmquist model was used for ceramics, Johnson-Cook model for metals, and
Mooney Rivlin model for polyurea in the study.
2.6.1 Johnson Holmquist Model (JH-1)
There are two widely used model developed by Johnson Holmquist for ceramics: JH-1
and JH-2. JH-2 model provides a dimensionless description of strength for ceramics,
while JH-1 model gives a linear relationship between strength and pressure of ceramics.
[85], [86] Some researches indicated that the JH-1 model was a more accurate
representation of ceramic failure than JH-2 model. [85] In the research of Johnson et al.
in 2001, they found that JH-1 model can provide a more accurate modelling of interface
defeat of boron carbide target. [87], [88]
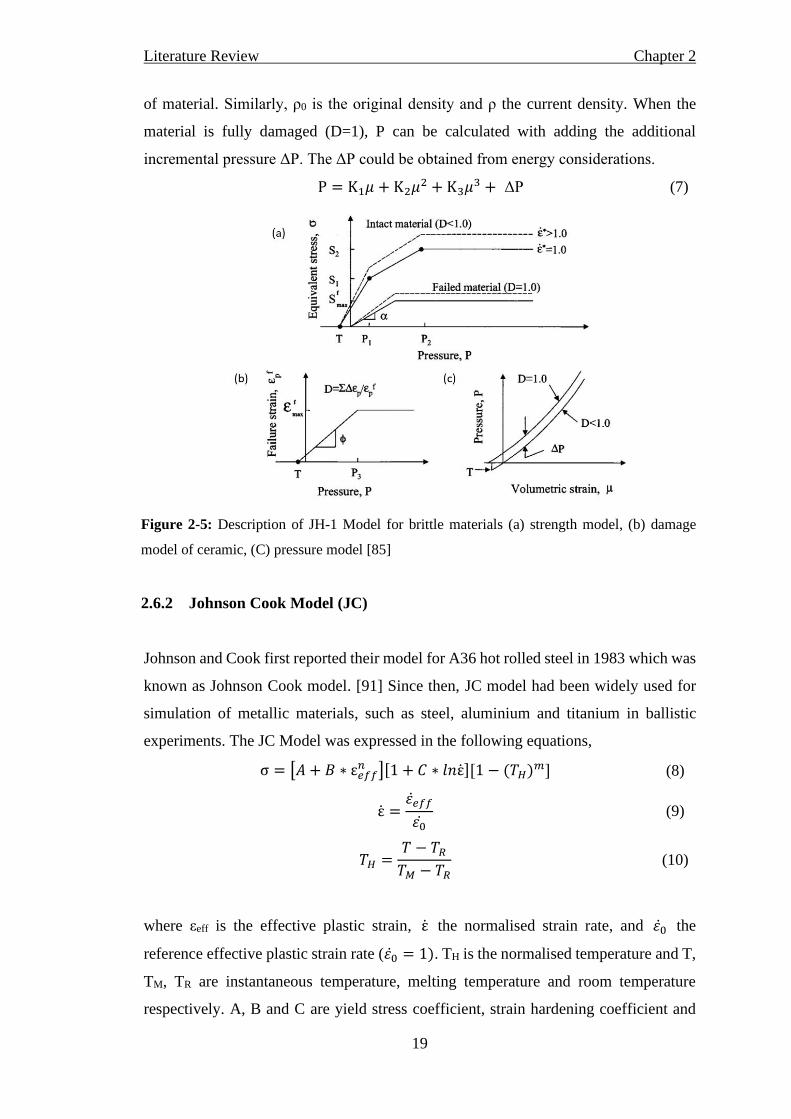
In this thesis, the JH-1 model was used for simulation of silicon carbide ceramics. The
model can be summarised in Figure 2-2. The upper part of the figure shows the
dependency of von Mises Stress (σ) of material with pressure (P), material damage (D)
and normalised strain rate (𝜀̇∗). The material cannot sustain any plastic strain when it
was under tensile pressure T. The strengths of intact material are S1 and S2 when it was

Literature Review Chapter 2
18
under compressive pressures, P1 and P2. For intact material, its damage D=0; for
partially damaged material, 0<D<1; for fully damaged material, D=1. The maximum
failure strength (Sfmax) of fully damaged material is significantly reduced compared
with intact material. The slope between strength of fully damaged material and its
pressure is represented by α. Feng et al. [89] suggested a gradual softening for a
partially damaged material. However, their data was inconclusive for the magnitude of
softening. In the research of Grady et al. and Moody et al. [90], they pointed out that
the strength of SIC was 12.9 GPa when the hydrostatic pressure was 32.2 GPa. In the
research of Bassett et al. they found that the strength of SiC would reduce to 9.9 GPa
when the hydrostatic pressure was increased to 34.2 GPa. These data suggested that
ceramic softening occurred during damage accumulation. It was suggested by
Holmquist et al. [85] that the softening during damage accumulation was not significant
until the material was fully damaged (D=1).
The dependency of material strength with strain rate can be expressed with the
following equation,
𝜎 = 𝜎0(1 + 𝐶𝑙𝑛𝜀̇∗) (3)
where σ0 is the strength of material when 𝜀̇∗=1. C is the strain rate constant.
The accumulated damage for material D can be calculated with the following equations,
𝐷 = ∑ 𝛥𝜀𝑝/𝜀𝑝𝑓 (4)
𝜀̇ =2𝐶𝐵𝜀𝑅(𝑡)
𝐿𝑠 (5)
During each cycle of integration, the equivalent plastic strain increment is represented
with 𝛥𝜀𝑝. The 𝜀𝑝𝑓 is the equivalent plastic strain of material at failure when it is under
pressure of P. It can be found that the equivalent plastic strain of material reaches its
maximum when the pressure is increased to P3 as shown in Figure 2-5.
The hydrostatic pressure P of material is illustrated in the lower right of Figure 2-5.
When the material is intact or partially damaged (D<1), the value of P can be calculated
with the following equation
P = K1𝜇 + K2𝜇2 + K3𝜇3 (6)
where K1 was the bulk modulus of material. K2 and K3 were constants. The value of
volumetric strain μ=V0/V-1= ρ0/ρ-1. V0 is the original volume and V the current volume
Literature Review Chapter 2
19
of material. Similarly, ρ0 is the original density and ρ the current density. When the
material is fully damaged (D=1), P can be calculated with adding the additional
incremental pressure ΔP. The ΔP could be obtained from energy considerations.
P = K1𝜇 + K2𝜇2 + K3𝜇3 + ΔP (7)
Figure 2-5: Description of JH-1 Model for brittle materials (a) strength model, (b) damage
model of ceramic, (C) pressure model [85]
2.6.2 Johnson Cook Model (JC)
Johnson and Cook first reported their model for A36 hot rolled steel in 1983 which was
known as Johnson Cook model. [91] Since then, JC model had been widely used for
simulation of metallic materials, such as steel, aluminium and titanium in ballistic
experiments. The JC Model was expressed in the following equations,
σ = [𝐴 + 𝐵 ∗ ε𝑒𝑓𝑓𝑛 ][1 + 𝐶 ∗ 𝑙𝑛ε̇][1 − (𝑇𝐻)𝑚] (8)
ε̇ =𝜀�̇�𝑓𝑓
𝜀0̇ (9)
𝑇𝐻 =𝑇 − 𝑇𝑅
𝑇𝑀 − 𝑇𝑅 (10)
where εeff is the effective plastic strain, ε̇ the normalised strain rate, and 𝜀0̇ the
reference effective plastic strain rate (𝜀0̇ = 1). TH is the normalised temperature and T,
TM, TR are instantaneous temperature, melting temperature and room temperature
respectively. A, B and C are yield stress coefficient, strain hardening coefficient and
Literature Review Chapter 2
20
strain rate coefficient, respectively. m and n are the temperature softening exponent and
strain hardening exponent of the material. The first bracketed term in Equation (8)
represents the strain hardening effect for yield stress of the material. The second
bracketed term includes the effect of increasing strain rate on yield stress. The third
bracketed term takes into account the softening effect of the yield stress, which is
induced by localised temperature increase. In the research of Hancock et al., they found
that the fracture strain of material decreases with increasing the hydrostatic tensile
stress. [92] Based on their theory, Johnson and Cook further expanded the previous
equations by adding damage parameters for fracture in 1985. [93] The JC model had
been widely used by many researchers to simulate the behaviours of metallic materials,
such as aluminium, steel and titanium, in ballistic experiments and yielded good results.
[94]-[101]
2.6.3 Mooney Rivlin Model (MR)
The Mooney Rivlin model has been wide used to simulate the behaviours of rubber like
hyper-elastic materials. [102], [103] In the past decades, researchers had modified the
MR model to describe non-linear behaviour of these materials based on different
assumptions. [104]-[109] However, in the simulation hydrocode of LS-Dyna, the
original version of MR model are employed. [110]
In the MR model, the strain energy of material was derived in terms of principle strain
invariants, which is as shown in the following equations: [102], [103]
𝑊 = ∑ 𝐶𝑖𝑟(𝐼1̅ − 3)𝑖(𝐼2̅ − 3)𝑟 + ∑ 𝐷𝐾(𝐽 − 1)2𝐾
𝑀
𝐾=1
𝑁
𝑖,𝑟=0
(11)
𝐼1̅ = 𝐽−2/3 ∗ 𝐼1 (12)
𝐼2̅ = 𝐽−4/3 ∗ 𝐼2 (13)
𝐼1 = 𝜆12 + 𝜆2
2 + 𝜆32 (14)
𝐼2 = (𝜆1𝜆2)2 + (𝜆1𝜆3)2 + (𝜆2𝜆3)2 (15)
where W is strain energy, Cir are the material constants, which would be obtained
empirically; 𝐼1̅ and 𝐼2̅ are the first and second principle strain invariant; J is the
determinant of elastic deformation gradient and D the incompressibility parameter of
Literature Review Chapter 2
21
the material. For incompressible materials, J is set as 1. The parameter λ is known as
the extension ratio which is equal to (1+ε).
Xue et al. pointed out the two parameters version of MR model could be used to predict
the behaviour of polyurea material as interlayer under impulsive loads.[56] By letting
N=1, J=1and C00=C11=0 in Equation 11,
𝑊 = 𝐶10(𝐼1̅ − 3) + 𝐶01(𝐼2̅ − 3) (16)
In the case of one-dimensional extension, λ2 = λ3 =1
λ1. Therefore, the engineering
stress σ of material could be expressed as
𝜎 = 2(𝜆 − 𝜆−2)(𝐶10 + 𝐶01𝜆−1) (17)
where C10 and C01 are constants, they could be obtained by data fitting from
experiments.
2.6.4 Piecewise Linear Plasticity Model
One main drawback of Mooney Rivlin model is that it could not predict the strain-rate
and pressure dependency of polymers. To include these effects, Piecewise linear
plasticity model, which is widely used in simulations to describe rate-dependent
phenomena of polymers, can be adopted. In this model, one arbitrary stress-strain curve
is defined to describe the behaviour of the material at the lowest strain rate of interest.
The strain-rate effect is accounted for with Cowper Symonds model in the followed
equation,[104]
𝜎𝑦(𝜀𝑒𝑓𝑓′𝑃 𝜀�̇�𝑓𝑓
𝑃 ) = 𝜎𝑦𝑠(𝜀𝑒𝑓𝑓
𝑃 ) + 𝑆𝐼𝐺𝑌 (𝜀�̇�𝑓𝑓
𝑃
𝐶)
1𝑝 (18)
where C and P are constants, and could be obtained from a series of mechanical tests
under different strain rates. In this report, Mat_24
PIECEWISE_LINEAR_PLASTICITY in LS-Dyna was used for the simulation of
polyurea in ballistic experiments.

Literature Review Chapter 2
22
2.7 Hydrocode Simulation
The finite element method (FEM) has been widely used for investigating material
response under high-velocity impact by solving partial differential equations. In LS-
Dyna, the momentum equations are solved by satisfying displacement boundary
conditions and traction. The energy equations are used for evaluating the equation of
state, and to keep global energy balance. [111], [112] Thus, the displacement and
deformation of material could be well tracked with using FEM.
However, the FEM is limited by the time step during integration. The time step should
be small enough to ensure that the wave is within one element in each integration step.
When solving large deformation problems, the time step is required to be extremely
small, otherwise the accuracy of result would be affected. To overcome this kind of
problem, the Smoothed Particle Hydrodynamics (SPH) method has to be used. The SPH
method was first developed by Lucy et al. for solving of astrophysical problems. [112]-
[117] The behaviour of SPH is governed by a few conservation equations. These SPH
nodes would be stable for large deformation and the accuracy depends on the smoothing
function used. [118]] The SPH method has the following advantages: (1) it could solve
large deformation problems with simple and accurate solution; (2) it would be simpler
for discretisation of complex geometries and (3) determination of free surface and
deformable boundaries would be simpler. However, since the interaction of SPH
particles is calculated individually, the SPH method would require more resources
compared with FEM.
Another method to overcome the limitations of FEM and SPH was developed in LS-
Dyna named DEFINE_ADAPTIVE_SOLID_TO_SPH. [119] In this method, SPH
particles are coupled with FEM elements. The FEM elements are used for small
deformation. FEM elements would then be converted to SPH when the FEM elements
are highly distorted. Using this scheme, the computation efficiency can be improved.
[120]-[122]

Literature Review Chapter 2
23
2.8 Gap of Research
As mentioned in the above sections, most of the previous studies had focused on the
use of polyurea coating for blast mitigation applications. Some researchers investigated
the application of polyurea for enhancing the ballistic resistance of ceramic armor at a
velocity lower than 1000 m/s. Limited researches are available for the investigation of
the ability of polyurea interlayer in a ceramic armor subject to high-velocity impact (>
1000 m/s) of long rod projectiles. This study attempted to address this gap in knowledge
by examining the ability to use polyurea coating as an interlayer to enhance the ballistic
resistance of ceramic armor module.
References
[1]. M. L. Wilkins, “Third progress report of light armor program.” 1968.
[2]. M. L. Wilkins, C. F. Cline, and C. A. Honodel, “Fourth progress report of light
armor program,” p. 56, 1969.
[3]. Donald E. Carlucci, Sidney S. Jacobson (2008). Ballistics: Theory and Design of
Guns and Ammunition. CRC Press. p. 310. ISBN 978-1-4200-6618-0.
[4]. Anderson, C. E. (2002). Developing an ultra-lightweight armor concept. Ceramic
transactions, 134, 485-498.
[5]. Wilkins, M. L. (1978). Mechanics of penetration and perforation. International
Journal of Engineering Science, 16(11), 793-807.
[6]. S. J. Bless, Z. Rosenberg, and B. Yoon, “Hypervelocity penetration of ceramics,”
Int. J. Impact Eng., vol. 5, no. 1–4, pp. 165–171, 1987.
[7]. Z. Rosenberg, S. J. Bless, Y. Yeshurun, and K. Okajina, “A new definition of
ballistic efficiency based on the use of thick backing plates,” in Impact 87, 1987.
[8]. P. J. Hazell, C. J. Roberson, and M. Moutinho, “The design of mosaic armor: The
influence of tile size on ballistic performance,” Mater. Des., vol. 29, no. 8, pp. 1497–
1503, Jan. 2008.
[9]. A. Gassman, V. Paris, and L. Levin, “Effect of Prestressing on the Ballistic
Performance of Alumina Ceramics: Experiments and Modeling,” in Advances in
Ceramic Armor IX: Ceramic Engineering and Science Proceedings, 2014, pp. 31–40.
[10]. M. J. Normandia, “Eroded length model for yawed penetrators impacting finite
thickness targets at normal and oblique incidence,” Int. J. Impact Eng., vol. 23, no. 1,
Literature Review Chapter 2
24
pp. 663–674, Dec. 1999.
[11]. T. W. Bjerke, G. F. Silsby, D. R. Scheffler, and R. M. Mudd, “Yawed long-rod
armor penetration,” Int. J. Impact Eng., vol. 12, no. 2, pp. 281–292, 1992.
[12]. M. Bakas, V. Greenhut, D. . Niesz, J. Adams, and J. W. McCauley, “Relationship
between defects and dynamic failure in silicon carbide,” in 27th Annual Cocoa Beach
Conference on Advanced Ceramics and Composites: A: Ceramic Engineering and
Science, vol. 24, no. 3, 2008.
[13]. J. D. Clayton, “Penetration resistance of armor ceramics: Dimensional analysis
and property correlations,” Int. J. Impact Eng., vol. 85, pp. 124–131, 2015.
[14]. B. James, “Practical Issues in Ceramic Armor Design,” in Ceramic Armor
Materials by Design, 2002, pp. 33–44.
[15]. X. F. Zhang and Y. C. Li, “On the comparison of the ballistic performance of 10%
zirconia toughened alumina and 95% alumina ceramic target,” Mater. Des., vol. 31, no.
4, pp. 1945–1952, 2010.
[16]. S. G. Savio, K. Ramanjaneyulu, V. Madhu, and T. B. Bhat, “An experimental
study on ballistic performance of boron carbide tiles,” Int. J. Impact Eng., vol. 38, no.
7, pp. 535–541, Jul. 2011.
[17]. D. Yaziv, S. Chocron, C. E. Anderson, and D. J. Grosch, “Oblique penetration in
ceramic targets,” 19th Int. Symp. Ballist., no. May, pp. 7–11, 2001.
[18]. F. Huang and L. Zhang, “DOP test evaluation of the ballistic performance of
armor ceramics against long rod penetration,” AIP Conf. Proc., vol. 845 II, no. 1, pp.
1383–1386, 2006.
[19]. Z. Rosenberg and E. Dekel, “How large should semi-infinite target be?,” in
Proceedings of the 45th meeting of the aeroballistics range association, 1994.
[20]. D. L. Littlefield, C. E. Anderson, Y. Partom, and S. J. Bless, “The penetration of
steel targets finite in radial extent,” Int. J. Impact Eng., vol. 19, no. 1, pp. 49–62, 1997.
[21]. D. L. Orphal and R. R. Franzen, Penetration of confined B4C, AIN and SIC targets
by tungsten long rods at 1.5 to 5 km/s. Hypervelocity Impact Symp., classified
proceedings, Austin, TX, 17-20 November (1992).
[22]. E. Perez, Experimental and theoretical study on the penetration of semi-infinite
targets by greatlength metal projectiles with a velocity higher than 2000 m/s. Science
et Techniques de l'Armement, 56, (English translation available AD B077330), (1982).
[23]. V. K. Luk and A. J. Piekutowski, An analytical model on penetration of eroding
long rods into metallic targets. 13th Int. Ballistics Symposium, Stockholm, Sweden, 3,

Literature Review Chapter 2
25
265-272, June (1992).
[24]. D. R. Christman and J. W. Gehring, “Analysis of high-velocity projectile
penetration mechanics,” J. Appl. Phys., vol. 37, no. 4, pp. 1579–1587, 1966.
[25]. R.C. Laible, “Ceramic Composite armor in ballistic materials and penetration
mechanics:, Chapter 6, 150-151, 1980, Amsterdam, Elsevier.
[26]. Den Reijer, P. C. (1990). On the Penetration Rods into Ceramic Faced Armors.
In Proc. 12th. Int. Symp. on Ballistic(Vol. 389).
[27]. Lundberg, P. (2001). Interface Defeat and Penetration: Interaction between
Metallic Projectiles and Ceramic Targets(Doctoral dissertation, Uppsala University).
[28]. Lundberg, P., Renström, R., & Lundberg, B. (2000). Impact of metallic projectiles
on ceramic targets: transition between interface defeat and penetration. International
Journal of Impact Engineering, 24(3), 259-275.
[29]. Anderson, C. E. (2002). Developing an ultra-lightweight armor concept. Ceramic
transactions, 134, 485-498.
[30]. Hazell, P. J. (2006). Ceramic armor: design, and defeat mechanisms. Argos press.
[31]. Hannon, F. S., & Abbott, K. H. (1968). Ceramic armor stops bullets, lowers
weight. MATER ENG, 68(3), 42-43.
[32]. Hannon, F. S., & Abbott, K. H. (1968). Ceramic armor stops bullets, lowers
weight. MATER ENG, 68(3), 42-43.
[33]. Rolston, R. F., Bodine, E., & Dunleavy, J. (1968). Breakthrough in armor. SPACE
AERONAUTICS, 50(1), 55.
[34]. Laible, R. (Ed.). (2012). Ballistic materials and penetration mechanics (Vol. 5).
Elsevier.
[35]. Skaggs, S. R. (2003, January). A brief history of ceramic armor development.
In 27th Annual Cocoa Beach Conference on Advanced Ceramics and Composites: A:
Ceramic Engineering and Science Proceedings (pp. 337-349). Hoboken, NJ, USA: John
Wiley & Sons, Inc.
[36]. Cline, C. F., & Wilkins, M. L. (1969, January). Importance of Material Properties
in Ceramic Armor. In American Ceramic Society Bulletin (Vol. 48, No. 4, p. 487). 735
Ceramic Place, PO BOX 6136, Westerville, OH 43081-6136: Amer Ceramic SOC.
[37]. Landingham, R. L., & Casey, A. W. (1972). Final report of the light armor
materials program (No. UCRL--51269). California Univ.
[38]. Matchen, B. (1996). Applications of ceramics in armor products. In Key
Engineering Materials (Vol. 122, pp. 333-344). Trans Tech Publications.

Literature Review Chapter 2
26
[39]. Medvedovski, E. (2002). Alumina ceramics for ballistic protection. II. American
Ceramic Society Bulletin, 81(4), 45-50.
[40]. Medvedovski, E. (2010). Ballistic performance of armor ceramics: Influence of
design and structure. Part 2. Ceramics International, 36(7), 2117-2127.
[41]. Medvedovski, E. (2010). Ballistic performance of armor ceramics: Influence of
design and structure. Part 1. Ceramics International, 36(7), 2103-2115.
[42]. Wilkins, M. L. (1977). Use of boron compounds in lightweight armor. In Boron
and refractory borides (pp. 633-648). Springer, Berlin, Heidelberg.
[43]. D. E. Grady, Dynamic Properties of Ceramic Materials: Sandia National
Laboratories Report, SAND 94-3266 (Sandia National Laboratories, Albuquerque, NM,
1995).
[44]. D. P. Dandekar, Army Research Laboratory, ARL-TR-2456 (Aberdeen Proving
Ground, Aberdeen, MD, 2001).
[45]. T. J. Vogler, W. D. Reinhart, and L. C. Chhabildas, J. Appl. Phys. 95, 4173 (2004).
[46]. M. W. Chen, J. W. McCauley, and K. J. Hemker, Science 299, 1563 (2003).
[47]. E. Medvedovski, Silicon carbide-based ceramics for ballistic protection, in: E.
Medvedovski (Ed.), Ceramic Armor and Armor Systems, Ceramic Transactions, vol.
151, American Ceramic Society, Westerville, OH, 2003 , pp. 19–35.
[48]. Aghajanian, M. K., Morgan, B. N., Singh, J. R., Mears, J., & Wolffe, R. A. (2002).
A new family of reaction bonded ceramics for armor applications. Ceramic
transactions, 134, 527-539.
[49]. Mohotti, D., Ngo, T., Mendis, P., & Raman, S. N. (2013). Polyurea coated
composite aluminium plates subjected to high velocity projectile impact. Materials &
Design (1980-2015), 52, 1-16.
[50]. Hauver, G. E., Rapacki Jr, E. J., Netherwood, P. H., & Benck, R. F.
(2005). Interface defeat of long-rod projectiles by ceramic armor. Army Research Lab
Aberdeen Proving Ground Md Weapons and Materials Research Directorate.
[51]. Andersson, O., Lundberg, P., & Renstrom, R. (2007, April). Influence of
confinement on the transition velocity of silicon carbide. In Proceedings of the 23rd
International Symposium on Ballistics (pp. 1273-1280).
[52]. Holmquist, T. J., Anderson Jr, C. E., & Behner, T. (2005, November). Design,
analysis and testing of an unconfined ceramic target to induce dwell. In Proceedings of
the 22nd international symposium on ballistics (Vol. 2, pp. 860-868). DEStech
Publications.

Literature Review Chapter 2
27
[53]. TAN, G., YUAN, J., & GOH, W. (2016, May). Steel-Confined SiC Armor against
Oblique Penetration The Effect of Out-of-Plane Fiber Waviness on the Ballistic
Performance of Ultra High Molecular Weight Polyethylene. In 29th International
Symposium on Ballistics.
[54]. Ward, I. M. (1971). The yield behavior of polymers. In Journal of Polymer
Science Part C: Polymer Symposia (Vol. 32, No. 1, pp. 195-218). New York: Wiley
Subscription Services, Inc., A Wiley Company.
[55]. Grujicic, M., Bell, W. C., Glomski, P. S., Pandurangan, B., Cheeseman, B. A.,
Fountzoulas, C., & Patel, P. (2011). Multi-length scale modeling of high-pressure-
induced phase transformations in soda-lime glass. Journal of Materials Engineering and
Performance, 20(7), 1144-1156.
[56]. Xue, L., Mock Jr, W., & Belytschko, T. (2010). Penetration of DH-36 steel plates
with and without polyurea coating. Mechanics of materials, 42(11), 981-1003.
[57]. Roland, C. M., Fragiadakis, D., & Gamache, R. M. (2010). Elastomer–steel
laminate armor. Composite structures, 92(5), 1059-1064.
[58]. Amini, M. R., Isaacs, J. B., & Nemat-Nasser, S. (2010). Experimental
investigation of response of monolithic and bilayer plates to impulsive
loads. International Journal of Impact Engineering, 37(1), 82-89.
[59]. Nemat-Nasser, S. (2010). Dynamic Response and Failure Mechanisms of Layered
Ceramic-Elastomer-Polymer/Metal Composites. California Univ San Diego La Jolla
Center Of Excellence For Advanced Materials.
[60]. Ackland, K., Anderson, C., & Ngo, T. D. (2013). Deformation of polyurea-coated
steel plates under localised blast loading. International Journal of Impact
Engineering, 51, 13-22.
[61]. Bahei-El-Din, Y. A., Dvorak, G. J., & Fredricksen, O. J. (2006). A blast-tolerant
sandwich plate design with a polyurea interlayer. International Journal of Solids and
Structures, 43(25-26), 7644-7658.
[62]. Bahei-El-Din, Y. A., & Dvorak, G. J. (2007). Behavior of sandwich plates
reinforced with polyurethane/polyurea interlayers under blast loads. Journal of
Sandwich Structures & Materials, 9(3), 261-281.
[63]. Tekalur, S. A., Shukla, A., & Shivakumar, K. (2008). Blast resistance of polyurea
based layered composite materials. Composite Structures, 84(3), 271-281.
[64]. Grujicic, M., Bell, W. C., Pandurangan, B., & He, T. (2010). Blast-wave impact-
mitigation capability of polyurea when used as helmet suspension-pad

Literature Review Chapter 2
28
material. Materials & Design, 31(9), 4050-4065.
[65]. Ainbinder, S. B., Laka, M. G., & Maiors, I. Y. (1965). Effect of hydrostatic
pressure on mechanical properties of plastics. Polymer Mechanics, 1(1), 50-55.
[66]. Whitney, W., & Andrews, R. D. (1967). Yielding of glassy polymers: volume
effects. In Journal of Polymer Science Part C: Polymer Symposia (Vol. 16, No. 5, pp.
2981-2990). New York: Wiley Subscription Services, Inc., A Wiley Company.
[67]. Bowden, P. B., & Jukes, J. A. (1968). The plastic yield behaviour of
polymethylmethacrylate. Journal of Materials Science, 3(2), 183-190.
[68]. Pae, K. D., Mears, D. R., & Sauer, J. A. (1968). Stress–strain behavior of
polypropylene under high pressure. Journal of Polymer Science Part B: Polymer
Letters, 6(11), 773-778.
[69]. Rabinowitz, S., Ward, I. M., & Parry, J. S. C. (1970). The effect of hydrostatic
pressure on the shear yield behaviour of polymers. Journal of materials Science, 5(1),
29-39.
[70]. Mears, D. R., Pae, K. D., & Sauer, J. A. (1969). Effects of hydrostatic pressure on
the mechanical behavior of polyethylene and polypropylene. Journal of Applied
Physics, 40(11), 4229-4237.
[71]. Rice, F. O. (1949). Electron Structure and the Chemical Bond [Russian
translation].
[72]. Menoni, C. S., & Spain, I. L. (1987). Equation of state of InP to 19 GPa. Physical
Review B, 35(14), 7520.
[73]. Birch, F. (1938). The effect of pressure upon the elastic parameters of isotropic
solids, according to Murnaghan's theory of finite strain. Journal of Applied
Physics, 9(4), 279-288.
[74]. Grujicic, M., Yavari, R., Snipes, J. S., Ramaswami, S., Jiao, T., & Clifton, R. J.
(2015). Experimental and computational study of the shearing resistance of polyurea at
high pressures and high strain rates. Journal of Materials Engineering and
Performance, 24(2), 778-798.
[75]. Yi, J., Boyce, M. C., Lee, G. F., & Balizer, E. (2006). Large deformation rate-
dependent stress–strain behavior of polyurea and polyurethanes. Polymer, 47(1), 319-
329.
[76]. Grujicic, M., He, T., & Pandurangan, B. (2011). Development and
parameterization of an equilibrium material model for segmented
polyurea. Multidiscipline Modeling in Materials and Structures.

Literature Review Chapter 2
29
[77]. Grujicic, M., He, T., Pandurangan, B., Runt, J., Tarter, J., & Dillon, G. (2011).
Development and parameterization of a time-invariant (equilibrium) material model for
segmented elastomeric polyureas. Proceedings of the Institution of Mechanical
Engineers, Part L: Journal of Materials: Design and Applications, 225(3), 182-194.
[78]. Grujicic, M., He, T., Pandurangan, B., Svingala, F. R., Settles, G. S., & Hargather,
M. J. (2012). Experimental characterization and material-model development for
microphase-segregated polyurea: an overview. Journal of Materials Engineering and
Performance, 21(1), 2-16.
[79]. Grujicic, M., Pandurangan, B., King, A. E., Runt, J., Tarter, J., & Dillon, G. (2011).
Multi-length scale modeling and analysis of microstructure evolution and mechanical
properties in polyurea. Journal of Materials Science, 46(6), 1767-1779.
[80]. Grujicic, M., & Pandurangan, B. (2012). Mesoscale analysis of segmental
dynamics in microphase-segregated polyurea. Journal of Materials Science, 47(8),
3876-3889.
[81]. Grujicic, M., Snipes, J., Ramaswami, S., Galgalikar, R., Runt, J., & Tarter, J.
(2013). Molecular-and domain-level microstructure-dependent material model for
nano-segregated polyurea. Multidiscipline Modeling in Materials and Structures.
[82]. Amirkhizi, A. V., Isaacs, J., McGee, J., & Nemat-Nasser, S. (2006). An
experimentally-based viscoelastic constitutive model for polyurea, including pressure
and temperature effects. Philosophical magazine, 86(36), 5847-5866.
[83]. Qi, H. J., & Boyce, M. C. (2005). Stress–strain behavior of thermoplastic
polyurethanes. Mechanics of materials, 37(8), 817-839.
[84]. Jiao, T., Clifton, R. J., & Grunschel, S. E. (2009, December). Pressure‐sensitivity
and constitutive modeling of an elastomer at high strain rates. In AIP Conference
Proceedings (Vol. 1195, No. 1, pp. 1229-1232). American Institute of Physics.
[85]. T. J. Holmquist and G. R. Johnson, “Response of silicon carbide to high velocity
impact,” J. Appl. Phys., vol. 91, no. 9, p. 5858, 2002.
[86]. G. R. Johnson and T. J. Holmquist, “An improved computational constitutive
model for brittle materials,” in AIP Conference Proceedings, 1994, vol. 309, pp. 981–
984.
[87]. T. J. Holmquist and G. R. Johnson, “Response of boron carbide subjected to high-
velocity impact,” Int. J. Impact Eng., vol. 35, no. 8, pp. 742–752, Aug. 2008.
[88]. G. R. Johnson, R. A. Stryk, S. R. Beissel, and T. J. Holmquist, in Shock
Compression of Condensed Matter, 2001.
Literature Review Chapter 2
30
[89]. R. Feng, G. F. Raiser, and Y. M. Gupta, J. Appl. Phys. 83, 79 (1998)
[90]. W. A. Bassett, M. S. Weathers, T. C. Wu, and T. J. Holmquist, J. Appl. Phys. 74,
3824 ~1993.
[91]. Johnson, G. R. (1983). A constitutive model and data for materials subjected to
large strains, high strain rates, and high temperatures. Proc. 7th Inf. Sympo. Ballistics,
541-547.
[92]. Hancock, J. W., & Mackenzie, A. C. (1976). On the mechanisms of ductile failure
in high-strength steels subjected to multi-axial stress-states. Journal of the Mechanics
and Physics of Solids, 24(2-3), 147-160.
[93]. Johnson, G. R., & Cook, W. H. (1985). Fracture characteristics of three metals
subjected to various strains, strain rates, temperatures and pressures. Engineering
fracture mechanics, 21(1), 31-48.
[94]. X. Wang and J. Shi, “Validation of Johnson-Cook plasticity and damage model
using impact experiment,” Int. J. Impact Eng., vol. 60, pp. 67–75, 2013.
[95]. N. S. Brar, V. S. Joshi, and B. W. Harris, “Constitutive model constants for
Al7075-T651 and Al7075-T6,” AIP Conf. Proc., vol. 1195, no. 1, pp. 945–948, 2009.
[96]. Y. Zhang, J. C. Outeiro, and T. Mabrouki, “On the selection of Johnson-Cook
constitutive model parameters for Ti-6Al-4V using three types of numerical models of
orthogonal cutting,” Procedia CIRP, vol. 31, pp. 112–117, 2015.
[97]. W.-S. Lee and G.-W. Yeh, “The plastic deformation behaviour of AISI 4340 alloy
steel subjected to high temperature and high strain rate loading conditions,” J. Mater.
Process. Technol., vol. 71, no. 2, pp. 224–234, 1997.
[98]. T. Børvik, M. J. Forrestal, O. S. Hopperstad, T. L. Warren, and M. Langseth,
“Perforation of AA5083-H116 aluminium plates with conical-nose steel projectiles -
Calculations,” Int. J. Impact Eng., vol. 36, no. 3, pp. 426–437, 2009.
[99]. A. H. Clausen, T. Børvik, O. S. Hopperstad, and A. Benallal, “Flow and fracture
characteristics of aluminium alloy AA5083-H116 as function of strain rate, temperature
and triaxiality,” Mater. Sci. Eng. A, vol. 364, no. 1–2, pp. 260–272, 2004.
[100]. N. K. Gupta, M. A. Iqbal, and G. S. Sekhon, “Experimental and numerical
studies on the behavior of thin aluminum plates subjected to impact by blunt- and
hemispherical-nosed projectiles,” Int. J. Impact Eng., vol. 32, no. 12, pp. 1921–1944,
2006.
[101]. W. K. RULE and S. E. Jones, “a Revised Form for the Johnson–Cook
Strength Model,” Int. J. Impact Eng., vol. 21, no. 8, pp. 609–624, 1998.

Literature Review Chapter 2
31
[102]. Mooney, M. (1940). A theory of large elastic deformation. Journal of applied
physics, 11(9), 582-592.
[103]. Rivlin, R. S. (1948). Large elastic deformations of isotropic materials IV.
Further developments of the general theory. Phil. Trans. R. Soc. Lond. A, 241(835),
379-397.
[104]. Grujicic, M., He, T., Pandurangan, B., Runt, J., Tarter, J., & Dillon, G. (2011).
Development and parameterisation of a time-invariant (equilibrium) material model for
segmented elastomeric polyureas. Proceedings of the Institution of Mechanical
Engineers, Part L: Journal of Materials: Design and Applications, 225(3), 182-194.
[105]. Ogden, R. W., & Deformations, N. L. E. (1984). Dover Publications
Inc. Mineola, NY, USA, 984.
[106]. Humphrey, J. D., & Yin, F. C. P. (1987). On constitutive relations and finite
deformations of passive cardiac tissue: I. A pseudostrain-energy function. Journal of
biomechanical engineering, 109(4), 298-304.
[107]. Qi, H. J., & Boyce, M. C. (2005). Stress–strain behavior of thermoplastic
polyurethanes. Mechanics of Materials, 37(8), 817-839.
[108]. Li, C., & Lua, J. (2009). A hyper-viscoelastic constitutive model for
polyurea. Materials letters, 63(11), 877-880.
[109]. Amirkhizi, A. V., Isaacs, J., McGee, J., & Nemat-Nasser, S. (2006). An
experimentally-based viscoelastic constitutive model for polyurea, including pressure
and temperature effects. Philosophical magazine, 86(36), 5847-5866.
[110]. Hallquist, J. O. (2006). LS-DYNA theory manual. Livermore software
Technology corporation, 3, 25-31.
[111]. Hallquist J. LS * DYNA3D theoretical manual. Livermore Software
Technology Corporation, May. 1998.
[112]. R. Vignjevic and J. Campbell, Review of Development of the Smooth Particle
Hydrodynamics (SPH) Method. 2009.
[113]. G. . Liu and M. . Liu, Smoothed Particle Hydrodynamics : A Meshfree
Particle Method. 2003.
[114]. S. Li and W. . Liu, Meshfree particle methods. 2004.
[115]. L. Schwer, “Preliminary Assessment of Non-Lagrangian Methods for
Penetration Simulation,” in Proceedings 8th International LS-DYNA Users Conference,
2004.
[116]. J. . Gray, J. . Monaghan, and R. . Swift, “SPH elastic dynamics,” Comput.

Literature Review Chapter 2
32
Methods Appl. Mech. Eng. Methods, vol. 190, no. 49–50, pp. 6641–6662, 2001.
[117]. M. Buyuk, C. D. . Kan, and N. Bedewi, “Moving beyond the finite elements,
a comparison between the finite element methods and meshless methods for a ballistic
impact simulation,” in Proceedings 8th International LS-DYNA Users Conference,
2004.
[118]. Sarkar S, Atluri S. Finite element analysis of rotor fragment impact on
containment structures. Comput Model Simulation Eng 1996;1:391}427.
[119]. LSTC, “LS-Dyna Manual Vol1,” 2016.
[120]. L. M. Bresciani, A. Manes, T. A. Romano, P. Iavarone, and M. Giglio,
“Numerical modelling to reproduce fragmentation of a tungsten heavy alloy projectile
impacting a ceramic tile: Adaptive solid mesh to the SPH technique and the cohesive
law,” Int. J. Impact Eng., vol. 87, pp. 3–13, 2016.
[121]. V. Babu, R. Thyagarajan, and J. Ramalingam, “Faster Method of Simulating
Military Vehicles Exposed to Fragmenting Underbody IED Threats,” in WCX 17: SAE
World Congress Experience, 2017.
[122]. A. Mardalizad, R. Scazzosi, A. Manes, and M. Giglio, “Four-point bending
test on a middle strength rock: Numerical and experimental investigations,” Frat. ed
Integrita Strutt., vol. 11, no. 41, pp. 504–523, 2017.
Experimental Methodology Chapter 3
33
Chapter 3
Experimental Methodology
In this chapter, synthesising of PUD & PUK polyurea is discussed in
the first section. The second section discusses the quasi-static tensile,
compression & shear test, hardness test and split Hopkinson pressure
bar test for polyurea. Then the method of ballistic experiment and the
equipment used for the ballistic experiment are explained in the third
section of this chapter. In the fourth section, the methods of
establishing the simulation model and material model used for
hydrocode simulation are described.
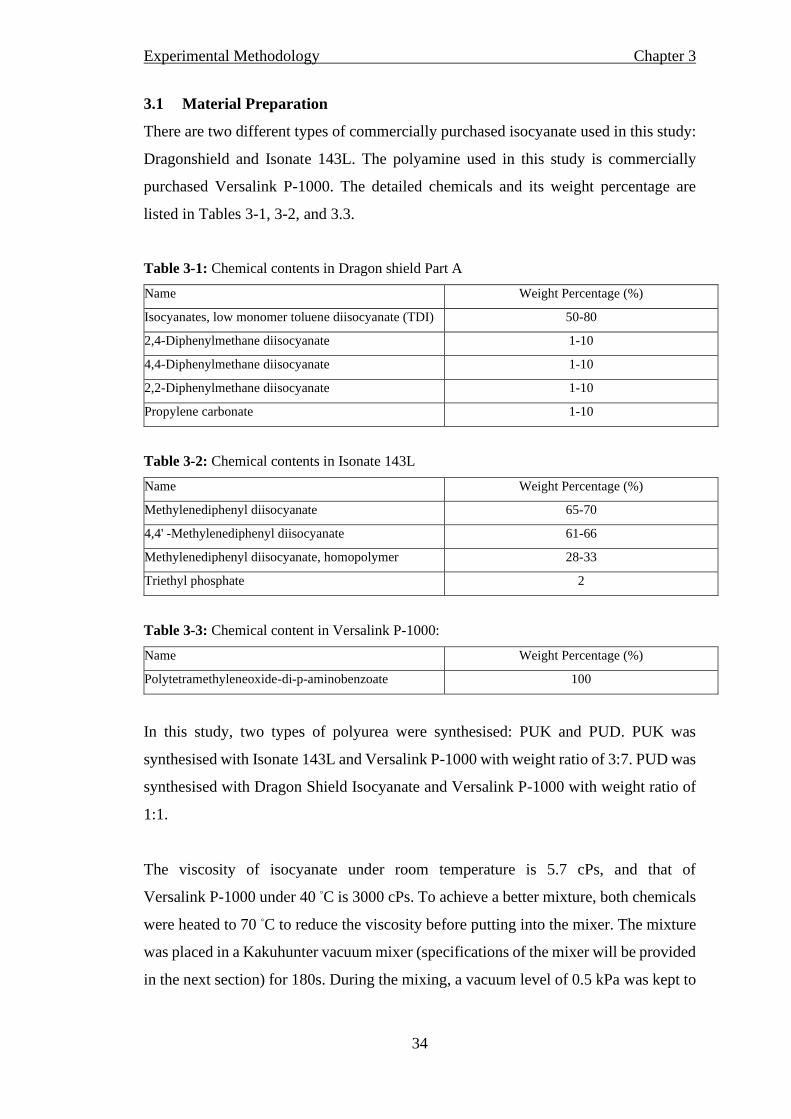
Experimental Methodology Chapter 3
34
3.1 Material Preparation
There are two different types of commercially purchased isocyanate used in this study:
Dragonshield and Isonate 143L. The polyamine used in this study is commercially
purchased Versalink P-1000. The detailed chemicals and its weight percentage are
listed in Tables 3-1, 3-2, and 3.3.
Table 3-1: Chemical contents in Dragon shield Part A
Name Weight Percentage (%)
Isocyanates, low monomer toluene diisocyanate (TDI) 50-80
2,4-Diphenylmethane diisocyanate 1-10
4,4-Diphenylmethane diisocyanate 1-10
2,2-Diphenylmethane diisocyanate 1-10
Propylene carbonate 1-10
Table 3-2: Chemical contents in Isonate 143L
Name Weight Percentage (%)
Methylenediphenyl diisocyanate 65-70
4,4' -Methylenediphenyl diisocyanate 61-66
Methylenediphenyl diisocyanate, homopolymer 28-33
Triethyl phosphate 2
Table 3-3: Chemical content in Versalink P-1000:
Name Weight Percentage (%)
Polytetramethyleneoxide-di-p-aminobenzoate 100
In this study, two types of polyurea were synthesised: PUK and PUD. PUK was
synthesised with Isonate 143L and Versalink P-1000 with weight ratio of 3:7. PUD was
synthesised with Dragon Shield Isocyanate and Versalink P-1000 with weight ratio of
1:1.
The viscosity of isocyanate under room temperature is 5.7 cPs, and that of
Versalink P-1000 under 40 ◦C is 3000 cPs. To achieve a better mixture, both chemicals
were heated to 70 ◦C to reduce the viscosity before putting into the mixer. The mixture
was placed in a Kakuhunter vacuum mixer (specifications of the mixer will be provided
in the next section) for 180s. During the mixing, a vacuum level of 0.5 kPa was kept to

Experimental Methodology Chapter 3
35
remove bubbles in the product. The revolution and rotation speed were set as 580 rpm
and 1700 rpm, respectively.
Polyurea was poured into an aluminium mould with the dimension of 250×250×20, as
shown in Figure 3-1. The thickness of the cavity varies from 7 to 11 mm to control the
thickness of polyurea interlayer. After being poured into the mould, polyurea was cured
at 90 ◦C for 24 hours.
Figure 3-1: Polyurea in aluminium model after the mixture
3.1.1 Planetary Mixer
The mixing of polyurea was carried out using a Kakuhunter SK-300TVSII mixer from
Shashin Kagaku Pte Ltd, Japan. The Kakuhunter SK-300TVSII mixer was revolution-
rotation mixer with a vacuum level of 0.1 kPa (Figure 3-2). The maximum revolution
speed and rotation speed are 1700 rpm and 1160 rpm, respectively. Bubble burst effect
would be induced by the revolution-rotation design under vacuum. As a result, material
would be well mixed and degassed simultaneously.
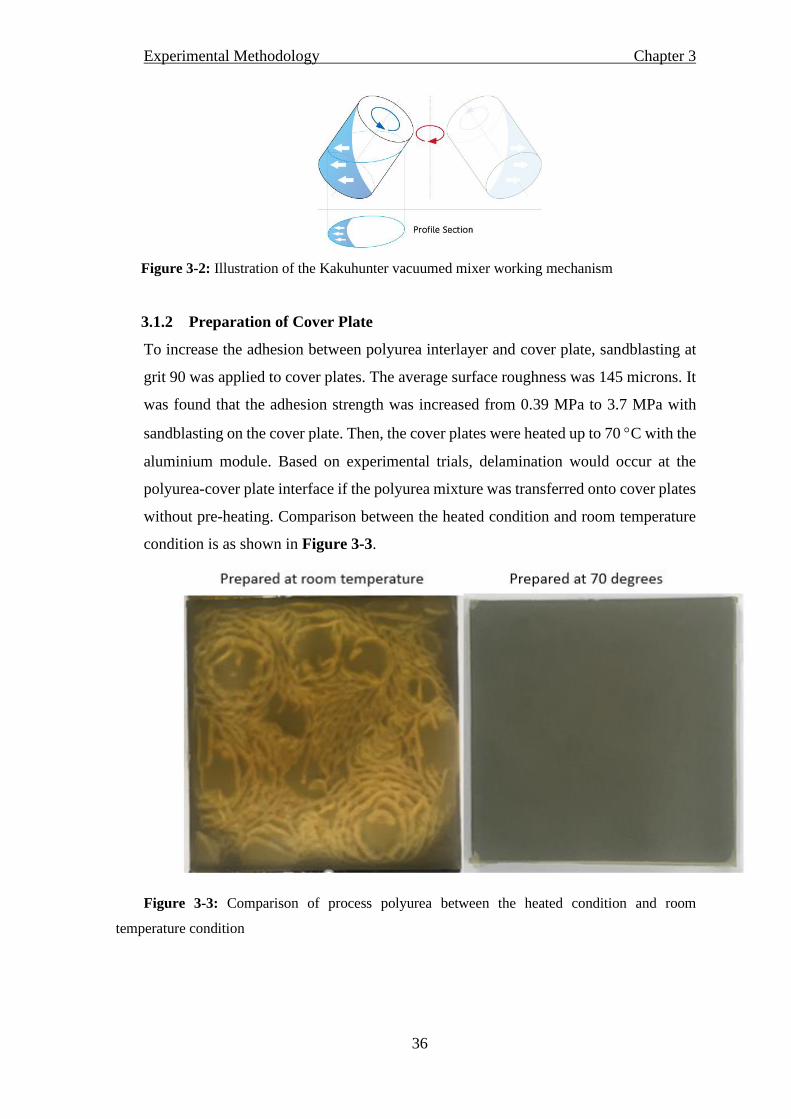
Experimental Methodology Chapter 3
36
Figure 3-2: Illustration of the Kakuhunter vacuumed mixer working mechanism
3.1.2 Preparation of Cover Plate
To increase the adhesion between polyurea interlayer and cover plate, sandblasting at
grit 90 was applied to cover plates. The average surface roughness was 145 microns. It
was found that the adhesion strength was increased from 0.39 MPa to 3.7 MPa with
sandblasting on the cover plate. Then, the cover plates were heated up to 70 C with the
aluminium module. Based on experimental trials, delamination would occur at the
polyurea-cover plate interface if the polyurea mixture was transferred onto cover plates
without pre-heating. Comparison between the heated condition and room temperature
condition is as shown in Figure 3-3.
Figure 3-3: Comparison of process polyurea between the heated condition and room
temperature condition

Experimental Methodology Chapter 3
37
3.2 Material Characterisation
3.2.1 Quasi-Static Tensile, Compression & Shear Test
The tensile test of polyurea was carried out using Instron 5500R mechanical test
machine with 30KN load cell as shown in Figure 3-4. The polyurea specimen was cut
to size according to ASTM-D638 standard. The dimensions of the specimen are
illustrated in Figure 3-5. The gauge length and width of specimens are 9.53 mm and
3.18 mm respectively. To ensure the test was in a quasi-static process, the strain rate of
the tensile test was set to be 10-4 s-1. A set of tested polyurea specimens are shown in
Figure 3-6. A typical tensile stress-strain curve for plastics is shown in Figure 3-7. [1]
The Young’s modulus, yield strength, failure strain and its fracture stress can be
obtained based on the test results. One cylindrical cutter with 6mm inner diameter
compressed with hydraulic compressor was used to prepare specimens for compression
tests. The cutter and prepared specimens are shown in Figure 3-8.
The quasi-static shear test was conducted with the jig shown in Figure 3-9. Cylindrical
specimens for the shear test were fabricated with 5 mm in diameter. The Instron
mechanical tester recorded the cutting force in the vertical direction. One 2 kN load cell
shown in Figure 3-10 was used to record the compressive & tensile force in the
horizontal direction.
Figure 3-4: Experimental setup for the tensile test
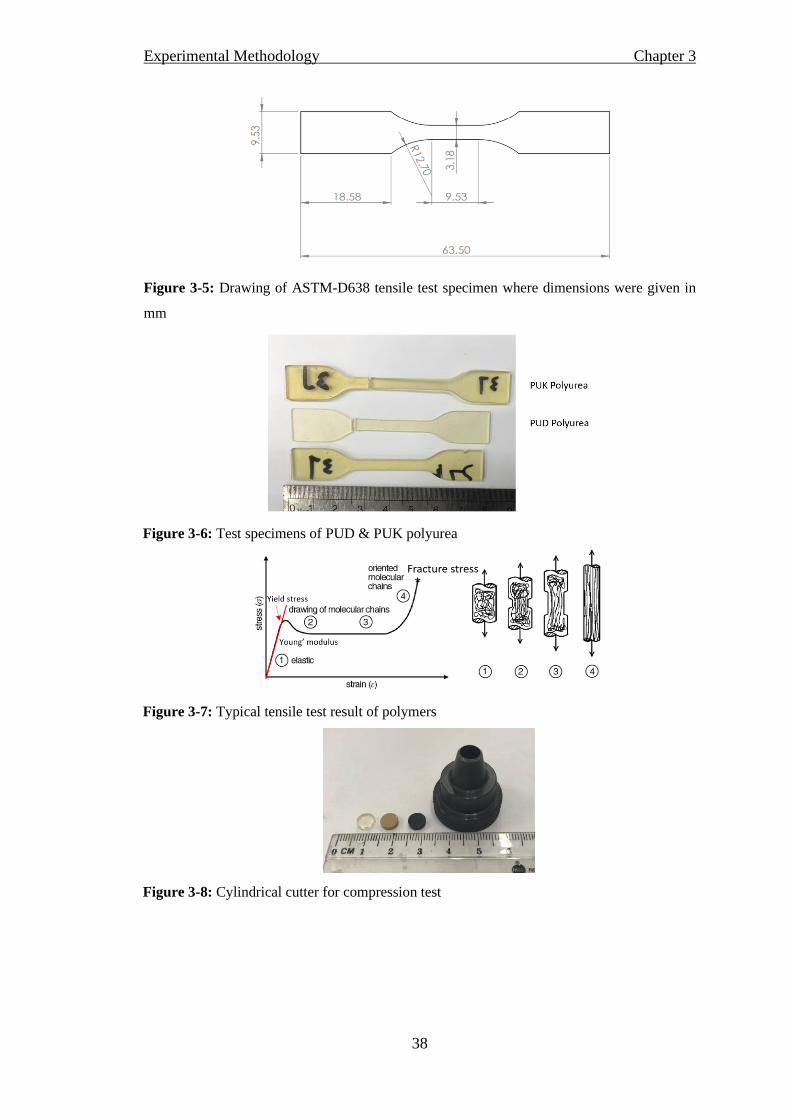
Experimental Methodology Chapter 3
38
Figure 3-5: Drawing of ASTM-D638 tensile test specimen where dimensions were given in
mm
Figure 3-6: Test specimens of PUD & PUK polyurea
Figure 3-7: Typical tensile test result of polymers
Figure 3-8: Cylindrical cutter for compression test

Experimental Methodology Chapter 3
39
Figure 3-9: Jigs for the shear test
Figure 3-10: Load cell used in the mechanical tests
3.2.2 Hardness Test
The hardness of polyurea sheet was tested with Teclock durometer type-A according to
ASTM-D-2240. The drawing for the durometer is shown in Figure 3-11. [16] When
the durometer was applied on the surface of polyurea, the indenter would pressurise the
spring behind it, then pressurised force by the spring would deform the polyurea, where
larger force corresponds to higher hardness. Different types of durometer are used for
different material characteristics and shape of surface. The differences are in the springs
and indenter shape.
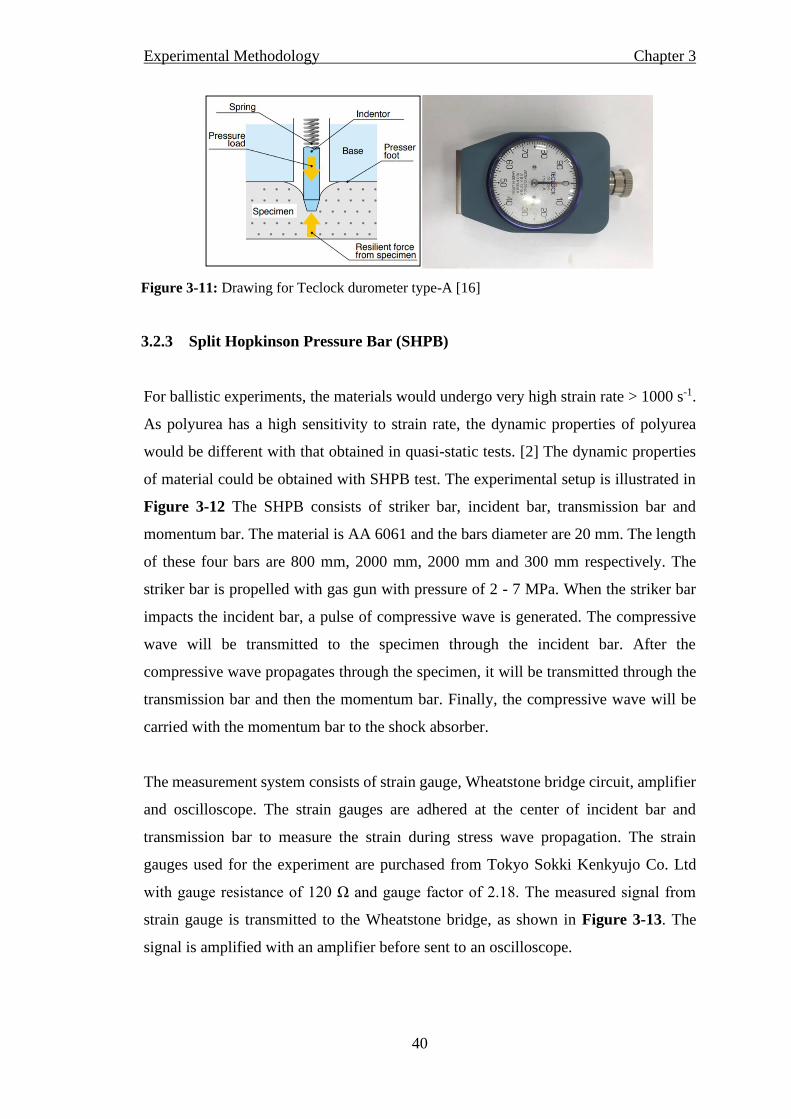
Experimental Methodology Chapter 3
40
Figure 3-11: Drawing for Teclock durometer type-A [16]
3.2.3 Split Hopkinson Pressure Bar (SHPB)
For ballistic experiments, the materials would undergo very high strain rate > 1000 s-1.
As polyurea has a high sensitivity to strain rate, the dynamic properties of polyurea
would be different with that obtained in quasi-static tests. [2] The dynamic properties
of material could be obtained with SHPB test. The experimental setup is illustrated in
Figure 3-12 The SHPB consists of striker bar, incident bar, transmission bar and
momentum bar. The material is AA 6061 and the bars diameter are 20 mm. The length
of these four bars are 800 mm, 2000 mm, 2000 mm and 300 mm respectively. The
striker bar is propelled with gas gun with pressure of 2 - 7 MPa. When the striker bar
impacts the incident bar, a pulse of compressive wave is generated. The compressive
wave will be transmitted to the specimen through the incident bar. After the
compressive wave propagates through the specimen, it will be transmitted through the
transmission bar and then the momentum bar. Finally, the compressive wave will be
carried with the momentum bar to the shock absorber.
The measurement system consists of strain gauge, Wheatstone bridge circuit, amplifier
and oscilloscope. The strain gauges are adhered at the center of incident bar and
transmission bar to measure the strain during stress wave propagation. The strain
gauges used for the experiment are purchased from Tokyo Sokki Kenkyujo Co. Ltd
with gauge resistance of 120 Ω and gauge factor of 2.18. The measured signal from
strain gauge is transmitted to the Wheatstone bridge, as shown in Figure 3-13. The
signal is amplified with an amplifier before sent to an oscilloscope.

Experimental Methodology Chapter 3
41
Figure 3-12: Experimental setup of Split-Hopkinson Pressure bar for dynamic compressive
test
Figure 3-13: Illustration of opposite half bridge setup for strain gauge and Wheatstone bridge
[3]
Before experiment, the alignment of bars was checked with blank test without specimen.
With good alignment of bars, the compressive stress wave would propagate through the
incident bar and transmission bar and single pulse of signal would be recorded. If
misalignment exists, reflected pulse would be recorded in the incident bar. One set of
recorded stress wave in incident bar with and without good alignment are shown in
Figure 3-14.

Experimental Methodology Chapter 3
42
Figure 3-14: (a) Compressive stress wave in bars with good alignment and (b) stress wave in
bars with misalignment [4]
Assuming no dispersion of stress waves, the recorded strain by strain gauges were equal
to the strain at bar ends. Based on 1-dimenssional stress wave theory, the stress strain
and strain rate could be calculated with following equations
𝜀̇ =2𝐶𝐵𝜀𝑅(𝑡)
𝐿𝑠 (19)
ε =2𝑉𝐵 ∫ 𝜀𝑅(𝑡)𝑑𝑡
𝑡
0
𝐿𝑠 (20)
σ =𝐴𝐵
𝐴𝑠𝐸𝐵𝜀𝑡(t) (21)
𝜀̇ =2𝐶𝐵𝜀𝑅(𝑡)
𝐿𝑠
(22)
where 𝜀𝑅 and 𝜀𝑡 are the recorded reflected strain in incident bar and transmitted
strain in transmission bar respectively; the EB, VB and AB are the Young’s modulus,
sound speed and cross-sectional area of the aluminium bars; As and Ls are the cross-
sectional area and length of specimen respectively.

Experimental Methodology Chapter 3
43
3.3 Ballistic Experiment
3.3.1 Two-Stage Gas Launcher
The two-stage gas launcher, shown in Figure 3-15, was fabricated by Thiot Ingenierie
and used for ballistic experiments. High purity helium gas was used to drive the gas
launcher. The projectile was loaded at the left end of launch tube while a 9 kg piston
was loaded at the end of reservoir and the pump tube was vacuumed to 0.1 mbar. Then,
the pump tube and reservoir were filled with 6 bar and 200 - 300 bar of high purity
helium, respectively.
The firing process was separated into two stages. In the first stage, the high-pressured
helium gas in the reservoir was released to propel the 9 kg piston to velocity of 150 m/s.
At the same time, the piston compressed the helium gas in pump tube into high pressure
section (HP). The pressure in high pressure could be compressed to 3000 bar when the
piston reaches the high-pressure section. In the second stage, the exceptionally high
pressure in HP would propel the projectile to accelerate in the launch tube. The
maximum velocity of the projectile was 1400 m/s. To reduce the yaw of projectile, the
expansion chamber and target chamber were vacuumed to 200 mbar during the test.
Software Cesar32 was provided by Thiot Ingenierie to predict projectile velocity by
counting parameters including the weight of the projectile package, weight of the piston,
pressure in pump tube and reservoir and pump tube friction coefficient.
Figure 3-15: Drawing of two stage gas launcher in Ma Jan High Speed Dynamics Laboratory
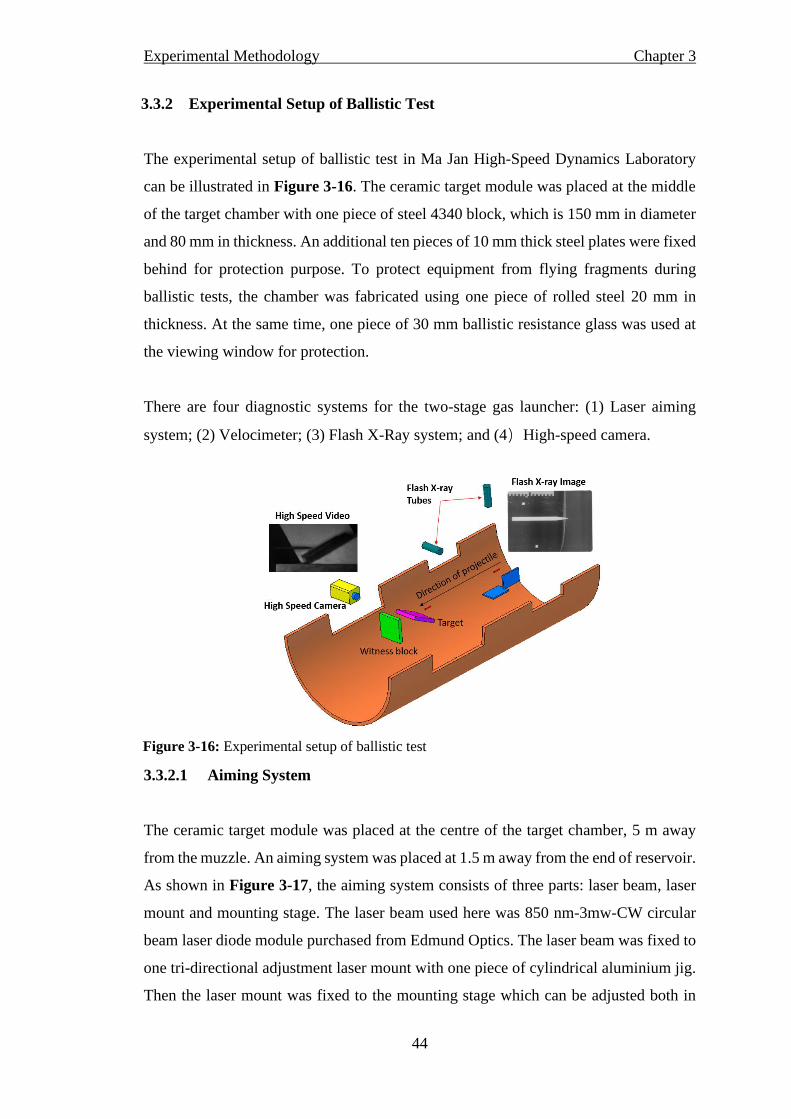
Experimental Methodology Chapter 3
44
3.3.2 Experimental Setup of Ballistic Test
The experimental setup of ballistic test in Ma Jan High-Speed Dynamics Laboratory
can be illustrated in Figure 3-16. The ceramic target module was placed at the middle
of the target chamber with one piece of steel 4340 block, which is 150 mm in diameter
and 80 mm in thickness. An additional ten pieces of 10 mm thick steel plates were fixed
behind for protection purpose. To protect equipment from flying fragments during
ballistic tests, the chamber was fabricated using one piece of rolled steel 20 mm in
thickness. At the same time, one piece of 30 mm ballistic resistance glass was used at
the viewing window for protection.
There are four diagnostic systems for the two-stage gas launcher: (1) Laser aiming
system; (2) Velocimeter; (3) Flash X-Ray system; and (4)High-speed camera.
Figure 3-16: Experimental setup of ballistic test
3.3.2.1 Aiming System
The ceramic target module was placed at the centre of the target chamber, 5 m away
from the muzzle. An aiming system was placed at 1.5 m away from the end of reservoir.
As shown in Figure 3-17, the aiming system consists of three parts: laser beam, laser
mount and mounting stage. The laser beam used here was 850 nm-3mw-CW circular
beam laser diode module purchased from Edmund Optics. The laser beam was fixed to
one tri-directional adjustment laser mount with one piece of cylindrical aluminium jig.
Then the laser mount was fixed to the mounting stage which can be adjusted both in
Experimental Methodology Chapter 3
45
horizontal and vertical direction. Calibration test was carried out by marking the laser
point on a steel 4340 target for the DOP test. By comparing the position of crater and
the marking on the target, a precision of ± 3mm from impact point was expected. Figure
3-18 shows the laser beam indicating the impact point of projectile on the target.
Figure 3-17: Image of the aiming system
Figure 3-18: Image of target with aiming the impact point
3.3.2.2 Velocimeter
VMS 600 velocimeter shown in Figure 3-19 was used to measure the velocity of
projectile at the muzzle of launch tube. To measure the velocity of projectile, two sets
of parallel laser beams were mounted to one steel tube which was place at a distance of
500 mm from the muzzle of launch tube. The two sets of laser beams were separated in
distance of 200 mm as shown in Figure 3-20. When the projectile passing through one

Experimental Methodology Chapter 3
46
set of the laser beams, laser between the two beams would be blocked by the projectile.
At the same time, a signal pulse would be sent to the machine. By recording the time
interval of two signals, the velocity of projectile can be calculated by the equipment.
Figure 3-19: Image of VMS 600 velocimeter for measuring the projectile velocity
Figure 3-20: Schematic illustration of velocimeter
3.3.2.3 Flash X-ray System
As shown in Figure 3-16, one set of X-ray tubes were vertically located at 2 meters in
front of the target to capture the yaw of projectile. Another set of flash X-ray tubes were
located at 100 mm behind the target. The flash X-ray system used in the experiment
was SCF 150 flash X-ray purchased from Scandiflash AB, Sweden. The generated flash
X-ray is able to penetrate a 3 mm steel plate. The X-ray images of projectile were
captured with reusable X-ray film purchased from DURR NDT, Germany.
An electronic triggering system was designed to capture the image of projectile. As
shown in Figure 3-21, one printed circuit was used as the trigger foil. The trigger foil
was printed with two sets of electrical pathways and was separated with 2 mm gaps.

Experimental Methodology Chapter 3
47
One 12 V constant voltage source was applied at the two terminals of the trigger foil.
When the projectile perforated the trigger foil, the projectile would connect circuits as
a bridge. Then one trigger pulse would be generated to the control panel to activate the
flash X-ray system. The first set of X-ray tubes was triggered at 3 μs after receiving the
signal. This set of X-ray tubes can capture the pitch and yaw of the projectile. It was
suggested that the total yaw of projectile should go below 2°. [5][6] To ensure the
validity of experimental results, one 3 mm steel reference bar, which had been
calibrated with laser system, was placed at side of image film. The second X-ray tube
was triggered at 900 µs after the first set of X-ray tubes. The third X-ray tube was
triggered at 960 µs after the first set of X-ray tubes. This set of X-ray tubes can capture
the residual projectile, which provides the residual velocity and residual length of
projectile. The residual velocity could be calculated by dividing the distance between
two images of the residual projectile with the delayed time (60 µs). A typical post
penetration image is shown in Figure 3-22. The post penetration image could be used
to evaluate the performance of armor modules by comparing the residual length and
residual velocity of the residual projectile. Software D-Tect was used to measure the
pitch/yaw of projectiles.
Figure 3-21: The trigger foil for flash X-ray system

Experimental Methodology Chapter 3
48
Figure 3-22: X-Ray Image for post penetration analysis
3.3.2.4 High Speed Camera
High speed camera was used to capture the penetration progress of projectile into
ceramic armor modules. This high-speed video could provide information such as
penetration time of projectile, deformation profile of cover and backing plate. The high-
speed camera used in experiments was Photron model SA5 from Japan. As an example,
the image shown in Figure 3-23 was recorded at 150,000 fps and resolution of 256×144
pixels. The recording time was set as 2 seconds to provide sufficient window to capture
the penetration process. To provide clear high-speed video, non-flicker LED light was
used to illuminate the target. A white Styrofoam was placed behind the target to
increase the contrast.
Figure 3-23: Image of recorded high-speed video
Experimental Methodology Chapter 3
49
3.3.3 Projectile
Dimensions of conical nosed tungsten alloy long are rod shown in Figure 3-24. The
tungsten alloy long rods were 8.3 mm in diameter and 115 mm in length, giving the
L/D ratio of the projectile to be 13.8. The tungsten alloy was fabricated with 93% of
tungsten, 3% of iron and 4% of nickel. This tungsten alloy has a typical elongation of
25% and yield strength of 700 MPa.
Figure 3-24: Schematic of conical nosed tungsten alloy long rod
As shown in Figure 3-25, the projectile package consists of one tungsten alloy long
rod, 4 pieces of sabots, one piece of baser and one piece of pusher. The pusher
fabricated with nylon would be propelled by compressed helium gas in high pressure
section during firing. A baser fabricated with AA 7075 was placed between projectile
and pusher to prevent the pusher from yielding during acceleration. Sabots were
fabricated with polycarbonate to guide the projectile to accelerate in the launch tube.
After the projectile was propelled out of the muzzle of launch tube, sabots would be
separated symmetrically by air in expansion chamber. One typical opening of sabots in
expansion chamber is shown in Figure 3-26.
Experimental Methodology Chapter 3
50
Figure 3-25: Projectile package for the ballistic experiment
Figure 3-26: Image of projectile in expansion chamber captured by high speed camera
3.3.4 Target Fabrication
The configuration of ceramic target module is illustrated in Figure 3-27. The ceramic
target module consists of four main parts: cover plate, polyurea interlayer, silicon
carbide ceramic tile, and backing plate. The thickness of each component is listed in
the Table 3-4.
Table 3-4: Thickness of cover plate, interlayer, ceramic tile and backing plate.
Oblique test Nominal test
Component Name Thickness (mm) Thickness (mm)
Cover plate 5 5
Polyurea Interlayer 0-3 0-6
Ceramic Tile 20 20
Backing plate 7 10

Experimental Methodology Chapter 3
51
Figure 3-27: Sectioned view of ceramic target module for ballistic test
The cover plate for the nominal impact test was fabricated with AISI 4340 steel plates.
According to preliminary simulation results, the projectile could not penetrate the
ceramic armor module using 5 mm AISI 430 steel plate cover plate. So, the cover plate
for the oblique test was fabricated with grade 5 Titanium alloy which has a yield
strength of 828 MPa and elongation of 10%. Silicon carbide ceramic tiles grade F plus
from 3M Technical Ceramics, Germany were used for this study. The backing plates of
ceramic target modules were fabricated with AISI 4340 steel.
Before the assembling of the target module, sandblasting at grit 90 was carried out on
the cover plates and AISI 4340 steel backing plates for better adhesion. The average
surface roughness was 145 microns. Then the mixed polyurea was poured into the
Aluminium mould as shown in Figure 3-1 with placing the cover plate at the bottom.
The Loctite EA9309.3NA two-part epoxy adhesive was used for adhesion between
ceramic tile and backing plate. The part A and part B of adhesive were mixed to the
weight ratio of 100:22 using the planetary mixer, which was discussed in section 3.1.2,
for 3 min.
Hydraulic press from Enerpac shown in Figure 3-28 was used to apply a load of 1 kN
onto ceramic tile during fabrication of target module. This is to control the thickness of
adhesive layer between silicon carbide and backing plate to 0.13 mm. The load was
held for one hour to prevent air gap formation between ceramic tile and backing plate.

Experimental Methodology Chapter 3
52
The adhesive was cured at 82 °C for 3 hours. Then it was cooled down to room
temperature and held for 12 hours before testing.
Figure 3-28: Figure of hydraulic press to compress ceramic into target module
3.3.5 Ballistic Performance of Ceramic Armor Module
The depth of penetration (DOP) test is widely used to investigate the performance of
ceramic armors. [7 - 9] With the result from DOP tests, Mass Efficincy (ME) [10] was
calculated with the Equation (23) to evaluate the performance of ceramic armor module
𝑀𝐸 =𝜌𝑠 𝑃𝑟𝑒𝑓
𝐴𝐷𝑚𝑜𝑑𝑢𝑙𝑒 + 𝜌𝑠 𝑃𝑟𝑒𝑓
(23)
where ρs is the density AISI 4340 steel block; Pref and Pres are the reference DOP and
residual DOP. The value of ADmodule= 𝑚
𝐴 is the area density of the ceramic armor
module. m is the mass of ceramic armor module, and A is the area of the ceramic armor
module. To find the reference DOP, Goh W.L and Y. Zheng did a series of DOP tests
of long rod projectile against AISI 4340 steel semi-infinite targets in the velocity range
of 1000 m/s to 1400 m/s. They found the relationship between DOP and impact velocity
could be calculated with Equation 24:
𝐷𝑂𝑃 = 0.1091𝑉 − 71.52 (24)
where V is the impact velocity.

Experimental Methodology Chapter 3
53
To obtain the residual DOP of the test, one piece of AISI 4340 block, which was 150
mm in diameter and 80 mm in thickness, was placed at back of ceramic armor module
as the witness block. The residual DOP is calculated with following equation, [10]
𝑃𝑅𝑒𝑠 = 𝑡𝑏 − 𝑡𝑟 (25)
where tr and tb were the residual thickness and the total thickness of the witness block,
as illustrated in Figure 3-29.
Figure 3-29: Illustration for measurement of DOP [10]
3.4 Hydrocode Simulation
The ballistic experiments were examined with explicit finite element method carried
out with LS-Dyna version 8.0 by LSTC, USA. LS-Dyna pre-post software was used for
model building, post simulation analysis.
3.4.1 Simulation Model for Materials
FEM and SPH were used for building simulation model of ballistic experiments. An
overview of simulation model is shown in Figure 3-30. The projectile was built with
SPH with diameter of 0.4 mm. The armor model and witness block were built with
FEM elements with element size of 1 mm. The polyurea interlayer was built with FEM
elements which has an element size of 0.5 mm. For cover plate and ceramic block, they
were built with both FEM and SPH with using keyword
“DEFINE_ADAPTIVE_SOLID_TO_SPH”. SPH nodes were coupled with FEM
elements at beginning. When deletion criteria of FEM elements were reached, the SPH

Experimental Methodology Chapter 3
54
nodes replace FEM and carried on the simulation continually after transferring
information from FEM to SPH. This method would maintain the confinement pressure
of surrounding elements when FEM elements are deleted. As a result, the accuracy of
simulation would be improved as ceramic strength is pressure dependent.
The keywords CONTACT_ERODING_SURFACE_TO_SURFACE and
CONTACT_ERODING_NODES_TO_SURFACE were used for the contact between
parts in simulation. The keyword CONTACT_AUTOMATIC_SURFACE_TO
_SURFACE_TIEBREAK was used to represent the adhesion between ceramic and
backing plate/polyurea interlayer and cover plate. The nodes of interface were joined
together at the beginning. The joint surfaces were separated when the tensile stress
reached 200 MPa.
All simulations were carried out with half model with assuming symmetric penetration
process. The computation time for each simulation was 10-12 hours.
Figure 3-30: Image of a simulation model for ballistic experiment
3.4.2 Simulation Model
The parameters of materials used in simulation are listed in this section.

Experimental Methodology Chapter 3
55
3.4.2.1 Metallic Materials
The JC model was used for tungsten alloy, titanium and AISI 4340 steel in simulations.
The parameters of tungsten alloy were obtained from the Hokinson Bar test carried out
by Goh et al. [10] An empirical relationship between parameters of steel and its
hardness was established by Deniz et al. [11] In this study, the AISI 4340 steel with
hardness of 30 HRC was used. The parameters were obtained accordingly. The material
parameters of titanium alloy were obtained from the work of Hubert, [12] Dandikar [13]
and Burkins [14].

Experimental Methodology Chapter 3
56
These parameters are listed in the Table 3-5.
Table 3-5: Parameter of metallic materials in simulation
Parameter AISI 4340 Tungsten alloy Titanium alloy
A (MPa) 719 697 896
B (MPa) 456 1160 656
C 0.008 0.056 0.0128
M 1.03 1 0.8
N 0.093 0.626 0.5
Density (g/cm3) 7.85 17.6 4.43
Young’s Modulus (GPa) 201 320 113.8
Shear Modulus (GPa) 78 160 42.4
Melting Temperature (K) 1723 1730 1605
Poisson’s Ratio 0.29 0.29 0.342
3.4.2.2 Silicon Carbide
The JH-1 model was used for the simulation of silicon carbide in this study. The
parameters of SiC used in simulation were obtained from literature. [15] The tensile
strength of SiC F plus used in experiment was chosen to be 450 MPa after validation
with reference experimental data. The detailed parameters are listed in the Table 3-6.
Experimental Methodology Chapter 3
57
Table 3-6: Parameters of JH-1 model for Silicon Carbide F Plus tiles
Parameters SiC F Plus
Intact Strength Constant, S1 (MPa) 7100
Intact Strength Constant, S2 (MPa) 12200
Intact Strength Constant, P1 (MPa) 2500
Intact Strength Constant, P2 (MPa) 10000
Strain Rate Coefficient, C 0.01
Tensile Strength, T (MPa) 450
Maximum Fracture Strength, 𝑆𝑚𝑎𝑥𝑓
(MPa) 1300
Failed Strength Constant, α 0.4
Damage Constant, 𝜀𝑚𝑎𝑥𝑓
0.8
Damage Constant, φ 0.8
Damage Constant, P3 99750
3.4.2.3 Polyurea
The MAT_024 piecewise linear plasticity in LS-DYNA was used for the simulation of
polyurea interlayer in this study. A set of SHPB tests were conducted to obtain the
dynamic behaviour of polyurea. As shown in Figure 3-31: Flow stress of polyurea at
20% strain under different strain rates were used to find the strain rate effect coefficient
in the piecewise linear plasticity module through data fitting. The fitting result is
displayed in Table 3-7
Figure 3-31: Flow stress of polyurea at 20% strain under different strain rate
Table 3-7: Parameters of Piecewise Linear Plasticity for PUD & PUK polyurea
Parameter PUD PUK

Experimental Methodology Chapter 3
58
C 0.043 23.36
P 3.09 2.69
References
[1] Schümann, K., Röhr, U., Schmitz, K. P., & Grabow, N. (2016). Conversion of
engineering stresses to Cauchy stresses in tensile and compression tests of
thermoplastic polymers. Current Directions in Biomedical Engineering, 2(1), 649-652.
[2] Sarva, S. S., Deschanel, S., Boyce, M. C., & Chen, W. (2007). Stress–strain behavior
of a polyurea and a polyurethane from low to high strain rates. Polymer, 48(8), 2208-
2213.
[3] “Strain-gauge Wiring Systems.” [Online]. Available: http://www.kyowa-
ei.com/eng/technical/strain_gages/wiring.html.
[4] W. W. Chen and B. Song, Split Hopkinson (Kolsky) Bar: Design, Testing and
Applications. 2013.
[5] Bjerke, T. W., Silsby, G. F., Scheffler, D. R., & Mudd, R. M. (1992). Yawed long-
rod armor penetration. International journal of impact engineering, 12(2), 281-292.
[6] Bless, S. J., Barber, J. P., Bertke, R. S., & Swift, H. F. (1978). Penetration mechanics
of yawed rods. International Journal of Engineering Science, 16(11), 829-834.
[7] Normandia, M. J., & Gooch, W. A. (2002). An overview of ballistic testing methods
of ceramic materials. Ceramic transactions, 134, 113-138.
[8] Bryn James, Depth of penetration testing, Ceramic Armor materials by Design,
Ceramic Transactions, 134 (2002) 165-172.
[9] S G Savio, K Ramanjaneyulu, V Madhu, T Balakrishna Bhat, An experimental study
on ballistic performance of boron carbide tiles, International Journal of Impact
Engineering, Vol.38 (7), 2011, 535-541.
[10] Goh W.L, Y. Zheng, J. Yuan, and K W. Ng, “Effects of hardness of steel on ceramic
armor module against long rod impact”, International Journal of Impact Engineering,
Vol. 109,pp. 419-426. 2017
[11] T. Deniz and R. O. Yildirim, “Ballistic penetration of hardened steel plates,” in
27th International Symposium on Ballistics, 2013, pp. 1390–1401
[12] Hubert W. Meyer Jr. and David S. Kleponis, “Modeling the High Strain Rate
Behavior of Titanium Undergoing Ballistic Impact And Penetration”, International
Journal of Impact Engineering,vol. 26, pp. 509-521, 2001.
Experimental Methodology Chapter 3
59
[13] Dandekar, D. P., and Spletzer, S. V. "Shock Response of Ti-6AI-4V." Ed. M. D.
Furnish, L.C. Chhabildas, and R.S. Hixon, Proceedings of the Conference of the
American Physical Society Topical Group on Shock Compression of Condensed Matter,
pp. 427-430, Jun 1999.
[14] Wells, M., Burkins, M., Fanning, J., and Roopchand, B. "The Mechanical and
Ballistic Properties of ElectronBeam Cold-Hearth Single-Melt Ti-6AI-4V Plate."
Presented at the 9th World Conference on Titanium, SL Petersburg, Russia, 7-11 June
1999.
[15] T. J. Holmquist and G. R. Johnson, “Characterisation and evaluation of silicon
carbide for high-velocity impact,” J. Appl. Phys., vol. 97, no. 9, p. 93502, 2005.
[16]"Durometers & IRHD Hardness Tester" [online], available:
http://www.teclock.co.jp/E_10durometer.pdf

Results and Discussion: Experiment Chapter 4
60
Chapter 4
Results and Discussion: Experiment
In this chapter, quasi-static tensile, compression and shear test,
SHPB test are applied to two types of polyurea materials: PUD and
PUK polyurea. From the results, it shows that both types of polyurea
have high strain rate sensitivity. PUK polyurea has a higher strength,
and PUD polyurea has a larger elongation. Ballistic experiments
were conducted to investigate the accuracy of simulation modelling
and the effect of polyurea as inter-layer in ceramic armors. The
results show that polyurea can improve the ballistic performance of
ceramic armor module when used as the interlayer.

Results and Discussion: Experiment Chapter 4
61
4.1 Quasi-static Test and Hardness Test Results
A series of quasi-static tensile & compression tests were carried out under a strain rate
of 6×10⁻⁴ s-1 using Instron mechanical test machine. The effect of the weight percentage
of isocyanate and the effect of curing temperature were investigated to provide suitable
polyurea mechanical properties for this study.
4.1.1 Quasi-static Tensile Test
A series of quasi-static tensile tests were conducted to investigate the effect of weight
ratio between isocyanate and polyamine. It was found that, for PUD which was
synthesised with Versalink P-1000 and dragon shield isocyanate, the optimised weight
ratio is 1:1. When the weight percentage of dragon shield isocyanate was higher than
55%, the synthesised PUD polyurea could not be fully cured after 24 hr under 60 C.
The synthesised PUD polyurea would have bubble after 24 hr of curing under room
temperature when the weight percentage of dragon shield isocyanate was lower than
45%. As shown in Table 4-1, the weight percentage of Isonate 143L was varied from
20% to 50% to optimise the mechanical property of PUK polyurea. All tested samples
were cured under 90 ◦C for 24 hours.
Table 4-1: Weight percentage of Isonate 143L for four types of polyurea materials
Test set number Weight percentage of Isonate 143L (%)
S1 20
S2 30
S3 40
S4 50

Results and Discussion: Experiment Chapter 4
62
Figure 4-1: Quasi-static tensile test results for various weight percentage of Isonate 143L
Figure 4-2: Quasi-static tensile test results for 30% Isonate 143L PUK polyurea cured under
different temperatures for 24 hours

Results and Discussion: Experiment Chapter 4
63
Figure 4-3: Quasi-static tensile test results for 40% Isonate 143L PUK polyurea cured under
different temperatures for 24 hours
Figure 4-4: Quasi-static tensile test results for PUK and PUD
The flow stress of polyurea at 100% tensile strain is used in this section for comparison.
The experimental results in Figure 4-1 show that the mechanical property of polyurea
varies with changing weight percentage of Isonate 143L in polyurea. Polyurea has the
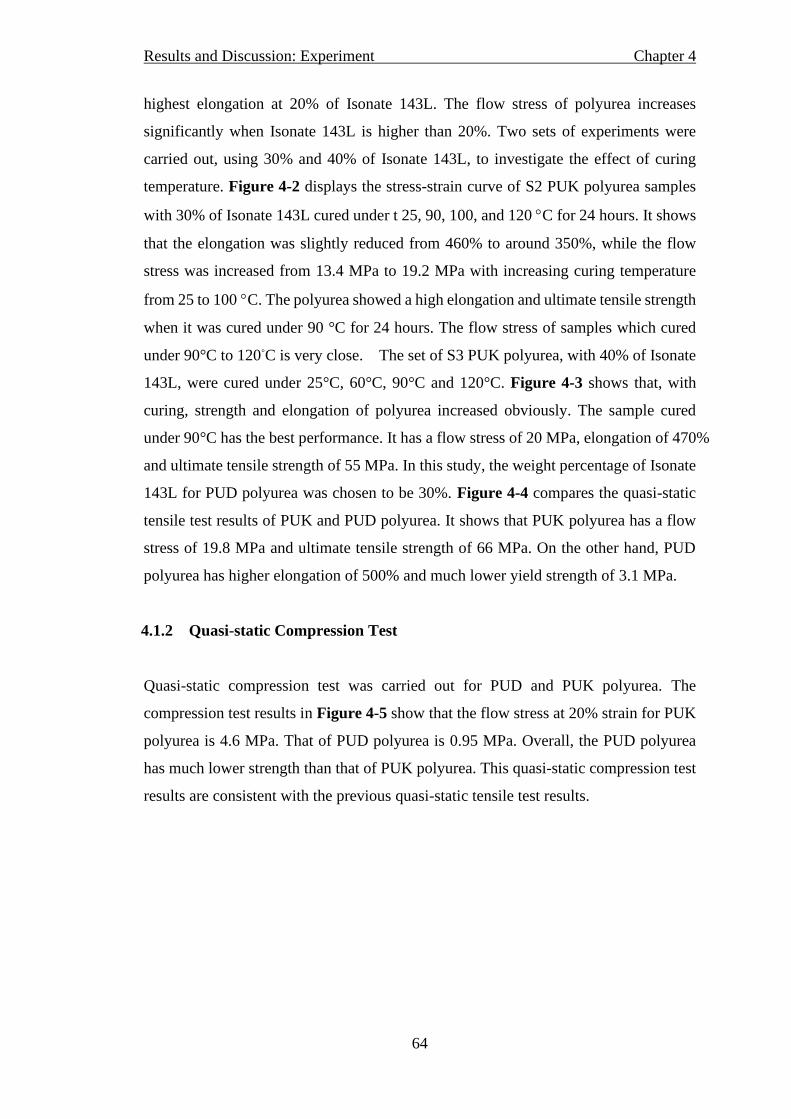
Results and Discussion: Experiment Chapter 4
64
highest elongation at 20% of Isonate 143L. The flow stress of polyurea increases
significantly when Isonate 143L is higher than 20%. Two sets of experiments were
carried out, using 30% and 40% of Isonate 143L, to investigate the effect of curing
temperature. Figure 4-2 displays the stress-strain curve of S2 PUK polyurea samples
with 30% of Isonate 143L cured under t 25, 90, 100, and 120 C for 24 hours. It shows
that the elongation was slightly reduced from 460% to around 350%, while the flow
stress was increased from 13.4 MPa to 19.2 MPa with increasing curing temperature
from 25 to 100 C. The polyurea showed a high elongation and ultimate tensile strength
when it was cured under 90 °C for 24 hours. The flow stress of samples which cured
under 90°C to 120◦C is very close. The set of S3 PUK polyurea, with 40% of Isonate
143L, were cured under 25°C, 60°C, 90°C and 120°C. Figure 4-3 shows that, with
curing, strength and elongation of polyurea increased obviously. The sample cured
under 90°C has the best performance. It has a flow stress of 20 MPa, elongation of 470%
and ultimate tensile strength of 55 MPa. In this study, the weight percentage of Isonate
143L for PUD polyurea was chosen to be 30%. Figure 4-4 compares the quasi-static
tensile test results of PUK and PUD polyurea. It shows that PUK polyurea has a flow
stress of 19.8 MPa and ultimate tensile strength of 66 MPa. On the other hand, PUD
polyurea has higher elongation of 500% and much lower yield strength of 3.1 MPa.
4.1.2 Quasi-static Compression Test
Quasi-static compression test was carried out for PUD and PUK polyurea. The
compression test results in Figure 4-5 show that the flow stress at 20% strain for PUK
polyurea is 4.6 MPa. That of PUD polyurea is 0.95 MPa. Overall, the PUD polyurea
has much lower strength than that of PUK polyurea. This quasi-static compression test
results are consistent with the previous quasi-static tensile test results.

Results and Discussion: Experiment Chapter 4
65
Figure 4-5: Quasi-static compression test results for PUK and PUD
4.1.3 Quasi-static Shearing Test
Quasi-static shear test for the two types of polyurea was carried out to investigate the
shear behaviour of polyurea under pressure. The experimental results in Figure 4-6
reveal that the strength and shear modulus of PUK polyurea increased with increasing
applied compressive pressure. Test result in Figure 4-8 shows that the ultimate shear
stress slightly increased when tensile strength was applied to PUK polyurea, while the
shear modulus decreased slightly when tensile pressure was applied. Figure 4-7 shows
that there is no significant yield stress for the PUD polyurea. However, apparent yield
strength was obtained when the compressive load was applied to the PUD polyurea.
The shear modulus of PUD polyurea linearly increased with increasing applied
compressive pressure. As shown in Figure 4-9, the ultimate shear stress slightly
increased when a tensile pressure was applied. The fracture shear strain was
significantly reduced from 80% to 44%. The test results show that the shear modulus
increase with increasing applied compressive stress. PUD has higher sensitivity
compared with PUK polyurea. The mechanical property of polyurea did not change
much when tensile strength was applied. This was due to that the applied tensile
strength was low compared with compressive stress. It was challenging to increase the

Results and Discussion: Experiment Chapter 4
66
applied tensile stress as the strength of polyurea was low for both types of polyurea.
Large deformation was observed when 5 MPa of tensile pressure was applied.
Figure 4-6: Quasi-static shear test results for PUK polyurea under pre-compression
Figure 4-7: Quasi-static shear test results for PUD polyurea under pre-compression
Figure 4-8: Quasi-static shear test results for PUK polyurea under pre-tension

Results and Discussion: Experiment Chapter 4
67
Figure 4-9: Quasi-static shear test results for PUD polyurea under pre-tension
4.1.4 Hardness Test
The hardness of the two types of polyurea were tested using a Teclock durometer type
A hardness tester, the results are listed in Table 4-2. It reveals that the PUK has higher
hardness value. This hardness test results are consistent with the previous compression
test results.
Table 4-2: Shore hardness test results for three types of polyurea materials
Name of material Shore hardness (Type A)
PUD 77
PUK 97
4.2 SHPB Test Results
SHPB test was conducted on the two types of polyurea listed in the previous section to
investigate their mechanical properties under dynamic loading.
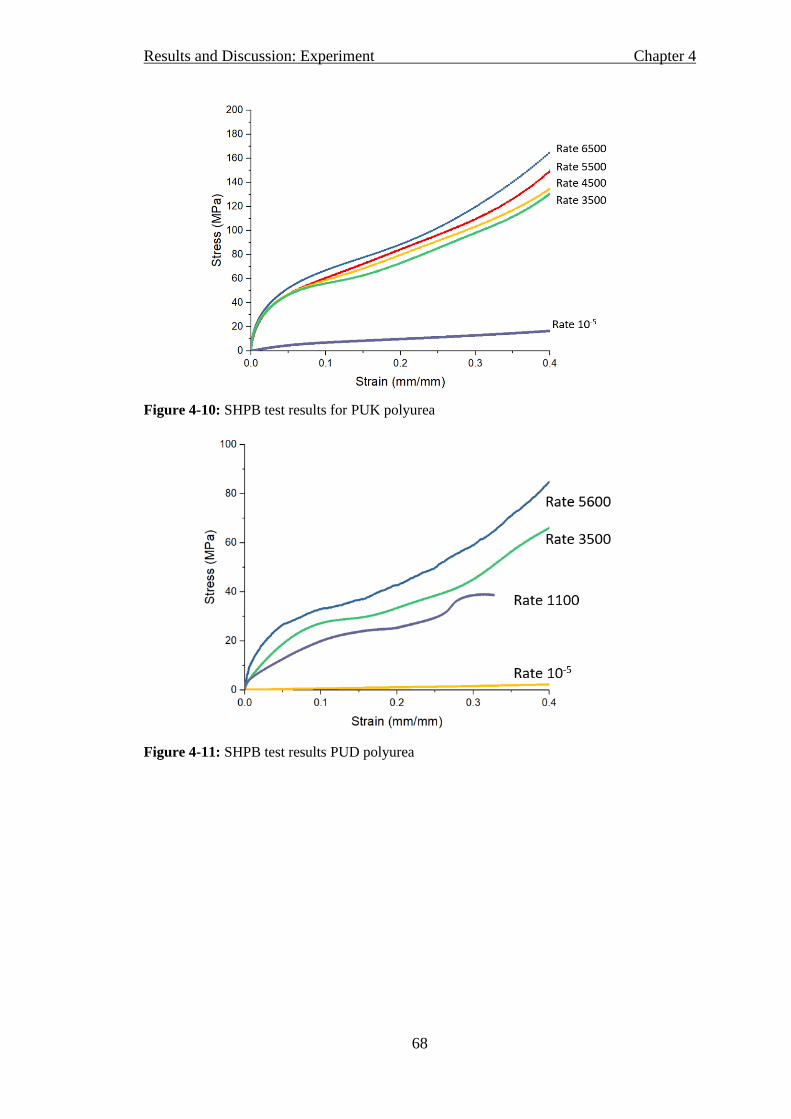
Results and Discussion: Experiment Chapter 4
68
Figure 4-10: SHPB test results for PUK polyurea
Figure 4-11: SHPB test results PUD polyurea
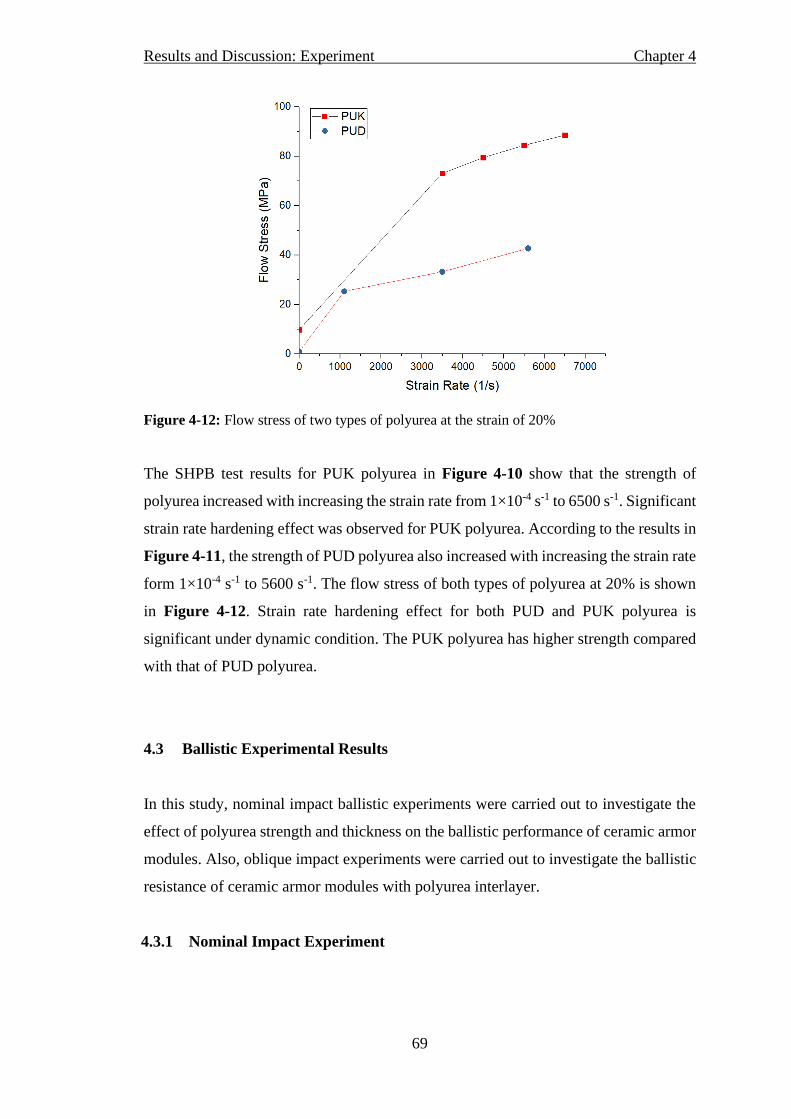
Results and Discussion: Experiment Chapter 4
69
Figure 4-12: Flow stress of two types of polyurea at the strain of 20%
The SHPB test results for PUK polyurea in Figure 4-10 show that the strength of
polyurea increased with increasing the strain rate from 1×10⁻⁴ s-1 to 6500 s-1. Significant
strain rate hardening effect was observed for PUK polyurea. According to the results in
Figure 4-11, the strength of PUD polyurea also increased with increasing the strain rate
form 1×10⁻⁴ s-1 to 5600 s-1. The flow stress of both types of polyurea at 20% is shown
in Figure 4-12. Strain rate hardening effect for both PUD and PUK polyurea is
significant under dynamic condition. The PUK polyurea has higher strength compared
with that of PUD polyurea.
4.3 Ballistic Experimental Results
In this study, nominal impact ballistic experiments were carried out to investigate the
effect of polyurea strength and thickness on the ballistic performance of ceramic armor
modules. Also, oblique impact experiments were carried out to investigate the ballistic
resistance of ceramic armor modules with polyurea interlayer.
4.3.1 Nominal Impact Experiment

Results and Discussion: Experiment Chapter 4
70
To investigate the effect of polyurea as an interlayer in ceramic armor module, two sets
of nominal impact ballistic experiments were carried out under the impact speed of
1250 m/s. The experimental set up is illustrated in Figure 4-13. The target module was
placed 300 mm in front of the witness block. One set of X-ray tubes were placed in
between to capture residual projectile images as shown in Figure 4-14. The target
information and experimental results are listed in Table 4-3. As shown in Figure 4-15,
by using the residual depth of penetration and impact velocity of each test, the mass
efficiency of different targets are obtained.
Figure 4-13: Illustration of oblique ballistic experimental setup
Figure 4-14: X-ray image for post penetration

Results and Discussion: Experiment Chapter 4
71
Figure 4-15: Ballistic experimental results
Figure 4-16: Witness block for the reference test and PUK6 test
Table 4-3: Ballistic test results of normal impact test
Test name Interlayer
Thickness
Impact
speed
Depth of
Penetration
Mass
efficiency
Residual
Length
Residual
Velocity

Results and Discussion: Experiment Chapter 4
72
(mm) (m/s) (mm) (mm) (m/s)
Reference 0 1215 15.23 1.59 35.99 1108
PUK2 2 1248 11.6 1.85 N.A N.A
PUK3 3 1246 12.98 1.77 N.A N.A
PUK6 6 1264 14.4 1.74 36.1 1166
PUD2 2 1263 16.1 1.68 N.A N.A
PUD3 3 1274 18.3 1.62 33.74 1091
The crater on the witness block for the PUK6 test shows that the impact angle of
residual projectile is large. In the study of Lee et al., they pointed out that the depth of
penetration decreases with increasing impact angle. [1] One relationship between the
depth of penetration and impact angle is illustrated as in Figure 4-17. In this case, the
test result of PUK6 is corrected by the residual velocity and length of residual projectile.
According to the crater shape of reference test, it is reasonable to assume that the impact
angle, in this case, was close to 0. The X-ray image of post penetration shows that the
residual velocity and residual length for the reference test and PUK6 are close to each
other. According to simulation results with LS-Dyna, the corrected depth of penetration
of PUK6 test is 16.1 mm. The mass efficiency of PUK6 is decreased from 1.74 to 1.66.
The result in Table 4-3 shows that mass efficiency varied with increasing thickness of
polyurea interlayer from 0 to 6 mm. For both types of polyurea, mass efficiency reached
the maximum when the thickness of the polyurea interlayer was 2 mm.
Meanwhile, it reveals that the mass efficiency of ceramic armor module using PUK as
interlayer is 10.1% and 9.25% higher than that with PUD polyurea interlayer when the
interlayer thickness is 2 mm and 3 mm, respectively. As discussed in the previous
section, PUK polyurea has a higher strength but a lower elongation at break. This
implies that the strength of polyurea contributes more than that of elongation. With a
higher strength, polyurea interlayer has a better ability to attenuate the shock wave,
which results in longer dwell time of projectile. As a result, the ballistic resistance of
ceramic armor target is better.

Results and Discussion: Experiment Chapter 4
73
Figure 4-17: Impact Geometry and Normalized penetration versus yaw. Rod L/D = 10 at 1.4
km/s.[1]
4.3.2 Oblique Impact Experiments
To investigate the effect of polyurea in ceramic armor modules against oblique impact,
one set of oblique ballistic tests were carried out under impact speed of 1250 m/s. The
experimental setup is shown in Figure 4-18. The ceramic armor module was laid on a
Styrofoam which was cut to a slop of 30 degrees. The target information and results are
shown in
Table 4-4. It reveals that by adding 2 mm PUD polyurea as an interlayer in the armor
module, the residual DOP decreased from 7.4 mm to 4.8 mm. The mass efficiency of
armor module was increased from 2.56 to 2.78. It can be concluded that the polyurea
interlayer can improve the ballistic resistance of ceramic armor target against oblique
impact.
Figure 4-18: Illustration of oblique ballistic experimental setup

Results and Discussion: Experiment Chapter 4
74
Table 4-4: Ballistic test results of oblique test
Target Impact speed
(m/s)
DOP (mm) Differential
mass efficiency
5mm Ti+20mmSic+7mm steel backing 1255 7.4 2.56
5mm Ti+2mm PUD+20mmSic+7mm steel backing 1252 4.8 2.78

Results and Discussion: Simulation Chapter 5
75
Chapter 5
Results and Discussion: Simulation
In the first section of this chapter, the simulation of the quasi-static
test, SHPB test and ballistic test are carried out. The simulation
results are confirmed to have acceptable accuracy for predicting the
performance of ceramic armor modules against the penetration of
long rod projectile. In the second section of this chapter, the defeat
mechanism of using polyurea as an interlayer in ceramic armor
modules is discussed based on the ballistic impact simulation.

Results and Discussion: Simulation Chapter 5
76
5.1 Simulation Results
5.1.1 Simulation Results of Quasi-static Compression and SHPB test
Based on the quasi-static compression and SHPB test, simulations were carried out
using LS-Dyna. The material modelling parameters of the two types of polyurea were
obtained in chapter 3. As shown in Figure 5-1 and Figure 5-2, the simulation results
show that the material model has reasonable accuracy for both types of polyurea. Due
to the limitation of the simulation model, Young’s modulus of polyurea does not
increase with increasing the strain rate. The simulated flow stress of polyurea matches
well with the experiment results when the compressive strain was over 5%.
Figure 5-1: Compression results of PUK polyurea where solid lines represent experimental
results and dot lines represent simulation results

Results and Discussion: Simulation Chapter 5
77
Figure 5-2: Compression results of PUD polyurea where solid lines represent experimental
results and the dotted lines represent simulation results
5.1.2 Simulation Results of The Ballistic Experiment
Based on the ballistic test result, simulations were carried out using LS-Dyna. The
material modelling parameters for tungsten, silicon carbide and steel 4340 were taken
from literature as discussed in Chapter 3. Parameters for the material model of polyurea
was obtained by SHPB test results, which was discussed in the previous chapter.
The simulation of the reference test and nominal impact test PUD3 & PUK3 were
carried out to validate simulation parameters first. As shown in Table 5-1 and Table
5-2, the simulation model for ballistic experiments under 1250 m/s had reasonable
accuracy.
Table 5-1: Experimental and Simulation results for Nominal impact experiments
Target DOP from Experiment (mm) DOP form Simulation (mm)
Reference 15.23 15.05
PUK3 12.98 12.56
PUD3 18.3 16.9
Table 5-2: Experimental and Simulation results for oblique impact experiments
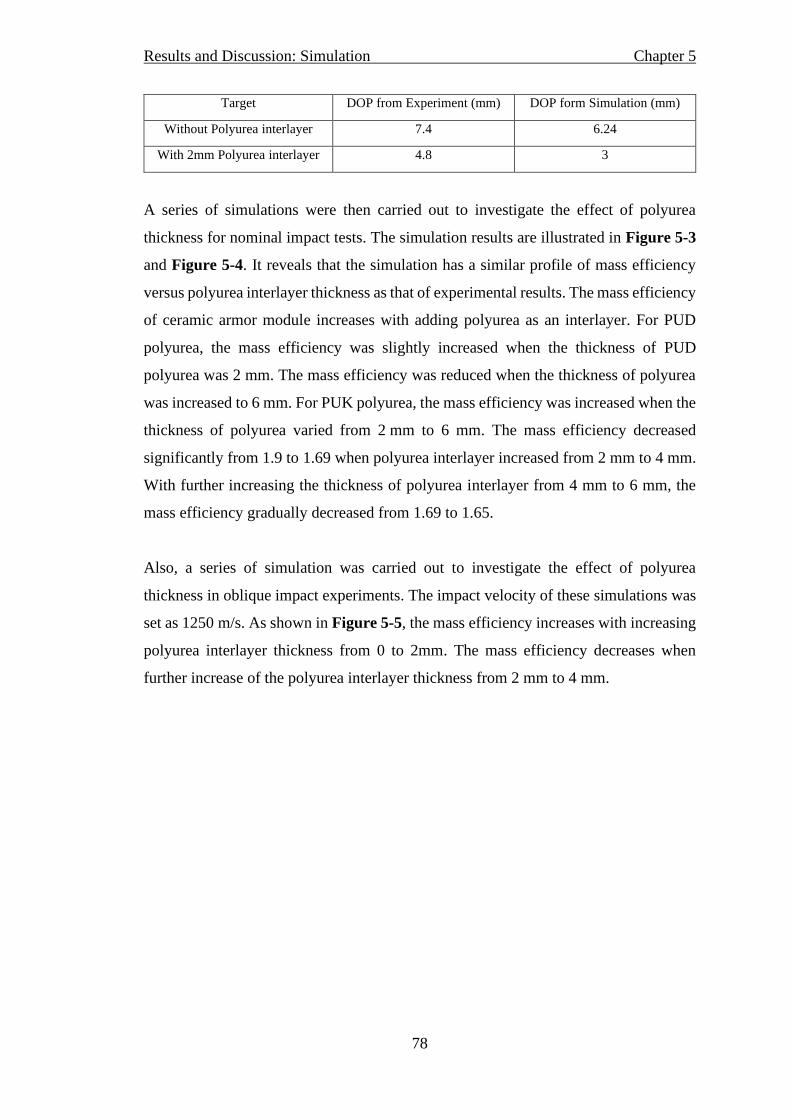
Results and Discussion: Simulation Chapter 5
78
Target DOP from Experiment (mm) DOP form Simulation (mm)
Without Polyurea interlayer 7.4 6.24
With 2mm Polyurea interlayer 4.8 3
A series of simulations were then carried out to investigate the effect of polyurea
thickness for nominal impact tests. The simulation results are illustrated in Figure 5-3
and Figure 5-4. It reveals that the simulation has a similar profile of mass efficiency
versus polyurea interlayer thickness as that of experimental results. The mass efficiency
of ceramic armor module increases with adding polyurea as an interlayer. For PUD
polyurea, the mass efficiency was slightly increased when the thickness of PUD
polyurea was 2 mm. The mass efficiency was reduced when the thickness of polyurea
was increased to 6 mm. For PUK polyurea, the mass efficiency was increased when the
thickness of polyurea varied from 2 mm to 6 mm. The mass efficiency decreased
significantly from 1.9 to 1.69 when polyurea interlayer increased from 2 mm to 4 mm.
With further increasing the thickness of polyurea interlayer from 4 mm to 6 mm, the
mass efficiency gradually decreased from 1.69 to 1.65.
Also, a series of simulation was carried out to investigate the effect of polyurea
thickness in oblique impact experiments. The impact velocity of these simulations was
set as 1250 m/s. As shown in Figure 5-5, the mass efficiency increases with increasing
polyurea interlayer thickness from 0 to 2mm. The mass efficiency decreases when
further increase of the polyurea interlayer thickness from 2 mm to 4 mm.

Results and Discussion: Simulation Chapter 5
79
Figure 5-3: Simulation results of nominal impact experiments with different thickness of PUD
polyurea interlayer
Figure 5-4: Simulation results of nominal impact experiments with different thickness of PUK
polyurea interlayer
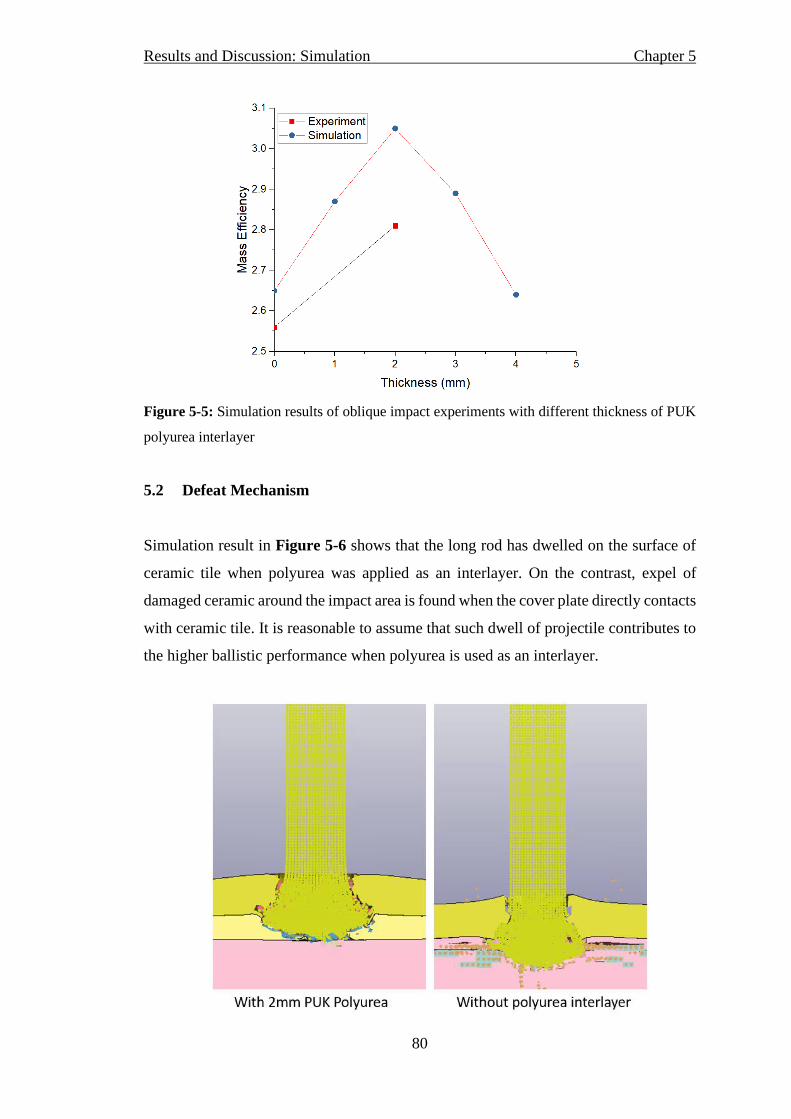
Results and Discussion: Simulation Chapter 5
80
Figure 5-5: Simulation results of oblique impact experiments with different thickness of PUK
polyurea interlayer
5.2 Defeat Mechanism
Simulation result in Figure 5-6 shows that the long rod has dwelled on the surface of
ceramic tile when polyurea was applied as an interlayer. On the contrast, expel of
damaged ceramic around the impact area is found when the cover plate directly contacts
with ceramic tile. It is reasonable to assume that such dwell of projectile contributes to
the higher ballistic performance when polyurea is used as an interlayer.

Results and Discussion: Simulation Chapter 5
81
Figure 5-6: Shape of the projectile at 24 µs
5.2.1 Shock Attenuation
The stress of ceramic was studied by the simulation to investigate the strengthening
mechanism of polyurea in ceramic armor modules. As shown in left of Figure 5-7, the
stress of one FEM element on the surface of ceramic was extracted from the simulations.
The right of Figure 5-7 illustrates the stress on ceramic by varying the thickness of
PUK polyurea interlayer. It reveals that the stress applied to the ceramic increases to
9.2 GPa at 11 µs when the head of the projectile touches the surface of ceramic tile.
When using polyurea as an interlayer between ceramic and cover plate, significant
attenuation effect is observed. The stress is reduced from 9.2 GPa to 1.4 GPa when 2
mm of PUK polyurea interlayer is applied. Such attenuation effect could reduce the
damage on ceramic tiles during the penetration process. As a result, the projectile would
dwell on the surface of the ceramic tile.

Results and Discussion: Simulation Chapter 5
82
Figure 5-7: Stress on ceramic tile versus different thickness of PUK polyurea interlayer
5.2.2 Effect of Polyurea Thickness
As discussed in the previous section, local pre-stress applied to ceramic tile by the cover
plate would improve the ballistic performance of ceramic armor modules. Figure 5-8
and Figure 5-9 illustrate the stress of ceramic with different PUK polyurea interlayer
thickness. It reveals that the prestress applied to ceramic decreases from 1.4 GPa to
326 MPa when the polyurea interlayer thickness increase from 2 mm to 6 mm. The
stress applied to ceramic decreases significantly when the polyurea interlayer thickness
increases from 2 mm to 4 mm. However, the difference in stress between 5 mm and 6
mm polyurea interlayer is negligible. Figure 5-4 illustrates the mass efficiency of
ceramic armor module with the thickness of PUK polyurea increase from 0 mm to 6
mm. Similar with the change of stress, the mass efficiency of ceramic armor module
decreases significantly by increasing the thickness of polyurea interlayer from 2 mm to
4 mm. The change in mass efficiency is low when the thickness is higher than 4 mm.
Figure 5-8: Stress on ceramic tile versus different thickness of PUK polyurea interlayer

Results and Discussion: Simulation Chapter 5
83
Figure 5-9: Stress on ceramic tile versus different thickness of PUD polyurea interlayer
5.2.3 Effect of Polyurea Strength
Figure 5-10 illustrates the stress applied to ceramic tile when two types of 3 mm
polyurea interlayer are used. The simulation result shows that the pre-stress applied to
ceramic at 11 µs are 1080 MPa and 419 MPa for PUK and PUD polyurea interlayer
respectively. In the case of PUD polyurea interlayer, the stress increases from 419 MPa
to 6.35 GPa within 2.5 µs. On the other hand, stress increases from 1.08 GPa to 4.29
GPa for PUK polyurea. It reveals that PUK polyurea provides a higher pre-stress before
the head of the projectile reaches the surface of ceramic tile. Also, PUK polyurea has
better stress attenuation effect compared with that of PUD polyurea. As a result, as
shown in Figure 5-11, PUK polyurea interlayer provides a longer dwell time compared
with that of PUD polyurea.

Results and Discussion: Simulation Chapter 5
84
Figure 5-10: Stress applied to ceramic tile with 3 mm of polyurea interlayer
Figure 5-11: Dwell of ceramic armor module with different thickness of PUK & PUD polyurea
interlayer.
According to the experimental results observed in the previous section, ceramic armor
module with PUK polyurea interlayer has a better ballistic resistance than that of PUD
polyurea. It can be concluded that polyurea elongation is not a critical material
parameter in enhancing the ballistic resistance of ceramic armor modules in this study.

Results and Discussion: Simulation Chapter 5
85
References
[1]. Lee, M., & Bless, S. J. (1998, July). A discreet impact model for effect of yaw
angle on penetration by rod projectiles. In AIP Conference Proceedings (Vol. 429, No.
1, pp. 929-932). American Institute of Physics.
[2]. Hauver, G. E., Rapacki Jr, E. J., Netherwood, P. H., & Benck, R. F. (2005).
Interface defeat of long-rod projectiles by ceramic armor. Army Research Lab
Aberdeen Proving Ground Md Weapons and Materials Research Directorate.
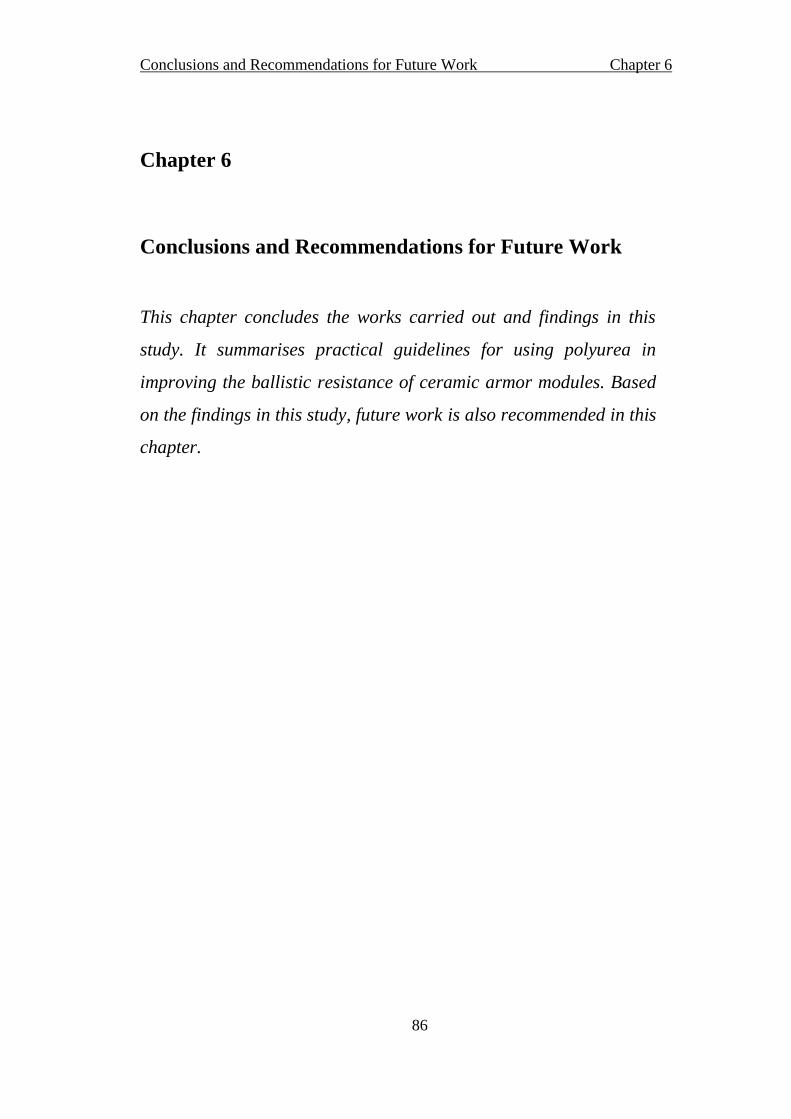
Conclusions and Recommendations for Future Work Chapter 6
86
Chapter 6
Conclusions and Recommendations for Future Work
This chapter concludes the works carried out and findings in this
study. It summarises practical guidelines for using polyurea in
improving the ballistic resistance of ceramic armor modules. Based
on the findings in this study, future work is also recommended in this
chapter.

Conclusions and Recommendations for Future Work Chapter 6
87
6.1 Conclusions
Two types of polyurea (PUK&PUD) were prepared and optimized in Ma Jan High-
Speed Dynamics Lab. Quasi-static tensile, compression and shear tests were carried
out to compare the mechanical properties of PUD and PUK polyurea. It reveals that
PUK polyurea has a higher yield strength of 10 MPa and lower elongation of 360%.
PUD polyurea has a lower yield strength of 0.8 MPa and higher elongation of 500%.
Significant increment of shear stress and shear modulus were observed with
compressive stress is applied for both types of polyurea.
Split Hopkinson Split Bar tests were carried out at strain rate in the range of 1000 to
6500 s-1for these two types of polyurea. It reveals that both types of polyurea have
significant strain rate hardening effect. The PUK polyurea has a higher strength than
PUD polyurea in the studied range of strain rate.
Ballistic experiments with an impact velocity of 1250 m/s were carried out. The
nominal impact experiments show that PUK polyurea has better performance than
that of PUD polyurea. This result shows that the strength of polyurea is more critical
than elongation in improving the ballistic performance of ceramic armors. The
ballistic resistance of ceramic armor module varies with changing the thickness of
polyurea interlayer from 0 mm to 6 mm. Both types of polyurea gave the best
ballistic resistance when the thickness of interlayer was 2 mm. Oblique experiments
show that polyurea interlayer can also improve the ballistic resistance of ceramic
armor modules against oblique impact.
Through data extracted from literature and our own SHPB tests, a simulation model
for ceramic armor module was established. By comparing against experimental
results, the simulation results had shown reasonable accuracy, thus validating the
model used. Defeating mechanism of polyurea as an interlayer in ceramic armor
modules is studied based on the simulation model. It reveals that polyurea interlayer
Conclusions and Recommendations for Future Work Chapter 6
88
has a significant shock attenuation effect, which has induced the dwell of the
projectile on the surface of ceramic tile. As a result, the ballistic resistance of
ceramic armor is improved. Higher local pre-stress on ceramic is formed by using
polyurea with a higher strength, which results with a longer dwell time. So higher
ballistic performance could be achieved with using higher strength polyurea
interlayer.
With previous experimental and simulation results, three directions of
investigations would be proposed:
1. Effect of cover plate thickness on the ballistic resistance of ceramic
armor module
2. Effect of cover plate material on the ballistic resistance of ceramic armor
module.
3. Carbon fibre reinforcement of polyurea
6.2 Future Work
6.2.1 Optimization of The Cover Plate of Ceramic Armor Modules
Intensive studies have been devoted to developing lightweight armor for vehicles in
the past few years. [1]-[5] It would be valuable to reduce the weight of ceramic
armor modules by reducing the thickness of the cover plate or change the material
of the cover plate from steel to titanium.
As shown in Table 6-1, a set of ballistic experiments could be carried out with
varying the thickness of polyurea interlayer from 1 mm to 3 mm and the thickness
of cover plate from 2mm to 3 mm. By comparing the mass efficiency of ceramic
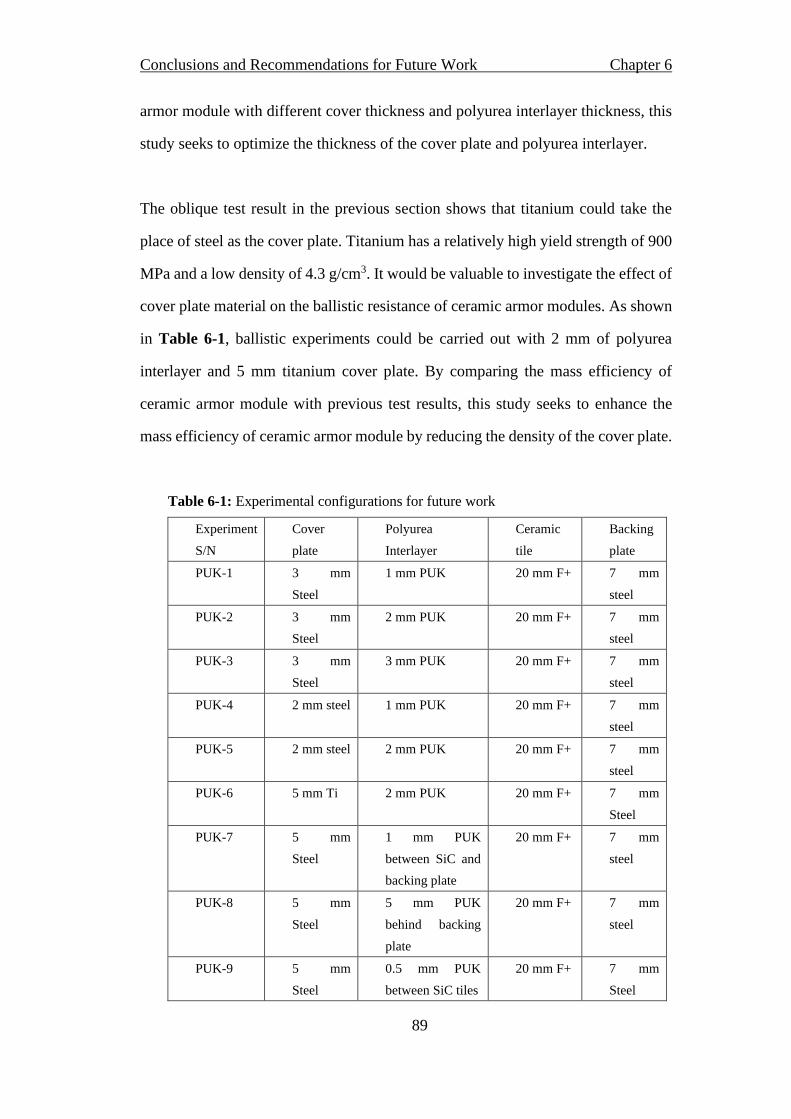
Conclusions and Recommendations for Future Work Chapter 6
89
armor module with different cover thickness and polyurea interlayer thickness, this
study seeks to optimize the thickness of the cover plate and polyurea interlayer.
The oblique test result in the previous section shows that titanium could take the
place of steel as the cover plate. Titanium has a relatively high yield strength of 900
MPa and a low density of 4.3 g/cm3. It would be valuable to investigate the effect of
cover plate material on the ballistic resistance of ceramic armor modules. As shown
in Table 6-1, ballistic experiments could be carried out with 2 mm of polyurea
interlayer and 5 mm titanium cover plate. By comparing the mass efficiency of
ceramic armor module with previous test results, this study seeks to enhance the
mass efficiency of ceramic armor module by reducing the density of the cover plate.
Table 6-1: Experimental configurations for future work
Experiment
S/N
Cover
plate
Polyurea
Interlayer
Ceramic
tile
Backing
plate
PUK-1 3 mm
Steel
1 mm PUK 20 mm F+ 7 mm
steel
PUK-2 3 mm
Steel
2 mm PUK 20 mm F+ 7 mm
steel
PUK-3 3 mm
Steel
3 mm PUK 20 mm F+ 7 mm
steel
PUK-4 2 mm steel 1 mm PUK 20 mm F+ 7 mm
steel
PUK-5 2 mm steel 2 mm PUK 20 mm F+ 7 mm
steel
PUK-6 5 mm Ti 2 mm PUK 20 mm F+ 7 mm
Steel
PUK-7 5 mm
Steel
1 mm PUK
between SiC and
backing plate
20 mm F+ 7 mm
steel
PUK-8 5 mm
Steel
5 mm PUK
behind backing
plate
20 mm F+ 7 mm
steel
PUK-9 5 mm
Steel
0.5 mm PUK
between SiC tiles
20 mm F+ 7 mm
Steel
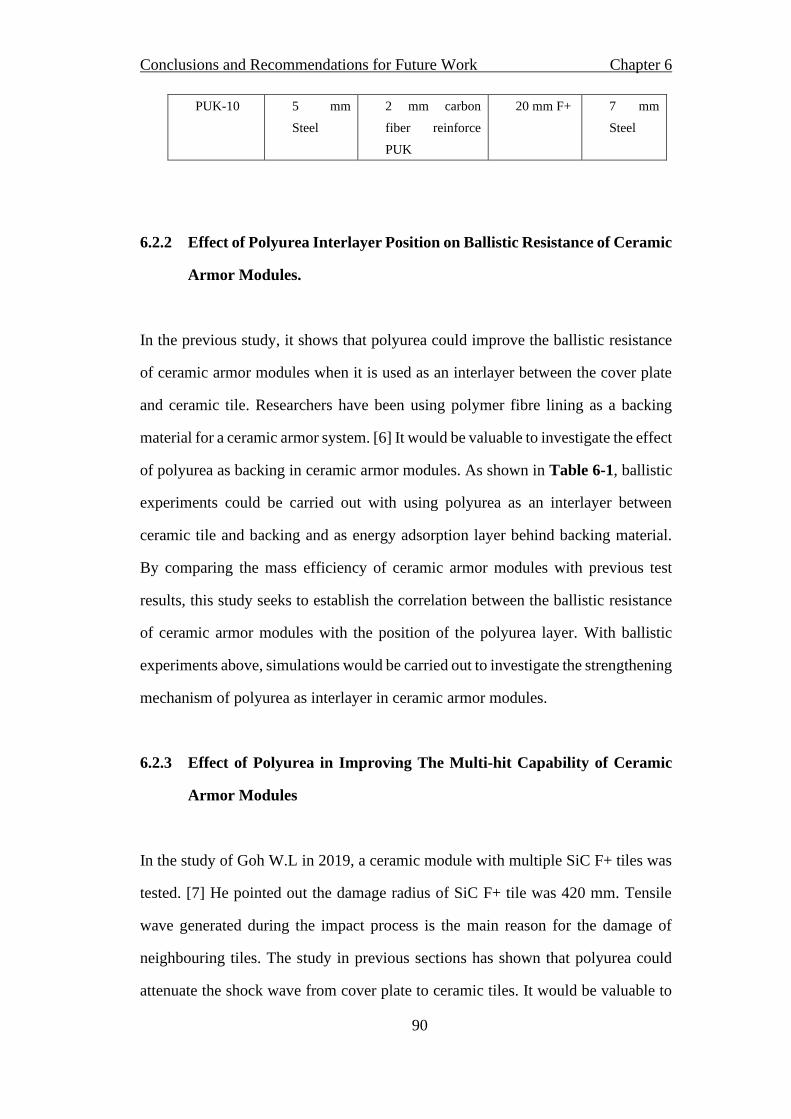
Conclusions and Recommendations for Future Work Chapter 6
90
PUK-10 5 mm
Steel
2 mm carbon
fiber reinforce
PUK
20 mm F+ 7 mm
Steel
6.2.2 Effect of Polyurea Interlayer Position on Ballistic Resistance of Ceramic
Armor Modules.
In the previous study, it shows that polyurea could improve the ballistic resistance
of ceramic armor modules when it is used as an interlayer between the cover plate
and ceramic tile. Researchers have been using polymer fibre lining as a backing
material for a ceramic armor system. [6] It would be valuable to investigate the effect
of polyurea as backing in ceramic armor modules. As shown in Table 6-1, ballistic
experiments could be carried out with using polyurea as an interlayer between
ceramic tile and backing and as energy adsorption layer behind backing material.
By comparing the mass efficiency of ceramic armor modules with previous test
results, this study seeks to establish the correlation between the ballistic resistance
of ceramic armor modules with the position of the polyurea layer. With ballistic
experiments above, simulations would be carried out to investigate the strengthening
mechanism of polyurea as interlayer in ceramic armor modules.
6.2.3 Effect of Polyurea in Improving The Multi-hit Capability of Ceramic
Armor Modules
In the study of Goh W.L in 2019, a ceramic module with multiple SiC F+ tiles was
tested. [7] He pointed out the damage radius of SiC F+ tile was 420 mm. Tensile
wave generated during the impact process is the main reason for the damage of
neighbouring tiles. The study in previous sections has shown that polyurea could
attenuate the shock wave from cover plate to ceramic tiles. It would be valuable to

Conclusions and Recommendations for Future Work Chapter 6
91
investigate the effect of polyurea in improving the multi-hit capability of ceramic
armor modules by reducing the damage radius. Ballistic experiment will be carried
out with the armor module illustrated in Figure 6-1. 0.5 mm of polyurea will be
used as an interlayer between ceramic tiles. By comparing the damage radius of
ceramic amour module with the test result in the literature, the effect of polyurea
interlayer in reducing the damage radius will be investigated.
Figure 6-1: Section view of 4 ceramic target module
6.2.4 Effect of Carbon Fiber Reinforcement on Polyurea Interlayer
As is discussed in the previous sections, polyurea with higher strength have better
ballistic performance. Carbon fibre, which has a high strength to weight ratio, is
desirable for mechanical reinforcement of polymers. [8] It would be valuable to
investigate the effect of carbon fibre reinforced polyurea on the ballistic resistance
of ceramic armor modules.

Conclusions and Recommendations for Future Work Chapter 6
92
In the preliminary study, carbon fibre weave reinforced polyurea plate with 40%
weight percentage of carbon fibre was fabricated. The quasi-static compression test
result is illustrated shown in Figure 6-2. [9] It reveals that the carbon fibre
reinforced polyurea has a higher young’s modulus of 926 MPa and a yield strength
of 167.8 MPa. In future work, the compressive property of carbon fibre reinforced
polyurea will be studied with varying the percentage of carbon fibre and carbon fibre
directions. As shown in Table 6-1, ballistic experiments will be carried out with 2
mm of carbon fibre reinforced polyurea interlayer. By comparing the mass
efficiency of ceramic armor module with previous test results, this study seeks to
investigate the correlation between strength of polyurea and ballistic resistance of
ceramic armor modules.
Figure 6-2: Quasi-static compression test result for PUK polyurea with carbon fibre
reinforcement and without carbon fibre reinforcement [9]

Conclusions and Recommendations for Future Work Chapter 6
93
References
[1]. Gooch, W. A. (2002). An overview of ceramic armor applications. Ceramic
transactions, 134, 3-21.
[2]. Gama, B. A., Bogetti, T. A., Fink, B. K., Yu, C. J., Claar, T. D., Eifert, H. H.,
& Gillespie Jr, J. W. (2001). Aluminum foam integral armor: a new dimension in
armor design. Composite structures, 52(3-4), 381-395.
[3]. Mines, R. A. W. (2004). A one-dimensional stress wave analysis of a
lightweight composite armor. Composite structures, 64(1), 55-62.
[4]. Medvedovski, E. (2012, April). Advanced ceramics for personnel armor:
Current status and future. In Ceramic Armor and Armor Systems II: Proceedings
of the 107th Annual Meeting of The American Ceramic Society, Baltimore,
Maryland, USA 2005 (Vol. 178, p. 3). John Wiley & Sons.
[5]. Ravid, M., Chocron, S., & Bodner, S. R. (2006). Penetration analysis of
ceramic armor backed by composite materials. Ceramic Armor and Armor
Systems, 151, 145-152.
[6]. Medvedovski, E. (2006). Lightweight ceramic composite armor
system. Advances in Applied Ceramics, 105(5), 241-245.
[7]. Goh, W. L. (2019). Importance of hardness and toughness in ceramic
armor (Doctoral dissertation).
[8]. C. Greb, C. Lenz, M. Lengersdorf, and T. Gries, Fabrics for reinforcement of
engineering composites, vol. c. Elsevier Ltd., 2017.
[9]. Lock, D. W. H. (2020). Polyurea carbon fibre composites.