effect of population density and spatial arrangements of ... · population density on the...
TRANSCRIPT
Available online at www.worldscientificnews.com
WSN 53(3) (2016) 216-229 EISSN 2392-2192
Effect of Population Density and Spatial
Arrangements of Pigeon pea (Cajanus cajan L. Millsp) on Productivity of Maize-Pigeon pea
Intercropping
Fitsum Merkeb
Ethiopian Institute of Agricultural Research (EIAR), Pawe Research Center, Pawe, Ethiopia
E-mail address: [email protected]
ABSTRACT
A field experiment was conducted to determine the effect of pigeon pea spatial arrangement and
population density on the productivity of maize-pigeon pea intercropping. Treatments were consisted
of two pigeon pea spatial arrangements and three population densities of pigeon pea using randomized
complete block design with three replications. Spatial arrangement and population densities had
significant influence on pigeon pea grain yield. Higher grain yield was obtained from the highest
pigeon pea plant population density and 1:2 spatial arrangement (3.90 t/ha, 0.73 t/ha for maize and
3.74 t/ha, 0.75 t/ha for pigeon pea). Number of seeds/cob and biomass yield of maize were not
significantly affected by pigeon pea spatial arrangement and population densities. The interaction
effect of pigeon pea spatial arrangement and population density had a significant effect on maize
biomass yield. The highest interaction effect on biomass yield was obtained from the lowest pigeon
pea population density with 1:2 arrangements. Land use efficiency and monetary return was increased
by increasing plant density and pigeon pea rows. Total LER of 1.16 and 1.24 was received from 1:2
and 250,000 plants ha-1
. Under pigeon pea spatial arrangement of 1:2 and population density of
125,000 and 250,000 plants ha-1
maize-pigeon pea intercropping was found to be advantageous. The
highest monetary return was also obtained from these treatments of 1:2 and 250,000 plants ha-1
(28185
ETB ha-1
and 28106 ETB ha-1
). Intercropping maize-pigeon pea gave a gross monetary advantage of
75% and 21% of their respective sole crops of maize and pigeon pea.
Keywords: Maize, Pigeon pea, spatial arrangement, population density, LER, monetary return
World Scientific News 53(3) (2016) 216-229
-217-
1. INTRODUCTION
Maize is one of the most important cereals cultivated in Ethiopia. It ranks second after
teff in area coverage and first in total production. Out of the total grain crop areas, 79.34%
(9,588,923.71 hectares) was under cereals. Of this maize covered 17% (about 2,054,723.69
hectares) and gave 6069413 tonnes of grain yields (CSA, 2012). Despite the large area under
maize, the national average yield of maize is about 2.95 t/ha (CSA, 2012). This is by far
below the world’s average yield which is about 5.21t/ha (FAO, 2011). The low productivity
of maize is attributed to many factors including poor agronomic practices (CIMMYT, 2004).
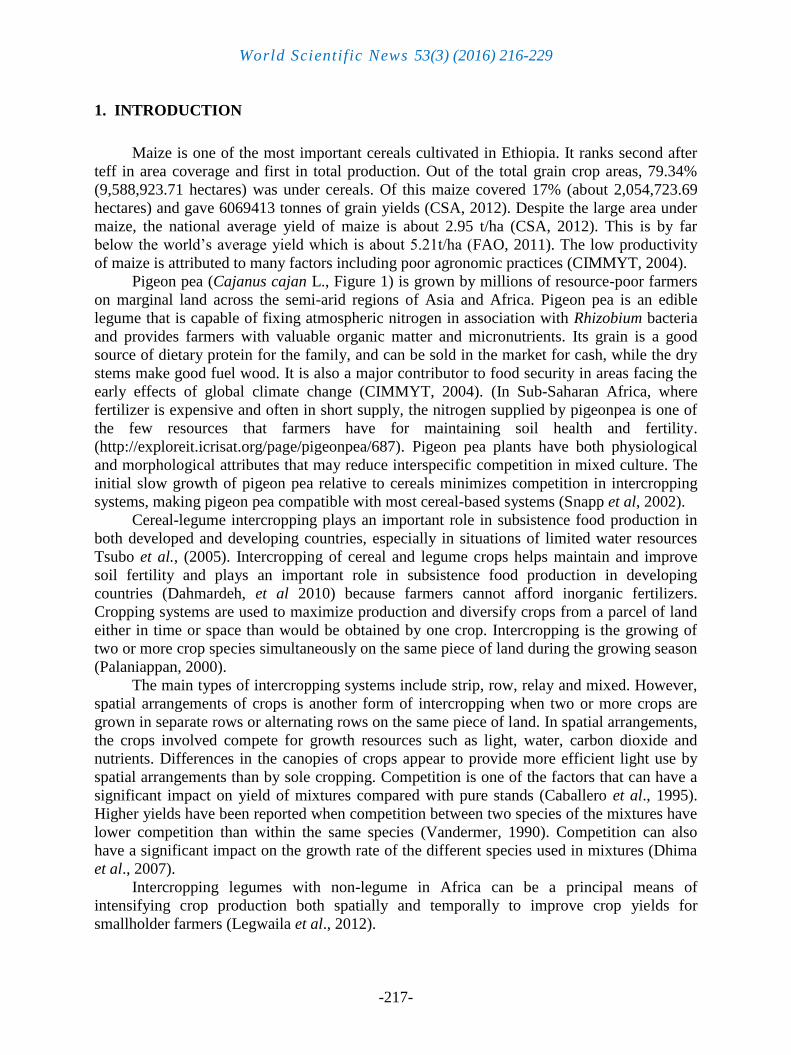
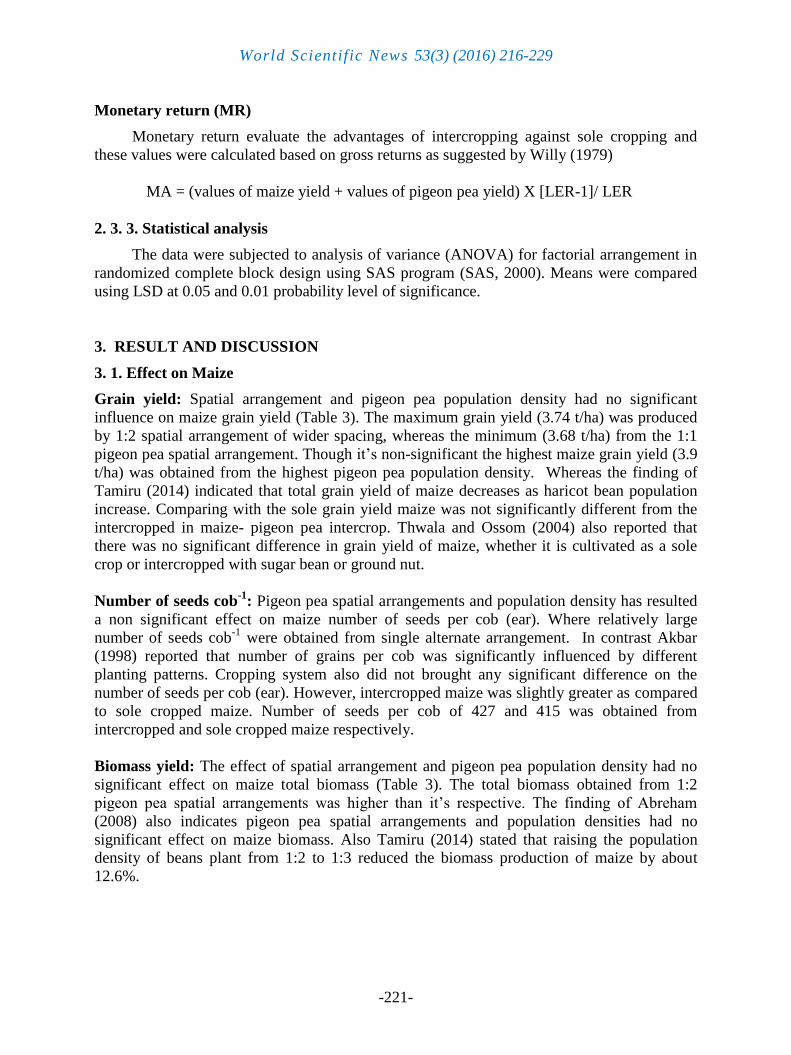
Pigeon pea (Cajanus cajan L., Figure 1) is grown by millions of resource-poor farmers
on marginal land across the semi-arid regions of Asia and Africa. Pigeon pea is an edible
legume that is capable of fixing atmospheric nitrogen in association with Rhizobium bacteria
and provides farmers with valuable organic matter and micronutrients. Its grain is a good
source of dietary protein for the family, and can be sold in the market for cash, while the dry
stems make good fuel wood. It is also a major contributor to food security in areas facing the
early effects of global climate change (CIMMYT, 2004). (In Sub-Saharan Africa, where
fertilizer is expensive and often in short supply, the nitrogen supplied by pigeonpea is one of
the few resources that farmers have for maintaining soil health and fertility.
(http://exploreit.icrisat.org/page/pigeonpea/687). Pigeon pea plants have both physiological
and morphological attributes that may reduce interspecific competition in mixed culture. The
initial slow growth of pigeon pea relative to cereals minimizes competition in intercropping
systems, making pigeon pea compatible with most cereal-based systems (Snapp et al, 2002).
Cereal-legume intercropping plays an important role in subsistence food production in
both developed and developing countries, especially in situations of limited water resources
Tsubo et al., (2005). Intercropping of cereal and legume crops helps maintain and improve
soil fertility and plays an important role in subsistence food production in developing
countries (Dahmardeh, et al 2010) because farmers cannot afford inorganic fertilizers.
Cropping systems are used to maximize production and diversify crops from a parcel of land
either in time or space than would be obtained by one crop. Intercropping is the growing of
two or more crop species simultaneously on the same piece of land during the growing season
(Palaniappan, 2000).
The main types of intercropping systems include strip, row, relay and mixed. However,
spatial arrangements of crops is another form of intercropping when two or more crops are
grown in separate rows or alternating rows on the same piece of land. In spatial arrangements,
the crops involved compete for growth resources such as light, water, carbon dioxide and
nutrients. Differences in the canopies of crops appear to provide more efficient light use by
spatial arrangements than by sole cropping. Competition is one of the factors that can have a
significant impact on yield of mixtures compared with pure stands (Caballero et al., 1995).
Higher yields have been reported when competition between two species of the mixtures have
lower competition than within the same species (Vandermer, 1990). Competition can also
have a significant impact on the growth rate of the different species used in mixtures (Dhima
et al., 2007).
Intercropping legumes with non-legume in Africa can be a principal means of
intensifying crop production both spatially and temporally to improve crop yields for
smallholder farmers (Legwaila et al., 2012).
World Scientific News 53(3) (2016) 216-229
-218-
Therefore the present study was initiated with the objective of evaluating the influence
of pigeon pea spatial arrangement and population density on the component crops under
maize/pigeon pea intercropping system.
Figure 1. Cajanus cajan L.
2. MATERIALS AND METHODS
2. 1. Experimental site description
The study was conducted at Hawassa University research and farm center located at
7°4’N latitude and 38°3’ E longitude, with an altitude of 1760 masl. The average annual
rainfall for the last 15 years is 1100 mm ranging from 674 to 1365 mm while, the average
annual minimum and maximum temperatures are 12 °C and 27
°C respectively. The area has
two rainy seasons, Belg (Feb-May) and Meher (Jun-Oct). However the main rainy season can
extends from April to September interrupted by some dry spells in June and sometimes in
May. Distribution of rainfall (Table 1) at tasseling, silking and grain filling stage was variable
(August-November). The total amount of rainfall during the growing season from June to
December was 12% higher than the long-term rain fall. The rainfall was also 34.7% greater
than the long term during the grain filling stages of maize creating water logging situations
during the growing season of September.
World Scientific News 53(3) (2016) 216-229
-219-
Table 1. Amount of rainfall during crop growing season and long term monthly mean rainfall
Months
Rainfall (mm)
Long term mean
(1993-2007) Growing season
June 111.8 118.2 (+6%)
July 122.6 120.5 (-1.7%)
August 128.4 123.5 (-3.8%)
September 118.8 160 (+34.7%)
October 80.6 66.1 (-18%)
November 32.8 97.1 (+196%)
December 22.9 5.8 (-74.7%)
Total 617.99 691.2 (12%)
Source: Southern zone National Meteorological Agency (2008)
2. 2. Experimental details
2. 2. 1. Experimental treatments
The treatments were three-population densities (P1 = 250000, P2 = 187500 and P3 =
125000 plants ha-1
), and two spatial arrangements (one row of maize with one row of pigeon
pea (1mz: 1pp) and one row of maize with two rows of pigeon pea (1mz: 2pp). Each spatial
arrangement was combined with three population densities of pigeon pea using different intra-
row spacing’s (Table 2). Population densities of pigeon pea for both 1:2 and 1:1 arrangements
were 250,000 plants ha-1
, 187,500 plants ha-1
, and 125,000 plants ha-1
to maintain 100%, 75%
and 50% of the recommended population of sole pigeon pea (250,000 plants ha-1
),
respectively. Sole crop of maize and pigean pea was used as a control treatments. Sole pigeon
pea was planted using 40 cm by 10 cm (inter and intra row spacing, respectively) with a total
population density of 250,000 plants ha-1
. Maize was planted using the recommended
population density (25 cm x 80 cm = 50,000 plants ha-1
). The factorial experiment was laid
out in randomized complete block design (RCBD) with three replicates.
2. 2. 2 Experimental procedures and management practices
Intercropped pigeon pea was planted between maize rows for the 1:1 row arrangement,
which was 40 cm apart from maize rows on both sides. For the 1:2 row arrangements, two
rows of pigeon pea were planted at a distance of 20 cm from both sides of maize rows with an
intra-row spacing of 10, 13.5, and 20 cm (Table 2). In the 1:1 row arrangement, the intra row
spacing’s were 5, 6.5, and 10 cm to maintain the respective population densities of 100%,
75% and 50% of the recommended pigeon pea population.
World Scientific News 53(3) (2016) 216-229
-220-
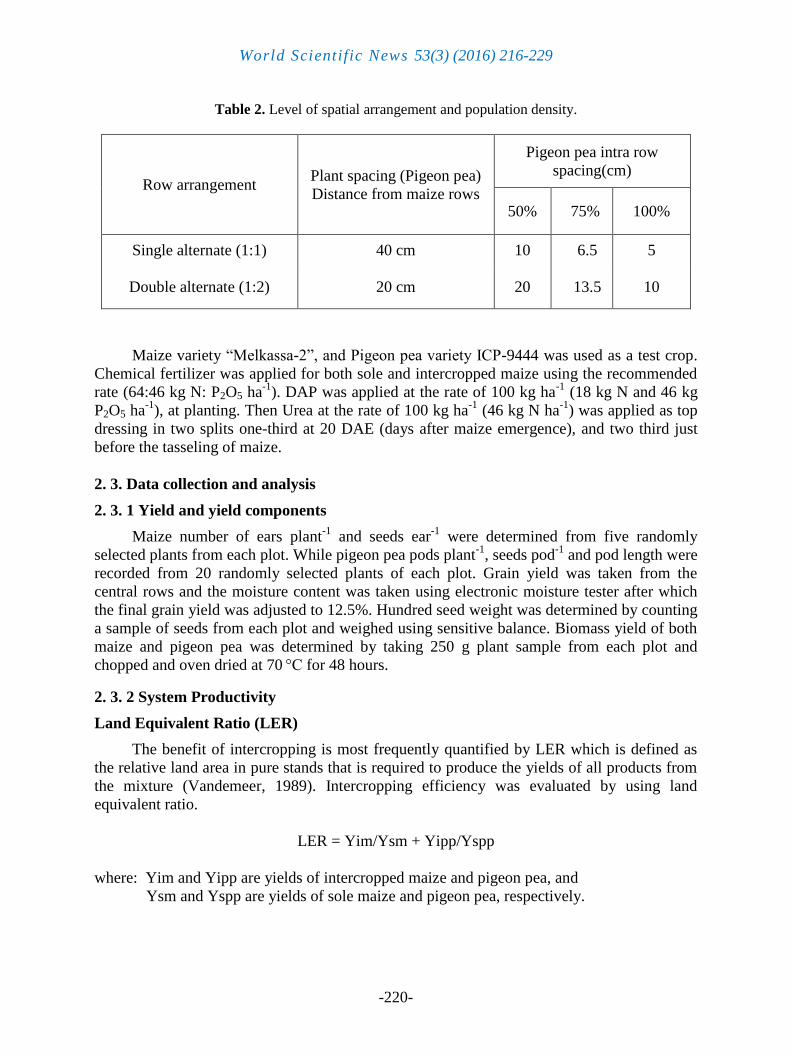
Table 2. Level of spatial arrangement and population density.
Row arrangement Plant spacing (Pigeon pea)
Distance from maize rows
Pigeon pea intra row
spacing(cm)
50% 75% 100%
Single alternate (1:1) 40 cm 10 6.5 5
Double alternate (1:2) 20 cm 20 13.5 10
Maize variety “Melkassa-2”, and Pigeon pea variety ICP-9444 was used as a test crop.
Chemical fertilizer was applied for both sole and intercropped maize using the recommended
rate (64:46 kg N: P2O5 ha-1
). DAP was applied at the rate of 100 kg ha-1
(18 kg N and 46 kg
P2O5 ha-1
), at planting. Then Urea at the rate of 100 kg ha-1
(46 kg N ha-1
) was applied as top
dressing in two splits one-third at 20 DAE (days after maize emergence), and two third just
before the tasseling of maize.
2. 3. Data collection and analysis
2. 3. 1 Yield and yield components
Maize number of ears plant-1
and seeds ear-1
were determined from five randomly
selected plants from each plot. While pigeon pea pods plant-1
, seeds pod-1
and pod length were
recorded from 20 randomly selected plants of each plot. Grain yield was taken from the
central rows and the moisture content was taken using electronic moisture tester after which
the final grain yield was adjusted to 12.5%. Hundred seed weight was determined by counting
a sample of seeds from each plot and weighed using sensitive balance. Biomass yield of both
maize and pigeon pea was determined by taking 250 g plant sample from each plot and
chopped and oven dried at 70 °C for 48 hours.
2. 3. 2 System Productivity
Land Equivalent Ratio (LER)
The benefit of intercropping is most frequently quantified by LER which is defined as
the relative land area in pure stands that is required to produce the yields of all products from
the mixture (Vandemeer, 1989). Intercropping efficiency was evaluated by using land
equivalent ratio.
LER = Yim/Ysm + Yipp/Yspp
where: Yim and Yipp are yields of intercropped maize and pigeon pea, and
Ysm and Yspp are yields of sole maize and pigeon pea, respectively.
World Scientific News 53(3) (2016) 216-229
-221-
Monetary return (MR)
Monetary return evaluate the advantages of intercropping against sole cropping and
these values were calculated based on gross returns as suggested by Willy (1979)
MA = (values of maize yield + values of pigeon pea yield) X [LER-1]/ LER
2. 3. 3. Statistical analysis
The data were subjected to analysis of variance (ANOVA) for factorial arrangement in
randomized complete block design using SAS program (SAS, 2000). Means were compared
using LSD at 0.05 and 0.01 probability level of significance.
3. RESULT AND DISCUSSION
3. 1. Effect on Maize
Grain yield: Spatial arrangement and pigeon pea population density had no significant
influence on maize grain yield (Table 3). The maximum grain yield (3.74 t/ha) was produced
by 1:2 spatial arrangement of wider spacing, whereas the minimum (3.68 t/ha) from the 1:1
pigeon pea spatial arrangement. Though it’s non-significant the highest maize grain yield (3.9
t/ha) was obtained from the highest pigeon pea population density. Whereas the finding of
Tamiru (2014) indicated that total grain yield of maize decreases as haricot bean population
increase. Comparing with the sole grain yield maize was not significantly different from the
intercropped in maize- pigeon pea intercrop. Thwala and Ossom (2004) also reported that
there was no significant difference in grain yield of maize, whether it is cultivated as a sole
crop or intercropped with sugar bean or ground nut.
Number of seeds cob-1
: Pigeon pea spatial arrangements and population density has resulted
a non significant effect on maize number of seeds per cob (ear). Where relatively large
number of seeds cob-1
were obtained from single alternate arrangement. In contrast Akbar
(1998) reported that number of grains per cob was significantly influenced by different
planting patterns. Cropping system also did not brought any significant difference on the
number of seeds per cob (ear). However, intercropped maize was slightly greater as compared
to sole cropped maize. Number of seeds per cob of 427 and 415 was obtained from
intercropped and sole cropped maize respectively.
Biomass yield: The effect of spatial arrangement and pigeon pea population density had no
significant effect on maize total biomass (Table 3). The total biomass obtained from 1:2
pigeon pea spatial arrangements was higher than it’s respective. The finding of Abreham
(2008) also indicates pigeon pea spatial arrangements and population densities had no
significant effect on maize biomass. Also Tamiru (2014) stated that raising the population
density of beans plant from 1:2 to 1:3 reduced the biomass production of maize by about
12.6%.
World Scientific News 53(3) (2016) 216-229
-222-
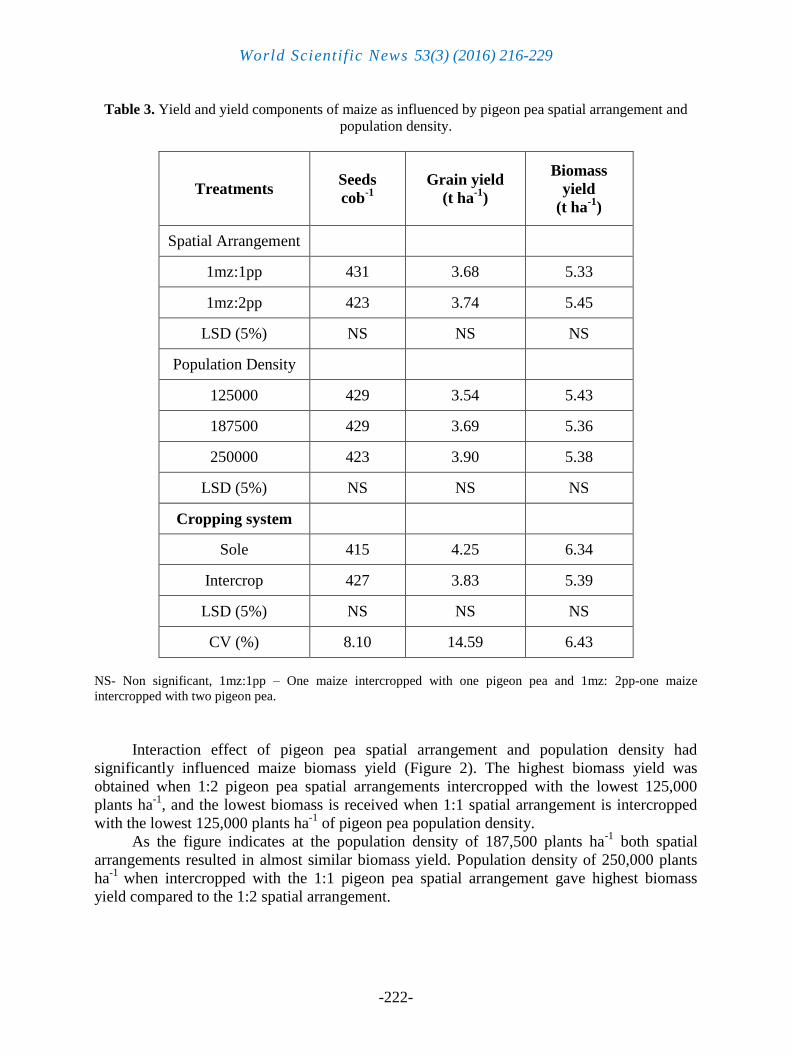
Table 3. Yield and yield components of maize as influenced by pigeon pea spatial arrangement and
population density.
Treatments Seeds
cob-1
Grain yield
(t ha-1
)
Biomass
yield
(t ha-1
)
Spatial Arrangement
1mz:1pp 431 3.68 5.33
1mz:2pp 423 3.74 5.45
LSD (5%) NS NS NS
Population Density
125000 429 3.54 5.43
187500 429 3.69 5.36
250000 423 3.90 5.38
LSD (5%) NS NS NS
Cropping system
Sole 415 4.25 6.34
Intercrop 427 3.83 5.39
LSD (5%) NS NS NS
CV (%) 8.10 14.59 6.43
NS- Non significant, 1mz:1pp – One maize intercropped with one pigeon pea and 1mz: 2pp-one maize
intercropped with two pigeon pea.
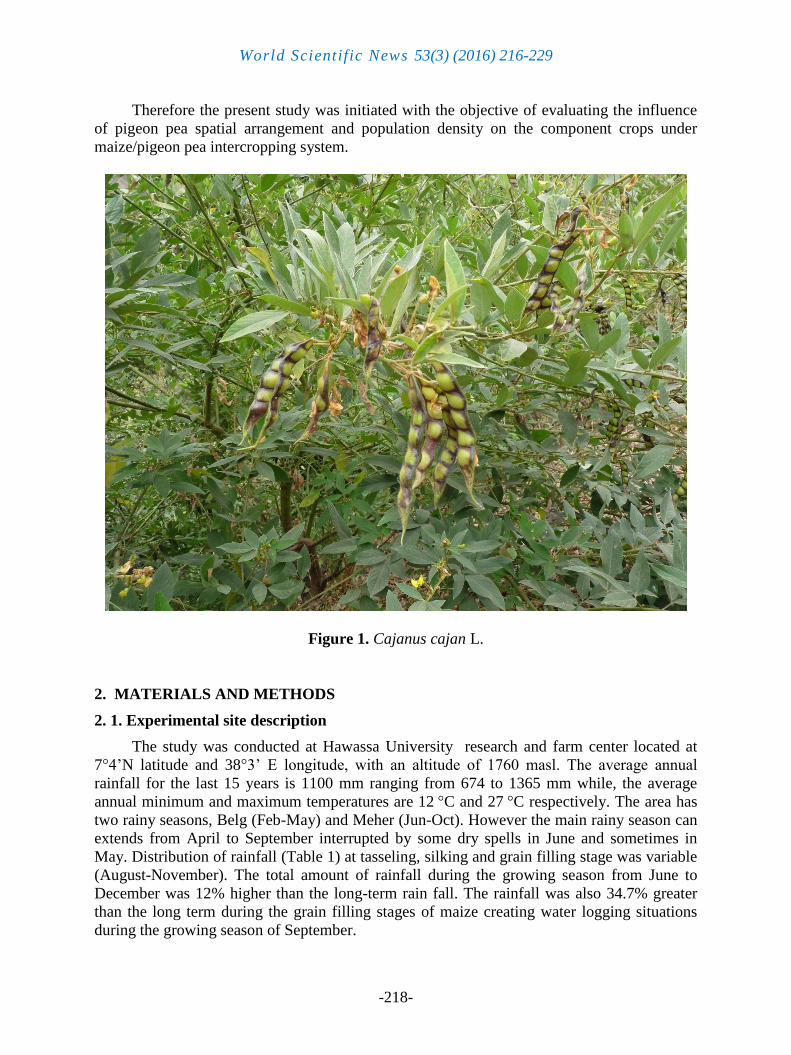
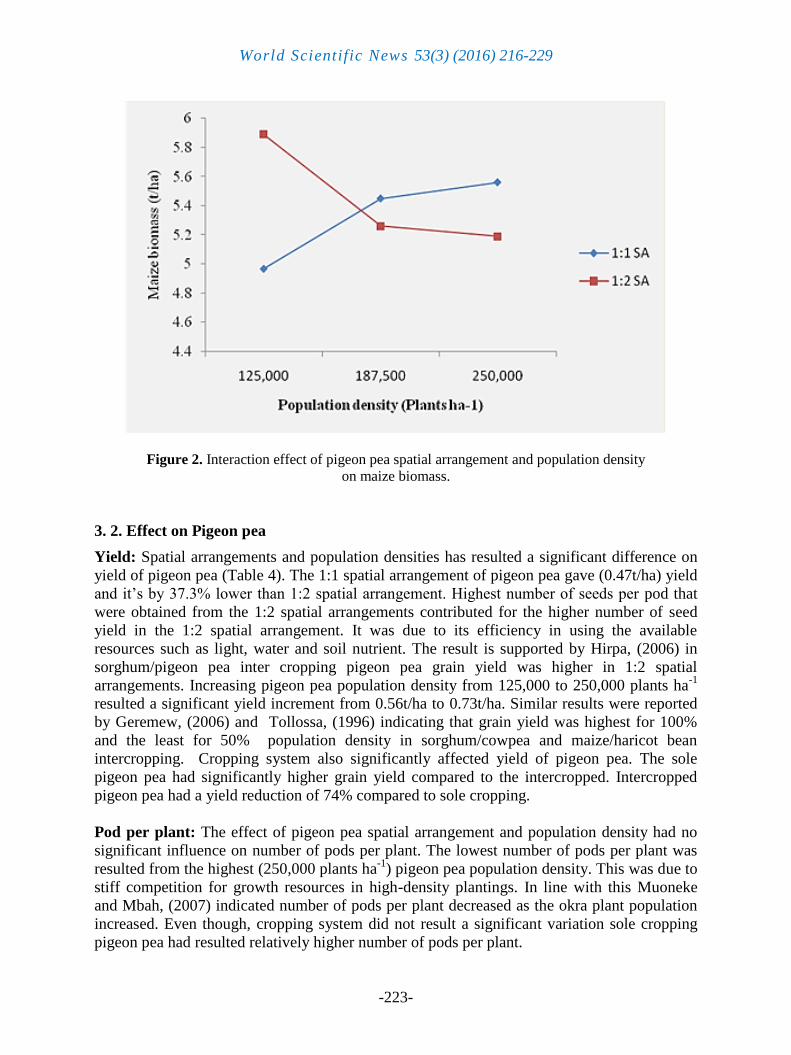
Interaction effect of pigeon pea spatial arrangement and population density had
significantly influenced maize biomass yield (Figure 2). The highest biomass yield was
obtained when 1:2 pigeon pea spatial arrangements intercropped with the lowest 125,000
plants ha-1
, and the lowest biomass is received when 1:1 spatial arrangement is intercropped
with the lowest 125,000 plants ha-1
of pigeon pea population density.
As the figure indicates at the population density of 187,500 plants ha-1
both spatial
arrangements resulted in almost similar biomass yield. Population density of 250,000 plants
ha-1
when intercropped with the 1:1 pigeon pea spatial arrangement gave highest biomass
yield compared to the 1:2 spatial arrangement.
World Scientific News 53(3) (2016) 216-229
-223-
Figure 2. Interaction effect of pigeon pea spatial arrangement and population density
on maize biomass.
3. 2. Effect on Pigeon pea
Yield: Spatial arrangements and population densities has resulted a significant difference on
yield of pigeon pea (Table 4). The 1:1 spatial arrangement of pigeon pea gave (0.47t/ha) yield
and it’s by 37.3% lower than 1:2 spatial arrangement. Highest number of seeds per pod that
were obtained from the 1:2 spatial arrangements contributed for the higher number of seed
yield in the 1:2 spatial arrangement. It was due to its efficiency in using the available
resources such as light, water and soil nutrient. The result is supported by Hirpa, (2006) in
sorghum/pigeon pea inter cropping pigeon pea grain yield was higher in 1:2 spatial
arrangements. Increasing pigeon pea population density from 125,000 to 250,000 plants ha-1
resulted a significant yield increment from 0.56t/ha to 0.73t/ha. Similar results were reported
by Geremew, (2006) and Tollossa, (1996) indicating that grain yield was highest for 100%
and the least for 50% population density in sorghum/cowpea and maize/haricot bean
intercropping. Cropping system also significantly affected yield of pigeon pea. The sole
pigeon pea had significantly higher grain yield compared to the intercropped. Intercropped
pigeon pea had a yield reduction of 74% compared to sole cropping.
Pod per plant: The effect of pigeon pea spatial arrangement and population density had no
significant influence on number of pods per plant. The lowest number of pods per plant was
resulted from the highest (250,000 plants ha-1
) pigeon pea population density. This was due to
stiff competition for growth resources in high-density plantings. In line with this Muoneke
and Mbah, (2007) indicated number of pods per plant decreased as the okra plant population
increased. Even though, cropping system did not result a significant variation sole cropping
pigeon pea had resulted relatively higher number of pods per plant.
World Scientific News 53(3) (2016) 216-229
-224-
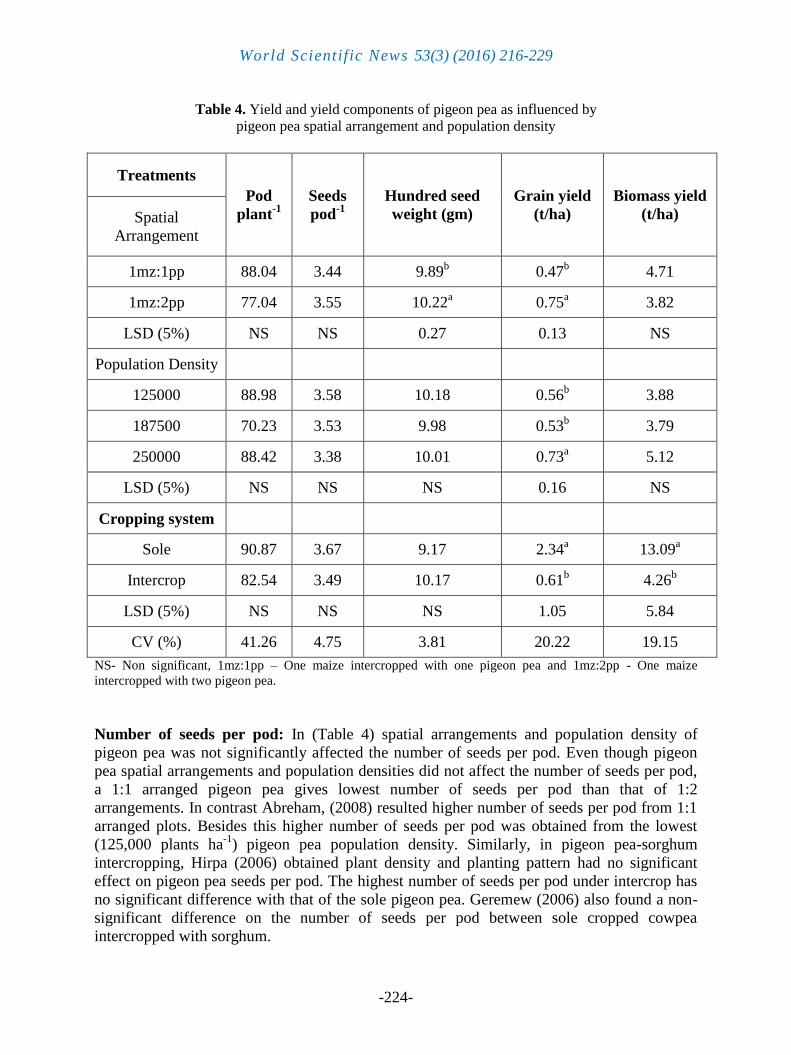
Table 4. Yield and yield components of pigeon pea as influenced by
pigeon pea spatial arrangement and population density
Treatments
Pod
plant-1
Seeds
pod-1
Hundred seed
weight (gm)
Grain yield
(t/ha)
Biomass yield
(t/ha) Spatial
Arrangement
1mz:1pp 88.04 3.44 9.89b 0.47
b 4.71
1mz:2pp 77.04 3.55 10.22a 0.75
a 3.82
LSD (5%) NS NS 0.27 0.13 NS
Population Density
125000 88.98 3.58 10.18 0.56b 3.88
187500 70.23 3.53 9.98 0.53b 3.79
250000 88.42 3.38 10.01 0.73a 5.12
LSD (5%) NS NS NS 0.16 NS
Cropping system
Sole 90.87 3.67 9.17 2.34a 13.09
a
Intercrop 82.54 3.49 10.17 0.61b 4.26
b
LSD (5%) NS NS NS 1.05 5.84
CV (%) 41.26 4.75 3.81 20.22 19.15
NS- Non significant, 1mz:1pp – One maize intercropped with one pigeon pea and 1mz:2pp - One maize
intercropped with two pigeon pea.
Number of seeds per pod: In (Table 4) spatial arrangements and population density of
pigeon pea was not significantly affected the number of seeds per pod. Even though pigeon
pea spatial arrangements and population densities did not affect the number of seeds per pod,
a 1:1 arranged pigeon pea gives lowest number of seeds per pod than that of 1:2
arrangements. In contrast Abreham, (2008) resulted higher number of seeds per pod from 1:1
arranged plots. Besides this higher number of seeds per pod was obtained from the lowest
(125,000 plants ha-1
) pigeon pea population density. Similarly, in pigeon pea-sorghum
intercropping, Hirpa (2006) obtained plant density and planting pattern had no significant
effect on pigeon pea seeds per pod. The highest number of seeds per pod under intercrop has
no significant difference with that of the sole pigeon pea. Geremew (2006) also found a non-
significant difference on the number of seeds per pod between sole cropped cowpea
intercropped with sorghum.
World Scientific News 53(3) (2016) 216-229
-225-
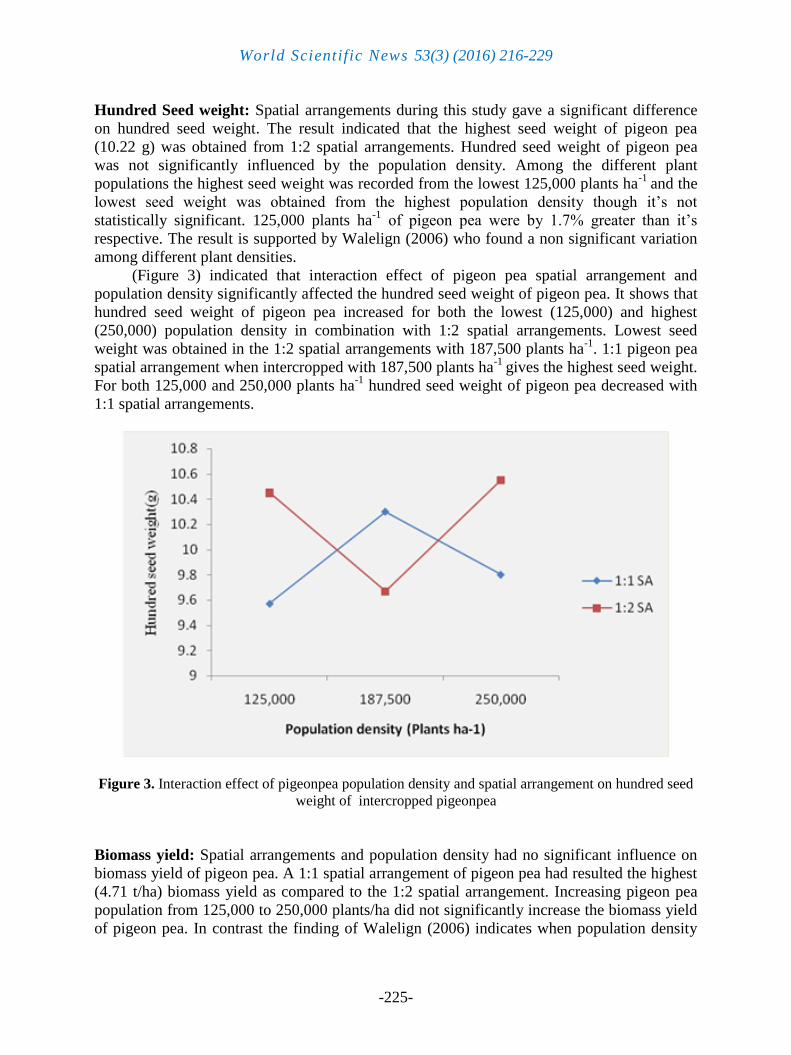
Hundred Seed weight: Spatial arrangements during this study gave a significant difference
on hundred seed weight. The result indicated that the highest seed weight of pigeon pea
(10.22 g) was obtained from 1:2 spatial arrangements. Hundred seed weight of pigeon pea
was not significantly influenced by the population density. Among the different plant
populations the highest seed weight was recorded from the lowest 125,000 plants ha-1
and the
lowest seed weight was obtained from the highest population density though it’s not
statistically significant. 125,000 plants ha-1
of pigeon pea were by 1.7% greater than it’s
respective. The result is supported by Walelign (2006) who found a non significant variation
among different plant densities.
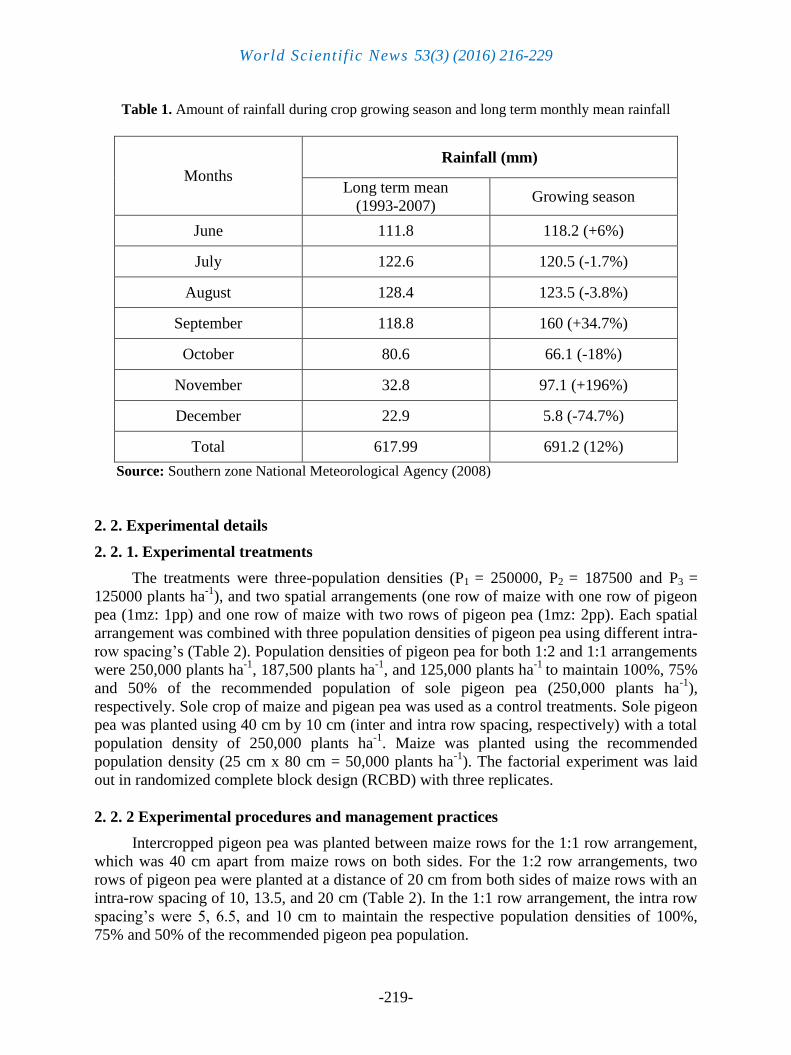
(Figure 3) indicated that interaction effect of pigeon pea spatial arrangement and
population density significantly affected the hundred seed weight of pigeon pea. It shows that
hundred seed weight of pigeon pea increased for both the lowest (125,000) and highest
(250,000) population density in combination with 1:2 spatial arrangements. Lowest seed
weight was obtained in the 1:2 spatial arrangements with 187,500 plants ha-1
. 1:1 pigeon pea
spatial arrangement when intercropped with 187,500 plants ha-1
gives the highest seed weight.
For both 125,000 and 250,000 plants ha-1
hundred seed weight of pigeon pea decreased with
1:1 spatial arrangements.
Figure 3. Interaction effect of pigeonpea population density and spatial arrangement on hundred seed
weight of intercropped pigeonpea
Biomass yield: Spatial arrangements and population density had no significant influence on
biomass yield of pigeon pea. A 1:1 spatial arrangement of pigeon pea had resulted the highest
(4.71 t/ha) biomass yield as compared to the 1:2 spatial arrangement. Increasing pigeon pea
population from 125,000 to 250,000 plants/ha did not significantly increase the biomass yield
of pigeon pea. In contrast the finding of Walelign (2006) indicates when population density
World Scientific News 53(3) (2016) 216-229
-226-
increase total biomass was increase linearly. The increment of biomass with rising of
population density is due to the increasing number of plants per unit areas.
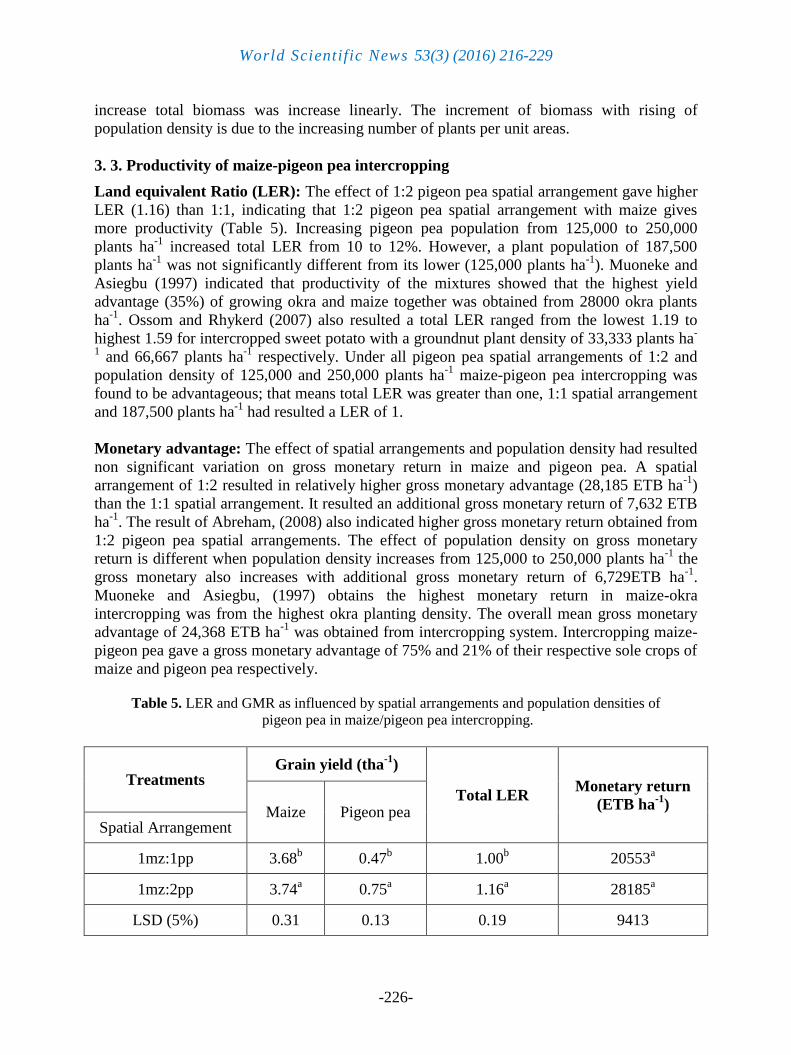
3. 3. Productivity of maize-pigeon pea intercropping
Land equivalent Ratio (LER): The effect of 1:2 pigeon pea spatial arrangement gave higher
LER (1.16) than 1:1, indicating that 1:2 pigeon pea spatial arrangement with maize gives
more productivity (Table 5). Increasing pigeon pea population from 125,000 to 250,000
plants ha-1
increased total LER from 10 to 12%. However, a plant population of 187,500
plants ha-1
was not significantly different from its lower (125,000 plants ha-1
). Muoneke and
Asiegbu (1997) indicated that productivity of the mixtures showed that the highest yield
advantage (35%) of growing okra and maize together was obtained from 28000 okra plants
ha-1
. Ossom and Rhykerd (2007) also resulted a total LER ranged from the lowest 1.19 to
highest 1.59 for intercropped sweet potato with a groundnut plant density of 33,333 plants ha-
1 and 66,667 plants ha
-1 respectively. Under all pigeon pea spatial arrangements of 1:2 and
population density of 125,000 and 250,000 plants ha-1
maize-pigeon pea intercropping was
found to be advantageous; that means total LER was greater than one, 1:1 spatial arrangement
and 187,500 plants ha-1
had resulted a LER of 1.
Monetary advantage: The effect of spatial arrangements and population density had resulted
non significant variation on gross monetary return in maize and pigeon pea. A spatial
arrangement of 1:2 resulted in relatively higher gross monetary advantage (28,185 ETB ha-1
)
than the 1:1 spatial arrangement. It resulted an additional gross monetary return of 7,632 ETB
ha-1
. The result of Abreham, (2008) also indicated higher gross monetary return obtained from
1:2 pigeon pea spatial arrangements. The effect of population density on gross monetary
return is different when population density increases from 125,000 to 250,000 plants ha-1
the
gross monetary also increases with additional gross monetary return of 6,729ETB ha-1
.
Muoneke and Asiegbu, (1997) obtains the highest monetary return in maize-okra
intercropping was from the highest okra planting density. The overall mean gross monetary
advantage of 24,368 ETB ha-1
was obtained from intercropping system. Intercropping maize-
pigeon pea gave a gross monetary advantage of 75% and 21% of their respective sole crops of
maize and pigeon pea respectively.
Table 5. LER and GMR as influenced by spatial arrangements and population densities of
pigeon pea in maize/pigeon pea intercropping.
Treatments Grain yield (tha
-1)
Total LER Monetary return
(ETB ha-1
) Maize Pigeon pea
Spatial Arrangement
1mz:1pp 3.68b 0.47
b 1.00
b 20553
a
1mz:2pp 3.74a 0.75
a 1.16
a 28185
a
LSD (5%) 0.31 0.13 0.19 9413
World Scientific News 53(3) (2016) 216-229
-227-
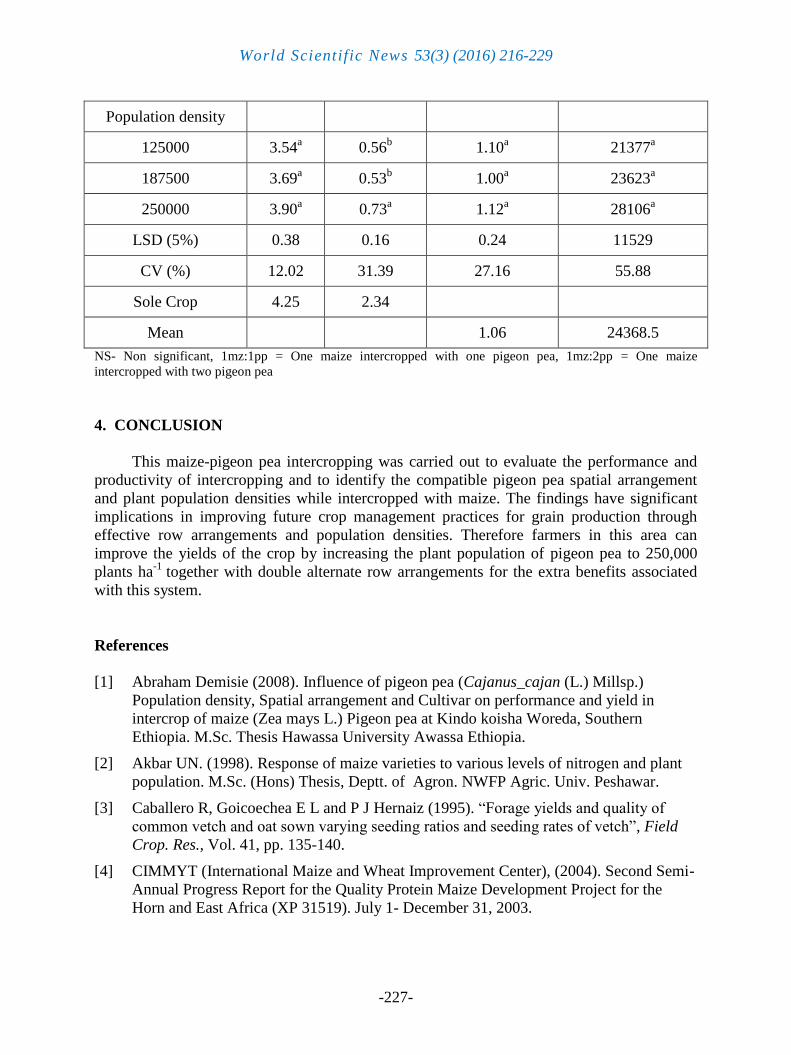
Population density
125000 3.54a 0.56
b 1.10
a 21377
a
187500 3.69a 0.53
b 1.00
a 23623
a
250000 3.90a 0.73
a 1.12
a 28106
a
LSD (5%) 0.38 0.16 0.24 11529
CV (%) 12.02 31.39 27.16 55.88
Sole Crop 4.25 2.34
Mean 1.06 24368.5
NS- Non significant, 1mz:1pp = One maize intercropped with one pigeon pea, 1mz:2pp = One maize
intercropped with two pigeon pea
4. CONCLUSION
This maize-pigeon pea intercropping was carried out to evaluate the performance and
productivity of intercropping and to identify the compatible pigeon pea spatial arrangement
and plant population densities while intercropped with maize. The findings have significant
implications in improving future crop management practices for grain production through
effective row arrangements and population densities. Therefore farmers in this area can
improve the yields of the crop by increasing the plant population of pigeon pea to 250,000
plants ha-1
together with double alternate row arrangements for the extra benefits associated
with this system.
References
[1] Abraham Demisie (2008). Influence of pigeon pea (Cajanus_cajan (L.) Millsp.)
Population density, Spatial arrangement and Cultivar on performance and yield in
intercrop of maize (Zea mays L.) Pigeon pea at Kindo koisha Woreda, Southern
Ethiopia. M.Sc. Thesis Hawassa University Awassa Ethiopia.
[2] Akbar UN. (1998). Response of maize varieties to various levels of nitrogen and plant
population. M.Sc. (Hons) Thesis, Deptt. of Agron. NWFP Agric. Univ. Peshawar.
[3] Caballero R, Goicoechea E L and P J Hernaiz (1995). “Forage yields and quality of
common vetch and oat sown varying seeding ratios and seeding rates of vetch”, Field
Crop. Res., Vol. 41, pp. 135-140.
[4] CIMMYT (International Maize and Wheat Improvement Center), (2004). Second Semi-
Annual Progress Report for the Quality Protein Maize Development Project for the
Horn and East Africa (XP 31519). July 1- December 31, 2003.

World Scientific News 53(3) (2016) 216-229
-228-
[5] CSA (Central Statistical Agency), (2012). Agricultural Sample survey: report on area
and production of major crops (private peasant holdings, Meher season). Statistical
Bulletin, (1). Addis Abeba.
[6] Dahmardeh, AM. Ghanbari, B.A. Syahsar and M. Ramrodi, (2010), The role of
intercropping maize (Zea mays L.) and Cowpea (Vigna unguiculata L.) on yield and soil
chemical properties. African J. Agric. Res. 5(8): 631-636.
[7] Dhima K.V., Lithourgidis A.S., Vasilakoglou I.B. and. Dordas C.A, (2007).
Competition indices of common vetch and cereal intercrops in two seeding ratio. Field
Crops Research 100, 249-256.
[8] FAO (Food and Agriculture organization of the United Nations). (2011). FAOSTAT
online database, available at link http://faostat.fao.org/. Accessed on December 2011.
[9] Geremew Yadessa. (2006). Influence of cowpea sowing date and population density on
performance and yield in intercrop of sorghum-cowpea. M.Sc. Thesis. University of
Hawassa, Awassa, Ethiopia.
[10] Hirpa Legesse. (2006). Sorghum-pigeon pea intercropping under semi-arid areas of
Meiso, Eastern Ethiopia: The effect of Spatial arrangement and Plant population. M.Sc.
Thesis. University of Hawassa, Awassa, Ethiopia.
[11] http://exploreit.icrisat.org/page/pigeonpea/687.
[12] Muoneke CO and Asiegbu JE (1997). Effect of Okra Planting Density and Spatial
Arrangement in Intercrop with Maize on the Growth and Yield of the Component
Species. Department of Crop Science, University of Nigeria, Nsukka, Nigeria
[13] Muoneke CO and Mbah EU (2007). Productivity of cassava/okra intercropping systems
as influenced by okra planting density. Department of Agronomy, Michael Okpara
University of Agriculture, Umudike. African Journal of Agricultural Research Vol. 2
(5), pp. 223-231,
[14] Ossom EM and Rhykerd RL (2007). Phaseolus vulgaris L. population density affects
intercropped Ipomoea batatas (L.) Lam. Trans. Illinois State Acad. Science, 100(1). 13-
23.
[15] Palaniappan SP (2000). “Cropping system in the tropic”, publ. Mohander Singh Sejwal
for Wiley Eastern Limited, 4835/ 24 Ansori road, Daryagari, New Delhi 110002.
[16] SAS Institute. (2000). SAS User’s Guide, Statistics version 8.2 ed. SAS Inst., Cary, NC,
USA.
[17] Snapp, S.S., Rohrbach, D.D., Simtowe, F. & Freeman, H.A., (2002). Sustainable soil
management options for Malawi: can smallholder farmers grow more legumes?
Agriculture, Ecosystems and Environment, 91, 159-174.
[18] Thwala MG and Ossom EM (2004). Legume- maize association influences crop
characterstics and yields. Faculty of Agriculture, university of Swaziland, P.O.
Luyenzo, Swaziland M 205.

World Scientific News 53(3) (2016) 216-229
-229-
[19] Tamiru Hirpa (2014). Effect of intercrop row arrangement on maize and haricot bean
productivity and the residual soil. World Journal of Agricultural Sciences Vol. 2(4), pp.
069-077.
[20] Tolossa Debele (1996). Varietal combination and plant density for maize/ haricot bean
intercropping at Bako in Western Ethiopia. In proceedings of the Eastern and Southern
Africa Regional maize conference. June 3-7, Arusha, Tanzania.
[21] Tsubo M., Walker S. and Ogindo HO., (2005), A simulation model of cereal–legume
intercropping systems for semi-arid regions II. Model application. Field Crops Research
93 10-22.
[22] Vandermeer JH (1989). The ecology of intercropping. Cambridge Univ. Press. New
York.
[23] Vandermeer JH (1990). “Intercropping agroecological”, Mc. Graw–Hill (Eds), New
York, Pp. 481-516.
[24] Walelign Demisie (2006). Effect of plant population density on yield and yield
components of two pigeonpea (Cajanus cajan (L.) Millsp) varieties at Awassa. M.Sc.
Thesis Hawassa university, Ethiopia.
[25] Willey RW (1979). Intercropping: Its importance and research needs. Part I.
Competition and yield advantages. Field crop Abstract. 32: 1-10.
( Received 24 July 2016; accepted 12 August 2016 )