effect of process mixing on the size distribution and mean
TRANSCRIPT
Louisiana State UniversityLSU Digital Commons
LSU Master's Theses Graduate School
2014
Effect of process mixing on the size distribution andmean diameter of the thiol-triacrylatemicrocapsulesRubaiyet AbedinLouisiana State University and Agricultural and Mechanical College
Follow this and additional works at: https://digitalcommons.lsu.edu/gradschool_theses
Part of the Chemical Engineering Commons
This Thesis is brought to you for free and open access by the Graduate School at LSU Digital Commons. It has been accepted for inclusion in LSUMaster's Theses by an authorized graduate school editor of LSU Digital Commons. For more information, please contact [email protected].
Recommended CitationAbedin, Rubaiyet, "Effect of process mixing on the size distribution and mean diameter of the thiol-triacrylate microcapsules" (2014).LSU Master's Theses. 3767.https://digitalcommons.lsu.edu/gradschool_theses/3767

EFFECT OF PROCESS MIXING ON THE SIZE DISTRIBUTION AND MEAN
DIAMETER OF THE THIOL-TRIACRYLATE MICROCAPSULES
A Thesis
Submitted to the Graduate Faculty of the
Louisiana State University and
Agricultural and Mechanical College
in partial fulfillment of the
requirements for the degree of
Master of Science
in
The Gordon A. and Mary Cain Department of Chemical Engineering
by
Rubaiyet Abedin
B.S., Bangladesh University of Engineering and Technology, 2009
May 2014

ii
ACKNOWLEDGEMENTS
This thesis summarizes results of my scientific work on trithiol-triacrylate microparticles
during the entire year 2013 at LSU. First and foremost I would like to express my deepest
gratitude to my advisor Dr. F. Carl Knopf, for his excellent guidance, caring, patience, and
providing me an excellent opportunity to work on this exciting and challenging project. I would
like to thank Dr. John A. Pojman for providing me the opportunity to work in his lab and his
continuous guidance.
I am also grateful to my committee member Dr. Ralph W. Pike. I sincerely thank Dr.
Rafael Cueto for his support. I really appreciate Paul Rodriguez and Joe Bell for the assistance
with the reactor construction and the solving problems with running set-ups, Ying Xiao for lab
support, Darla Dao for financial compensation and supply ordering support, Melissa Fay and
Rachel Landry for administrative support.
Finally, I could not do all this without the love and support of my family. I would like to
hearty thank my husband, Mahdi, for having faith in me and supporting me and my parents for
their love, generosity and understanding.

iii
TABLE OF CONTENTS
ACKNOWLEDGEMENTS……………………………………………………………………….ii
LIST OF TABLES………………………………………………………………………………..iv
LIST OF FIGURES……………………………………………………………………………….v
ABSTRACT……………………………………………………………………………………..vii
CHAPTER 1- INTRODUCTION………………………………………………………………....1
CHAPTER 2- LITERATURE REVIEW……………………………………………………….....3
2.1 Microencapsulation……...………………………………………………………………3
2.2 Application of Microencapsulation...……………………………………………………5
2.3 Different Process of Microencapsulation…...………………………………………….10
2.4 Control of the Microparticle Size...…………………………………………………….16
2.5 Primary-Amine Catalyzed Thiol Acrylate Reaction Meachanism……...……………...21
CHAPTER 3- EFFECT OF PROCESS MIXING OF MICROPARTILCES…………………...24
3.1 Introduction…………………………………………………………………………….24
3.2 Experimental…………………………………………………………………………....25
3.2.1 Materials Evaluation……………………………………………………....26
3.2.2 Microparticle Preparation Method………………………………………...27
3.2.3 Apparatus………………………………………………………………….28
3.2.4 Characterization of Microparticles……………………………………... .29
3.2.4.1 Scanning Electron Microscopy………………………………….29
3.2.4.2 Size and Size Distribution…………………………………….....29
3.2.4.3 Power Input……………………………………………………...30
3.3 Result and Discussion…………………………………………………………………..31
3.3.1 Microcapsules Characterization: Morphology and Size………………......31
3.3.2 Size Distribution…………………………………………………………..34
3.3.3 Effect of Oscillation Amplitude and Frequency…………………………..48
3.3.4 Effect of Surfactant Concentration………………………………………..52
3.3.5 Energy Dissipation Calculation and Comparison of the Reactors………...53
CHAPTER 4- CONCLUSION AND RECOMMENDATIONS………………………………..58
REFERENCES…………………………………………………………………………………..60
VITA……………………………………………………………………………………………..66

iv
LIST OF TABLES
Table 3.1: Energy dissipation rate and particle size for the reactor with three blade
propeller……………………………………………………………………………………..55
Table 3.2: Energy dissipation rate and particle size for the oscillatory reactor………………….56

v
LIST OF FIGURES
Figure 2.1 Schematic illustrations of microparticle……………………………………………….4
Figure 2.2 Different types of morphology of microparticles (Gharasallaoui et al., 2007)………..5
Figure 2.3 Trends in microencapsulation technology; Reference source: Chemical Abstract
(Gouin, 2004)………………………………………………………………………………...6
Figure 2.4 Schematic illustration of spray drying process……………………………………….11
Figure 2.5 Schematic representation of the coacervation process; (a) Dispersion of core material
in shell polymer solution, (b) Coacervate separation from solution, (c) Coating of core
material by coacervate droplet, (d) Coalescence of coacervate to form continuous shell
around the core……………………………………………………………………………...12
Figure 2.6 Schematic representation of fluidized bed process; (a) Top spray, (b) Bottom
spray.......................................................................................................................................13
Figure 2.7 Schematic diagram of extrusion process……………………………………………..15
Figure 2.8 Schematic illustrations of dispersion polymerization (Kawaguchi and Ito, 2005)…..16
Figure 2.9 Reaction mechanism, Step 1: Amine Nucleophile Pre-initiation………………….....21
Figure 2.10 Reaction mechanism, Step 2: Initiation…………………………………………......22
Figure 2.11 Reaction mechanism, Step 3: Propagation 1………………………………………..22
Figure 2.12 Reaction mechanism, Step 4: Propagation 2………………………………………..23
Figure 3.1 Flow diagram of the microencapsulation process…………………………………....25
Figure 3.2 Chemical structure of the materials used for microparticle synthesis……………….26
Figure 3.3 Diagram of agitation reactor………………………………………………………….28
Figure 3.4 Diagram of oscillatory reactor………………………………………………………..29
Figure 3.5 Scanning electron microscopy images showing visual size difference agitated at three
different RPM: (A) 1000 RPM, (B) 1700 RPM, and (C) 2000 RPM at x200
magnification………………………………………………………………………………..32
Figure 3.6 Scanning electron microscopy images showing visual size difference agitated at three
different RPM: (A) 1000 RPM, (B) 1700 RPM, and (C) 2000 RPM, at x500
magnification………………………………………………………………………………..32
vi
Figure 3.7 Scanning electron microscopy images showing small microparticles prepared at (A)
1700 RPM (x2000 magnification) (B),(C) 2000 RPM (x2000 and x6000
magnification)………………………………………………………………………………33
Figure 3.8 Size distribution of the microparticles prepared at (a) 300, (b) 500, (c) 800, (d) 1000,
(e) 1200, (f) 1500 and (g) 1700 RPM using the reactor with the impeller………………….35
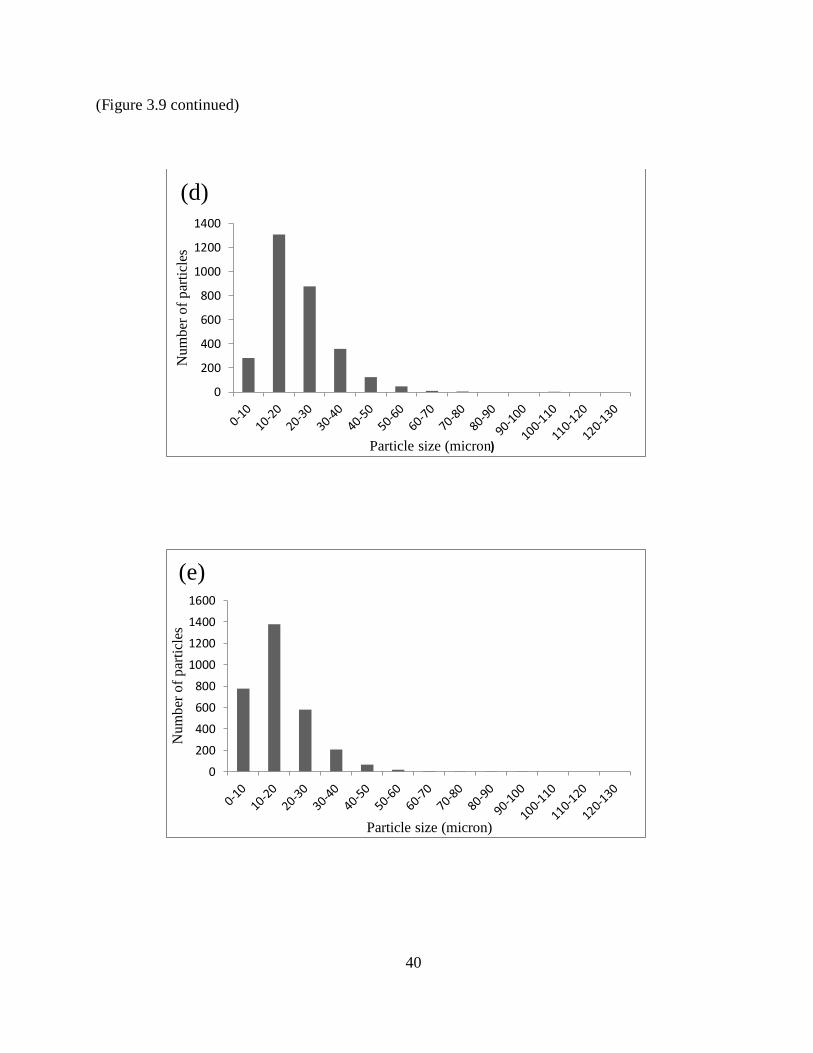
Figure 3.9 Size distribution of the microparticles prepared at (a) 4.3, (b) 7.1, (c) 10.6, (d) 14,
(e) 17.6 Hz frequencies and 5 mm oscillation amplitude…………………………………...38
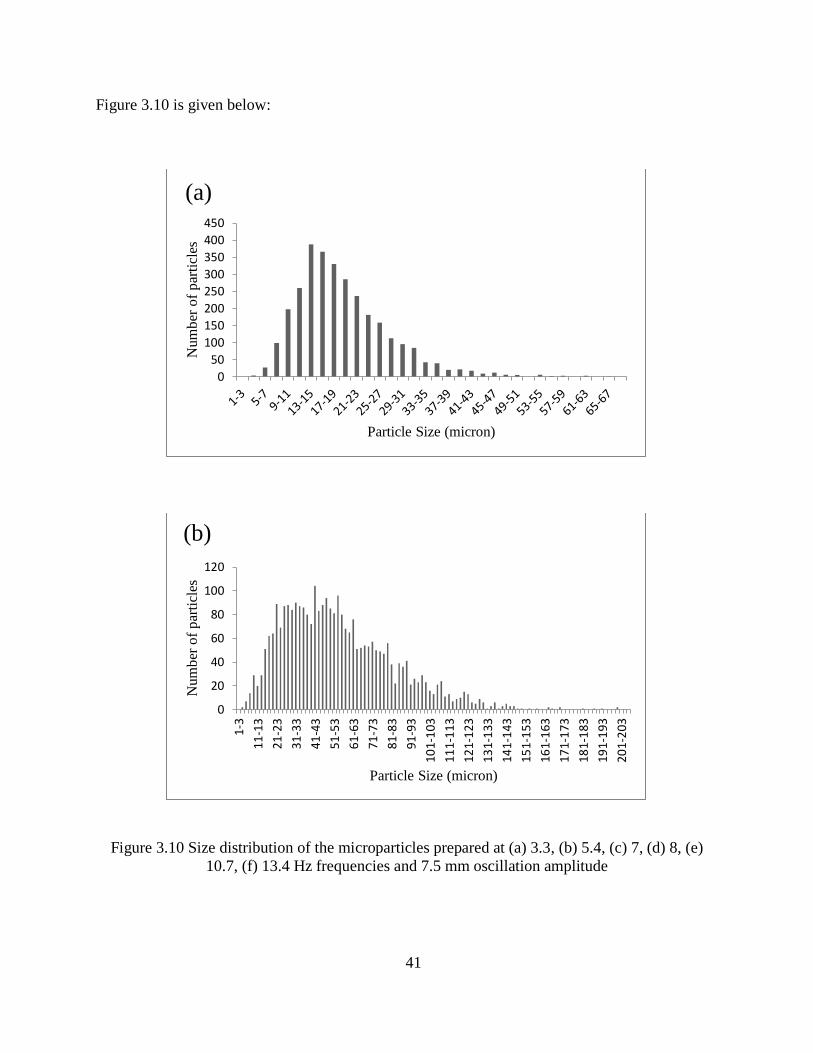
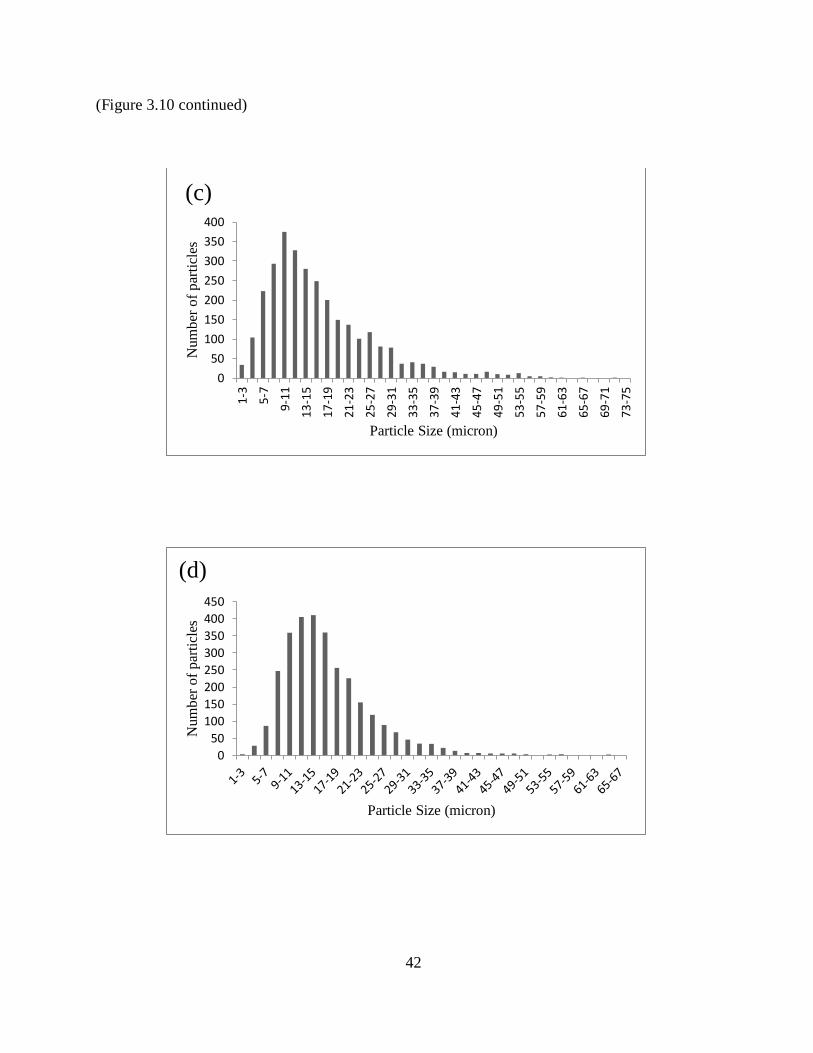
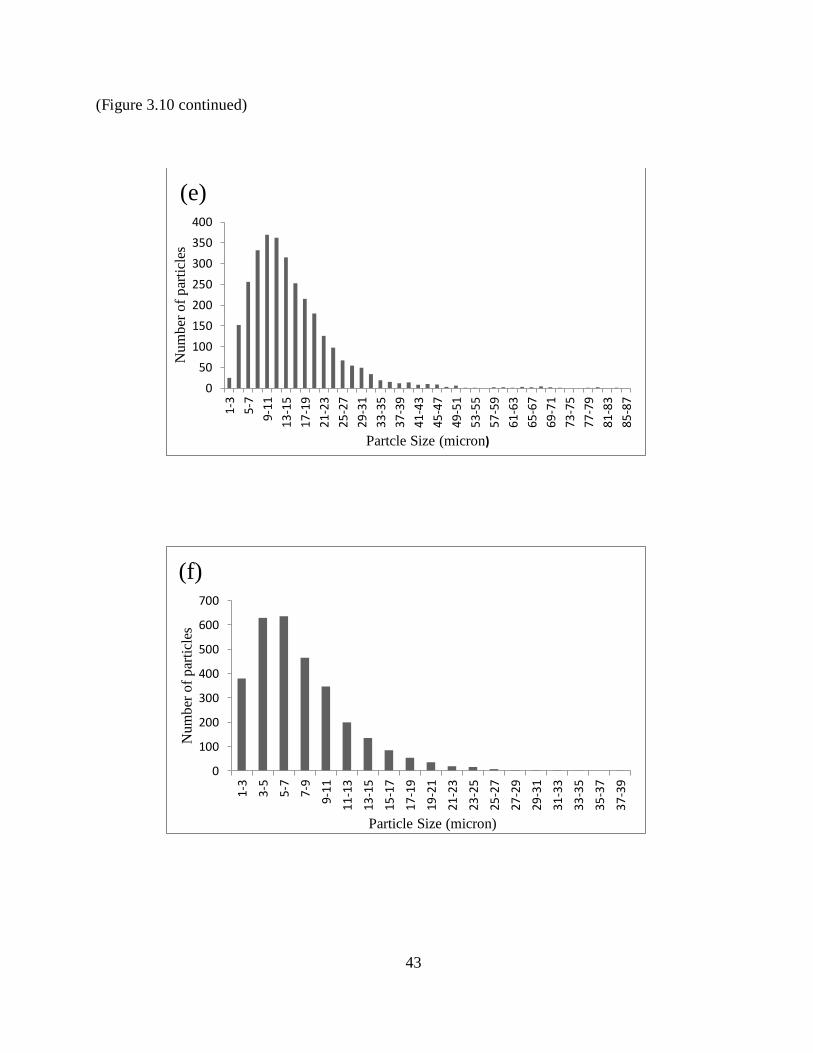
Figure 3.10 Size distribution of the microparticles prepared at (a) 3.3, (b) 5.4, (c) 7, (d) 8,
(e) 10.7, (f) 13.4 Hz frequencies and 7.5 mm oscillation amplitude………………………..41
Figure 3.11 Size distribution of the microparticles prepared at (a) 2.7, (b) 4.5, (c) 6.7, (d) 8.8, (e)
11.6 Hz frequencies and 10 mm oscillation amplitude……………………………………..44
Figure 3.12 Particle size distribution as a function of stirring rate used during
microencapsulation………………………………………………………………………….47
Figure 3.13 Mean microparticle size as a function of stirring rate used during
microencapsulation………………………………………………………………………….48
Figure 3.14 Particle size distribution as a function of oscillation frequency used during
microencapsulation at a constant oscillation amplitude (a) 5 mm (b) 7.5 mm and (c) 10
mm…………………………………………………………………………………………..49
Figure 3.15 Mean particle size as a function of oscillation frequency used during
microencapsulation at constant oscillation amplitude (5 mm, 7.5 mm and 10 mm)……….51
Figure 3.16 Mean particle size as a function of oscillation amplitude at a constant oscillation
frequency (11 0.6 Hz)……………………………………………………………………...51
Figure 3.17 Mean particle size as a function of PVA concentration…………………………….53
Figure 3.18 Particle size distributions for two types of reactor at 1000 rpm…………………….55
Figure 3.19 Mean particle size as a function of energy dissipation per unit mass………………57

vii
ABSTRACT
An important limitation in the development of the microparticles is the difficulty to
develop a precise size distribution. Microparticles have a wide spread applicability in different
fields including medical, pharmaceutical, textile, cosmetics, pesticide, printing industry, etc. The
large and growing impact of microencapsulation in different fields of technology has made this
process important. Microparticle size is a primary determinant of control release mechanism and
the reaction kinetics and also impacts the allowable routes of administration, The main objective
of this research work is to evaluate the effect of the process mixing on the size and size
distribution of the trithiol-triacrylate microparticles prepared via dispersion polymerization using
the primary amine catalyzed addition of trithiol to triacrylate. The influence of several synthesis
parameters such as, the stirring rate, oscillation frequency and amplitude, surfactant
concentration in the aqueous phase on the size distribution of the microparticles has been
investigated. A comparison between the reactor with three blades propeller and oscillatory
reactor in terms of particle size distribution and energy dissipation per unit mass has been
reported. A laboratory investigation has been performed to identify the most suitable reactor
based on the desired size distribution of the micropartcles. The experimental results indicate that
oscillatory reactor is more suitable to achieve small particle size and narrow size distribution.

1
CHAPTER 1- INTRODUCTION
Microencapsulation is an advanced approach used to immobilize, protect, isolate and
control the rate of transfer of core materials, thereby improving the quality of the industrial
commercial product. It can be used to extend the shelf life of the core component, preserving the
properties which are commercially beneficial. Prolonged storage ability undermines the loss of
degradation (Madene et al., 2006; Pena et al., 2012). These facts have helped to promote the
microencapsulated particles in different process, and especially where the possibility to control
the reaction kinetics exists. The size of the microparticles plays an important role in the process
kinetics and release mechanism. Lack of the ability to predict and control the size distribution of
the microparticles can be a problem leading to the inability to predict the chemical properties of
the particles accurately and the extent of materials availability.
The aim of this research is to compare the ability of two different reactor types to produce
microparticles. Microparticles will be produced by the method described by Bounds et al.
Bounds et al. described a novel approach to prepare microparticles using trithiol and triacrylate
by dispersion polymerization. In this process, a primary amine is used as the initiator and the
produced microcapsules consist of a solid matrix enveloping pockets of core material. This
process is different from a normal microencapsulation process where the final particle is a thin
shell containing a liquid core. The chemistry used to prepare these microcapsules is a versatile in
terms of synthesis flexibility. To vary the properties of the microcapsules a multitude of different
monomers can be used. The reaction can be modified using different core material giving the
improvement of desired characteristics. This type of microparticles can be used for simulated
release or controlled release mechanisms depending on the core material used (Bounds et al.,
2012). Traditionally, this type of macro and micro scale synthesis is done using a propeller

2
reactor. The primary objective here is to evaluate the performance of a piston driven reactor to
achieve a narrow size distribution.
The first chapter of the thesis dissertation focuses on the background and motivation. The
aim of this research work is to investigate the size and size distribution of the microparticles by
manipulating different operational and design variables. To understand the importance and
impact of the size distribution it is necessary to know about microencapsulation. Chapter 2
focuses on the microencapsulation process, application and different procedure and the impact of
size distribution. In Chapter 3, the effect of process mixing is investigated. All the experimental
work has been done by controlling process parameters and using different reactor types. The
corresponding effects on the mean size and size distribution of the microparticles have been
characterized in this chapter. Finally, the fourth chapter lists some prospective future work.
3
CHAPTER 2- LITERATURE REVIEW
2.1 Microencapsulation
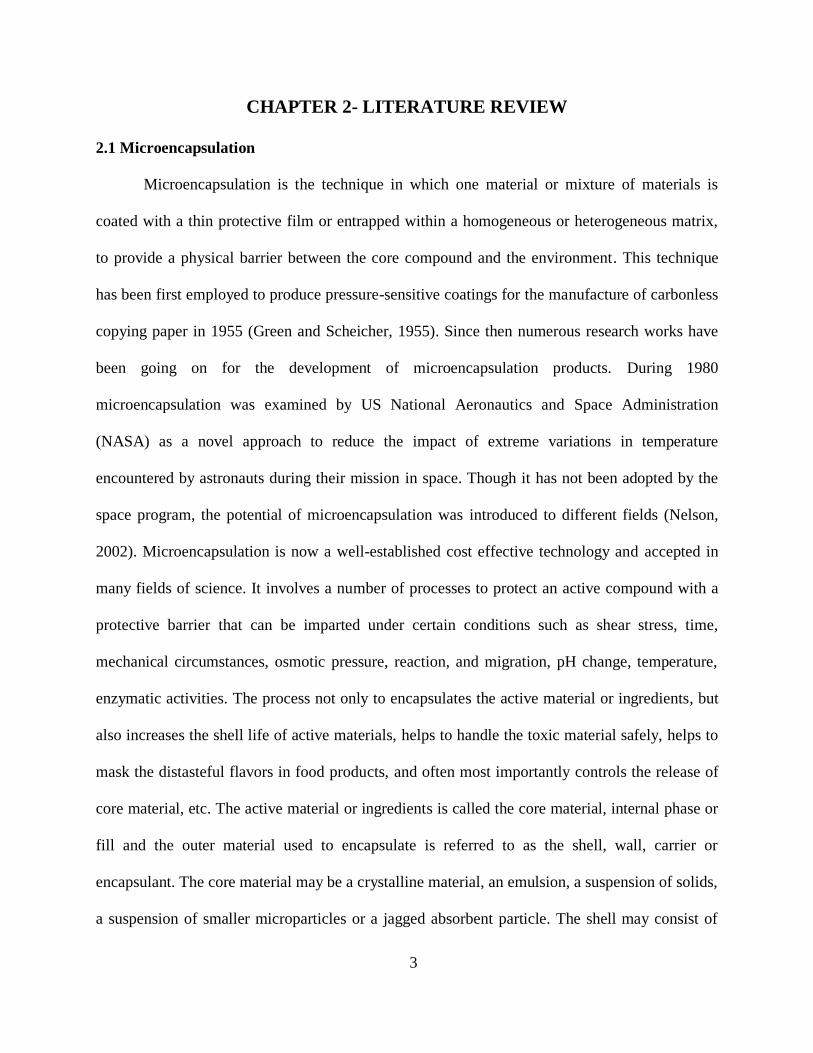
Microencapsulation is the technique in which one material or mixture of materials is
coated with a thin protective film or entrapped within a homogeneous or heterogeneous matrix,
to provide a physical barrier between the core compound and the environment. This technique
has been first employed to produce pressure-sensitive coatings for the manufacture of carbonless
copying paper in 1955 (Green and Scheicher, 1955). Since then numerous research works have
been going on for the development of microencapsulation products. During 1980
microencapsulation was examined by US National Aeronautics and Space Administration
(NASA) as a novel approach to reduce the impact of extreme variations in temperature
encountered by astronauts during their mission in space. Though it has not been adopted by the
space program, the potential of microencapsulation was introduced to different fields (Nelson,
2002). Microencapsulation is now a well-established cost effective technology and accepted in
many fields of science. It involves a number of processes to protect an active compound with a
protective barrier that can be imparted under certain conditions such as shear stress, time,
mechanical circumstances, osmotic pressure, reaction, and migration, pH change, temperature,
enzymatic activities. The process not only to encapsulates the active material or ingredients, but
also increases the shell life of active materials, helps to handle the toxic material safely, helps to
mask the distasteful flavors in food products, and often most importantly controls the release of
core material, etc. The active material or ingredients is called the core material, internal phase or
fill and the outer material used to encapsulate is referred to as the shell, wall, carrier or
encapsulant. The core material may be a crystalline material, an emulsion, a suspension of solids,
a suspension of smaller microparticles or a jagged absorbent particle. The shell may consist of

4
multiple layers depending on the nature of application. Generally the shell material has no
reactivity with the core material; the shell material is used only to protect the core by locking it
up in a membrane thereby creating a barrier from the exterior medium. The choice of external
shell depends on a number of factors including the purpose of the shell, nature of the core
material, the process of encapsulation, product objectives and application, requirement of the
process, process economy, time effect, etc. A schematic illustration of microparticles has shown
in Figure 2.1.
Figure 2.1 Schematic illustrations of microparticle
Depending on the application, technique used for encapsulation, core properties, the
matrices of encapsulation can be of various shapes including film, sphere, irregular shape,
various structures: porous or compact, various thicknesses: uniform or non-uniform and various
physical structures: amorphous, crystalline, rubbery, glassy, etc. Some different shapes of
microparticles have been illustrated in Figure 2.2.

5
Figure 2.2 Different types of morphology of microparticles (Gharasallaoui et al., 2007)
2.2 Application of Microencapsulation
The simplicity and flexibility of microencapsulation has made it easily adaptable to many
process. Collective application of microencapsulation include application in food industry,
cosmetics, textiles, agriculture, medications or drug delivery system, printing industries-
carbonless copy paper, pesticides, etc.
Encapsulation is widely used in food industry for applications such as protection from
reactive environment (oxygen, water, acid, etc.), controlled or sustained release- both time
controlled and temporal release, stabilization of the ingredients during processing, masking
flavors , colors or odors, protecting components against nutritional loss, extension of the shell
life. Flavor and aroma are two sensitive and important components for food products which are
difficult to control. By encapsulating these components it becomes possible to limit the loss
during processing and storage, limit the degradation and control the quality of the products.

6
Vitamin, fats and oils, enzymes, minerals, colorants, aroma compounds are often encapsulated to
maintain the quality. Carbohydrate, starch, protein, maltodextrin, gums are often used as shell
materials (Madene et al., 2006). Since mid-1950 there have been increasing number of
publications (scientific, non-scientific articles and patents) on microencapsulation techniques
used in food industry (Gouin, 2004). Figure 2.3 illustrates the upward trend of
microencapsulation publications in food processing industry.
Figure 2.3 Trends in microencapsulation technology; Reference source: Chemical abstract
(Gouin, 2004)
In the textile industry, microencapsulation has been used for imparting finishes and
properties such as abrasion resistance, water repellent, leather aspect, improvement and
durability of the aroma of the fabrics by using essential oil, perfume release etc. With the
intention of ensuring a long-lasting fragrance, currently the perfume encapsulation technology is
being used for the development of innovative textile products. Pena et al. has investigated the

7
process of encapsulating vanillin as a perfume component and promoting suitability for a long
lasting release (Pena et al., 2012). Another study has demonstrated the encapsulation of flame
retardant in a commercial coating for textile applications (Giraud et al., 2005).
Periodic direct application of pesticide in the form of powder, granules or concentrated
emulsion can cause environmental contamination, which can affect terrestrial and aquatic
ecosystems. The potential risk can be decreased by using the pesticides in the microencapsulated
form. Alachlor, fonofos, pyrethrin, methyl parathion, diazinon, etc. insecticides are already being
marketed as microcapsules. Rivas et al. has described the procedure of the encapsulation of
pyrethroid into polyurea microparticles (Rivas et al., 2006). Encapsulated microparticles can be
used to reduce environmental toxicity as well as the reduction of green contamination, extend
activity, reduce evaporative losses and leaching, protect ecosystem from potential risk and
environmental degradation and reduce the active pesticide levels in the environment. The
presence of pharmaceutically active compound (PhAC) can be harmful to the ecosystem.
Whelehan et al. has studied the recovery of seven PhAC from aqueous solution using liquid-core
microparticles including the feasibility, kinetics and the efficiency of the process (Whelehan et
al., 2010). Due to undesirable side effect involving toxicity and carcinogenity, it is necessary to
remove 2-sec-butyl-4,6-dinitrophenol (DNBP) from the environment. The process of the removal
of DNBP from aqueous solution has been investigated by Wang et al. using encapsulated
potassium ferrate (VI) (K2FeO4) (Wang et al., 2009).
The potential impact of cell microencapsulation technologies is enormous from a
therapeutic and economic perspective. This technology can be used in the treatment of numerous
medical diseases including cancer, central nervous system diseases and endocrinological
disorders. Long term production of therapeutic products from the encapsulated cells can be used

8
for the treatment of chronic diseases like Hyperparathyroidism, Parkinson’s disease, Hemophilia,
Diabetes mellitus, hepatic failure. (Murua et al., 2008). The controlled, continuous, delivery of
therapeutic products by the immunoisolated cells is a cost effective method. Researchers believe
that the potential of cell microencapsulation is enormous and it can make significant
contributions to medicine over the next decade (Orive et al., 2004).
The controlled-release properties of microparticles are extensively used for many
prescription and non-prescription medications, some of which can be taken orally.
Microencapsulation can be used to obtain long acting injectable drug depot formulations and
specific drug targeting options. Microparticles provide an alternative to multiple injections to
obtain sustained release of the drug with a single administration. Herrero-Vanrell et al. reported
the ongoing research of the biodegradable polymeric microparticles loaded with drugs for the
delivery by intravitreous injection to treat diverse vitreoretinal diseases (Vanrell and Refojo,
2001). Abdelbary et al. studied the encapsulating process of glipizide, which is a second
generation sulfonylurea that can acutely lower the blood sugar level in human by stimulating the
release of insulin from the pancreas, within certain hydrophilic polymer to control the release of
this highly water insoluble drug (Abdelbary et al., 2012). Tu et al. described the process of
encapsulating hydroxybenzoic acid (p-HBA) and lysozyme within a bioerodible polymer using a
carbon dioxide antisolvent (Tu et al., 2002). Another study reported the development of the
encapsulation process of antigens and their release from polymeric systems in a controlled and
timely manner (Sanchez et al., 1996). Researchers are hopeful that in near future the
encapsulation technique might be developed as one of the important part of the treatment of
various neurological degenerative diseases (Miyoshi et al., 1996). All this studies clearly indicate
the prospective advances in the field of medicine and pharmacy.
9
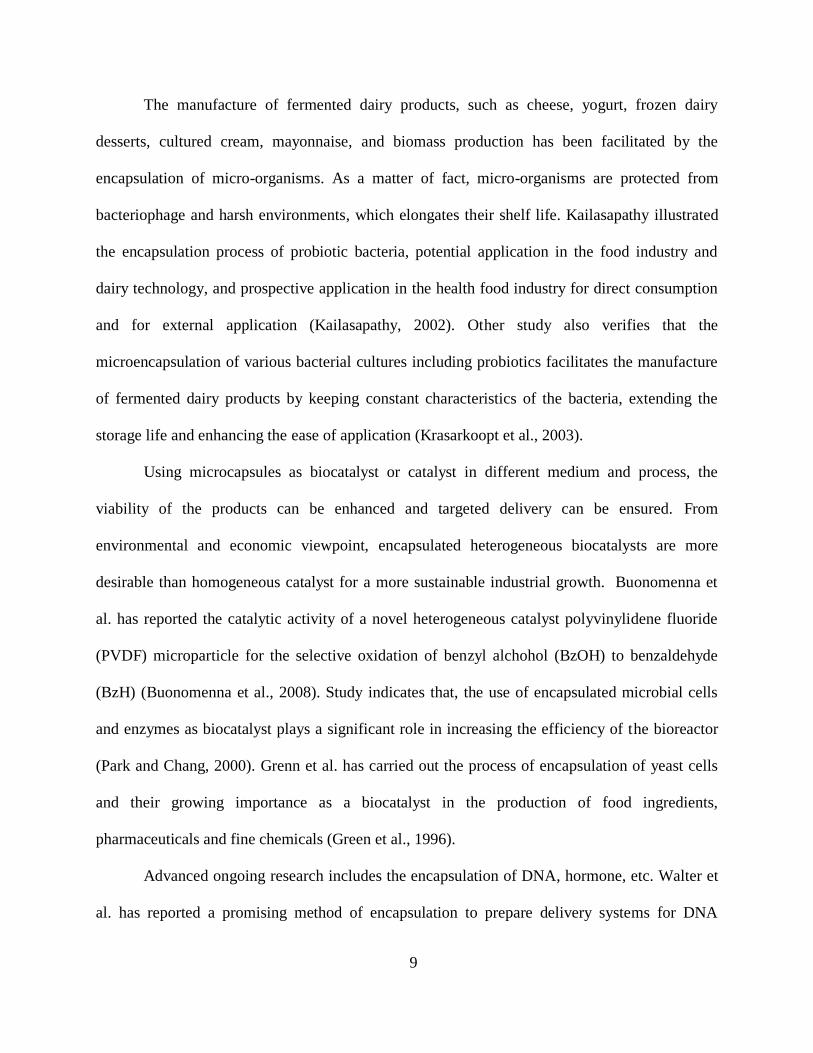
The manufacture of fermented dairy products, such as cheese, yogurt, frozen dairy
desserts, cultured cream, mayonnaise, and biomass production has been facilitated by the
encapsulation of micro-organisms. As a matter of fact, micro-organisms are protected from
bacteriophage and harsh environments, which elongates their shelf life. Kailasapathy illustrated
the encapsulation process of probiotic bacteria, potential application in the food industry and
dairy technology, and prospective application in the health food industry for direct consumption
and for external application (Kailasapathy, 2002). Other study also verifies that the
microencapsulation of various bacterial cultures including probiotics facilitates the manufacture
of fermented dairy products by keeping constant characteristics of the bacteria, extending the
storage life and enhancing the ease of application (Krasarkoopt et al., 2003).
Using microcapsules as biocatalyst or catalyst in different medium and process, the
viability of the products can be enhanced and targeted delivery can be ensured. From
environmental and economic viewpoint, encapsulated heterogeneous biocatalysts are more
desirable than homogeneous catalyst for a more sustainable industrial growth. Buonomenna et
al. has reported the catalytic activity of a novel heterogeneous catalyst polyvinylidene fluoride
(PVDF) microparticle for the selective oxidation of benzyl alchohol (BzOH) to benzaldehyde
(BzH) (Buonomenna et al., 2008). Study indicates that, the use of encapsulated microbial cells
and enzymes as biocatalyst plays a significant role in increasing the efficiency of the bioreactor
(Park and Chang, 2000). Grenn et al. has carried out the process of encapsulation of yeast cells
and their growing importance as a biocatalyst in the production of food ingredients,
pharmaceuticals and fine chemicals (Green et al., 1996).
Advanced ongoing research includes the encapsulation of DNA, hormone, etc. Walter et
al. has reported a promising method of encapsulation to prepare delivery systems for DNA

10
vaccination and represented the design of DNA vaccination delivery systems for the targeting of
professional antigen presenting cells as an interesting approach to flight viral infections and in
cancer therapy (Walter et al., 1999). Controlled release of therapeutic proteins such as growth
hormones, growth factors, cytokines for a desired period of time can be accomplished by
encapsulation. Kim et al. has described the process of encapsulating recombinant human growth
hormone (rhGH) within poly(D,L-lactic-co-glycolic acid) microparticles (Kim and Park, 1999).
Donal et al. has demonstrated the encapsulation process of steroids in poly(lactide-co-glycolide)
microparticles to incorporate long-acting drug delivery system (Cowsar et al., 1985).
2.3 Different Process of Microencapsulation
Microencapsulation is not only used for controlled release or target delivery, it also used
to add values to the product. Gouin et al., Wieland et al. has described a number of techniques
that are used to microencapsulate materials in a number of different industries including spray
drying, spray chilling/cooling, coacervation, fluidized bed coating process, solvent evaporation,
centrifugal extrusion, rotational suspension separation, interfacial polymerization (Gouin, 2004;
Wieland et al., 2002).
Spray drying is the most common, well-established, straight forward, flexible and
economical method of encapsulation. In this process, core or wall material is atomized though a
nozzle or spinning wheel in the presence of co-current or counter-current hot air flow. Schematic
illustration of microencapsulation process by spray drying has been shown in Figure 2.4.

11
Figure 2.4 Schematic illustration of spray drying process
Food ingredients such as flavors, lipids and carotenoids are encapsulated mostly using
this process, and this technology is now becoming available to satisfy the increasingly
specialized necessity of the market. Gharsallaoui et al. has represented an overview of the
application of spray drying in microencapsulation of food ingredients using different shell
materials, the technical and operational conditions for the spray drying process (Gharasallaoui et
al., 2007). Teixeira et al. has used this process to encapsulate short chain fatty acid within the
shell produced by gum Arabic and maltodextrin mixture (Teixeira et al., 2004). Spray cooling or
spray chilling is similar to this process except for the facts that the core material is dispersed in a
liquefied coating or wall material and cooled or chilled air is used instead of hot air. This
technology is used to encapsulate a number of organic and inorganic salts, enzymes, flavors, and
other ingredients to improve heat stability, delay release in wet environments, etc. properties and
is often regarded as one of the least expensive encapsulation technology (Gouin, 2004).

12
Coacervation is often regarded as the original, unique and rather expensive encapsulation
technology. The theory behind it is the phase separation of one or many hydrocolloids from the
initial solution, and the subsequent deposition of the newly formed coacervate phase around the
active ingredient suspended or emulsified in the same medium Generally different types of oils,
vitamin are encapsulated using this method (Gouin, 2004). Arshady has presented a
methodological survey of the coacervation technique used to manufacture the microparticles and
has exemplified the effect of manufacturing parameters on microparticle characteristics
(Arshady, 1989). Figure 2.5 illustrates the schematic representation of coacervation process.
Figure 2.5 Schematic representation of the coacervation process; (a) Dispersion of core material
in shell polymer solution, (b) Coacervate separation from solution, (c) Coating of core material
by coacervate droplet, (d) Coalescence of coacervate to form continuous shell around the core.
One of the few efficient and advanced technologies to apply an identical layer of shell
material onto solid particles is fluidized bed technology (schematic illustration -Figure 2.6),
which is also competent for controlled release applications. This process is becoming a
promising technique of encapsulation for large scale production. In this process shell material is
sprayed onto the individual solid core particles in liquid form and the coated particles are either
dried by solvent evaporation or cooling in a zone where they are being cycled again and again
13
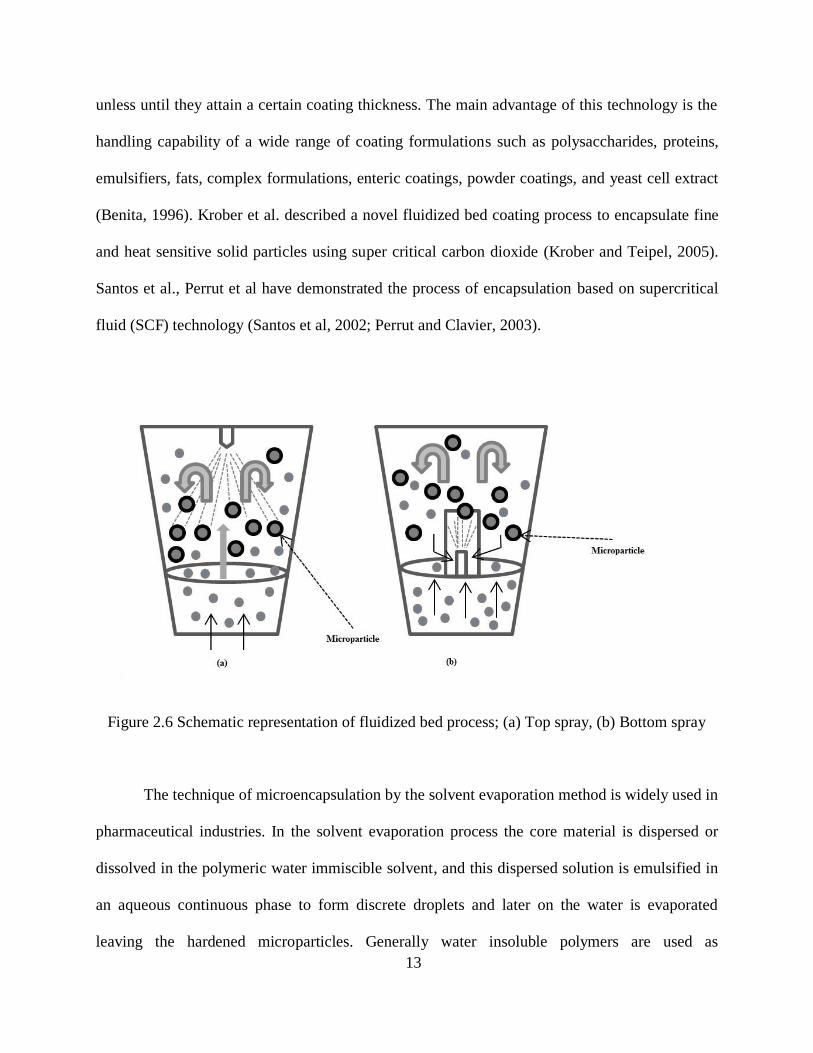
unless until they attain a certain coating thickness. The main advantage of this technology is the
handling capability of a wide range of coating formulations such as polysaccharides, proteins,
emulsifiers, fats, complex formulations, enteric coatings, powder coatings, and yeast cell extract
(Benita, 1996). Krober et al. described a novel fluidized bed coating process to encapsulate fine
and heat sensitive solid particles using super critical carbon dioxide (Krober and Teipel, 2005).
Santos et al., Perrut et al have demonstrated the process of encapsulation based on supercritical
fluid (SCF) technology (Santos et al, 2002; Perrut and Clavier, 2003).
Figure 2.6 Schematic representation of fluidized bed process; (a) Top spray, (b) Bottom spray
The technique of microencapsulation by the solvent evaporation method is widely used in
pharmaceutical industries. In the solvent evaporation process the core material is dispersed or
dissolved in the polymeric water immiscible solvent, and this dispersed solution is emulsified in
an aqueous continuous phase to form discrete droplets and later on the water is evaporated
leaving the hardened microparticles. Generally water insoluble polymers are used as

14
encapsulation matrix and different types of drugs including steroids, narcotic agents, fertility
control agents, anti-cancer drugs, local anesthetics, insulin, vaccine, cisplatin, lidocaine,
naltrexone are encapsulated using solvent evaporation process. Patrick et al. has summarized the
advances in the solvent evaporation method to produce biodegradable poly(lactic acid) (PLA)
and poly(lactic-co-glycolic acid) (PLGA) microparticles (O’Donnel and McGinity, 1997). Li et
al. has reviewed the process of encapsulation by solvent evaporation and focused on the physical
properties of the material and operating condition, different aspects of microparticles; hence
studied the numerical model based on the solvent evaporation technique (Li et al, 2008).
Another type of encapsulation, which is highly suitable because of its simplicity,
promptness, high loading capacity and hefty production scale, is interfacial polymerization. In
this process microparticle shells are formed by polymerization of reactive monomers. A new
technique for encapsulation of an insect growth regulator pyriproxyfen using interfacial
polymerization has been reported by Tsuda et al. and the produced microparticles exhibit an
intriguing property of bursting spontaneously (Tsuda et al, 2012). Hirech et al. has described the
procedure to obtain insecticide microparticles by interfacial polymerization, which is processed
in a stirred-batch reactor (Hirech et al., 2003). In situ polymerization is analogous to interfacial
polymerization except the fact that no reactive agents are added to the core material. This kind of
polymerization is used to produce small microparticles loaded with carbonless paper inks or
perfume for scented strips and the polymerization occurs in the continuous phase and
microcapsule shell is formed at the interface of dispersed core material and continuous phase
(Benita, 1996).
Extrusion is exclusively used to encapsulate volatile and unstable flavors. During this
process the dispersion of the core material in a molten mass is forced through a die into a

15
dehydrating liquid, and it hardens the coating to trap the core material. The schematic diagram of
extrusion process has been presented in Figure 2.7. The main disadvantage of this process is the
formation of large particles and limited range of shell material (Gouin, 2004).
Figure 2.7 Schematic diagram of extrusion process
Centrifugal extrusion is the process in which a spinning two-fluid nozzle is used to
produce two-fluid (mutually immiscible liquid-core and the shell material) column or rod that
breaks up into a stream of spherical droplets spontaneously after it emerges from the nozzle
(Benita, 1996). Rotational suspension separation is claimed to be a cost effective, fast, high
volume method of encapsulating materials in which the core material is suspended into the shell
material and this mixture is introduced onto a conical or bowl shaped rotating disk. The
encapsulated particles are whirled off the disk and then dried or chilled (Benita, 1996). There are
several other methods used to synthesize microparticles depending on the core and shell
16
materials and the morphology of the produced capsules, such as phase separation (Atkin et al.,
2004), suspension polymerization (Sanchez-Silva et al., 2010).
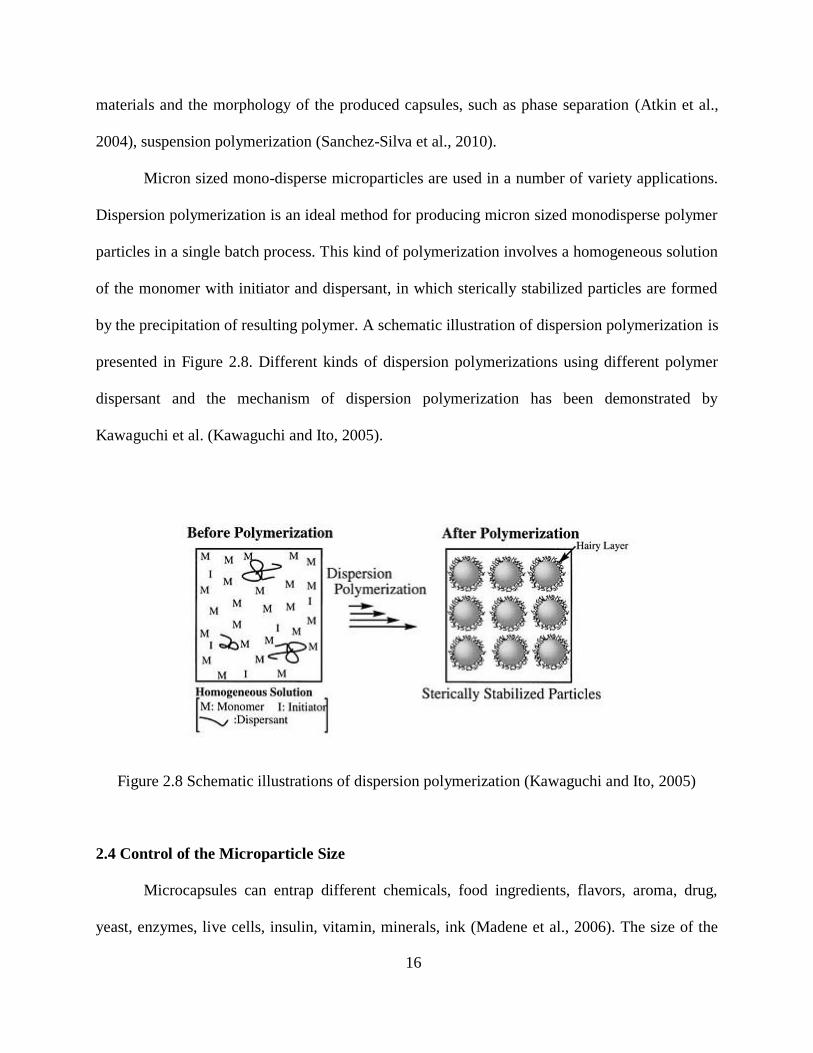
Micron sized mono-disperse microparticles are used in a number of variety applications.
Dispersion polymerization is an ideal method for producing micron sized monodisperse polymer
particles in a single batch process. This kind of polymerization involves a homogeneous solution
of the monomer with initiator and dispersant, in which sterically stabilized particles are formed
by the precipitation of resulting polymer. A schematic illustration of dispersion polymerization is
presented in Figure 2.8. Different kinds of dispersion polymerizations using different polymer
dispersant and the mechanism of dispersion polymerization has been demonstrated by
Kawaguchi et al. (Kawaguchi and Ito, 2005).
Figure 2.8 Schematic illustrations of dispersion polymerization (Kawaguchi and Ito, 2005)
2.4 Control of the Microparticle Size
Microcapsules can entrap different chemicals, food ingredients, flavors, aroma, drug,
yeast, enzymes, live cells, insulin, vitamin, minerals, ink (Madene et al., 2006). The size of the

17
commercially produced microparticles vary between 3 and 800 µm and contain about 10-90 wt.
percent core (Benita, 1996). Size and size distribution of the microparticles has a great impact on
the process mechanism, reaction kinetics, allowable routes of administration, release rate of the
encapsulated core materials. The change in the process parameter of the microparticles can
influence the properties and the performance of microparticles such as, mechanical strength, ease
of filtration, friability, etc. (Nesterova, 2012). Microparticle applications are basically
administrated by the size, shape and morphologies of the microparticles. Smaller microparticles
may exhibit poor encapsulation efficiency, undesirable release of the core material or migration
from the site of injection. Larger microparticles may also exhibit poor encapsulation efficiency
due to elongated release time and undesired sizes. Some critical applications require
microparticles of specific size. For such applications, poly-disperse microparticles must be
filtered, sieved or separated to produce microparticles of a desired range using different
techniques.
Particle size has a tremendous effect on the release rate and the drug delivery system. The
particle size distribution containing anticancer drugs ranged from 1 to 30 µm and by mixing
microparticles of smaller size with larger size a release profile with intermediate release rate can
be attained. Thus controlled release can be moderated by appropriate mixing of the micro-
particles of different sizes to ensemble the requirements of cancer chemotherapy (Narayani and
Rao, 1996). In the drug delivery system, relative drug release rate decreases with the increasing
size of microparticles regardless of the type of drug. The composition, micro particle size and the
manufacturing process can strongly affect the system properties, kinetics and the drug release
mechanism (Siepmann et al., 2004). Cell encapsulation allows the transplantation of non-human
cells that could be considered as an alternative to the limited supply of donor tissue, and it allows
18
the delivery of the product for a longer period of time as cells release the products continuously.
For this type of application, the desired microparticle size is within the range 100-500 µm, and
these small microparticles allow their implantation in close contact to the blood stream, which is
beneficial in some specific application of cell encapsulation (Murua et al., 2008).
Microencapsulation of live BCG organism for the targeted delivery to the lung is also dependent
on the particle size. Desired size of microparticles for the delivery of BCG vaccine to the lung is
5-15 µm (for injecting the particles intravenously targeted to the lung as a result of entrapment
within the lung capillaries) or 1-5 µm (for delivery by inhalation) (Kwok et al., 1991). Study
shows that for immobilizing living bacterial cells, the capsule size is a crucial factor and for
industrial application design and development of equipment to generate precise and uniform
microparticles are required (Kailasapathy, 2002).
Control of microparticle size and size distribution is also important implications in other
applications too. For example, metal ion extraction application by encapsulating an extracting
agent. Using small microparticles (for copper ion mean dia. 10 µm) can give a large interfacial
area, which will enhance the extraction kinetics and mechanical resistance for more intensive use
(Lagucir et al., 2002). The acceptable size for the microparticles filled with reactive healing
agents into coating matrix used for a heavy duty anticorrosive coating layer is 100-200 µm.
Microparticles smaller than that cannot contain the required healing agent, larger than that can
moderate the mechanical and visual properties of the coatings (Nesterova et al., 2012).
A major issue in fabricating the microparticle products is controlling the size distribution
and for controlled release drug delivery technologies, a long sought goal is the ability to control
the release rate of encapsulated compounds. Microparticle size plays an important role in the
release kinetics. Whelehan et al. has emphasised the effect of microparticle size and membrane

19
thickness on the extraction rate of the liquid core (Whelehan et al., 2010). Microparticle size and
size distribution often can be controlled poorly with standard deviations equal to 25-50%
(Berkland et al., 2001). The process selected for microencapsulation depends on the desired size
of the encapsulated products and the physiochemical properties of both shell and core materials.
But the size of the microparticles also depends on the process of synthesis and reactant used.
In recent years there have been several reports of the fabrication of microcapsules with
precise size distribution using several different approaches. Kwok et al. has described a novel
method to produce microparticles of size range 5-15 µm by air atomization technique. In this
technique; liquid and pressurized air is fed to the atomizer forcing tiny liquid droplets out
through the orifice of the nozzle, and the process is then followed by the centrifugation at a high
rotational speed. The concept behind using the turbotak is to produce droplets within the desired
size range, so that a narrow size distribution can be achieved (Kwok et al., 1991). Controlling the
size of emulsion droplets and emulsification time, dynamic effect on the size distribution of
microparticles can be obtained. Bahl et al. has demonstrated that decreases in the microparticles
size as a function of emulsification time, mostly caused by the fragmentation of emulsion droplet
upon stirring, is accompanied by the increases in the total number of microparticles and their
surface area (Bahl and Sah, 2000). Several studies have indicated that fabricating different
microfluidics continuous synthesis of microcapsules of desired size distribution can be
accomplished. Using microfluidics devices for microencapsulation is a unique approach to attain
fast and continuous production of polymer particles and microparticles with various shapes
ranging from 20 to 200 µm (Nie et al., 2005). Martin-Banderas et al. has described a versatile
technology of encapsulation using flow focusing atomizer, which is another kind of microfluidic
device which produces microparticles of controlled size and specific morphology. Flow focusing

20
technology is useful to produce small particles with different fluid combinations and the particle
size is determined by the nozzle dimension (Martin-Banderas et al., 2005). Cho et al. has shown
the procedure to prepare highly mono-disperse polymer/liquid crystal microparticles by solute
co-diffusion method. In this method, a liquid crystal is dissolved in a solvent into the pre-existing
mono-sized crosslinked polymer particles in the form of a fine emulsion. Polymer microparticles
loading a single liquid crystal domain are obtained when the solvent is evaporated (Cho et al.,
2002). Kontturi et al. has developed a laboratory scale simple, inexpensive and flexible device
that can produce uniform small sized (< 300 µm) cell microparticles (Kontturi et al., 2011).
A number of studies show that microparticle size is also affected by different process
parameters such as, emulsifier concentration, stirring rate, device parameter ratio, different phase
volume, etc. Poncelet et al. has studied the impact of using different type of impellers, rotational
speed, and emulsifier concentration on the mean diameter of hexanemethylene sebacamide
microparticles and concluded that the selection of appropriate impeller design can affect the size
distribution of the microparticles (Smet et al., 1990). Valot et al. has also reported the effect of
different process parameters such as surfactant concentration, core material quantity, influence of
the solvent used, volume of the different phases, stirring rate on the properties, especially the size
and the size distribution of biocompatible Ibuprofen-loaded microparticles (Valot et al., 2009).
The effect of process temperature and concentration of ethyl gellate on the size and structure of
monodisperse poly(N-isopropylarylamide) has been represented by Mou et al. (Mou et al., 2012).
Liu et al. has described the procedure of preparing uniform-sized biodegradable PLA/ PLGA
microparticles loaded with recombinant human insulin (rhI) by combining a Shirasu Porous
Glass (SPG) membrane emulsification technique and a double emulsion evaporation method
(Liu et al., 2005). Poly( monomethoxypoly ethylene glycol-co-D,L-lactide) (PELA)

21
microparticles with narrow size distribution and smooth morphology can be prepared by
combining premix membrane emulsification technique and double emulsion solvent extraction
method (Wei et al., 2011).
2.5 Primary-Amine Catalyzed Thiol Acrylate Reaction Mechanism
Thiol Acrylate chemistry possesses some exceptionally useful properties which can be
utilized in different fields. Bounds et al. has illustrated one reaction mechanism that can occur
with thiols and acrylates (Bounds et al., 2012). The four step primary-amine catalyzed thiol
acrylate reaction involves one pre-initiation, one initiation, and two propagation steps. The
involvement of two propagation steps leads the reaction to be known as step growth
polymerization. The reaction proceeds comprising the nucleophilic addition of the primary
octylamine catalyst to the electron deficient ene. This step is known as pre-initiation step (Figure
2.9). The resulting carbanion from the pre-initiation step abstracts an acidic thiol proton and
forms a thiolate anion, which is known as initiation of an anionic step-growth polymerization.
Once initiated, unlike the free-redical thiol-ene mechanism, termination is not facilitated by the
combination of two growing chains. The reaction is represented in Figure 2.10.
Figure 2.9 Reaction mechanism, Step 1: Amine Nucleophile Pre-initiation
22
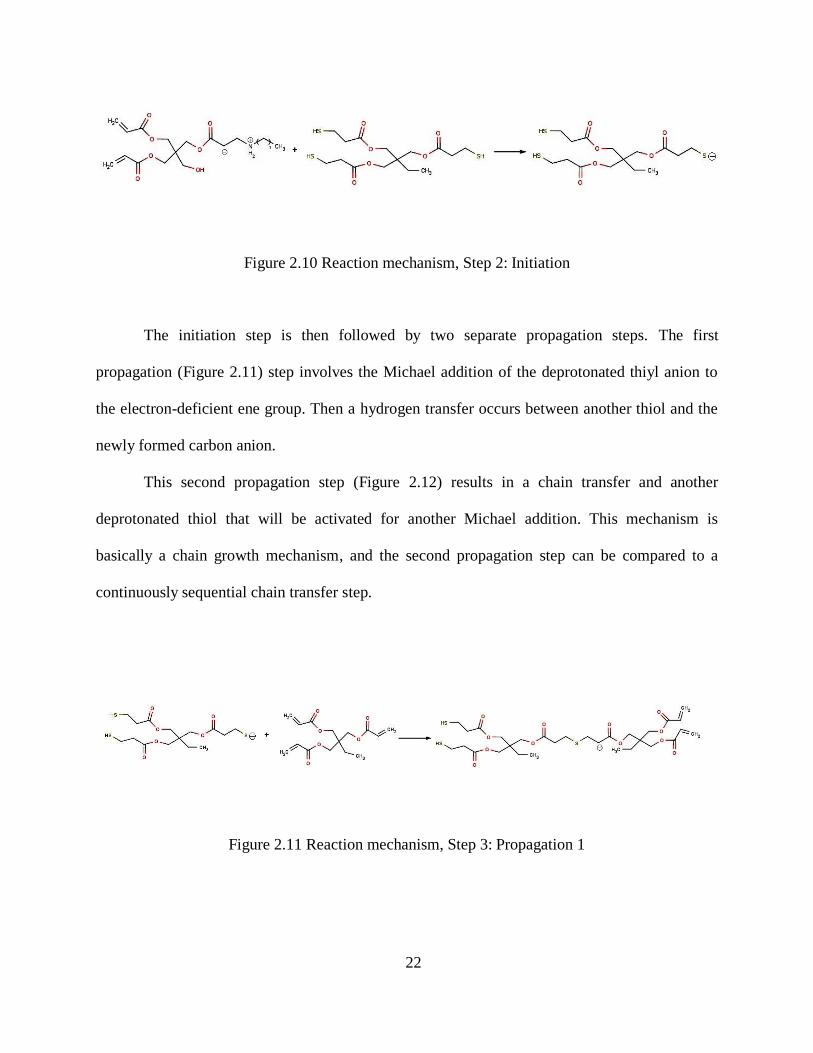
Figure 2.10 Reaction mechanism, Step 2: Initiation
The initiation step is then followed by two separate propagation steps. The first
propagation (Figure 2.11) step involves the Michael addition of the deprotonated thiyl anion to
the electron-deficient ene group. Then a hydrogen transfer occurs between another thiol and the
newly formed carbon anion.
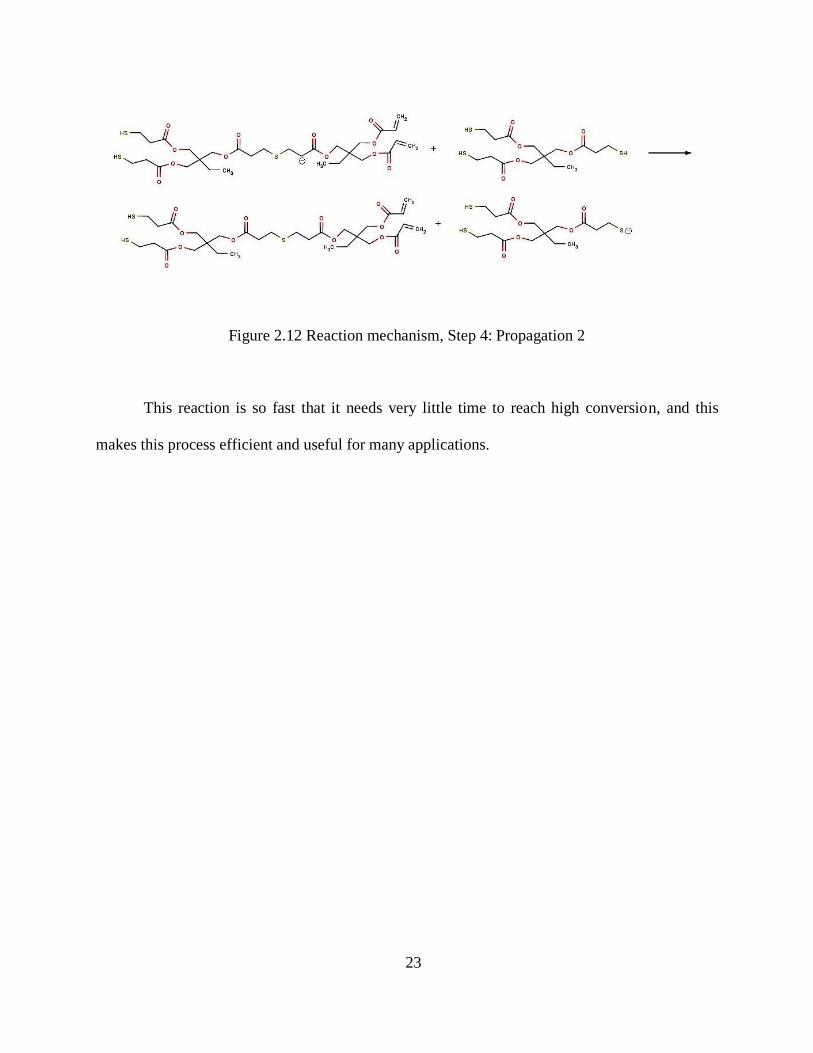
This second propagation step (Figure 2.12) results in a chain transfer and another
deprotonated thiol that will be activated for another Michael addition. This mechanism is
basically a chain growth mechanism, and the second propagation step can be compared to a
continuously sequential chain transfer step.
Figure 2.11 Reaction mechanism, Step 3: Propagation 1
23
Figure 2.12 Reaction mechanism, Step 4: Propagation 2
This reaction is so fast that it needs very little time to reach high conversion, and this
makes this process efficient and useful for many applications.

24
CHAPTER 3- EFFECT OF PROCESS MIXING ON MICROPARTICLES
3.1 Introduction
Encapsulation is the technique in which a substance is coated with or entrapped within
another material or system. The transfer of this substance can affect the surroundings (Madene et
al., 2006). Different approaches are available in the literature for the preparation of
microcapsules including spray drying, interfacial polymerization, in situ polymerization,
fluidized bed coating, Centrifugal extrusion. Different polymer shell materials are available such
as gelatin (Ugwoke et al., 1997), polyurethane (Tsuda et al., 2012), poly(tetrahydrofuran) (Atkin
et al., 2004), poly(lactic acid), poly(N-isopropylarylamide) (Mou et al., 2012). Choice of the
synthesis method and wall materials generally depends on the core material and the application.
Some methods necessitate specific conditions including definite temperature rise, pressure, non-
ambient conditions, lengthy reaction time, and multitude of components. Depending on the core
material microcapsules can be used for either a stimulated release or controlled release. Bounds
et al. studied the mechanism of microencapsulation using different core materials including
dimethyl-para-toluidine (DMpT), BF3-amine complex, Carbon nanotube, and BCl3-amine
complex. Rheology testing and Instron testing of the microparticles has been conducted to
explore the rheoogical properties of the microparticles containing different core (Bounds et al.,
2012). The trithiol-triacrylate method of encapsulation explored here has multiple advantages
over other microencapsulation processes. These microparticles can be prepared at room
temperature and at ambient pressure with a small number of components within one hour. The
chemicals are reasonably safe to work with and inexpensive. Due to simplicity this process of
encapsulation has been chosen for this research. This microencapsulation process can be
described using the following flow diagram (Figure 3.1):

25
Figure 3.1 Flow diagram of the microencapsulation process
The aim of this research is the fabrication of this microparticle using trithiol and
triacrylate and exploration of methods or reactor types to control microparticle size. Two
different types of reactor (traditional stirred and piston driven) have been used to evaluate the
effectiveness of the microencapsulation process and the size distribution of the microparticles.
The synthesis parameters investigated are stirrer rate and surfactant concentration for the reactor
with a three-blade propeller; and oscillation amplitude and frequency for the piston/oscillatory
reactor.
3.2 Experimental
This section provides brief description of the experimental procedure used for the
synthesis of the microparticles and concise report on the apparatus and the method used. The
experimental procedure is basically a modified interfacial polymerization. Here an organic
solution is dispersed in an immiscible aqueous solution, and polymerization occurs by means of
a molecule containing a hydrophilic amino head and a hydrophobic hydrocarbon tail. An

26
overview of the reaction mechanism was given in Section 2.3. Microparticles prepared for
investigation contain no core material.
3.2.1 Materials Evaluation
The materials used for this process are poly vinyl alcohol (PVA), trimethylolpropane
triacrylate (TMPTA), trimethylolpropane tris (3-mercaptopropionate) (TMPTMP), and
octylamine. Poly vinyl alcohol is used as surfactant and octylamine is used as initiator. Poly
(vinyl alcohol) 87-89% hydrolyzed, trimethylolpropane triacrylate technical grade,
trimethylolpropane tris (3-mercaptopropionate), and octylamine 99% were obtained from Sigma-
Aldrich. All materials are used without further purification. Chemical structures are illustrated in
Figure 3.2.
F
Figure 3.2 Chemical structure of the materials used for microparticle synthesis

27
3.2.2 Microparticle Preparation Method
The process of microencapsulation consists of the dispersion of a solution containing a
core material dissolved in a stoichiometrically equivalent solution of the monomers. As this
research work deals with the microparticles containing no core material, only the dispersion
solution of stoichiometrically equivalent monomers has been prepared. We combine 15.94 g of
TMPTMP and 11.85 g of TMPTA. The solution is then emulsified in 500 ml aqueous solution
containing 1.28% PVA. For the emulsification, we use various amount and sources of energy in
order to obtain a desired size of the microparticles. PVA is the surfactant to stabilize the system.
In this research work two reactor types were evaluated. The first reactor is equipped with a three-
bladed propeller. The second one is an oscillatory system in which a piston is used to supply the
required shear force. The mixture is agitated or oscillated for 1 hour and 15 min at a defined rpm
unless until the desired droplet size is achieved. Once the droplet size is satisfactory,
approximately 3% by volume of octylamine is added to the mixture to initiate the
polymerization. The complete reaction time is 1 hour 30 min. The whole encapsulation process is
carried on at room temperature and ambient pressure. The produced microparticles are collected
by filtering. Then they are dried for 12 hours in ambient air. Depending on the contained core
material, solvents may be used to wash the excess core material from the exterior of the shell
prior to the incorporation into a given system. This research work explores microparticles
without any core material, and here the exterior of the microparticles are washed using distilled
water.
28
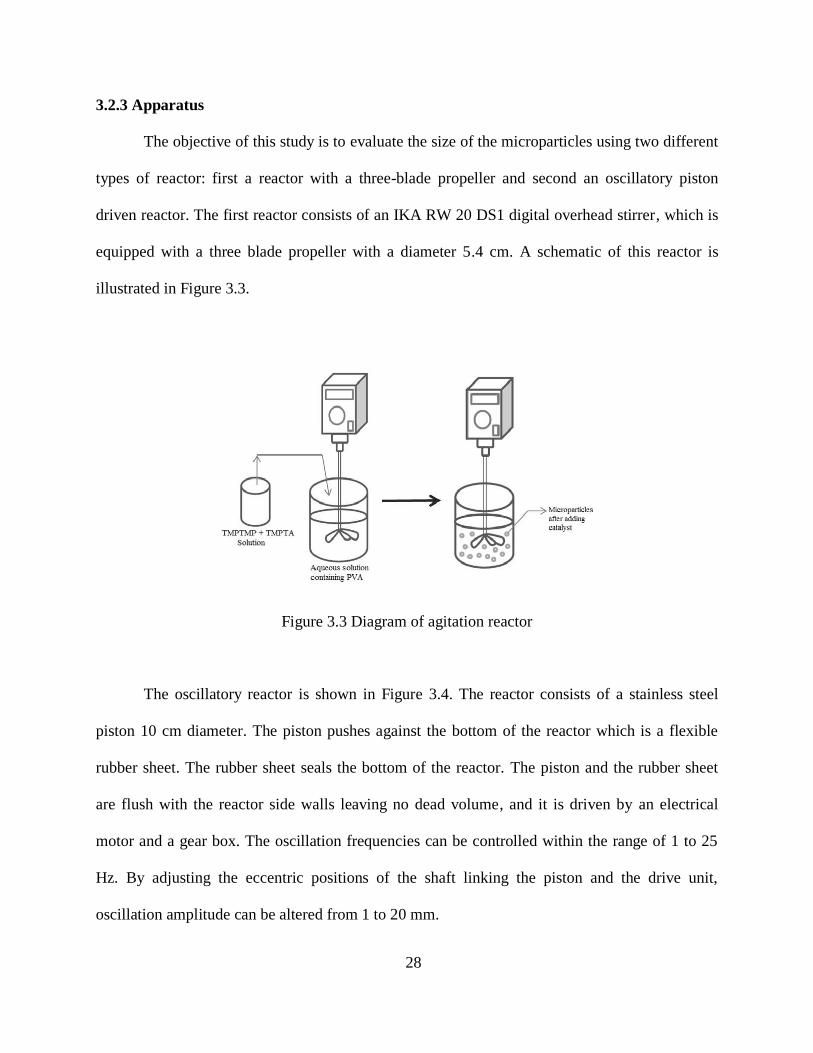
3.2.3 Apparatus
The objective of this study is to evaluate the size of the microparticles using two different
types of reactor: first a reactor with a three-blade propeller and second an oscillatory piston
driven reactor. The first reactor consists of an IKA RW 20 DS1 digital overhead stirrer, which is
equipped with a three blade propeller with a diameter 5.4 cm. A schematic of this reactor is
illustrated in Figure 3.3.
Figure 3.3 Diagram of agitation reactor
The oscillatory reactor is shown in Figure 3.4. The reactor consists of a stainless steel
piston 10 cm diameter. The piston pushes against the bottom of the reactor which is a flexible
rubber sheet. The rubber sheet seals the bottom of the reactor. The piston and the rubber sheet
are flush with the reactor side walls leaving no dead volume, and it is driven by an electrical
motor and a gear box. The oscillation frequencies can be controlled within the range of 1 to 25
Hz. By adjusting the eccentric positions of the shaft linking the piston and the drive unit,
oscillation amplitude can be altered from 1 to 20 mm.

29
Figure 3.4 Diagram of oscillatory reactor
3.2.4 Characterization of Microparticles
The procedures used to determine the shape, size and the surface morphology of the
microparticles are described in this section.
3.2.4.1 Scanning Electron Microscopy
Microparticle surface features and diameters are determined using a JSM-6610LV
Scanning Electron Microscope. The microparticles are sprinkled on metal stubs with double
sided conductive adhesive tape and dried overnight. A thin platinum layer of approximately 15
nm thickness is used to coat the micropartciles; an EMS 550x Sputter Coater is used.
3.2.4.2 Size and Size Distribution
Microparticle size and size distribution are important factors for industrial application. In
this work microparticle size was determined using a phase contrast Nikon ECLIPSE 50i
microscope equipped with a Nikon Digital Sight DS-Fi1 camera. Small samples of the produced
microparticles and liquid were spread over a glass coverslip immediately following the synthesis

30
and allowed to dry for 12 hours. This sample was then observed under the microscope with a
magnification less than or equal to 10x. NIS-element BR 3.0 software determined particle size.
Approximately 3000 particles were analyzed in each sample to determine mean particle diameter
and size distribution. The variation in size distribution can be expressed in terms of the particle
volume fraction. Particle volume fraction may be defined as,
∑
(1)
Here, is the i-th particle diameter; is the number of the particle with diameter and is
the total number of the particles counted.
3.2.4.3 Power Input
Power consumption is the mechanical energy transferred from the impeller or piston to
the fluid. The power input causes fluid motion, which can be used to correlate mixing and rates
of mass transfer. Impeller power consumption (P) is a function of impeller speed, diameter,
location and design, reactor size and geometry, baffle design, etc. (Oldshue, 1983). To calculate
the power consumption, correlations have been established primarily through extensive
experimental work. Power consumption, P can be given by (Tatterson, 1991),
(2)
Here, is dimensionless power number, which relates the effect of geometry and flow regime
to the power consumption. is the density of the fluid. is the impeller speed and is the
impeller diameter. The power number can be calculated using the associated Reynolds number of
the fluid. Power consumption for the reactor with the three-blade propeller can be calculated.
Power consumption per unit mass of liquid in the reactor with a vibrating piston can be
expressed as (Knopf et al., 2006),
31
(3)
Here, is power consumption per unit mass, is the amplitude for the solid piston (constant)
in mm, and is the frequency of oscillation in rad/s.
3.3 Result and Discussion
Synthesis of the microparticles has been performed following the procedure developed by
Christopher et al. (Bounds et al., 2012). Two different reactor types were evaluated. In this
section, results of the studies will be presented in terms of the size of the microparticles.
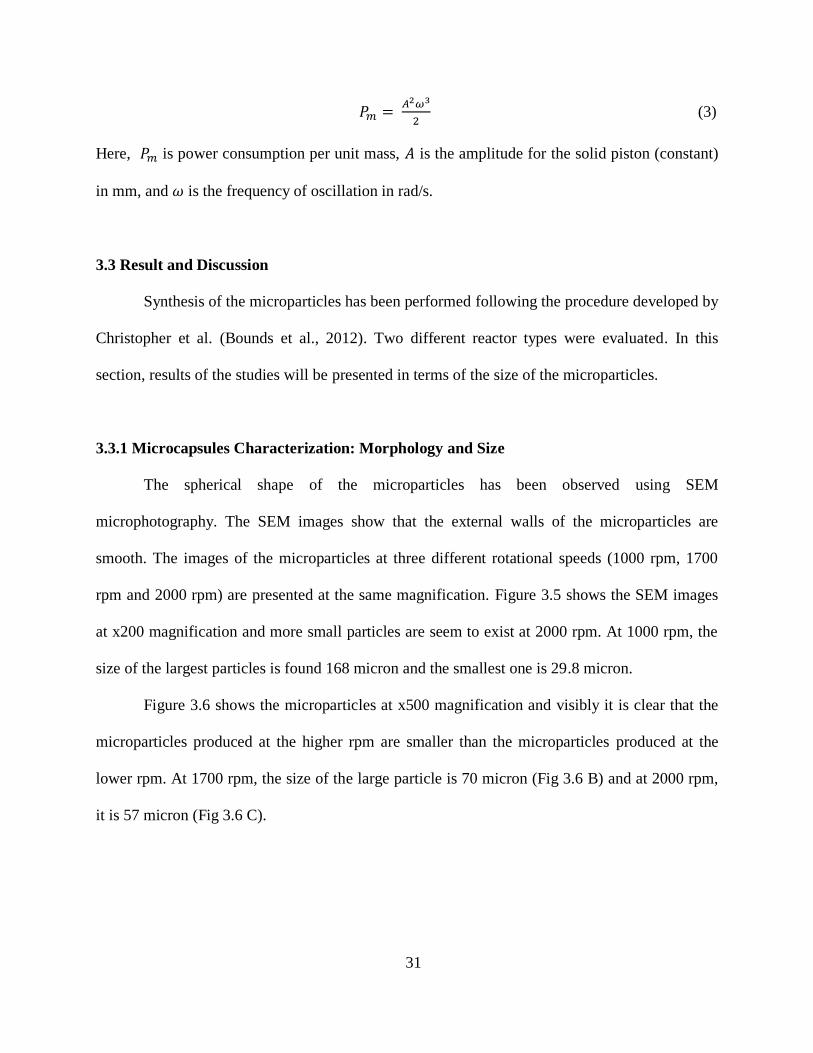
3.3.1 Microcapsules Characterization: Morphology and Size
The spherical shape of the microparticles has been observed using SEM
microphotography. The SEM images show that the external walls of the microparticles are
smooth. The images of the microparticles at three different rotational speeds (1000 rpm, 1700
rpm and 2000 rpm) are presented at the same magnification. Figure 3.5 shows the SEM images
at x200 magnification and more small particles are seem to exist at 2000 rpm. At 1000 rpm, the
size of the largest particles is found 168 micron and the smallest one is 29.8 micron.
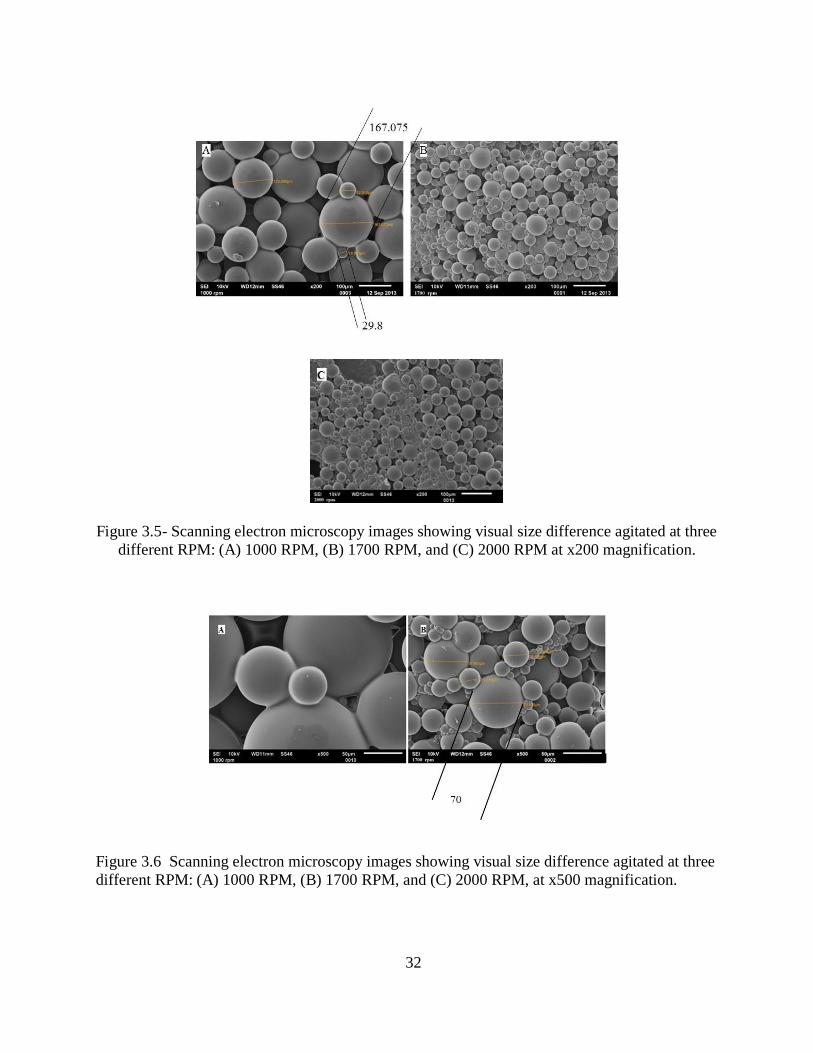
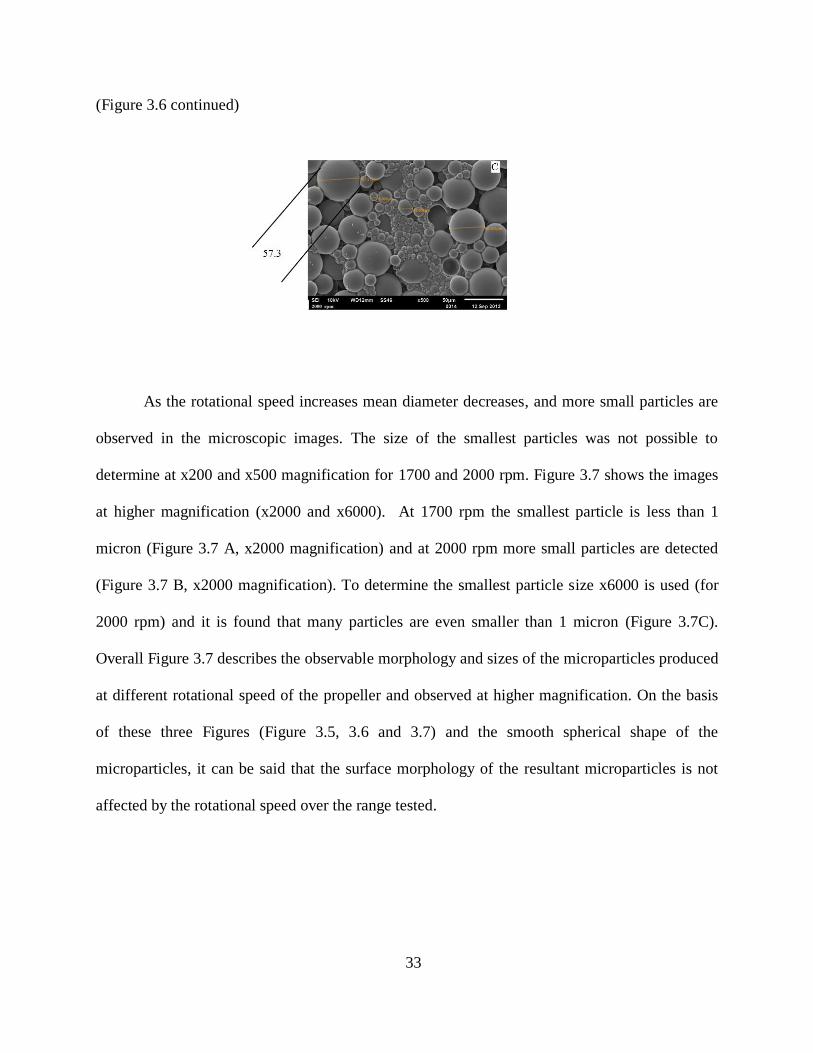
Figure 3.6 shows the microparticles at x500 magnification and visibly it is clear that the
microparticles produced at the higher rpm are smaller than the microparticles produced at the
lower rpm. At 1700 rpm, the size of the large particle is 70 micron (Fig 3.6 B) and at 2000 rpm,
it is 57 micron (Fig 3.6 C).
32
Figure 3.5- Scanning electron microscopy images showing visual size difference agitated at three
different RPM: (A) 1000 RPM, (B) 1700 RPM, and (C) 2000 RPM at x200 magnification.
Figure 3.6 Scanning electron microscopy images showing visual size difference agitated at three
different RPM: (A) 1000 RPM, (B) 1700 RPM, and (C) 2000 RPM, at x500 magnification.
33
(Figure 3.6 continued)
As the rotational speed increases mean diameter decreases, and more small particles are
observed in the microscopic images. The size of the smallest particles was not possible to
determine at x200 and x500 magnification for 1700 and 2000 rpm. Figure 3.7 shows the images
at higher magnification (x2000 and x6000). At 1700 rpm the smallest particle is less than 1
micron (Figure 3.7 A, x2000 magnification) and at 2000 rpm more small particles are detected
(Figure 3.7 B, x2000 magnification). To determine the smallest particle size x6000 is used (for
2000 rpm) and it is found that many particles are even smaller than 1 micron (Figure 3.7C).
Overall Figure 3.7 describes the observable morphology and sizes of the microparticles produced
at different rotational speed of the propeller and observed at higher magnification. On the basis
of these three Figures (Figure 3.5, 3.6 and 3.7) and the smooth spherical shape of the
microparticles, it can be said that the surface morphology of the resultant microparticles is not
affected by the rotational speed over the range tested.

34
Figure 3.7 Scanning electron microscopy images showing small microparticles prepared at (A)
1700 RPM (x2000 magnification) (B),(C) 2000 RPM (x2000 and x6000 magnification).
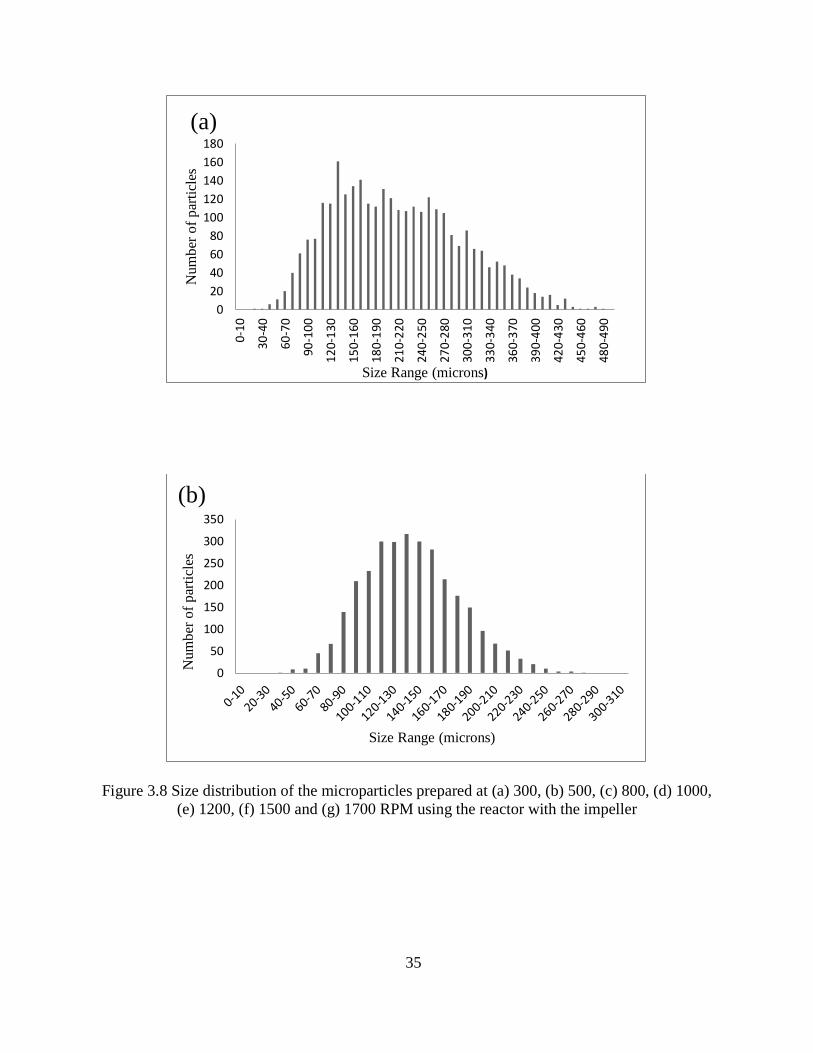
3.3.2 Size Distribution
Optical microscopy visible properties of the microparticles have been quantified as the
mean diameter and the size distribution. Using different agitation rates including 300, 500, 800,
1000, 1200, 1500, 1700, and 2000 RPM, size distributions have been determined and showed in
Figure 3.8.
35
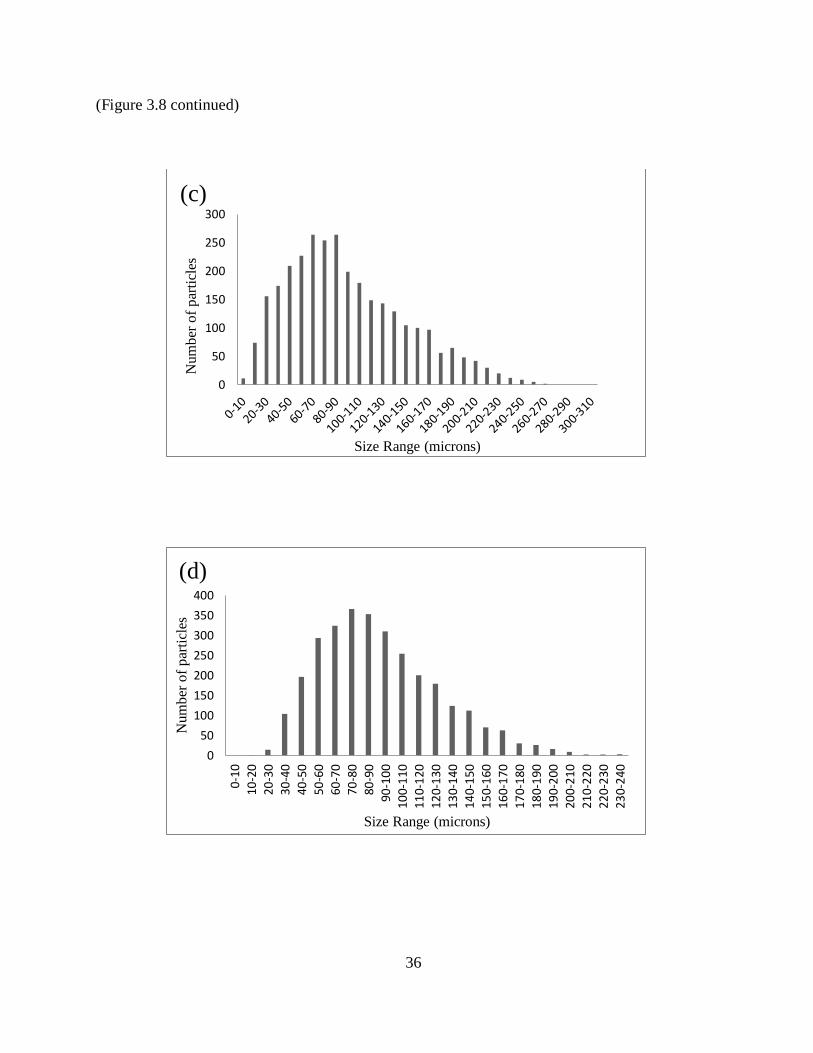
Figure 3.8 Size distribution of the microparticles prepared at (a) 300, (b) 500, (c) 800, (d) 1000,
(e) 1200, (f) 1500 and (g) 1700 RPM using the reactor with the impeller
0
20
40
60
80
100
120
140
160
180
0-10
30-4
0
60-7
0
90-1
00
120-
130
150-
160
180-
190
210-
220
240-
250
270-
280
300-
310
330-
340
360-
370
390-
400
420-
430
450-
460
480-
490
Num
ber
of
par
ticl
es
Size Range (microns)
(a)
0
50
100
150
200
250
300
350
Num
ber
of
par
ticl
es
Size Range (microns)
(b)
36
(Figure 3.8 continued)
0
50
100
150
200
250
300
Num
ber
of
par
ticl
es
Size Range (microns)
(c)
0
50
100
150
200
250
300
350
400
0-10
10-2
0
20-3
0
30-4
0
40-5
0
50-6
0
60-7
0
70-8
0
80-9
0
90-1
00
100-
110
110-
120
120-
130
130-
140
140-
150
150-
160
160-
170
170-
180
180-
190
190-
200
200-
210
210-
220
220-
230
230-
240
Num
ber
of
par
ticl
es
Size Range (microns)
(d)

37
(Figure 3.8 continued)
0
100
200
300
400
500
600
Num
ber
of
par
ticl
es
Size Range (microns)
(e)
0
200
400
600
800
1000
1200
Num
ber
of
par
ticl
es
Size Range (micron)
(f)
38
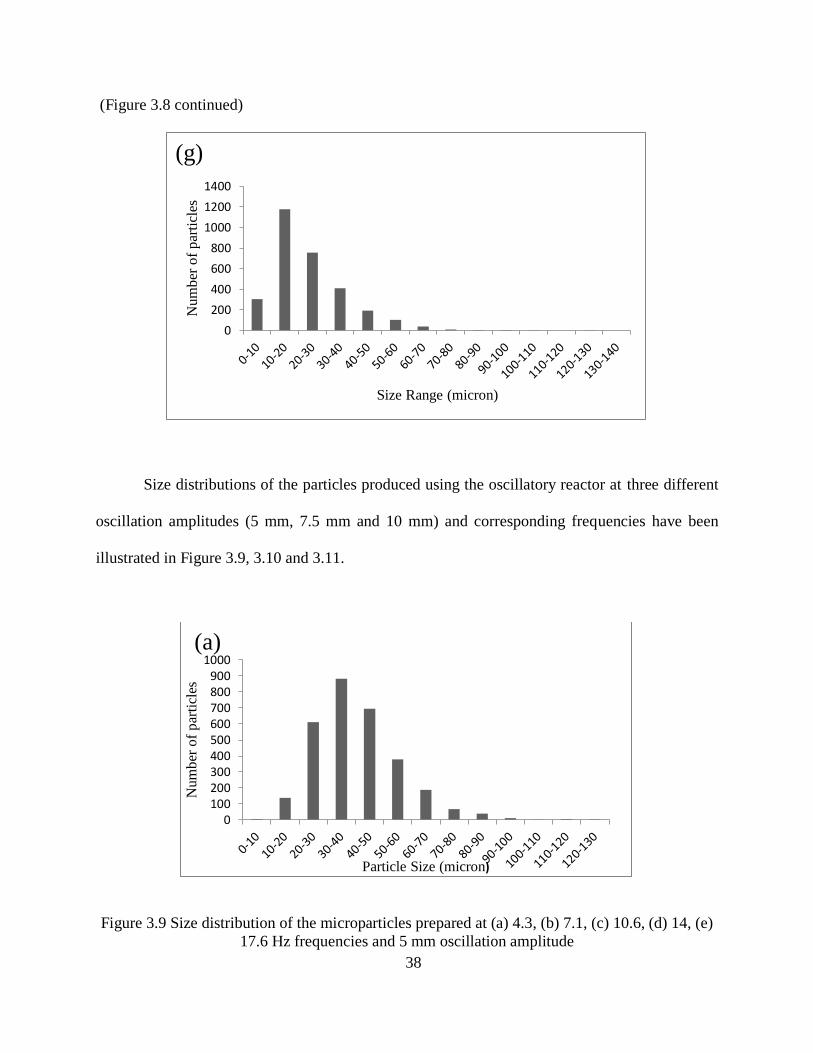
(Figure 3.8 continued)
Size distributions of the particles produced using the oscillatory reactor at three different
oscillation amplitudes (5 mm, 7.5 mm and 10 mm) and corresponding frequencies have been
illustrated in Figure 3.9, 3.10 and 3.11.
Figure 3.9 Size distribution of the microparticles prepared at (a) 4.3, (b) 7.1, (c) 10.6, (d) 14, (e)
17.6 Hz frequencies and 5 mm oscillation amplitude
0
200
400
600
800
1000
1200
1400N
um
ber
of
par
ticl
es
Size Range (micron)
(g)
0100200300400500600700800900
1000
Num
ber
of
par
ticl
es
Particle Size (micron)
(a)

39
(Figure 3.9 continued)
0
100
200
300
400
500
600
700
800
900
Num
ber
of
par
ticl
es
Particle Size (micron)
(b)
0
200
400
600
800
1000
1200
Num
ber
of
par
ticl
es
Particle size (micron)
(c)
40
(Figure 3.9 continued)
0
200
400
600
800
1000
1200
1400
Num
ber
of
par
ticl
es
Particle size (micron)
(d)
0
200
400
600
800
1000
1200
1400
1600
Num
ber
of
par
ticl
es
Particle size (micron)
(e)
41
Figure 3.10 is given below:
Figure 3.10 Size distribution of the microparticles prepared at (a) 3.3, (b) 5.4, (c) 7, (d) 8, (e)
10.7, (f) 13.4 Hz frequencies and 7.5 mm oscillation amplitude
0
50
100
150
200
250
300
350
400
450
Num
ber
of
par
ticl
es
Particle Size (micron)
(a)
0
20
40
60
80
100
120
1-3
11-1
3
21-2
3
31-3
3
41-4
3
51-5
3
61-6
3
71-7
3
81-8
3
91-9
3
10
1-1
03
11
1-1
13
12
1-1
23
13
1-1
33
14
1-1
43
15
1-1
53
16
1-1
63
17
1-1
73
18
1-1
83
19
1-1
93
20
1-2
03
Num
ber
of
par
ticl
es
Particle Size (micron)
(b)
42
(Figure 3.10 continued)
0
50
100
150
200
250
300
350
400
1-3
5-7
9-1
1
13-1
5
17-1
9
21-2
3
25-2
7
29-3
1
33-3
5
37-3
9
41-4
3
45-4
7
49-5
1
53-5
5
57-5
9
61-6
3
65-6
7
69-7
1
73-7
5
Num
ber
of
par
ticl
es
Particle Size (micron)
(c)
0
50
100
150
200
250
300
350
400
450
Num
ber
of
par
ticl
es
Particle Size (micron)
(d)
43
(Figure 3.10 continued)
0
50
100
150
200
250
300
350
4001-
3
5-7
9-11
13-1
5
17-1
9
21-2
3
25-2
7
29-3
1
33-3
5
37-3
9
41-4
3
45-4
7
49-5
1
53-5
5
57-5
9
61-6
3
65-6
7
69-7
1
73-7
5
77-7
9
81-8
3
85-8
7
Num
ber
of
par
ticl
es
Partcle Size (micron)
(e)
0
100
200
300
400
500
600
700
1-3
3-5
5-7
7-9
9-11
11
-13
13
-15
15
-17
17
-19
19
-21
21
-23
23
-25
25
-27
27
-29
29
-31
31
-33
33
-35
35
-37
37
-39
Num
ber
of
par
ticl
es
Particle Size (micron)
(f)

44
Figure 3.11 is given below:
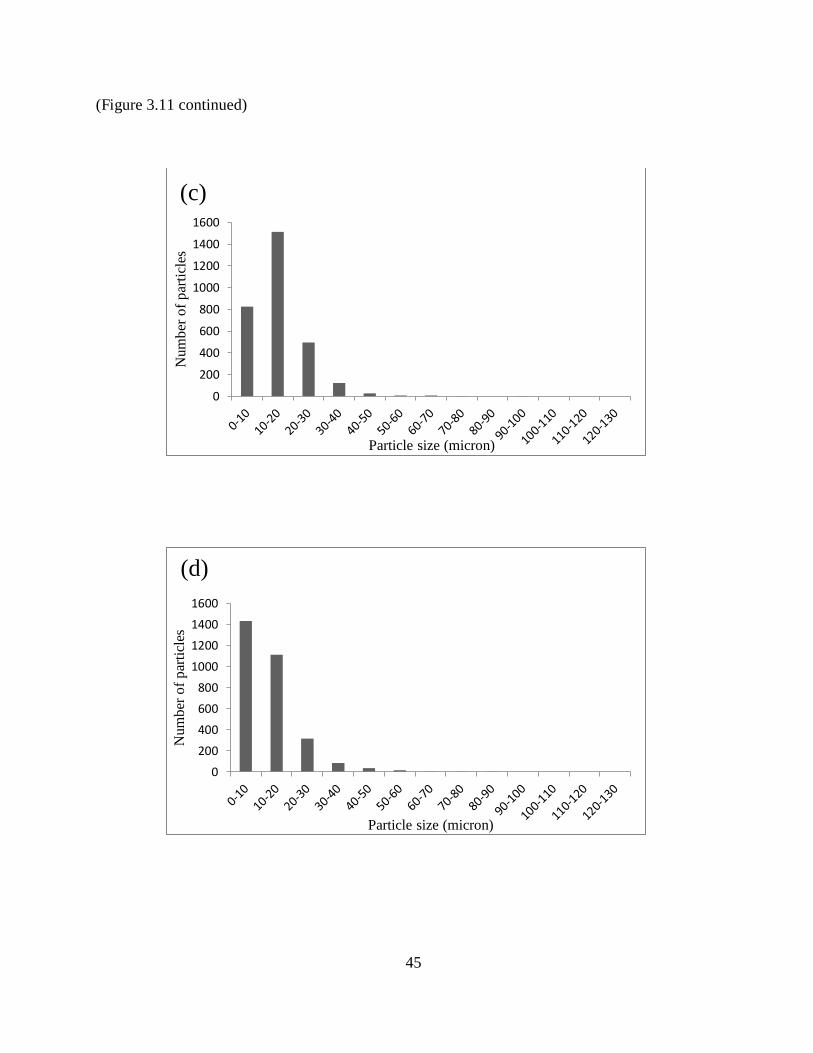
Figure 3.11Size distribution of the microparticles prepared at (a) 2.7, (b) 4.5, (c) 6.7, (d) 8.8, (e)
11.6 Hz frequencies and 10 mm oscillation amplitude
0
200
400
600
800
1000
1200
1400
1600
Num
ber
of
par
ticl
es
Particle size (micron)
(a)
0
200
400
600
800
1000
1200
1400
1600
1800
Num
ber
of
par
ticl
es
Particle size (micron)
(b)
45
(Figure 3.11 continued)
0
200
400
600
800
1000
1200
1400
1600
Num
ber
of
par
ticl
es
Particle size (micron)
(c)
0
200
400
600
800
1000
1200
1400
1600
Num
ber
of
par
ticl
es
Particle size (micron)
(d)

46
(Figure 3.11 continued)
Agitation rate from 300 rpm to 2000 rpm has a significant effect on size distribution. The
microparticles prepared with high agitation speed are considerably small than those prepared
with low agitation speed. High stirring rate aids large droplets to be broken into smaller droplets.
Figure 3.12 illustrates the proportional relationship between the stirring rate and particle size. As
the agitation speed increases, the size of the particles decreases, and at 1700 rpm, the narrowest
size distribution has been obtained. This inverse relationship between the stirring rate and
particle size distribution has been reported in some other scientific studies (Valot et al., 2009;
Wei et al., 2011). The plot can be separated into three sections; the first one is below 500 rpm
where the size distribution area is broad. At a lower agitation rate, the tendency of the droplets to
coalesce and aggregate is high and the outcome is larger mean particle size and a wide size
distribution. The second region lies within 500 rpm to 1000 rpm stirring speed, where the
0
500
1000
1500
2000
2500
Num
ber
of
par
ticl
es
Particle Size (micron)
(e)

47
distribution is more compact than the first section. Finally above 1000 rpm, the size distribution
is narrower than the other two regions, which results from the higher power input.
Figure 3.12 Particle size distributions as a function of stirring rate used during
microencapsulation
The mean diameter also decreases with the increasing stirring rate. In the Figure 3.13
shows the effect of stirring rate on mean particle size. Between 300 rpm (0.055 W/Kg) and 1000
(2.03 W/Kg) rpm, the mean diameter decreases significantly from 215 micron to 92 micron. But
between 1200 rpm (3.5 W/Kg) and 1700 rpm (10 W/Kg), the mean diameter decreases from 43
micron to 19 micron. Above 1200 rpm the mean diameter changes to a lesser extent.
-0.05
0
0.05
0.1
0.15
0.2
0.25
0 100 200 300 400 500 600
Vo
lum
e F
ract
ion
Particle size (micron)
300 RPM
500 RPM
800 RPM
1000 RPM
1200 RPM
1500 RPM
1700 RPM

48
Figure 3.13 Mean microparticle size as a function of stirring rate used during microencapsulation
3.3.3 Effect of Oscillation Amplitude and Frequency
In a piston driven oscillatory reactor, the mixing intensity is controlled by the oscillation
amplitude and frequency. To evaluate the individual effect of oscillatory amplitude and
frequency, experiments were conducted by varying one of the parameters and keeping the other
constant. Three different amplitudes (5mm, 7.5mm and 10mm) with a range of frequencies have
been used. Figure 3.14 depicts the results: Figure 3.14(a) 5 mm amplitude, Figure 3.14(b) 7.5
mm amplitude and Figure 3.14(c) 10 mm amplitude. At constant amplitude several experiments
have been conducted using different oscillation frequency. As the oscillation frequency
increases, the peak of the size distribution increases in height giving a narrower distribution
whereas the tail of the distribution appears to be short. These phenomena explain that the
distribution is narrower and even more uniform sized particles are likely to be found. With the
increase of oscillation frequency the energy dissipation of the system i.e. the turbulence in the
system also increases, which results into the formation of more uniform and small droplets.
0
50
100
150
200
250
0 500 1000 1500 2000
Mea
n p
arti
cle
siz
e (m
icro
n)
Agitation speed (RPM)

49
Mean particle size also decreases (from 41 micron to 17 micron) as the oscillation frequency
increases from 4.3 to 17.6Hz at 5 mm amplitude. At 7.5 mm and 10 mm amplitude, mean
particle size decreases with the increasing frequency (Figure 3.15).
Several studies have shown that oscillation frequency and amplitude play a major role in
controlling the particle size and size distribution (Ni et al., 1998; Pereira et al., 2001). In Figure
3.16, the effect of oscillation amplitude on the mean particle size for a fixed oscillation
frequency of 11 0.6 Hz has been presented. The oscillation amplitude and oscillation frequency
show similar effect on mean particle size.
Figure 3.14 Particle size distribution as a function of oscillation frequency used during
microencapsulation at a constant oscillation amplitude (a) 5 mm (b) 7.5 mm and (c) 10 mm
0
200
400
600
800
1000
1200
1400
1600
0 20 40 60 80 100 120 140
Num
ber
of
par
ticl
es
Particle size (micron)
(a)
4.3 Hz
7.1 Hz
10.6 Hz
14 Hz
17.6 Hz

50
(Figure 3.14 continued)
0
100
200
300
400
500
600
700
0 50 100 150 200
Num
ber
of
Par
ticl
es
Particle Size (micron)
(b) 3.3 Hz
5.4 Hz
7 Hz
8.1 Hz
10.7
13.4 Hz
0
500
1000
1500
2000
2500
0 20 40 60 80 100 120 140
Num
ber
of
par
ticl
es
Particle size (micron)
(c)
2.7 Hz
4.5 Hz
6.7 Hz
8.8 Hz
11.6 Hz

51
Figure 3.15 Mean particle size as a function of oscillation frequency used during
microencapsulation at constant oscillation amplitude (5 mm, 7.5 mm and 10 mm)
Figure 3.16 Mean particle size as a function of oscillation amplitude at a constant oscillation
frequency (11 0.6 Hz)
0
5
10
15
20
25
30
35
40
45
0 5 10 15 20
Mea
n D
iam
eter
( m
icro
n)
Frequency (Hz)
5 mm
7.5 mm
10 mm
0
5
10
15
20
25
30
3 5 7 9 11
Mea
n P
arti
cle
Siz
e (m
icro
n)
Oscillation Amplitude (mm)

52
3.3.4 Effect of Surfactant Concentration
A surfactant or stabilizer can prevent the coalescence of droplets during emulsification.
The stabilizer plays an important role in the synthesis of individual spherical microparticles.
Surfactants or stabilizers generally stabilize the system by stabilizing the droplets formed
through a combination of interfacial tension reduction and increasing the repulsion between the
droplets when they collide through preventing them from coalescence (Yuan et al., 2009). The
choice and concentrations of the surfactants depend on the desired microparticle size and
characteristics, the type of solvent used and the nature of the surfactants. Low toxicity, good
solubility and suitability in a wide range of molecular weight have made PVA (Polyvinyl
alcohol) the most common surfactant used in the formation of microparticles of relatively small
size and uniform size distribution (Sahoo et al., 2002). The purpose of this study is to assess the
effect of PVA concentration on the size distribution of microparticle. A number of previous
studies have shown that, PVA concentration in the aqueous phase has a significant effect on the
size and size distribution of the microparticles (Sahoo et al., 2002; Yuan et al., 2009). Generally
1.28% PVA has been emulsified in the aqueous phase. For the purpose of study, microparticles
have been produced using various amount of PVA ranging from 0.2% to 2% in the aqueous
phase and the mean particle size as a function of PVA concentration has been presented in Figure
3.17. It clearly shows that the mean microparticle size has been decreased from 98 micron to 56
micron with an increase in the PVA concentration. Different concentrations of PVA may be
responsible for the differences in the stability of the system. High concentration of PVA reduces
the interfacial tension of the droplets by orienting the PVA molecules at the organic
solvent/water interface. A significant increase in the net shear stress at a constant energy density

53
results, and smaller droplets are likely to be found, which resulted the decrease in the mean
particle size (Song et al., 2008).
Figure 3.17 Mean particle size as a function of PVA concentration
3.3.5 Energy Dissipation Calculation and Comparison of the Reactors
In this section the mean particle size and size distribution has been represented in terms
of turbulence dissipation energy. Using Equation 2 and 3 from the Section 3.2.4.3, power input
per unit mass for each type of reactor has been calculated. The propeller Reynolds number
(14000-82000) indicates that the flow is turbulent. The power number is taken as 0.5 to calculate
the energy dissipation per unit mass for the reactor with a three-blade propeller. The volume is
converted to a mass assuming the density of water, as the most part of the volume is water in
order to avoid complication. This mass is used in the calculations. Table 3.1 presents the
associated energy dissipation rate per unit mass for the reactor with a propeller for different
rotational speeds. From the values of particle size, it is seen that with the increase of the stirring
0
20
40
60
80
100
120
0 0.5 1 1.5 2 2.5
Mea
n P
arti
cle
Siz
e (m
icro
n)
PVA (%) used in formulation
54
rate the distribution becomes more compact. In Table 3.2, energy dissipation rate and associated
size parameters are presented. Energy dissipation per unit mass is slightly lower for the reactor
with propeller than the oscillatory reactor, but the size distribution is wider. In Figure 3.15,
particle size distribution for two types of reactor at 1000 rpm or 16.7 Hz (at 5 mm amplitude) has
been shown. For the reactor with a propeller, the average particle size is 91.73 35.88 micron,
whereas for the oscillatory reactor it is 16.87 9.75 micron. Comparison between the two tables
and Figure 3.18 satisfactorily explains that, a compact size distribution and small mean particle
size are the two vital aspects of the oscillatory reactor, which makes it more suitable than the
reactor with propeller. The reactor with propeller and the oscillatory reactor differ from one
another in terms of energy dissipation into the reactor fluid. Even for the same power input 0.25
W/Kg, the mean particle size is 139 micron for the reactor with three-blade propeller (at 500
rpm), whereas the mean particle size for the piston driven reactor is 41 micron (at 5 mm
amplitude and 4.3 Hz frequency). The propeller transfers the energy along the direction of the
blades, which results into uneven energy transfer at different points along the blade. This may
lead to a broad size distribution of the microparticles. Increasing the stirring speed can help to
control the size distribution up to a certain critical power level. Beyond this power level the
capsules formed are broken down and terminate the reaction from taking place. But in case of the
oscillatory reactor, the energy transfers uniformly across the piston cross section into the reactor
fluid. In terms of particle size and size distribution, oscillatory reactor is more suitable than the
reactor with propeller to attain a desired particle size distribution.

55
Figure 3.18 Particle size distributions for two types of reactor at 1000 rpm
Table 3.1 and 3.2 are given below:
Table 3.1: Energy dissipation rate and particle size for the reactor with three blade propeller
Stirring
rate
(RPM) Power (W/Kg)
Mean
particle
size
(micron)
Maximum
particle
size (micron)
Minimum
particle
size (micron)
300 0.055 215 478 22
500 0.25 139 456 32
800 1.04 95 269 9
1000 2.03 92 234 20
1200 3.51 43 133 6
1500 6.86 33 129 8
1700 10 19 117 2
0
200
400
600
800
1000
1200
1400
1600
0 50 100 150 200 250
Num
ber
of
par
ticl
es
Particle size (micron)
Oscillatory Reactor
Reactor with propeller

56
Table 3.2: Energy dissipation rate and particle size for the oscillatory reactor
Oscillation frequency
(Hz)
Oscillation Amplitude
(mm) Power (W/Kg) Mean particle
size (micron)
Maximum particle
size (micron)
Minimum particle
size (micron)
4.3
5
0.25 41 130 6
7.1 1.11 36 154 5
10.6 3.7 25 177 4
14 8.5 22 106 2.8
17.6 16.2 17 99 2
3.3
7
0.25 21 168 5.6
5.4 1.11 19 199 3.8
7 2.4 18 152 3
8 3.7 18 103 2
10.7 8.5 17 127 1.2
13.4 16.7 8 80 1.3
2.7
10
0.25 20 106 3.4
4.5 1.11 16 96 1.8
6.7 3.7 15 97 2.5
8.8 8.5 12 87 1.4
11.6 16.2 8 77 1.3
For the same energy dissipation rate, experiments have been conducted for different
frequencies and different amplitudes. The resultant mean particle size is shown in the Figure
3.19. For the same amount of power consumption per unit mass such as 3.7 W/Kg, mean particle
size are different for different amplitude. For high amplitude (10 mm) mean particle size is 15
micron, for 7.5 mm and 5 mm amplitude mean particle size are 18 and 25 micron respectively.
With the increase of the oscillation amplitude, mean particle size decreases even when the power
input is same. The reason behind this may be the shear impact of the oscillation increases with
the increase in oscillation amplitude resulting more small droplets during the mixing process.

57
Figure 3.19 Mean particle size as a function of energy dissipation per unit mass
0
5
10
15
20
25
30
35
40
45
0 5 10 15 20
Mea
n P
arti
cle
Siz
e (m
icro
n)
Power (W/Kg)
5 mm
7.5 mm
10 mm

58
CHAPTER 4- CONCLUSION AND RECOMMENDATIONS
The most important aspect of microencapsulation technology is to develop the process in
such a way that it will not be limited to the laboratory scale and it will fulfill the process
requirement. The main point is to evaluate an economical, cost effective and practically feasible
implantation that is utilizable in commercial field. The microencapsulation process by dispersion
polymerization has been chosen due to some advantages including low cost, high network
uniformity, lack of oxygen inhibition, simplicity of the reaction, high strength, ease of
modification, versatility in terms of monomers and catalysts, the ability to reach high conversion
at room temperature and pressure, use of minimum number of components. The only drawback
is the lack of precision of the particle. The objective of this research work is to fabricate the
microparticles using a piston driven reactor and analyze the results in terms of particle size, size
distribution and energy dissipation per unit mass of reactor liquid. For each reactor the
assessment has been done for different stirring speed, surfactant concentration, oscillation
frequency and amplitude. It has been determined that the size of the microparticles can be tuned
through variations in power input into the system by means of agitation or oscillation. The
oscillation amplitude has a similar effect as the oscillation frequency in controlling the particle
size and size distribution. Study has illustrated that in terms of particle size, size distribution and
energy dissipation, the oscillatory reactor is more preferable one than the traditional reactor with
propeller.
The present work can be continued with a more extensive study of microcapsule
properties and application using the oscillatory reactor so that the technology can be developed
to use in the industrial level in such a way that it can satisfy all relevant product requirements
including tailoring product properties, easy product handling, improved shell life and controlled

59
release. A control system can be established which can detect the particle and separate them
according to the size. Moreover experiment can be conducted using another type of reactor
which is basically a rotary drum reactor, evaluate the performance of the reactor with respect to
the other two reactors used in this research work.

60
REFERENCES
Abdelbary, A., El-gendy, N.A., and Hosny, A., 2012, “Microencapsulation Approach for Orally
Extended Delivery of Glipizide: In vitro and in vivo Evaluation,” Indian J Pharm Sci.,
74(4), pp. 319-330.
Arshady, R., 1989, “Microspheres and Microcapsules, a Survey of Manufacturing Techniques
Part II: Coacervation,” Polymer Engineering and Science, 30(15), pp. 905-914.
Atkin, R., Davies, P., Hardy, J., and Vincent, B., 2004, “Preparation of Aqueous Core/Polymer
Shell Microcapsules by Internal Phase Separation,” Macromolecules, 37, pp. 7979-7985.
Bahl, Y., and Sah, H., 2000, “Dynamic Changes in Size Distribution of Emulsion Droplets
During Ethyl Acetate-Based Microencapsulation Process,” AAPS PharmSciTech, 1(1).
Benita, S., Ed., 1996, Microencapsulation: Methods and Industrial Applications, Marcel Dekker,
New York.
Berkland, C., Kim, K., and Pack, D. W., 2001, “Fabrication of PLG microspheres with precisely
controlled and monodisperse size distributions,” Journal of Controlled Release, 73, pp.
59-74.
Bounds, C. O., Goetter, R., Pojman, J. A., and Vandersall, M., 2012, “Preparation and
Application of Microparticles Prepared Via the Primary Amine-catalyzed Addition of a
Trithiol to a Triacrylate,” Journal of Polymer Science, 50, pp. 409-422.
Buonomenna, M. G., Figoli, A., Spezzano, I., Davoli, M., and Drioli, E., 2008, “New PVDF
microcapsules for application in catalysis,” Applied Catalysis B: Environmental, 80,
pp.185-194.
Cho, S., Park, N., Kim, J., and Suh, K., 2002, “Preparation of mono-sized PMMA/liquid crystal
microcapsules by solute co-diffusion method,” Colloids and Surfaces, 196, pp. 217-222.
Cowsar, D. R., Tice, T. R., Gilley, R. M. and English, J. P., 1985, “Poly(lactide-co-glycolide)
microcapsules for controlled release of steroids,” Methods in Enzymology, 112,
pp. 101-116.
Gharasallaoui, A., Roudaut, G., Chambin, O., Voilley, A., and Saurel, R., 2007, “Applications of
spray-drying in microencapsulation of food ingredients: An overview,” Food Research
International, 40, pp. 1107-1121.
Giraud, S., Bourbigot, S., Rochery, M., Vroman, I., Tighzert, L., Delobel, R. and Poutch, F.,
2005,“Flame retarded polyurea with microencapsulated ammonium phosphate for textile
coating,” Polymer Degradation and Stability, 88, pp. 106-113.

61
Gouin, S., 2004, “Microencapsulation: industrial appraisal of existing technologies and trends,”
Trends in Food Science and Technology, 15, pp. 330-347.
Green, B. K. and Scheicher, L., 1955, Pressure Sensitive Record Materials, US Patent no.
2, 217,507, Ner C.
Green, K. D., Gill, I. S., Khan, J. A., and Vulfson, E. N., 1996, “Microencapsulation of Yeast
Cells and Their Use as a Biocatalyst in Organic Solvents,” Biotechnology and
Bioengineering, 49(5), pp. 535-543.
Hirech, K., Payan, S., Carnelle, G., Brujes, L., and Legrand, J., 2003, “Microencapsulation of an
insecticide by interfacial polymerization,” Powder Technology, 130, pp. 324-330.
Kailasapathy, K., 2002, “Microencapsulation of Probiotic Bacteria: Technology and Potential
Applications,” Curr. Issues Intest. Microbiol., 3, pp. 39-48.
Kawaguchi, S., Ito, K., 2005, “Dispersion Polymerization,” Advance Polymer Science, 175,
pp. 299-328.
Kim, H. K., and Park, T. G., 1999, “Microencapsulation of Human Growth Hormone within
Biodegradable Polyester Microspheres: Protein Aggregation Stability and Incomplete
Release Mechanism,” Biotechnology and Bioengineering, 65(6), pp. 659-667.
Knopf, F. C.,Waghmare, Y., Ma, J., and Rice, R. G., 2006, “Pulsing to Improve Bubble Column
Performance:II. Jetting Gas Rates,” AIChE Journal, 52(3), pp. 1116-1126.
Kontturi, L., Yliperttula, M., Toivanen, P., and Maatta, A., 2011, “A laboratory-scale device for
the straightforward production of uniform, small sized cell microcapsules with long-term
viability,” Journal of Controlled Release, 152, pp. 376-381.
Krasaekoopt, W., Bhandari, B., and Deeth, H., 2003, “Evaluation of encapsulation techniques of
probiotics for yogurt,” International Dairy Journal, 13, pp. 3-13.
Krober, H., and Teipel, U., 2005, “Microencapsulation of particles using supercritical carbon
dioxide,” Chemical Engineering and Processing, 44, pp. 215-219.
Kwok, K. K., Groves, M. J., and Burgess, D. J., 1991, “Production of 5-15 µm Diameter
Alginate-Polylysine Microcapsules by an air atomization Technique,” Pharmaceutical
Research, 8, pp.341-344.
Laguecir, A., Frere, Y., Dancher, L., and Burgard, M., 2002, “Size effect of complexing
microcapsules on copper ion extraction,” European Polymer Journal, 38, pp. 977-981.
Li, M., Rouaud, O., and Poncelet, D., 2008, “Microencapsulation by solvent evaporation: State
of the art for process engineering approaches,” International Journal of Pharmaceutics,
363, pp. 26-39.
62
Liu, R., Ma, G., Wan, Y., and Su, Z., 2005, “Influence of process parameters on the size
distribution of PLA microcapsules prepared by combining membrane emulsification
technique and double emulsion-solvent evaporation method,” Colloids and Surfaces
B:Biointerfaces, 45, pp. 144-153.
Madene, A., Jacquot, M., Scher, J. and Desobry, S., 2006, “Flavour encapsulation and controlled
release-a review,” International Journal of Food Science and Technology, 41, pp.1-21.
Martin-Banderas, L., Flores-Mosquera, M., Riesco-Chueca, P., Rodriguez-Gil, A., Cebolla, A.,
Chavez,S., and Ganan-Calvo, A. M., 2005, “Flow Focusing: A Versatile Technology to
Produce Size-Controlled and Specific-Morphology Microparticles,” Small, 1 (7),
pp.688-692.
Miyoshi, Y., Date, I., Ohmoto, T., and Iwata, H., 1996, “Histological Analysis of
Microencapsulated Dopamine-Secreting Cells in Agarose/Poly(styrene sulfonic acid)
Mixed Gel Xenotransplanted into the Brain,” Experimental Neurology, 138, pp. 169-175.
Mou, C., He, X., Ju, X., Xie, R., Liu, Z., Liu, L., and Zhang, Z., 2012, “Change in size and
structure of monodisperse poly(N-isopropylacrylamide) microcapsules in response to
varying temperature and ethyl gallate concentration,” Chemical Engineering Journal, 210,
pp. 212-219.
Murua, A., Portero, A., Orive, G., Herandez, R. M., Castro, M. D., and Pedraz, J. L., 2008, “Cell
microencapsulation technology: Towards clinical application,” Journal of Controlled
Release,132, pp. 76-83.
Narayani, R., and Rao, K. P., 1996, “Gelatin microsphere cocktails of different sizes for the
controlled release of anticancer drugs,” International Journal of Pharmaceutics, 143,
pp. 255-258.
Nelson, G., 2002, “Application of microencapsulation in textiles,” International Journal of
Pharmaceutics, 242, pp. 55-62.
Nesterova, T., 2012, “Self-healing anticorrosive coatings,” PhD Thesis, Technical University of
Denmark, Kongens Lyngby, Denmark.
Nesterova, T., Dam-Johansen, K., Pedersen, L. T., and Kiil, S., 2012, “Microcapsule-based self-
healing anticorrosive coating: Capsule size, coating formulation, and exposure testing,”
Process in Organic Coating, 75, pp. 309-318.
Ni, X., Zhang, Y., and Mustafa, I., 1998, “An investigation of droplet size and size distribution in
methylmethacrylate suspensions in a batch oscillatory-baffled reactor,” Chemical
Engineering Science, 53 (16), pp. 2903-2919.
63
Nie, Z., Xu, S., Seo, M., Lewis, P. C., and Kumacheva, E., 2005, “Polymer Particles with
Various Shapes and Morphologies Produced in Continuous Microfluidic Reactors,”
Journal of American Chemical Society, 127, pp. 8058-8063.
O’Donnell, P. B. and McGinity, J. W., 1997, “Preparation of microspheres by the solvent
Evaporation technique,” Advanced Drug Delivery Reviews, 28, pp. 25-42.
Oldshue, J. Y., 1983, Fluid Mixing Technology, McGraw-Hill, New York.
Orive, G., Herandez, R. M. , Gascon, A. R., Calafiore, R., Chang, T. M. S., Vos, P. D.,
Hortelano, G., Hunkeler, D., Lacik, I., and Pedraz, J. L., 2004, “History, challenges and
perspectives of cell microencapsulation,” TRENDS in Biotechnology, 22(2), pp. 87-92.
Park, J. K. and Chang, H. N., 2000, “ Microencapsulation of microbial cells,” Biotechnology
Advances,18, pp. 303-319.
Pena, B., Panisello, C., Areste, G., Gracia-Valls, R. and Gumi, T., 2012, “Preparation and
characterization of polysulfone microcapsules for perfume release,” Chemical
Engineering Journal, 179, pp. 394-403.
Pereira, N. E., and Ni, X., 2001, “Droplet size distribution in a continuous oscillatory baffled
reactor,” Chemical Engineering Science, 56, pp. 735-739.
Perrut, M. and Clavier, J. Y., 2003, “ Supercritical Fluid Formulation: Process Choice and Scale-
up,” Ind. Eng. Chem. Res., 42, pp. 6375-6383.
Rivas, I. P., Gil-Alegre, M. E., and Torres-Suarez, A. I., 2006, “Development and validation of a
fast high-performance liquid chromatography method for the determination of
microencapsulated pyrethroid pesticides,” Analytica Chimica Acta, 557, pp.245-251.
Sahoo, S. K., Panyam, J., Prabha, S., and Labhasetwar, V., 2002, “Residual polyvinyl alcohol
associated with poly(D, L-lactide-co-glycolide) nanoparticles affects their physical
properties and cellular uptake,” Journal of Controlled Release, 82, pp. 105-114.
Sanchez, A., Gupta, R. K., Alonso, M. J., Siber, G. R., and Langer, R., 1996, “Pulsed Controlled-
Release System for Potential Use in Vaccine Delivery,” Journal of Pharmaceutical
Sciences, 85(6), pp. 547-552.
Sanchez-Silva, L., Rodriguez, J. F., Romero, A., Borreguero, A. M., Carmona, M., and Sanchez,
P., 2010, “Microencapsulation of PCMs with a styrene-methyl methacrylate copolymer
shell by suspension-like polymerization,” Chemical Engineering Journal, 157,
pp. 216-222.
Santos, I. R. D., Richard, J., Pech, B., Thies, C., and Benoit, J. P., 2002, “Microencapsulation of
protein particles within lipids using a novel supercritical fluid process,” International
Journal of Pharmaceutics, 242, pp. 69-78.

64
Siepmann, J., Faisant, N., Akiki, J., Richard, J., and Benoit, J. P., 2004, “Effect of the size of
biodegradable microparticles on drug release: experiment and theory,” Journal of
Controlled Release, 96, pp. 123-134.
Smet, B. P. De, Poncelet, D., and Neufield, R. J., 1990, “Preparation of Hemolysate –filled
Hexamethylene Sebacamide Microcapsules with Controlled Diameter,” The Canadian
Journal of Chemical Engineering, 68, pp. 443-448.
Song, X., Zhao, Y., Hou, S., Xu, F., Zhao, R., He, J., Cai, Z., Li, Y., and Chen, Q., 2008, “Dual
agents Loaded PLGA nanoparticles: Systematic study of particle size and drug
entrapment efficiency,” European Journal of Pharmaceutics and Biopharmaceutics, 69,
pp. 445-453.
Tatterson, G. B., 1991, Fluid Mixing and Gas Dispersion in Agitated Tanks, McGraw-Hill Inc,
New York.
Teixeira, M. I., Andrade, L. R., Farina, M., and Rocha-Leao, M. H. M., 2004, “Characterization
of short chain fatty acid microcapsules produced by spray drying,” Materials Science and
Engineering, 24, pp. 653-658.
Tsuda, N., Ohtsubo, T., and Fuji, M., 2012, “Preparation of self-bursting microcapsules by
Interfacial polymerization,” Advanced Powder Technology, 23, pp. 724-730.
Tu, L. S., Dehghani, F. and Foster, N. R., 2002, “Micronisation and microencapsulation of
pharmaceuticals using a carbon dioxide antisolvent,” Powder Technology, 126,
pp. 134-149.
Ugwoke, M. I., Verbeke, N., and Kinget, R., 1997, “Microencapsulation of apomorphine HCL
with gelatin,” International Journal of Pharmaceutics, 148, pp.23-32.
Valot, P., Baba, M., Nedelec, J.-M., and Sintes-Zydowicz, N., 2009, “Effects of process
parameters on the properties of biocompatible Ibuprofen-loaded microcapsules,”
International Journal of Pharmaceutics, 369, pp.53-63.
Vanrell, R. H., and Refojo, M. F., 2001, “Biodegradable microspheres for vitreoretinal drug
delivery,” Advanced Drug Delivery Reviews, 52, pp.5-16.
Walter, E., Moelling, K., Pavlovic, J., and Merkle, H. P., 1999, “Microencapsulation of DNA
using poly(DL-lactide-co-glycolide): stability issues and release characteristics,” Journal
of Controlled Release, 61, pp. 361-374.
Wang, H. L., Liu, S. Q., and Zhang, X. Y., 2009, “Preparation and application of sustained
release microcapsules of potassium ferrate(VI) for dinitro butyl phenol (DNBP)
wastewater treatment,” Journal of Hazardous Materials, 169, pp. 448-453.

65
Wei, Y., Wang, Y., Wang, L., Hao, D., and Ma, G., 2011, “Fabrication strategy for amphiphilic
microcapsules with narrow size distribution by premix membrane emulsification”,
Colloids and Surfaces B: Biointerfaces, 87, pp. 399-408.
Wieland-Berghausen, S., Schote, U., Frey, M., and Schmidt, F., 2002, “Comparison of
microencapsulation techniques for the water-soluble drugs nitenpyram and clomipramine
HCl,” Journal of Controlled Release, 85, pp. 35-43.
Whelehan, M., Stockar, U. V., and Marison, I. W., 2010, “Removal of pharmaceuticals from
water: Using liquid-core microcapsules as a novel approach,” Water Research, 44,
pp. 2314-2324.
Yuan, Q., Williams R. A., and Biggs, S., 2009, “Surfactant selection for accurate size control of
microcapsules using membrane emulsification,” Colloids and Surfaces A:
Physicochemical and Engineering Aspects, 347, pp. 97-103.

66
VITA
Rubaiyet Abedin was born in Chittagong, Bangladesh in December of 1986. She
graduated from Bangladesh University of Engineering and Technology (BUET), Dhaka,
Bangladesh with her Bachelor of Science in Chemical Engineering, in 2009. Afterwards she
joined the Gordon A. and Mary Cain Department of Chemical Engineering, Louisiana State
University in fall 2012. She worked under the guidance of Dr. F. Carl Knopf and completed her
research work in fall 2013. This thesis completes her requirements to the degree of Master of
Science in Chemical Engineering.