effect of shorter compressor on/off cycle times on a/c
TRANSCRIPT

University of Illinois at Urbana-Champaign
Air Conditioning and Refrigeration Center A National Science Foundation/University Cooperative Research Center
Effect of Shorter Compressor On/Off Cycle Times on A/C
System Performance
S. M. Ilic, C. W. Bullard, and P. S. Hrnjak
ACRC CR-43 December 2001
For additional information: Air Conditioning and Refrigeration Center University of Illinois Mechanical & Industrial Engineering Dept. 1206 West Green Street Urbana, IL 61801 Prepared for (217) 333-3115 Copeland Corporation

The Air Conditioning and Refrigeration Center was founded in 1988 with a grant from the estate of Richard W. Kritzer, the founder of Peerless of America Inc. A State of Illinois Technology Challenge Grant helped build the laboratory facilities. The ACRC receives continuing support from the Richard W. Kritzer Endowment and the National Science Foundation. The following organizations have also become sponsors of the Center. Alcan Aluminum Corporation Amana Refrigeration, Inc. Arçelik A. S. Brazeway, Inc. Carrier Corporation Copeland Corporation Dacor Daikin Industries, Ltd. Delphi Harrison Thermal Systems General Motors Corporation Hill PHOENIX Honeywell, Inc. Hydro Aluminum Adrian, Inc. Ingersoll-Rand Company Invensys Climate Controls Kelon Electrical Holdings Co., Ltd. Lennox International, Inc. LG Electronics, Inc. Modine Manufacturing Co. Parker Hannifin Corporation Peerless of America, Inc. Samsung Electronics Co., Ltd. Tecumseh Products Company The Trane Company Valeo, Inc. Visteon Automotive Systems Wolverine Tube, Inc. York International, Inc. For additional information: Air Conditioning & Refrigeration Center Mechanical & Industrial Engineering Dept. University of Illinois 1206 West Green Street Urbana, IL 61801 217 333 3115
ii
Abstract
Effects of compressor on/off cycle times shorter than typical a/c heat exchanger thermal time constant (~1
min) were examined as a method of cooling capacity regulation. Short compressor on/off cycle times enable the use
of heat exchangers continuously throughout entire off-cycle, thus reducing on-cycle temperature lift and increasing
COP compared to conventional cycling.
Experiments were done for a typical residential a/c system for run time fractions from 0.3 to 1.0, and cycle
periods from 10 to 80 seconds. The objective was to understand how pulsed refrigerant flow from the compressor
affects performance of the other components. Refrigerant side heat transfer resistance, pressure drop, and magnitude
and curvature of heat exchanger surface temperature fluctuations were identified as the most influential factors
affecting system performance. Virtually identical effects were observed for wet and dry coil experiments.
Results at a run time fraction of 0.56 were compared to continuous (simulating variable speed) operation of
a smaller compressor providing the same cooling capacity. Cycling the compressor at cycle periods of 10-80 sec
degraded the performance of other components enough to reduce COP by approximately 2.5-7.5%, respectively.
The corresponding COP loss for conventional long-cycling was 11.5%, all on the condenser side, because
evaporator surface temperature was held constant to ensure that sensible and latent capacities were comparable.
Comparisons of actual variable speed and cycling strategies must also account for parasitic power such as inverter
losses and differences in fan and blower power.

iii
Table of Contents Page
Abstract .........................................................................................................................................ii
List of Figures ............................................................................................................................. v
List of Tables ............................................................................................................................. vii
Nomenclature........................................................................................................................... viii
Chapter 1: Introduction ............................................................................................................ 1
1.1 Background...........................................................................................................................1 1.2 Purpose .................................................................................................................................2
Chapter 2: Experimental facility, test matrix and procedure ......................................... 3
2.1 Experimental facility..............................................................................................................3 2.2 Test procedure ......................................................................................................................4 2.3 Test matrix ............................................................................................................................5
Chapter 3: Analysis of factors affecting short-cycling performance........................... 7
3.1 Evaluating short-cycling performance ..................................................................................7 3.2 Factors affecting short-cycling efficiency .............................................................................8
3.2.1 Refrigerant side heat transfer................................................................................................................................8 3.2.2 Pressure drop...........................................................................................................................................................8 3.2.3 Thermal capacitance (heat exchanger metal temperature nonlinearity)........................................................8
3.3 Analysis of short-cycling experiments..................................................................................9 3.3.1 Automobile a/c system experiments....................................................................................................................9 3.3.2 Residential a/c system experiments ...................................................................................................................10
3.4 Effect of evaporator thermal capacitance............................................................................ 17 3.4.1 Model validation using the experimental measurements...............................................................................18 3.4.2 Effect of changing the design variables hAair and Cm.....................................................................................20
3.5 Wet coil performance under short-cycling .......................................................................... 23 3.6 Open vs. closed valve operation......................................................................................... 26
Chapter 4: Short-cycling comparison to continuous operation .................................29
4.1 Short-cycling losses at µ=0.56 compared to continuous operation .................................... 29 4.2 Lift degradation terms breakdown for τ=0, 10 and 80 seconds at µ=0.56 ............................ 31 4.3 Lift loss for τ=10 and 80 seconds at µ=0.56......................................................................... 34
4.3.1 Losses due to short-cycling at τ=10 seconds ...................................................................................................35 4.3.2 Losses due to short-cycling at longer cycle periods (τ=80 seconds)...........................................................36
4.4 Short-cycling comparison to conventional cycling ............................................................. 37

iv
Chapter 5: Conclusions..........................................................................................................38
5.1 Defining an ideal baseline for comparing capacity regulation methods.............................. 38 5.2 Factors affecting short-cycling COP degradation ............................................................... 38
5.2.1 Refrigerant side heat transfer resistance...........................................................................................................38 5.2.2 Pressure drop.........................................................................................................................................................39 5.2.3 Heat exchanger thermal capacitance .................................................................................................................39 5.2.4 Other effects...........................................................................................................................................................39
5.3 Short-cycling compared to variable-speed meeting ~1/2 of design load............................. 40 5.3.1 Losses for 10-second cycle period.....................................................................................................................40 5.3.2 Losses for 80-second cycle period.....................................................................................................................40
5.4 Short-cycling compared to conventional cycling ................................................................ 41
References.................................................................................................................................42
Appendix A: Short-cycling experiments on R134a mobile a/c system .....................43
A.1 Purpose .............................................................................................................................. 43 A.2 Experimental setup............................................................................................................. 43 A.3 Experiment description ...................................................................................................... 43 A.4 Experimental results and analysis...................................................................................... 44 A.5 Conclusions ....................................................................................................................... 49
Appendix B: Experimental setup for residential a/c system........................................51
B.1 A/C refrigeration loop and components.............................................................................. 51 B.2 Environmental chambers and evaporator wind tunnel....................................................... 55 B.3 Measured parameters......................................................................................................... 55
B.3.1 Measured parameters providing information about COP..............................................................................56 B.4 Data acquisition .................................................................................................................. 58
B.4.1 Data acquisition system ......................................................................................................................................59 B.4.2 Slow data sampling for instantaneous display................................................................................................60 B.4.3 Fast data sampling................................................................................................................................................62
Appendix C: Short-cycling experiments at 26.7/27.7o C (80/82o F) .............................65
C.1 Dry coil experiments........................................................................................................... 65
C.1.1 Short-cycling losses at µ=0.57 compared to continuous operation.............................................................65 C.1.2 Temperature lift degradation breakdown for τ=0, 50 seconds at µ=0.57...................................................67 C.1.3 Lift loss for τ=10 and 50 seconds at µ=0.57 ...................................................................................................68 C.1.4 Short-cycling comparison to conventional cycling........................................................................................69
C.2 Wet coil experiments at 26.7/27.7 C (80/82 F)...................................................................... 70
APPENDIX D: Temperature lift degradation for open vs. closed valve.....................72

v
List of Figures
Page
Figure 2.1 The change in capacity and air flow rate with run time fraction...........................................................................4 Figure 3.1 Automotive a/c system efficiency comparison; variable speed vs. short-cycling..............................................9 Figure 3.2 COP degradation with cycle period for experiments at µ=0.5 ............................................................................10 Figure 3.3 The saturation temperature lift increase with τ for experiments at µ=0.5 .........................................................10 Figure 3.4 Lift degradation term increase with cycle period for experiments at µ=0.5 .....................................................11 Figure 3.5 Lift degradation term as a function of cycle period and run time fraction ........................................................12 Figure 3.6 Temperature lift as a function of µ for τ=10 sec....................................................................................................13 Figure 3.7 Lift degradation term as a function of µ for τ=10 sec...........................................................................................13 Figure 3.8 Refrigerant heat transfer part of temperature lift degradation term, ∆Te(rht) ...................................................14 Figure 3.9 Refrigerant pressure drop part of lift degradation term, ∆Te(∆P) .......................................................................15 Figure 3.10 Nonlinear evaporator metal temperature, Tm,e, oscillations at µ=0.5 and τ=50 sec.......................................16 Figure 3.11 Metal temperature nonlinearity part of a COP loss term, ∆Te(nonlin) ............................................................16 Figure 3.12 Lift degradation term divided into three parts for µ=0.5 and τ=50 sec ...........................................................17 Figure 3.13 Experimentally obtained values of hAair,e for the range of µ and τ ..................................................................19 Figure 3.14 Experimentally obtained values of Cm for the range of µ and τ........................................................................19 Figure 3.15 The model results comparison to the experimental results at µ=0.5 and τ=80 sec........................................20 Figure 3.16 Calculated evaporator metal temperature..............................................................................................................21 Figure 3.17 Influence of halving Cm............................................................................................................................................22 Figure 3.18 Influence of doubling hAair,e....................................................................................................................................22 Figure 3.19 COP degradation with cycle period for dry coil experiments ...........................................................................24 Figure 3.20 COP degradation with cycle period for wet coil experiments...........................................................................24 Figure 3.21 On -cycle average saturation temperatures for dry coil experiments ................................................................25 Figure 3.22 On -cycle average saturation temperatures for wet coil experiments................................................................25 Figure 3.23 Evaporator metal and dew point temperature at µ=0.3 and τ=80 sec ..............................................................26 Figure 3.24 Refrigerant mass flow rate into the evaporator overlaid for OV and CV........................................................27 Figure 3.25 Evaporator and condenser saturation temperatures overlaid for OV and CV.................................................28 Figure 4.1 Saturation temperature lift and degradation terms increase with τ .....................................................................29 Figure 4.2 Coefficient of performance decrease with τ ...........................................................................................................30 Figure 4.3 Evaporator side lift degradation term increase with τ...........................................................................................31 Figure 4.4 Condenser side lift degradation term increase with τ............................................................................................31 Figure 4.5 Lift degradation term breakdown on evaporator side ...........................................................................................32 Figure 4.6 Lift degradation term breakdown on condenser side ............................................................................................32 Figure 4.7 Evaporator degradation term for VS operation (τ=0) ...........................................................................................33 Figure 4.8 Evaporator degradation term for SC at τ=10 sec ...................................................................................................33 Figure 4.9 Evaporator degradation term for SC at τ=80 sec ...................................................................................................34 Figure 4.10 Breakdown of the lift loss term on evaporator side.............................................................................................34 Figure 4.11 Breakdown of the lift loss term on condenser side..............................................................................................35 Figure 4.12 Evaporator pressure drop at τ=10 sec (short-cycling) and τ=0 sec (continuous)...........................................35

vi
Figure 4.13 COP comparison to conventional cycling.............................................................................................................37 Figure A.1 Experiment results for short-cycling (SC) and variable speed (VS) capacity regulation method................46 Figure A.2 Change of compressor work and evaporator capacity for SC at τ=10 sec and VS .........................................46 Figure A.3 Change of coefficient of performance of cycle for SC at τ=10 sec and VS.....................................................47 Figure A.4 Saturation temperatures averaged over on-cycle for VS and SC .......................................................................48 Figure A.5 Change in evaporator and condenser saturation temperatures for two cycles of short-cycling
operation at µ=0.35 and τ=10 sec .......................................................................................................................................48 Figure A.6 Change in evaporator and condenser saturation temperatures for two cycles (τ=10 seconds) for run
time fractions µ=0.8, 0.6 and 0.35......................................................................................................................................49 Figure B.1 Residential a/c facility for short-cycling.................................................................................................................52 Figure B.2 1st slow sampling and averaging program screen shot........................................................................................60 Figure B.3 2nd Slow sampling and averaging program screen shot......................................................................................61 Figure B.4 3rd slow sampling and averaging program screen shot........................................................................................61 Figure B.5 4th slow sampling and averaging program screen shot........................................................................................62 Figure B.6 5th slow sampling and averaging program screen shot........................................................................................62 Figure B.7 1st screen shot of entire fast sampling and averaging program..........................................................................63 Figure B.8 2nd screen shot of fast sampling and averaging program ....................................................................................63 Figure B.9 E1313A Direct I/O control panel, configuration panel. .......................................................................................64 Figure B.10 E1313A Direct I/O control panel, engineering units panel. ..............................................................................64 Figure B.11 E1313A Direct I/O control panel, scan-list panel. ..............................................................................................64 Figure B.12 E1313A Direct I/O control panel, trigger panel. .................................................................................................64 Figure C.1 Saturation temperature lift and degradation terms increase with τ ....................................................................65 Figure C.2 Coefficient of performance decrease with τ...........................................................................................................66 Figure C.3 Evaporator side lift degradation term increase with τ ..........................................................................................66 Figure C.4 Condenser side lift degradation term increase with τ...........................................................................................67 Figure C.5 Lift degradation term breakdown on evaporator side...........................................................................................67 Figure C.6 Lift degradation term breakdown on condenser side............................................................................................68 Figure C.7 Breakdown of the lift loss term on evaporator side..............................................................................................68 Figure C.8 Breakdown of the lift loss term on condenser side...............................................................................................69 Figure C.9 COP comparison to conventional cycling ..............................................................................................................69 Figure C.10 Saturation temperature lift and degradation terms increase with τ ..................................................................70 Figure C.11 Coefficient of performance decrease with τ ........................................................................................................71 Figure D.1 Evaporator metal and saturation temperature for CV ..........................................................................................73 Figure D.2 Evaporator metal and saturation temperature for OV..........................................................................................73 Figure D.3 Evaporator superheat for CV....................................................................................................................................74 Figure D.4 Evaporator superheat for OV....................................................................................................................................74 Figure D.5 Evaporator pressure drop overlaid for OV and CV operation ............................................................................75

vii
List of Tables
Page
Table 2.2 Test matrix for automotive a/c system experiments .................................................................................................6 Table 3.1 Temperature lift degradation breakdown ..................................................................................................................12 Table 3.2 Experimental results compared for OV and CV operation....................................................................................27 Table A.1 Experimental results for short-cycling and variable speed capacity regulation method..................................44 Table A.2 Condenser and evaporator saturation temperatures for VS and SC operation (τ=10s)....................................47 Table B.1 Short-cycling parameters and instruments used for measurements.....................................................................53 Table D.1 Lift degradation term and its components for OV and CV operation.................................................................72

viii
Nomenclature
A area, m2
AMTD arithmetic mean temperature difference
c specific heat, kJ/kg-K C thermal capacitance c)*m( & , kJ/K
COP coefficient of performance
∆T temperature difference, °C
∆Tc condenser side degradation term, °C
∆Te evaporator side degradation term, °C
∆Tsat temperature lift (cond-evap saturation temperature difference), °C
∆P pressure drop, kPa
∆u internal energy difference.
h heat transfer coefficient, kW/m2-K
hA product of heat transfer coefficient and corresponding area (h*A)
eQ& evaporator capacity, kW
refQ& refrigerant side heat transfer rate, kW
t time, s
u internal energy, kJ/kg-K
V& volumetric air flow rate, cfm or m3/s
W power, kW
x refrigerant quality
Greek
µ run time fraction
t cycle period, s
ρ density, kg/m3
Subscripts
air air
avg average (mean)
c condenser
cp compressor
cv closed valve
e evaporator
f fin
in in
init initial
m metal
max maximum
mean arithmetic mean with respect to surface

ix
min minimum
off off-cycle
on on-cycle
out out
ov open valve
ref refrigerant
sat saturation
sc short-cycling
t tube
vs variable speed

1
Chapter 1: Introduction
1.1 Background There is a need for capacity regulation in any air-conditioning system in order to maintain specified room
comfort as sensible and latent loads change. Most residential air-conditioning (a/c) systems in North America are
designed to meet the maximum heat load, sized to operate continuously at a specified design condition. During its
lifetime an a/c system seldom operates at design conditions. In order to meet actual loads, less than the maximum,
they usually operate in cycles of on and off operation, where the cycle length is determined by a deadband
thermostat controlling indoor room temperature.
A typical residential thermostat characteristic corresponds to approximately 3 cycles per hour at 50%
system load, as discussed by Parken et al. (1977). For example, for a moderate summer day in which heat load is
50% of maximum (design) heat load, residential a/c system is on about 50% of time, and off about 50% of time. If
cycle duration is 20 minutes, then it is turned off after about 10 min, stays off 10 minutes and is turned on again.
For a different summer day, average evaporator capacity and compressor power, over the cycle period, are reduced
by reducing compressor run time fraction. In this conventional cycling (CC) type of capacity regulation using long
cycling, both evaporator capacity and compressor power have maximum values during a large portion of on-cycle
and minimum values during a large portion of off-cycle. The heat exchangers (evaporator and condenser) are
practically inactive during off-cycles that exceed the heat exchanger thermal time constant. This causes very high
pressure lift during a large portion of the on-cycle and thus low efficiency.
In addition, long cycling efficiency is affected by cyclic losses. A significant amount of work has been
done in determining and quantifying cyclic losses in refrigeration systems. Refrigerant migration and component
thermal masses have been identified as the important contributors to cycling losses in the work of Coulter and
Bullard (1997), Krause and Bullard (1996), Wang and Wu (1990), Mulroy and Didion (1985), Murphy and
Goldschmidt (1986).
One alternative to the capacity regulation by long cycling is variable speed (VS) capacity regulation, in
which the system runs continuously, but at lower compressor speed. The room thermostat is connected to the
compressor controller such that when the heat load increases (indoor temperature increases) compressor speed
increases maintaining constant indoor temperature, while the compressor operates all the time. A heat transfer
surface area of heat exchangers is used in whole period of continuous operation reducing pressure lift and achieving
high cycle efficiencies. The findings of Bahel and Zubair (1989), Tassou et al. (1983), Marquand et al. (1984),
Toshiba (1987), Umezu and Suma (1984) show that VS systems can achieve seasonal energy savings of 15% to
40%. The cost of using VS capacity regulation method is high due to a need for inverter for changing compressor
speed.
Another way of regulating system capacity during the year is by cycling a compressor using shorter on/off
cycle times than typical a/c heat exchanger thermal time constant (~ 1 min). Thus, the compressor short-cycling
(SC) is characterized by short cycles of compressor on and off operation having duration on the order of seconds (5-
20 sec). The room thermostat would regulate the run time fraction of short-cycling similarly to regulating speed
during the variable speed regulation method. Thus, when the heat load increases (indoor temperature increases) run

2
time fraction increases maintaining constant indoor temperature. Heat exchangers are used in whole period of short-
cycling operation, reducing pressure lift during the on-cycle and ideally achieving the cycle efficiency of VS
capacity regulation method. The initial cost of using short-cycling capacity regulation method is potentially lower,
since there is no need for inverter. Even though the short-cycling may seem as a special case of a conventional
long-cycling, its performance and regulation are almost the same as during the variable speed operation. There are
several important similarities to the variable speed operation. Firstly, the room thermostat doesn’t regulate directly
the cycle period (as in the long-cycling), but run time fraction similar to the way compressor speed is regulated in
variable speed system. Secondly, the evaporator airflow requirements for compressor short-cycling are essentially
the same as for a variable-speed compressors. Since the heat exchangers are used during the whole cycle period,
evaporator blower operates all the time, ideally at a speed adjusted to enable independent control of humidity. In
contrast, during the long-cycling operation, the fan and blower operate only during the on-cycle, and in some
instances during the short initial phase of the off-cycle during which there is still potential for exchange of heat at
the condenser and evaporator. Finally, the evaporator and condenser saturation temperatures cycle with a small
amplitude around almost the same average temperature as in the variable speed operation during the short-cycling
operation, which provides for almost the same on-cycle pressure lift in between variable speed and short-cycling and
thus almost the same energy efficiency. In the limit as cycle period is reduced to zero, short-cycling becomes
indistinguishable (viewed from the perspective of heat exchangers’ response, not compressor) from VS. By
increasing cycle period significantly, short-cycling operation becomes equal to the conventional long-cycling
operation with the evaporator blower constantly operating.
1.2 Purpose The purpose of this report is to experimentally explore a method of capacity regulation involving
compressor on/off cycle times shorter than typical a/c heat exchanger thermal time constant, Experiments were
conducted in a conventional residential-scale split a/c system. The factors causing compressor short-cycling
efficiency losses are identified and quantified. The experimental facility, test procedure and test matrices will be
described in Chapter 2. After introducing the procedures used for evaluation of short-cycling performance in
Chapter 3, the factors important for the evaluation will be explained: 1) refrigerant side heat transfer resistance, 2)
pressure drop and 3) the heat exchanger thermal capacitance. Chapter 4 presents an experimental comp arison
between short-cycling and continuous operation for meeting an equal and constant load, and analyzes the effect of
cycle period on system performance. Conclusions are presented in Chapter 5.
Appendix A compares SC and VS operation in automotive a/c system. With our residential a/c apparatus,
it was not possible to compare SC with VS operation without resorting to use of different compressors and then
sorting out the effects of their different efficiencies. Therefore, to compare SC and VS operation in a controlled
fashion, some preliminary experiments were conducted using an automotive a/c systems. Experimental results
showing almost the same efficiency of SC and VS method in automotive a/c system is presented in Appendix A (and
excerpt in section 3.3.1). A description of the residential a/c system facility is presented in Appendix B. Appendix
C and D present figures with experimental data related to residential a/c experiments, which were not included in the
Chapters for the clarity of presentation purposes.

3
Chapter 2: Experimental facility, test matrix and procedure
2.1 Experimental facility The main components of a residential air conditioning system tested were condenser, evaporator,
compressor and expansion valve. The heat exchangers (condenser and evaporator) were taken from a two-ton, R-22,
unitary rooftop air conditioning system (Trane model TCH024100A). Indoor and outdoor heat exchangers for this
system are made of copper tubing and plate fins, and were placed in separate environmental chambers. The heat
exchangers were not modified from the original unitary a/c design in any way, but compressor, piping and expansion
device were replaced. A Copeland’s two-ton hermetic scroll compressor (Copeland model ZR22K3-TF5) was fitted
with a dynamic solenoid valve to enable more precise measurement and system control during the experiments. The
valve ensured that no refrigerant vapor leaked back to the evaporator during the off-cycle, and eliminated power
inputs during the off-cycle. The compressor was connected to a switch and timer that controlled lengths of on and
off compressor operation during short-cycling.
The existing commercial implementation of this concept has the mechanical clutch mechanism installed in
the compressor for the purpose of engaging and disengaging scrolls, enabling power efficient short-cycling without
high starting currents and potential reliability risks which exist when a switch is used. A switch was used in our
experiment since our focus has been on the influence of short-cycling on the rest of the system, not compressor. The
high starting currents were excluded from the analyses presented in this report. The measured start-up power peak
lasted about 0.2 seconds and accounted for about 0.5 – 10 % of the cycle -average measured power, for the longest
(56 sec) and shortest (3 sec) on-cycles, respectively.
In addition, the system was designed to enable liquid flow into the evaporator during the whole off-cycle,
by adding receiver holding enough liquid refrigerant to last during off-cycles of up to 40 seconds.
A manually adjusted expansion device replaced the original TXV to enable more precise control of the
experiments by eliminating the uncontrollable lags inherent in TXV’s. A solenoid valve was installed upstream of
the expansion device to enable comparison of two operating modes: 1) valve continuously open; and 2) valve
synchronized with compressor to isolate evaporator from condenser during off-cycle. The latter mode has been
found to be an efficient strategy in conventional cycling experiments, reported by Wang and Wu (1989).
Fast data scanning speed is needed to capture quick changes in measured parameters during short-cycling.
All data was taken with data acquisition system which was programmed for scanning a group of more than 50
parameters in 0.2 seconds. The data acquisition system carried special 7 Hz fixed filters capable of filtering
electrical noise from thermocouple measurements. The filters were installed since electric noise produces huge
errors on thermocouple readings at very fast scanning rates without filters. The temperatures, pressures, powers and
flow rates were measured throughout the facility. The air side and surface temperatures were measured by T-type
thermocouples, and the refrigerant side temperatures were measured by T-type immersion thermocouple probes.
Thermocouples were adjusted for tare values to provide the same output at the room temperature. The uncertainty in
thermocouple measurement is estimated to be +-0.1o C, using manufacturer's specifications. Low range, 0 to 1”
water (+/-0.4% FS), differential air pressure transducer was used for measuring the air side pressure drop across the
nozzle. The refrigerant pressures and pressure drops were measured by using absolute 0 to 500 psia (+/-0.1 % FS)

4
and differential 0 to 50 psid (+/-0.25% FS) pressure transducers. Watt transducers 0 to 8 kW (+/-0.5% FS)
measured the compressor, blower and heater powers. Coriolis type 0 to 680 kg/h (+/ -0.15% of reading) mass flow
meter, consisting of sensor and transmitter was used for measuring the refrigerant mass flow rate.
2.2 Test procedure For clarity of presentation, this report presents results from experiments performed with dry indoor coil, at
80o F (26.7o C) indoor air, and 95o F (35o C) outdoor air temperatures used for evaluation of the short-cycling
performance. The results at other experimental conditions will be presented in appendices. There is no significant
difference in the COP loss analysis, for the wet and dry coil experiments, as long as the evaporator surface
temperature remained lower than the dew point temperature at the end of the off-cycle. Results for a wet coil tests
will be presented in section 3.5.
The main method of regulating the evaporator capacity in short-cycling systems is the regulation of run
time fraction. The air flow rate over evaporator was decreased along with run time fraction (capacity), in order to
maintain the evaporator surface temperature at about 12o C during all experiments, as would be required during
actual wet coil operation. This enabled approximately the same latent/sensible load split during the wet indoor coil
surface experiments at different evaporator capacities. Figure (2.1) shows that the percent reduction from the design
air flow rate was almost the same as the percent change in the evaporator capacity due to the requirement to
maintain constant evaporator surface temperature. The evaporator design air flow rate was V& = 800 cfm (0.378
m3/s). The air flow rate over the condenser was kept constant for all experiments at V& = 2500 cfm (1.180 m3/s).
0
25
50
75
100
0.00 0.25 0.50 0.75 1.00
run time fraction - µ
Eva
pora
tor
capa
city
[%
of
des
ign
cap
acity
at
µ=1
]
0
25
50
75
100
Air
flo
w r
ate
[% o
f d
esig
n V
at
µ=1
]
Qe
V
Figure 2.1 The change in capacity and air flow rate with run time fraction

5
An EEV was installed in the system and adjusted manually to achieve the desired fixed opening for each
operating condition. A fixed opening proved capable of providing the desired average on-cycle superheat at the
evaporator exit (of about 4o C) for experimental points at short-cycle periods (τ~10 sec). However, during longer
cycle periods (τ~60 sec) the fixed opening caused large fluctuations of superheat (1 – 15o C), with especially large
superheat at the end of on-cycle, causing significant degradation of evaporator capacity. A fast-responding EEV,
which would maintain constant superheat at the exit of evaporator during whole cycle period was not available.
Therefore to ensure that evaporator performance was repeatable, an expansion device opening was found which
enabled maintenance of the two-phase refrigerant evaporator exit throughout the whole on-cycle for each
experimental point. This eliminated the evaporator capacity degradation. To protect compressor from liquid
slugging a tape heater was installed on the suction line. In a real system, a fast-responding EEV would serve this
purpose with no additional energy input. Variation in average on-cycle suction superheat of 5 to 11o C was observed
for the whole test matrix due to use of fixed orifice and tape heater instead of more suitable fast EEV.
The analysis presented in Chapter 4 of the report compares short-cycling experiments done at run time
fraction of 0.56 to continuous operation to meet a load of about 4.0 kW. Continuous operation was achieved by
installing a nominal one-ton rotary compressor (Kenmore a/c unit, model 253.8783110, with compressor part#
A445513).
2.3 Test matrix The experiments were done in automotive and residential a/c lab. The a/c systems in these two labs are
described in Appendices A and B respectively.
The residential a/c system experiments were conducted at several conditions: at 80/95o F (indoor/outdoor
air temperature) with dry and wet coil; at 80/82o F with dry and wet coil. The test matrix listing all run time
fractions and cycle periods run at thes e conditions is shown in Table 2.1.
The test matrix was designed to provide information on short-cycling performance at various cycle periods
and run time fractions. The compressor was short-cycled at run time fractions (µ=0.56, 0.57 or 0.58 depending on
running conditions) to match exactly the capacity achieved during the continuous compressor operation. These
short-cycling experiments can therefore be compared to continuous operation.

6
Table 2.1 Test matrix for residential a/c system experiments
80/95oFrun time cycle period [sec] fraction 10 30 50 80
dry wet dry wet dry wet dry wet1 x x x x x x x
0.7 x x x x x0.56 (0.57 wet) x x x x x x x
0.5 x x x x x x x0.3 x x x x x x x x
80/82oFrun time cycle period [sec] fraction 10 30 50 80
dry wet dry wet dry wet dry wet0.57 (0.58 wet) x x x x x x
Before designing the residential a/c experiments, an initial set of experiments were conducted on an
automotive a/c system using both short-cycling and variable -speed capacity regulation method. The design
compressor speed was chosen. The system was run at various run time fractions and cycle periods at the design on-
cycle compressor speed during short-cycling operation. During the variable speed operation, the system was run at
several compressor speeds lower than the design speed and the efficiencies of the two methods were compared. The
test matrix listing all run time fractions, cycle periods (for short-cycling) and speeds (for variable -speed) is shown in
Table (2.2). Those results, detailed in Appendix A, showed that short-cycling system efficiency could indeed
approach that of variable-speed system. They also revealed that the built-in time lags of a TXV rendered it
unsuitable for conducting repeatable experiments on short-cycling system.
Table 2.2 Test matrix for automotive a/c system experiments
Short-cycling Variable-speedrun time cycle period [sec] compressor fraction 5 10 15 speed [rpm]
1 x x x 1700 x
0.8 x x x 1350 x0.6 x x x 1000 x
0.35 x x x 700 x
7
Chapter 3: Analysis of factors affecting short-cycling performance
3.1 Evaluating short-cycling performance Widespread reliance on cycling as the preferred method for modulating capacity in a/c systems has resulted
in a large body of literature that defines cycling “losses” by comparing cycling COP to the steady state COP at
100% capacity. Today, with the increasing use of variable-speed and variable-capacity compressors, it is
appropriate to redefine the baseline, and measure COP degradation from a condition closer to the thermodynamic
ideal. This will facilitate definitions and comparisons of a wide variety of systems, in terms of their cycling period
τ, and their capacity factor µ, as the evaporator capacity decreases with run time fraction).
To meet a given heating or cooling load, an ideal vapor-compression system must operate continuously to
minimize temperature lift, pumping just enough refrigerant to provide the needed capacity. The thermodynamically
ideal (Carnot) cycle operates between the indoor and outdoor ambient temperatures. The more realistic “ideal”
baseline system operates – continuously – between heat source and sink temperatures defined by the tube
temperatures of real heat exchangers, which have finite size and finite airflow rate. This ideal system would be
sized to meet the maximum load, and its steady state operation can be represented generally as a limiting case of a
system cycling at the range of capacities (run time fractions), µ≤1 and τ→0. On the other hand a conventional
cycling system would operate at the same capacity to meet the same load, but at a cycling period τ~O (30 min) that
reflects the thermal capacitance of the conditioned space. This chapter focuses on short-cycling systems having the
same capacity, but τ~O (10 sec) reflecting the thermal capacitance of the heat exchangers.
The time-averaged on-cycle temperature lift for all three systems (ideal baseline operation, conventional
cycling and short-cycling) will be different. The lowest ideal temperature lift is defined by the difference in between
the heat source and sink tube temperatures for the ideal baseline system where refrigerant side ∆T = 0. The highest
temperature lift exists for the conventional cycling operation. The refrigerant saturation temperatures follow those
of the heat source and sink, namely the heat exchanger surface that is in contact with the refrigerant. Due to their
relatively small thermal capacitance, real heat exchangers generally achieve thermal equilibrium with the indoor and
outdoor air during the first few minutes of the off-cycle. Therefore during conventional cycling, little heat is
transferred from the air to the refrigerant during the off-cycle, requiring large on-cycle air side ∆T’s to achieve the
required capacity. Since the compressor operates only during the on-cycle, large on-cycle air-side ∆T’s lead to high
on-cycle temperature lift, causing conventional cycling systems to have the highest power requirement for the same
capacity and the lowest efficiency. The purpose of short-cycling is to exploit the thermal capacitance of the heat
exchangers to minimize the magnitude of oscillation of the source and sink temperatures, around those of the steady-
state ideal system. That magnitude is much smaller than in the extreme case of conventional cycling.
Viewed from the air side, the requirement for sensible and latent cooling capacities to be the same for all
three systems implies that the cycle time averaged sink (evaporator) temperatures must be the same while the blower
is operating. Since the numerator of COP is therefore constant, the amount of degradation depends solely on the
power, which in turn is a function of on-cycle temperature lift. The energy efficiency will therefore be inversely
proportional to the magnitude of the temperature lift. Therefore to compare short-cycling system efficiencies with

8
those of variable-speed, we monitor the difference between the whole-cycle mean tube (metal) temperature and the
on-cycle mean saturation temperature in the evaporator and condenser (∆Te = Tm,e – Tsat,e,on and ∆Tc = Tsat,c,on - Tm,c).
The larger the defined difference, which causes the temperature lift degradation (therefore called lift degradation
term), the greater the COP degradation relative to the ideal condition.
3.2 Factors affecting short-cycling efficiency For the case of steady state operation with a variable -speed or variable-displacement compressor, the
exis tence of finite refrigerant side ∆T is one factor increasing the on-cycle temperature lift, and thereby degrading
COP relative to the ideal case where ∆Tref = 0. The other factor is refrigerant pressure drop, which increases
temperature lift by ∆Tsat(∆Pref).
3.2.1 Refrigerant side heat transfer During short-cycling, on-cycle refrigerant side heat transfer rate must be greater, by almost a factor of
1/µ (due to low refrigerant side heat transfer rate during the off-cycle), than in the case of continuous operation at
the same capacity. However the penalty in terms of on-cycle ∆Tref need not increase by the same amount (1/ µ), if
the on-cycle refrigerant side heat transfer coefficient is larger. The full-speed operation of a short-cycling
compressor may increase on-cycle refrigerant mass flux enough to ameliorate the COP degradation due to low off-
cycle heat transfer rate.
3.2.2 Pressure drop Another factor influencing COP degradation is refrigerant pressure drop, which increases temperature lift
by ∆Tsat(∆Pref). Since pressure drop in a crossflow heat exchanger also increases capacity, the net effect of pressure
drop on system temperature lift, in the case of constant capacity can be approximated by ∆Tsat(∆Pref/2). The
degradation due to the on-cycle refrigerant pressure drop, ∆Pref,on, is expected to be greater than for continuous
operation at the same capacity, due to the higher mass flux.
3.2.3 Thermal capacitance (heat exchanger metal temperature nonlinearity) Thermal capacitance is another factor affecting COP degradation during cycling, independent of the factors
described above. In all cases of cycling with τ>0, the source and sink (tube) temperatures will oscillate around the
same mean in order to maintain a fixed capacity. However, the on-cycle mean tube temperatures could be
significantly different from the whole-cycle mean temperatures depending on the thermal capacitance of the heat
exchangers. Since refrigerant saturation temperatures follow the oscillations of the tube temperatures, COP may be
affected to the extent that on-cycle average surface temperatures significantly differ from the whole-cycle average,
thus increasing the temperature lift. For those average saturation temperatures to be equal, the tube temperature
oscillations must be linear. They are not, due to the inherently exponential nature of the heat transfer process
(Figure 3.17). The worst case of nonlinearity occurs for the “step function like” tube temperature oscillations in
conventional long-cycling; the on-cycle average saturation temperature is far greater than whole-cycle average. At
the opposite extreme, very short cycling exploits the thermal capacitance of the heat exchangers, having almost
linear tube temperature oscillations minimizing the effects of exponential nature. The linearity of those oscillations

9
would eliminate the difference between on-cycle and whole-cycle mean tube temperatures which are equal to the
tube temperatures of the steady-state ideal system (Figures 3.15 and 3.16).
3.3 Analysis of short-cycling experiments The pressure lift integrated over the on-cycle (difference between condenser and evaporator saturation
pressure) of the short-cycling operation is the main parameter for evaluating short-cycling performance. The higher
the pressure lift, the higher compressor work required for compressing a unit of refrigerant mass. The evaporator
capacity determines the refrigerant mass flow rate required. Thus, for two systems operating at the same capacity
(the same refrigerant mass flow rate), the system with the higher integrated on-cycle pressure lift would consume
more power and be less efficient.
3.3.1 Automobile a/c system experiments With our residential a/c apparatus, it was not possible to compare short-cycling with variable-speed
operation without resorting to use of different compressors and then sorting out the effects of their different
efficiencies. Therefore, to compare short-cycling and variable-speed operation in a controlled fashion, some
preliminary experiments were conducted using an automotive a/c systems. These initial experiments were done
with clutch-cycling an automotive scroll compressor in R134a automotive a/c system at three run time fractions
(µ=0.8, 0.6 and 0.35). Run time fraction µ=1 (100% on) was chosen as the design, maximum capacity operation at
1700 rpm. Short-cycling could therefore be compared directly to the variable -speed capacity regulation method,
since the compressor in the system was driven by a variable speed electric motor. The capacity during variable
speed experiments was regulated by changing compressor speed to 1350 rpm, 1000 rpm and 700 rpm.
The results shown in Figure 3.1 show that short-cycling achieved almost the same efficiency as variable
speed operation at lower than design capacities, which is significantly higher than achieved in conventional long-
cycling which would be close to that observed at µ=1.
0
1
2
3
4
1.5 2.5 3.5
Evaporator capacity [kW]
CO
P
COPshort-cycling
µ=1
µ=0.8
µ=0.6
µ=0.35
COPvariable,speed
1700 rpm
1350 rpm
1000 rpm
700 rpm
Figure 3.1 Automotive a/c system efficiency comparison; variable speed vs. short-cycling

10
3.3.2 Residential a/c system experiments The focus of analysis in the next sections will be on the factors influencing the increase in pressure lift at a
given capacity of short-cycling operation. The range of capacities is achieved by changing run time fraction of the
short-cycling residential a/c system.
To illustrate how COP decreases with pressure lift during short-cycling operation, Figures (3.2) and (3.3)
show the COP and saturation temperature lift respectively, for experiments at µ=0.5 (50% on time) and several cycle
periods (τ=10–80 sec) with dry evaporator surface at indoor/outdoor temperature 80/95o F.
0
1
2
3
4
5
0 20 40 60 80 100
cycle period [sec]
CO
P
Figure 3.2 COP degradation with cycle period for experiments at µ=0.5
0
10
20
30
40
50
0 20 40 60 80 100
cycle period [sec]
Tem
per
atu
re [o
C]
Tsat,c,on,avg
Tsat,e,on,avg
Figure 3.3 The saturation temperature lift increase with τ for experiments at µ=0.5

11
3.3.2.1 The lift degradation term as a basis for evaluating the system efficiency The short-cycling operation will be evaluated by comparing it to the ideal system baseline operation. The
ideal system baseline operation is defined as continuous operation at the same capacity, between heat source and
sink temperatures defined by the tube temperatures of real heat exchangers. In other words the ideal baseline case
corresponds to VS operation with infinite refrigerant side heat transfer coefficients causing zero refrigerant side
temperature differences. Actual variable -speed system would fall short of this ideal due to its finite h ref. An ideal
baseline defined in this manner allows both variable-speed and short-cycling systems to be compared in terms of
their increased pressure lift caused by finite h ref, ∆Pref and other factors.
The system efficiencies were compared by monitoring the difference between the whole-cycle mean tube
temperature (Tm,avg) and the on-cycle mean saturation temperature (Tsat,on,avg) in the evaporator and condenser. The
larger those differences, the greater the temperature lift and COP degradation relative to the ideal condition at a
given capacity. Figure 3.4 shows the same evaporator and condenser saturation temperatures (shown in Figure 3.2),
with an overlay showing the whole -cycle mean heat exchanger metal temperature for experiments at µ=0.5 (about
50% of design capacity) and several cycle periods (τ=10–80 sec).
0
10
20
30
40
50
0 20 40 60 80 100
cycle period [sec]
Tem
per
atu
re [o
C]
Tsat,c,on,avg
Tsat,e,on,avg
Tm,e
Tm,c
∆Te
∆Tc
Figure 3.4 Lift degradation term increase with cycle period for experiments at µ=0.5
The factors affecting short-cycling efficiency will be analyzed on the evaporator side. The same
mechanisms and processes influence the establishment of higher on-cycle condenser saturation temperature. We
will focus on the evaporator side temperature lift degradation term (∆Te = Tm,e,avg - Tsat,e,on,avg ) and its components in
next paragraphs in order to explain the mechanisms causing the COP degradation during short-cycling operation.
The third (bold) column of Table 3.1 shows the values of the evaporator side lift degradation term (∆Te) for
the set of experiments at various run time fractions and cycle periods with dry evaporator surface at indoor/outdoor
temperature 80/95o F.

12
Table 3.1 Temperature lift degradation breakdown
80/95oFrun time cycle period ∆Te ∆Te(ht) ∆Te(nonlin) ∆Te(∆P) fraction [sec] [oC] [oC] [oC] [oC]
1 0 2.7 2.1 0.0 0.60.7 10 2.5 2.0 0.0 0.50.7 30 2.7 2.1 0.1 0.50.7 50 3.2 2.3 0.3 0.50.7 80 3.6 2.4 0.7 0.50.5 10 2.3 1.9 0.0 0.40.5 30 2.8 2.2 0.1 0.50.5 50 3.5 2.5 0.4 0.60.5 80 4.8 3.1 1.2 0.50.3 10 2.0 1.7 0.0 0.40.3 30 2.7 2.2 0.0 0.50.3 50 3.3 2.5 0.3 0.60.3 80 4.3 3.0 0.7 0.6
Figure 3.5 shows the lift degradation term as a function of cycle period for four run time fractions. It can be seen
that the lift degradation term increases with the cycle period for a given run time fraction.
0
1
2
3
4
5
0 20 40 60 80 100
cycle period [sec]
∆Te
[o C]
mu=0.7
mu=0.5
mu=0.3
Figure 3.5 Lift degradation term as a function of cycle period and run time fraction
Figure (3.6) shows how on-cycle temperature lift decreases at lower run time fractions. Therefore a given
value of the lift degradation term (∆Te) will have a proportionally greater effect on COP at lower capacities.

13
0
10
20
30
40
50
0 0.2 0.4 0.6 0.8 1
run time fraction - µ
Tem
per
atu
re li
ft [
oC
]
Figure 3.6 Temperature lift as a function of µ for τ=10 sec
The absolute value of the degradation term of about 3 C at various µ, shown in Figure 3.7, represents higher
percentage of saturation temperature lift at low than at high run time fractions and thus hurts performance more.
0
1
2
3
4
5
0 0.2 0.4 0.6 0.8 1
run time fraction - µ
∆T
e [o C
]
Figure 3.7 Lift degradation term as a function of µ for τ=10 sec
Therefore the short-cycling COP loss is actually greatest for small run time fraction (at lower capacities),
despite the fact that experimental results show a larger evaporator temperature lift degradation at µ=0.5 than at
µ=0.3, might appear to suggest a different conclusion.

14
3.3.2.2 Separating the lift degradation term The lift degradation term was separated into three terms, each representing one major factor increasing the
temperature lift (columns 4 to 6 in Table 3.1): refrigerant side heat transfer resistance [∆Te(rht)], pressure drop
[∆Te(∆P)] and nonlinearity term [∆Te(nonlin)]. Equations 3.1 to 3.4 show that mathematical sum of these three
degradation terms is equal to total degradation of temperature lift.
Tm,e,avg - Tsat,e,on,avg = ∆Te(rht) + ∆Te(∆P) + ∆Te(nonlin) (3.1)
where:
∆Te(rht) = Tm,e,on,avg – Tsat,e,mean,on,avg (3.2)
∆Te(∆P) = Tsat,e,mean,on,avg - Tsat,e,on,avg (3.3)
∆Te(nonlin) = Tm,e,avg - Tm,e,on,avg (3.4)
3.3.2.2.1 The refrigerant side heat transfer term -- ?Te(rht) The existence of finite on-cycle refrigerant
side temperature difference, ∆Tref(t)= Tm,on(t) – Tsat,on(t), is one factor increasing the average on-cycle temperature
lift, thereby degrading COP relative to the baseline ideal case where ∆Tref = 0.
The mean evaporator surface temperature was obtained as an area-weighted average of 12 surface
thermocouples located on return bends. The corresponding mean saturation temperature with respect to evaporator
surface, Tsat,e,mean = Tsat,e + ∆Te(∆Pe/2), was obtained by monitoring the exit saturation pressure and the total pressure
drop across the evaporator. Figure 3.8 shows the refrigerant side heat transfer lift degradation term increasing
slightly with cycle period, at four run time fractions.
0
1
2
3
4
5
0 20 40 60 80 100
cycle period [sec]
∆T e
(rh
t) [o
C]
mu=0.7
mu=0.5
mu=0.3
Figure 3.8 Refrigerant heat transfer part of temperature lift degradation term, ∆Te(rht)

15
3.3.2.2.2 The pressure drop term -- ?Te(?P) The evaporator mean saturation temperature with respect to
surface, Tsat,e,mean, is defined such that it does not depend on the refrigerant side pressure drop. However, the effect
of evaporator pressure drop on the compressor suction pressure is exactly half of the refrigerant side pressure drop
(difference between evaporator mean and exit pressure). The equation Psat,e,out = Psat,e,mean - ∆Pe/2 can be written in
terms of temperatures used in equation 3.3, Tsat,e = Tsat,e,mean - ∆Te(∆Pe/2). The evaporator exit pressure was
measured and used as the indicator of the temperature lift in this analysis. The compressor inlet pressure is real
representative of the temperature lift, therefore the chosen pressure drop term ∆Pe/2, omits the system-specific
suction line pressure drop, which is proportional to it.
Figure 3.9 shows that the pressure drop term was almost constant for the set of cycle periods, as expected
due to the almost constant on-cycle refrigerant mass flux resulting from the constant on-cycle compressor speed. For
the same reason, the temperature lift degradation term due to the pressure drop is also nearly independent of run
time fraction.
0
1
2
3
4
5
0 20 40 60 80 100
cycle period [sec]
∆Τ e
( ∆P
) [o
C]
mu=0.7
mu=0.5
mu=0.3
Figure 3.9 Refrigerant pressure drop part of lift degradation term, ∆Te(∆P)
3.3.2.2.3 The metal temperature nonlinearity term -- ? Te(nonlin) Due to the inherently exponential nature
of the heat transfer process, the evaporator metal temperature during the off-cycle will approach the air temperature
nonlinearly. The same phenomenon occurs during the on-cycle as the metal temperature is pulled down towards the
steady-state refrigerant saturation temperature. Short-cycling truncates these processes, but the fundamental
asymmetry remains. As a result, the on-cycle average metal temperature is always less than the whole-cycle
average, as shown in Figure 3.10. Since the compressor sees only the lower on-cycle metal temperature, there is a
penalty in pressure lift for long cycle periods where the nonlinearities are the greatest.

16
4
7
10
13
16
0 10 20 30 40 50Time [sec]
T [
oC
]
ON - CYCLE OFF - CYCLE
∆Te(nonlin) = 0.4oC Tm,e,avg
Tm,e,on,avg
Tm,e = f(t)
Figure 3.10 Nonlinear evaporator metal temperature, Tm,e, oscillations at µ=0.5 and τ=50 sec
Figure (3.11) shows how this loss significantly increases with cycle period, more than was observed for the pressure
drop and refrigerant heat transfer terms. The effect of evaporator metal thermal mass on the nonlinearity of the
temperature fluctuations is explored in Section 3.4.2.
0
1
2
3
4
5
0 20 40 60 80 100
cycle period [sec]
∆T
e(n
on
lin)
[ o C
]
mu=0.7
mu=0.5
mu=0.3
Figure 3.11 Metal temperature nonlinearity part of a COP loss term, ∆Te(nonlin)
All three lift degradation terms are illustrated in Figure 3.12, for cycle period τ=50 sec and run time
fraction µ=0.5.

17
4
7
10
13
16
0 10 20 30 40 50Time [sec]
T [
oC
]
Tsat,e,mean
Tsat,e
Tm,e
ON - CYCLE OFF - CYCLE
∆Te(nonlin) = 0.4oC
∆Te(rht) = 2.5oC
∆Te(∆P) = 0.6oC
∆Te = 3.5oC
Tm,e,avgTm,e,on,avg
Tsat,e,mean,on,avg
Tsat,e,on,avg
Figure 3.12 Lift degradation term divided into three parts for µ=0.5 and τ=50 sec
3.4 Effect of evaporator thermal capacitance To understand the significance of parameters influencing the nonlinearity of the evaporator metal
temperature fluctuation, represented by the difference in between the entire cycle and on-cycle average metal
temperature, the dynamics of the evaporator metal temperature fluctuation during the compressor on and off-cycle
were modeled as a 1st order, lumped capacitance system. The model validity will be checked by comparing it with
the experimental results.
It has been shown that the nonlinearity part of the temperature lift degradation term becomes dominant as
the cycling period increases. It is possible that heat exchanger having relatively large thermal capacitance, may be
able to minimize COP degradation at longer cycle periods than a less massive one.
Equation 3.5 describes the change of evaporator metal temperature as a function of the air side and
refrigerant side heat transfer rates. The resistance of the copper and aluminum to internal heat conduction is assumed
to be small compared to convective resistance of the air side heat transfer, so the metal can be assumed to be
isothermal throughout.
refairm
m QQ)dt
dT(*C && −= (3.5)
The thermal capacitance Cm = ct*mt + c f* mf = 14 kJ/K (about 60% tubes, 40% fins) was calculated from the
dimensions of evaporator fins and tubes, assuming the densities and specific heats of copper and aluminum to be
0.356 kJ/kg-K and 0.886 kJ/kg-K respectively. The heat transfer rate from the air to the evaporator metal, during
both compressor off and on-cycles, is approximated using a simple arithmetic mean temperature difference model,
AMTD*hAQ e,airair =& (3.6)
18
where hAair,e [kW/K] is product of the air side heat transfer coefficient and evaporator surface area averaged over
entire evaporator surface and AMTD = [(Tair,in + Tair,out)/2 – Tm] is arithmetic mean temperature difference, which is
solved simultaneously at each time step with the air side energy balance using equation (3.7).
)TT(*c*V*Q out,airin,airpairairair −= && ρ (3.7)
Equations 3.8 and 3.9 describe the refrigerant side heat transfer rate from the evaporator metal to the refrigerant
during the off and on-cycles, respectively.
off
of f,init,refof f,refrefof f,ref t
uu*mQ
−= && (3.8)
µavg,e
on,refQ
Q&
& = (3.9)
where
1 )(*Q*QQ off,refon,refavg,e µµ −+= &&& (3.10)
is the evaporator heat transfer rate averaged over the entire cycle period, and mref and u ref,init,off are the refrigerant
mass and internal energy in the evaporator at the end of the on-cycle. It is clear from the experimental data (e.g.
Figure 3.12) that the off-cycle heat transfer rate between the tube and refrigerant is almost negligible, reaching only
~15% of on-cycle heat transfer rate in the worst case (µ=0.7, τ=10 sec). Therefore we assume that all refrigerant
side heat transfer occurs during the on-cycle at a constant rate equal to the avg,eQ& /µ, as indicated by the nearly
constant on-cycle temperature difference, Tm - Tsat,e. Note that the slight on-cycle temperature difference increase is
offset by a slight decrease in refrigerant mass flow rate through the compressor as suction pressure declines. In
addition, data also show that the off-cycle refrigerant internal energy term mref*∆u/toff varies between 3.5 to 4.5 % of
the metal thermal capacitance term depending on µ, suggesting the dominance of hAair,e/Cm term in equation 3.11.
The model governing equations are therefore written for off and on-cycle respectively:
moff
off,init,refoff,refref
m
mavg,airairm C/t
)uu(*m
C
)TT(*hA
dtdT −
+−
= (3.11)
m
avg,emavg,airair
m
C
Q)TT(*hA
dtdT µ
&−−
= (3.12)
3.4.1 Model validation using the experimental measurements The validity of the model will be checked by comparing it with the experimentally obtained evaporator
metal temperature during the on and off-cycle.
The average hAair,e for entire evaporator was determined from dry coil steady state (µ=1 at 80/95o F) data to
be 0.94 kW/K. The average hAair.e was determined from experimental data by integrating the term airQ& /AMTD

19
over entire cycle period at a given µ, where airQ& was obtained from the air side energy balance. Since air flow rate
varied for µ<1, the dry coil experimental data in Figure 3.13 were used as inputs in calculations.
0
0.2
0.4
0.6
0.8
1
0 0.2 0.4 0.6 0.8 1
µ
hA
air,
e [k
W/K
]
tau=10
tau=30
tau=50
tau=80
Figure 3.13 Experimentally obtained values of hAair,e for the range of µ and τ
The hAair,e shown in Figure 3.13 changed due to change in air flow rate at each run time fraction, following
relation: hAair,e (µ)/hAair,e(µ=1)=0.99*[Vair(µ)/Vair(µ=1)]1.024, which can be derived from experimental data.
Due to the uncertainty of the fin and tube thickness measurements, the calculated Cm value of 14 kJ/K is
estimated be accurate within +/- 15%. In Figure 3.14, it is compared to the evaporator thermal capacitance, Cm,
obtained from 12 dry coil experiments. The Cm value for each experiment has been calculated using the equation
off,eQ& /(Tm,max-Tm,min), where off,eQ& is the off-cycle air side evaporator capacity and Tm,max-Tm,min is the amplitude
of the evaporator metal temperature fluctuation for each experiment. These results appear consistent with the 14
kJ/K estimated independently from the evaporator dimension.
0
2
4
6
8
10
12
14
16
18
0 0.2 0.4 0.6 0.8 1µ
Cm
[kJ/
K]
tau=10
tau=30
tau=50
tau=80
Figure 3.14 Experimentally obtained values of Cm for the range of µ and τ
20
The area-weighted average evaporator metal temperature used in the preceding calculations was obtained from
insulated surface thermocouples located at 12 different spots on evaporator tubes (U-bends). There is uncertainty of
about (1 +/- 0.1o C) in choosing this area weighted average temperature as the representative of the entire evaporator
temperature due to +/- 0.1o C uncertainty of each tube temperature measurement, and +1o C due to possible
variations between the difference of the average fin (not measured) and average tube temperatures, since fins
account for about 40% of total evaporator thermal capacitance.
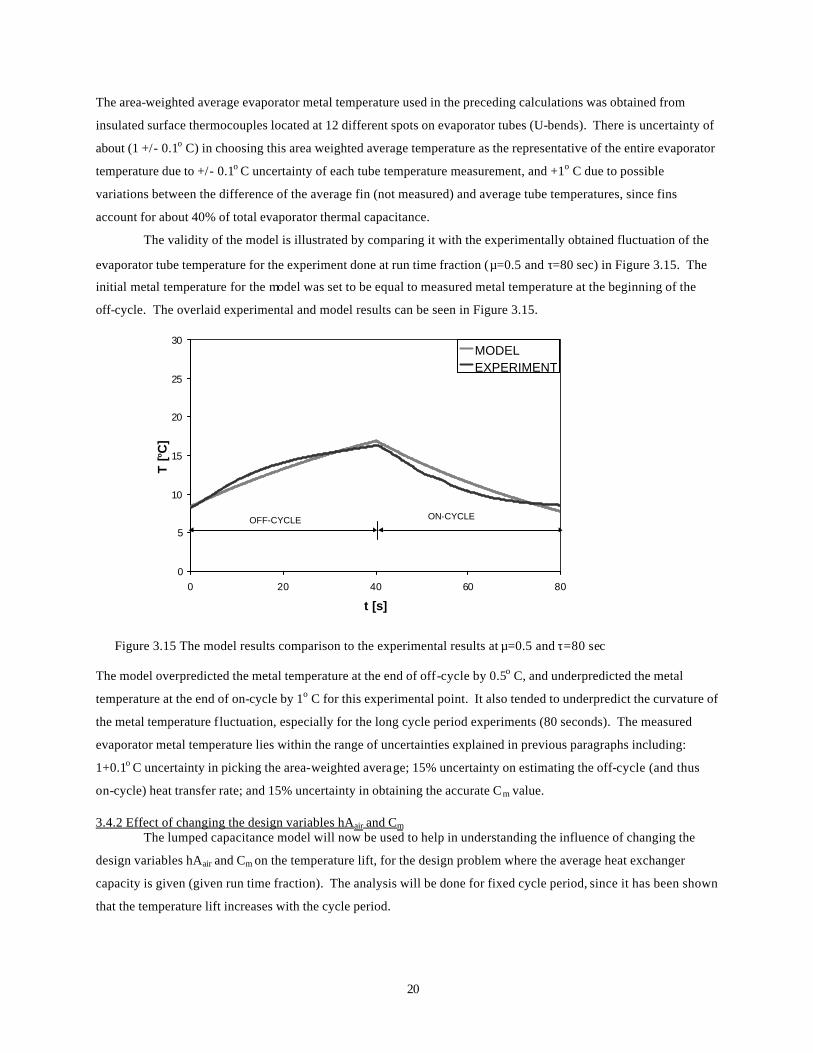
The validity of the model is illustrated by comparing it with the experimentally obtained fluctuation of the
evaporator tube temperature for the experiment done at run time fraction (µ=0.5 and τ=80 sec) in Figure 3.15. The
initial metal temperature for the model was set to be equal to measured metal temperature at the beginning of the
off-cycle. The overlaid experimental and model results can be seen in Figure 3.15.
0
5
10
15
20
25
30
0 20 40 60 80
t [s]
T [
o C]
MODELEXPERIMENT
OFF-CYCLE ON-CYCLE
Figure 3.15 The model results comparison to the experimental results at µ=0.5 and τ=80 sec
The model overpredicted the metal temperature at the end of off-cycle by 0.5o C, and underpredicted the metal
temperature at the end of on-cycle by 1o C for this experimental point. It also tended to underpredict the curvature of
the metal temperature fluctuation, especially for the long cycle period experiments (80 seconds). The measured
evaporator metal temperature lies within the range of uncertainties explained in previous paragraphs including:
1+0.1o C uncertainty in picking the area-weighted average; 15% uncertainty on estimating the off-cycle (and thus
on-cycle) heat transfer rate; and 15% uncertainty in obtaining the accurate Cm value.
3.4.2 Effect of changing the design variables hAair and Cm The lumped capacitance model will now be used to help in understanding the influence of changing the
design variables hAair and Cm on the temperature lift, for the design problem where the average heat exchanger
capacity is given (given run time fraction). The analysis will be done for fixed cycle period, since it has been shown
that the temperature lift increases with the cycle period.

21
Change in the hAair and Cm, for a given heat exchanger capacity and cycle period, affects the temperature
lift in two ways, by affecting change in:
1) Air side ∆T 2) 2) Nonlinearity of the heat exchanger metal temperature, represented by the difference between the full
cycle and on-cycle average metal temperatures, which is affected primarily by: the magnitude of the metal temperature oscillation, and the quotient hAair/Cm , defining the exponential rate, and thus the curvature of the metal temperature oscillation.
The higher the air side ∆T and nonlinearity, the higher temperature lift, and thus lower COP. The higher
the magnitude of the metal temperature oscillation, the higher nonlinearity. The air side ∆T is affected by changing
hAair only. Decreasing Cm increases magnitude of metal temperature oscillations, while air side ∆T stays constant.
Increasing hAair decreases air side ∆T, while magnitude of oscillations stays constant.
The evaporator air side ∆T, ∆Tair,e=15o C, and evaporator metal temperature nonlinearity,
∆Te(nonlin)=Tm,e,avg-Tm,e,on,avg=0.45o C, for the case of µ=0.5 and τ=80 seconds, was calculated using model, and it is
shown in Figure 3.16, for values Cm=14 kJ/K and hAair,e= 0.47 kW/K.
Two cases will be analyzed at µ=0.5; τ=80:
1) Halving Cm while maintaining hAair,e the same (doubling the quotient hAair,e/Cm) 2) Doubling hAair,e by changing air side heat transfer coefficient, hair,e, while air side surface area remains
constant, and hence Cm remains constant (also doubles quotient hAair,e/Cm)
0
10
20
30
0 20 40 60 80
t [s]
T [o C
]
OFF-CYCLE ON-CYCLE
∆Te(nonlin)=0.45oC
∆Tair,e =15oC
∆Tm,e,avg
Tair
Figure 3.16 Calculated evaporator metal temperature
3.4.2.1 Halving Cm while maintaining hAair,e constant Figure 3.17 shows that decreasing thermal capacitance by a factor of two (assuming a less “thermally
massive” evaporator installed) increases ∆Te(nonlin) from 0.45o C to 1.6o C, while the whole -cycle average
evaporator metal temperature stays unchanged, thus air side ∆T remains constant (∆Tair,e=15o C). For this
compressor, such a 1o C increase in temperature lift, caused on the evaporator side, decreases COP about 2%. The
reason for the increase in nonlinearity is in increased magnitude of metal temperature fluctuation, caused by halving

22
Cm. The increase in hAair,e/Cm caused additional increase in nonlinearity due to increase in the exponential rate, and
thus increased curvature of the metal temperature oscillation.
0
10
20
30
0 20 40 60 80
t [s]
T [
oC
]
OFF-CYCLE ON-CYCLE
∆Te(nonlin)=1.6oC
∆Tair,e =15oC
∆Tm,e,avg
Tair
Figure 3.17 Influence of halving Cm
3.4.2.2 Doubling hAair,e while maintaining Cm constant One way to imagine this scenario is that hair,e is varied, while A and Cm remain constant. In this case the
designer focuses on fin surface enhancements by changing fin surface geometry, while air flow rate increases to
maintain constant capacity, thus additionally increasing hair,e without changing size or mass of heat exchanger.
Figure (3.18) shows that increasing hAair,e in this fashion by a factor of two increases ∆Te(nonlin) only slightly from
0.45o C to 0.9o C, while decreasing ∆Tair significantly, from 15o C to 7.5o C.
0
10
20
30
0 20 40 60 80
t [s]
T [o
C]
OFF-CYCLE ON-CYCLE
∆Te(nonlin)=0.9oC
∆Tair,e =7.5oC
∆Tm,e,avg
Tair
Figure 3.18 Influence of doubling hAair,e

23
In this case, the magnitude of oscillations was unchanged because Cm remained constant. Since the
quotient hAair,e/Cm was doubled, the curvature of the metal temperature oscillation increased. Constant Cm
maintained the same magnitude of metal temperature oscillations.
It is shown that doubling hAair increases nonlinearity, due to increase in exponential rate quotient hAair/Cm,
while maintaining the same metal temperature oscillation magnitude. In addition to this small increase in
temperature lift due to nonlinearity (a few tenths of a degree), doubling hAair causes the significant temperature lift
decrease of approximately 7.5o C (compared Figures 3.16 and 3.18). Therefore, whenever design requirements
allow, hAair should be as high as possible, due to dominance of beneficial effect of reducing air side ∆T over the
effect of small increase in nonlinearity.
The time constant of a simple lumped capacitance system is (hAair/Cm)-1, but it is clear that the COP
degradation of this air conditioning system is more sensitive to a halving of the denominator than to a doubling of
the numerator. When Cm is halved, the temperature lift penalty due to nonlinearity increases significantly due to two
additive effects: increased magnitude of metal temperature oscillations, and increased exponential rate quotient
hAair/Cm, while air side ∆T stays the same. On the other hand, when hAair is doubled, the air side ∆T is significantly
reduced and nonlinearity slightly increased. The effect on temperature lift nonlinearity is smaller than observed
when Cm was halved, since magnitude of oscillations was smaller, leaving only doubled exponential rate quotient to
influence increase in nonlinearity.
Doubling hAair,e in this example would significantly increase time averaged metal temperature, from 12o C
to 19o C, and would make dehumidification impossible. Therefore, analysis of doubling hAair,e on evaporator side is
unrealistic because dehumidification is important part of design requirements. However, the same effect can be
exploited on the condenser side.
3.5 Wet coil performance under short-cycling Dry coil experiments at 80/95o F, were used as a basis for the analysis done in previous sections of Chapter
3. The air flow rate over evaporator for dry coil experiments was decreased with run time fraction to maintain the
cycle-average evaporator surface temperature at 12o C, equal to the surface temperature at dry coil design condition
at µ=1. A nearly identical set of wet surface experiments was conducted at the standard capacity rating condition
(80/95/67o F), where the 67o F wet bulb temperature corresponds to the 50% inlet air relative humidity which ensures
that the surface is fully wet. Results of these experiments are presented here. Additional results for 80/82o F dry and
wet coil experiments are presented in Appendix C.
The purpose of the wet surface experiments was to determine whether the latent load had any effect on
COP degradation caused by short-cycling. The air flow rate over the evaporator was changed for each run time
fraction in order to maintain the whole-cycle average evaporator metal temperature at the 12.5o C needed to achieve
the same ~25/75% latent/sensible load split at all operating conditions. Since this sensible heat ratio serves as a
widely accepted target throughout the industry, it was decided to conduct these wet surface experiments at 12.5o C
instead of the 12o C that had been chosen arbitrarily for the earlier dry surface experiments. Almost the same COP degradation for wet and dry experiments was expected since the refrigerant sees
only the constant tube wall temperature, which is nearly identical for both cases.

24
There is no significant difference in COP degradation observed, for the wet and dry coil experiments, as
shown in Figures 3.19 and 3.20. Virtually identical increases in on-cycle temperature lift for wet and dry coil
experiments caused essentially identical decreases in COP. The experimental results showing an increase in the on-
cycle temperature lift with cycle period, for a given run time fraction, are presented for both dry and wet coil
experiments in Figure 3.21 and 3.22, respectively.
The evaporator surface temperature remained lower than the 15.5 C dew point temperature throughout
cycle as shown in Figure 3.23 for the longest cycle period (80 sec), which was the primary reason for almost
identical COP degradation with cycle period for wet and dry coil experiments.
0
1
2
3
4
5
6
7
0 20 40 60 80 100
Cycle period [sec]
CO
P
mu=0.7mu=0.5mu=0.3
10.2 %
Figure 3.19 COP degradation with cycle period for dry coil experiments
0
1
2
3
4
5
6
7
0 20 40 60 80 100
Cycle period [sec]
CO
P
mu=0.7mu=0.5mu=0.3
10.7%
Figure 3.20 COP degradation with cycle period for wet coil experiments

25
0
10
20
30
40
50
0 20 40 60 80 100
Cycle period [sec]
T [o
C]
µ=0.7
µ=0.5
µ=0.3
µ=0.7
µ=0.5
µ=0.3
Figure 3.21 On -cycle average saturation temperatures for dry coil experiments
0
10
20
30
40
50
0 20 40 60 80 100
Cycle period [sec]
T [o C
]
µ=0.7µ=0.5
µ=0.3
µ=0.7
µ=0.5
µ=0.3
Figure 3.22 On -cycle average saturation temperatures for wet coil experiments

26
5
7
9
11
13
15
17
0 20 40 60 80Time [sec]
T [
oC
]
Tdewpoint=15.5oC
Tmet,e
Figure 3.23 Evaporator metal and dew point temperature at µ=0.3 and τ=80 sec
3.6 Open vs. closed valve operation To understand the effect of isolating the evaporator during the off-cycle, the solenoid valve (solenoid valve
was installed upstream of the expansion device as explained in section 2.1 of Chapter 2) was disabled so refrigerant
could flow continuously through the expansion valve during the off-cycle.
It was expected that the open valve (OV) operation would have lower COP than closed valve (CV)
operation due to possible condensation in evaporator during off-cycle. The evaporator refrigerant temperature rose
quickly to the evaporator metal temperature during first few seconds of the off-cycle for both OV and CV operation
due to quick pressure rise caused by continued evaporation in the limited low side volume. In the CV case the
metal-to-refrigerant heat transfer terminated when the ∆T vanished. However in the OV case, the off-cycle
refrigerant flow into the evaporator was expected to continue increasing the saturation pressure, which would cause
the evaporator metal to be heated from the refrigerant side while at the same time absorbing heat from the air. Thus,
during OV operation, refrigerant could start condensing on the metal, causing additional COP degradation. The
difference between saturation and metal temperatures would never get very high because the metal temperature rises
slowly as it soaks up heat from the refrigerant.
In order to compare the OV and CV strategies, the system was run at µ= 0.5 and τ=30 seconds for both.
Experiments were done with a dry evaporator surface. The air flow rate over the condenser was kept at V& =1.180
m3/s. The air flow rate over the evaporator was V& = 0.184 m3/s, about 49% of the design air flow rate, to hold the
evaporator surface temperature at the desired 12o C.
Figure 3.24 shows the refrigerant mass flow rates, measured upstream of the expansion device, for two
strategies. The cumulative refrigerant flow into the evaporator during cycle period was the same to achieve equal
capacities.

27
0
10
20
30
40
50
60
0 5 10 15 20 25 30Time [sec]
mre
f [g
/sec
]
OV
CV
Figure 3.24 Refrigerant mass flow rate into the evaporator overlaid for OV and CV
Evaporator capacity (Qe) and compressor power (Wcp) were monitored and COP was calculated for both
experiments. Table 3.2 also shows, along with on-cycle average evaporator and condenser saturation temperatures
(Tsat,e,on,avg and Tsat,c,on,avg), and cycle average evaporator metal temperatures (Tmet,e,avg). COP was only 1% lower for
OV operation due to the slightly higher compressor power during the OV experiment. Figure 3.25 and Table 3.2
show that the on-cycle average evaporator saturation temperature was slightly lower and condenser saturation
temperature slightly higher for OV operation, which increased compressor power about 1%.
Table 3.2 Experimental results compared for OV and CV operation
µ τ [sec] Wcp [W] Qe [kW] COP Tsat,e,on,avg [oC] Tsat,c,on,avg [
oC] Tmet,e,avg [oC]
CV 0.5 30 755.4 3.38 4.47 9.1 42.3 12.0
OV 0.5 30 760.1 3.37 4.43 8.8 42.6 12.2

28
0
10
20
30
40
50
0 5 10 15 20 25 30
Time [sec]
Tsa
t [o C
]
OV
CV
Evaporator
OV
CVCondenser
Figure 3.25 Evaporator and condenser saturation temperatures overlaid for OV and CV
Closer inspection of the data revealed that the 0.3 C higher on-cycle average condenser saturation
temperature is totally due to the 0.3 C warmer air temperature in the outdoor chamber during the OV experiment.
After adjusting for this experimental error it is clear that COP differences are almost negligible when off-cycles are
as short as 15 seconds. To see bigger differences between OV and CV, one would need to look at longer cycle
periods. A detailed analysis of the temperature lift degradation term for this 30-second cycle is presented for both
strategies in Appendix D.
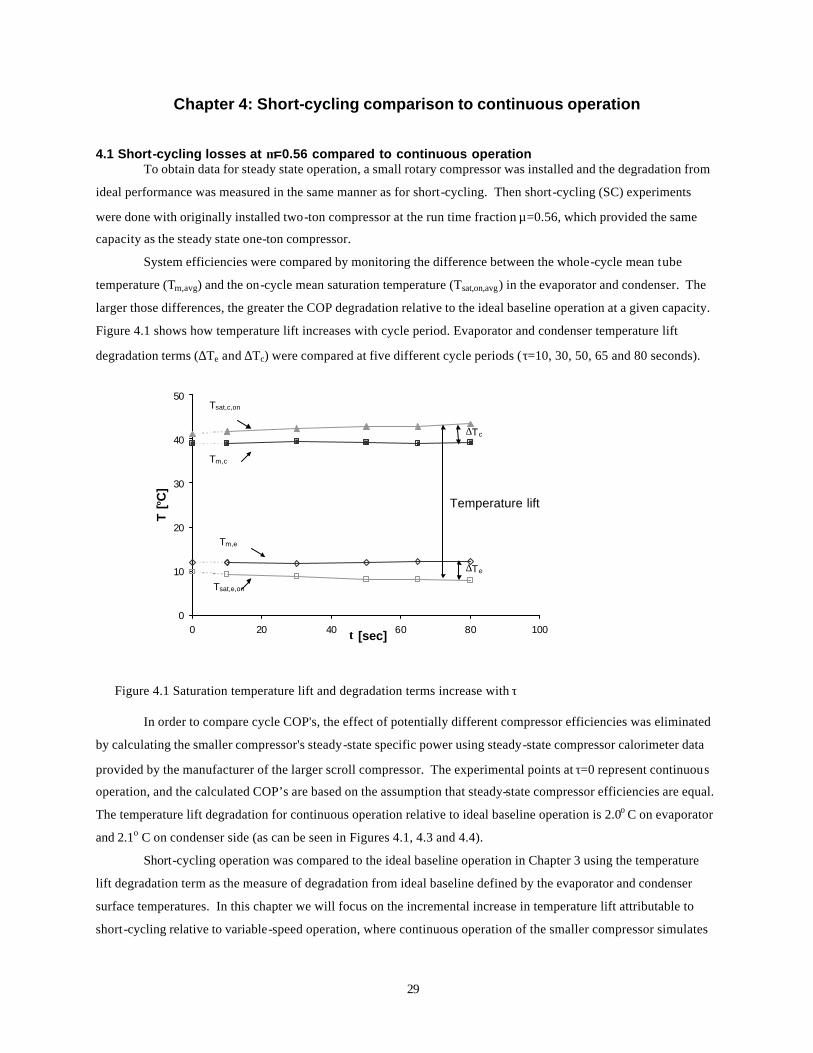
29
Chapter 4: Short-cycling comparison to continuous operation
4.1 Short-cycling losses at µ=0.56 compared to continuous operation To obtain data for steady state operation, a small rotary compressor was installed and the degradation from
ideal performance was measured in the same manner as for short-cycling. Then short-cycling (SC) experiments
were done with originally installed two-ton compressor at the run time fraction µ=0.56, which provided the same
capacity as the steady state one-ton compressor.
System efficiencies were compared by monitoring the difference between the whole-cycle mean tube
temperature (Tm,avg) and the on-cycle mean saturation temperature (Tsat,on,avg) in the evaporator and condenser. The
larger those differences, the greater the COP degradation relative to the ideal baseline operation at a given capacity.
Figure 4.1 shows how temperature lift increases with cycle period. Evaporator and condenser temperature lift
degradation terms (∆Te and ∆Tc) were compared at five different cycle periods (τ=10, 30, 50, 65 and 80 seconds).
0
10
20
30
40
50
0 20 40 60 80 100 τ [sec]
T [
o C]
Tm,e
Tsat,e,on
Tm,c
Tsat,c,on
∆Tc
∆Te
Temperature lift
Figure 4.1 Saturation temperature lift and degradation terms increase with τ
In order to compare cycle COP's, the effect of potentially different compressor efficiencies was eliminated
by calculating the smaller compressor's steady-state specific power using steady-state compressor calorimeter data
provided by the manufacturer of the larger scroll compressor. The experimental points at τ=0 represent continuous
operation, and the calculated COP’s are based on the assumption that steady-state compressor efficiencies are equal.
The temperature lift degradation for continuous operation relative to ideal baseline operation is 2.0o C on evaporator
and 2.1o C on condenser side (as can be seen in Figures 4.1, 4.3 and 4.4).
Short-cycling operation was compared to the ideal baseline operation in Chapter 3 using the temperature
lift degradation term as the measure of degradation from ideal baseline defined by the evaporator and condenser
surface temperatures. In this chapter we will focus on the incremental increase in temperature lift attributable to
short-cycling relative to variable-speed operation, where continuous operation of the smaller compressor simulates

30
theoretical variable-speed (VS) operation without inverter losses. This incremental temperature lift term is defined
as the difference between the short-cycling lift degradation term at given cycle period and variable-speed lift
degradation term, ∆Te,loss = ∆Te,sc(τ) - ∆Te,vs(τ=0). This term represents the temperature lift degradation of short-
cycling operation at given cycle period compared to the variable -speed operation at τ=0.
The lift loss term can be seen in Figures 4.3 and 4.4 as the temperature lift degradation term increases 0.7o
C on evaporator and 0.6o C on condenser side as cycle period increases from 0 to 10 seconds. Compared to
continuous operation, short-cycling at this relatively high frequency degrades COP by approximately 2.5% as shown
in Figure 4.2.
As shown in Chapter 3, this additional degradation occurred because the higher refrigerant mass flux
increased pressure drop. There was also a net increase in ∆T on refrigerant side because the increase, required by
the shorter runtime (µ<1), was not fully offset by the increase in heat transfer coefficient. Thus, requirement for a
higher on-cycle ∆T on refrigerant side, due to negligible off-cycle heat transfer rate, was dominant over the
reduction in refrigerant side ∆T caused by the decrease in the refrigerant side heat transfer resistance with a higher
refrigerant mass flux. As cycling period increased to 80 seconds, the COP degradation reached 7.5% due to the "lift
loss" of 2.3o C on evaporator and 2.1o C on condenser side shown in Figures 4.3 and 4.4.
The increase in temperature lift caused COP degradation to increase with cycle period at this dry coil
80/95o F operating condition. Similar observations for wet surface operation were described in section 3.5 of
Chapter 3, and wet and dry operation at 80/82o F is compared in Appendix C. All these results are consistent and
lead to the same general conclusions.
0
1
2
3
4
5
0 20 40 60 80 100τ [sec]
CO
P
7.5 % loss2.5 % lossVS
Figure 4.2 Coefficient of performance decrease with τ

31
0
1
2
3
4
5
0 20 40 60 80 100τ [sec]
∆Te [o
C]
∆Te,ss =2.0oC
loss(10 s) = 0.7oC
∆Te,sc
loss(80 sec) = 2.3oC
Figure 4.3 Evaporator side lift degradation term increase with τ
0
1
2
3
4
5
0 20 40 60 80 100τ [sec]
∆T
c [
o C]
loss(10 s)=0.6oC
∆Tc,sc
loss(80 s)=2.1oC
∆Tc,ss = 2.1oC
Figure 4.4 Condenser side lift degradation term increase with τ
4.2 Lift degradation terms breakdown for τ=0, 10 and 80 seconds at µ=0.56 Recall from Chapter 3 that three factors cause degradation of temperature lift: refrigerant heat transfer (rht)
resistance, pressure drop and nonlinearity due to thermal capacitance (nonlin). Figures 4.5 and 4.6 quantify these
effects for the evaporator and condenser respectively. The effect of thermal capacitance (nonlinearity of
temperature oscillations) is by definition zero for continuous operation at τ=0, and negligible for short-cycling
operation at 10 seconds. It becomes significant for evaporator at long cycle periods (τ=80 seconds), and earlier for

32
the less massive condenser. Figures 4.7 to 4.9 illustrate how these degradation terms are calculated for the
evaporator at τ=0, 10 and 80 seconds, respectively.
0
1
2
3
4
5
6∆
Te
[o C]
nonlinrhtpressure drop
τ=0 sec
τ=10 sec
τ=80 sec
Evaporator
Figure 4.5 Lift degradation term breakdown on evaporator side
0
1
2
3
4
5
6
∆T c
[oC
]
nonlinrhtpressure drop
τ=0 sec
τ=10 sec
τ=80 secCondenser
Figure 4.6 Lift degradation term breakdown on condenser side

33
4
7
10
13
16
0 2 4 6 8 10Time [sec]
T [o
C]
Tm,eTsat,e,meanTsat,e
∆Te(nonlin) = 0oC
∆Te(rht) = 1.8oC
∆Te(∆P) = 0.2oC
∆Te = 2.0oC
Figure 4.7 Evaporator degradation term for VS operation (τ=0)
4
7
10
13
16
0 2 4 6 8 10Time [sec]
T [
oC
]
Tm,eTsat,e,meanTsat,e
ON-CYCLE OFF-CYCLE
∆Te(nonlin) = 0oC
∆Te(rht) = 2.2oC
∆Te(∆P) = 0.5oC
∆Te = 2.7oC
Figure 4.8 Evaporator degradation term for SC at τ=10 sec

34
4
7
10
13
16
0 20 40 60 80Time [sec]
T [o
C]
Tsat,eTm,eTsat,e,mean
∆Te = 4.2oC
ON-CYCLE OFF-CYCLE
∆Te(nonlin) = 0.7oC
∆Te(rht) = 3.0oC
∆Te(∆P) = 0.5oC
Figure 4.9 Evaporator degradation term for SC at τ=80 sec
4.3 Lift loss for τ=10 and 80 seconds at µ=0.56 This section focuses on the incremental degradation of temperature lift due to short-cycling. Figures 4.10
and 4.11 show the detailed breakdown of this lift loss term at τ=10 and τ=80 seconds on condenser and evaporator
side. It is by definition zero for continuous operation. Recall from Figure 4.2 that this additional temperature "lift
loss" caused COP losses of about 2.5% and 7.5% at τ=10 and τ=80, respectively, compared to continuous operation.
0
1
2
3
∆T e
,loss
[o C
]
nonlinrhtpressure drop
τ=10 sec
τ=80 secEvaporator
0.4 C
0.3 C
1.3 C
0.3 C
0.7 C
Figure 4.10 Breakdown of the lift loss term on evaporator side

35
0
1
2
3
∆T c
,loss
[o C]
nonlinrhtpressure drop
τ=10 sec
τ=80 sec
Condenser
0.1 C 0.2 C
0.3 C
0.2 C
1.6 C
0.3 C
Figure 4.11 Breakdown of the lift loss term on condenser side
4.3.1 Losses due to short-cycling at τ=10 seconds Figure 4.10 and 4.11 show that losses at τ=10 seconds are caused primarily by the refrigerant side
parameters, refrigerant side heat transfer resistance and pressure drop, while the effect of thermal capacitance is
small due to the shortness of the on-cycle.
Compared to continuous operation the refrigerant side ∆T (difference between the on-cycle average metal
and mean saturation temperatures - rht) is 0.4o C and 0.1o C higher, respectively, for evaporator and condenser. The
low off-cycle refrigerant side heat transfer rate required a higher on-cycle ∆T to achieve the same capacity. The
higher on-cycle refrigerant side heat transfer coefficient only partially offset this requirement. This trade-off has
been explained in Chapter 3.
Pressure drop increased temperature lift by 0.3o C on the evaporator side and 0.2o C on the condenser side,
compared to the case of continuous operation. The reasons for this difference are apparent from Figure 4.12 for the
evaporator. Similar trends were observed on the condenser side.
0
10
20
30
40
50
0 2 4 6 8 10Time [sec]
Eva
pora
tor
pres
sure
dro
p [k
Pa]
∆Pe,on,avg = 18.7 kPa
∆Pe,vs = 8.2 kPa
Figure 4.12 Evaporator pressure drop at τ=10 sec (short-cycling) and τ=0 sec (continuous)

36
The nonlinearity of evaporator surface temperature fluctuation is negligible, and is 0.3o C on the condenser
side for this short cycle period (10 sec). However it is significant for longer cycle periods as shown in next section.
4.3.2 Losses due to short-cycling at longer cycle periods (τ=80 seconds) As expected, short-cycling losses due to pressure drop relative to continuous operation are essentially
independent of cycle period because the mass flux is the same for all cycling conditions. For τ=80 seconds, Figures
4.10 and 4.11 show that the longer cycle period losses are dominated by refrigerant side heat transfer resistance and
the nonlinearity of heat exchanger surface temperature oscillations.
The losses due to refrigerant side heat transfer were about equal at τ=10 seconds in the evaporator and
condenser. However at τ=80 seconds, the on-cycle average heat transfer resistance in the evaporator increased
much more than in the condenser. One possibility is that off-cycle heat transfer persists for short time after
compressor shut-off, which may have a significant effect at τ=10 but is clearly negligible for τ=80 seconds as shown
in Figure 4.9. A more reasonable hypothesis is that dry-out occurs over most of the evaporator during the longer
off-cycles, resulting in a lower heat transfer rate during the first part of the on-cycle. Such an effect would not be
expected in the condenser, where the walls would always be wet during the on and off-cycles, and even the normally
superheated zone would be condensing during the off-cycle. Figure 4.11 shows only a small increase in condenser
side ∆T, from 0.1o C at τ=10 to 0.3o C at τ=80 seconds, consistent with this hypothesis.
As expected, the effect of heat exchanger thermal capacitance becomes dominant as τ→80 seconds. The
on-cycle average evaporator surface temperature was 0.7o C lower than the cycle-average (Figure 4.10), and the
effect was 1.6o C in the condenser (Figure 4.11).
As expected, the temperature lift penalty due to nonlinearity was greatest on the condenser side. The
increased magnitude of metal temperature oscillations and increased exponential rate quotient, hAair/Cm, are the
causes of increased nonlinearity, as explained in section 3.4.2 of Chapter 3. The thermal capacitance of the
condenser was about equal to that of the evaporator, but its 25% higher capacity increased the magnitude of metal
temperature oscillations by the same percentage. The condenser side hAair was about 4 times greater than the
evaporator side at µ=0.56, so the correspondingly higher exponential rate quotient hAair/Cm increased metal
temperature curvature which caused higher nonlinearity. However this temperature lift penalty was more than offset
by the beneficial effect of this quadrupled hAair, which decreased temperature substantially (order of magnitude
higher beneficial effect). Therefore, maximization of hAair on condenser side is beneficial because it decreases
temperature lift by minimizing air side ∆T, even though it slightly increases nonlinearity of surface temperature
oscillations.
In summary, the refrigerant side heat transfer and pressure drop are main contributors to short-cycling
temperature lift losses at τ=10 seconds causing about 2.5% COP loss. The metal temperature nonlinearity and
refrigerant side heat transfer are primary contributors to short-cycling temperature lift losses at τ=80 seconds,
causing the largest part of 7.5% COP loss.

37
4.4 Short-cycling comparison to conventional cycling As a point of reference, Figure 4.13 shows an 11.5% COP difference (at τ=0) between continuous operation
of the small 1-ton compressor, simulating the variable -speed case, and the nominal 2-ton compressor, simulating
conventional cycling. It also shows how short-cycling reduced this loss to 2.5% and 7.5% at cycle periods of 10
seconds and 80 seconds, respectively. Of course this comparison is approximate, since it neglects cycling losses in
the CC case, and difference between blower power requirements, both of which should favor SC over CC.
0
1
2
3
4
5
0 20 40 60 80 100τ [sec]
CO
P
7.5 % loss
Conventional (long) cycling (CC)
11.5 % loss
2.5 % lossVS
Figure 4.13 COP comparison to conventional cycling

38
Chapter 5: Conclusions
5.1 Defining an ideal baseline for comparing capacity regulation methods System cooling capacity during short-cycling is regulated by changing the compressor run time fraction, µ,
for a given short cycle period τ. Short-cycling capacity regulation method tends to approach variable-speed
continuous operation, as τ→0. Experiments with an automobile a/c system showed that short-cycling COP’s are
nearly equal to variable-speed operation as long as cycle periods are not very long (5-15 sec).
The short-cycling experiments were done for a typical residential a/c system over the range of run time
fractions, and several cycle periods from τ=10 to 80 sec, in order to identify the most important factors affecting
short-cycling performance.
An “ideal” baseline system was defined as a system operating – continuously – between heat source and
sink temperatures defined by the tube temperatures of real heat exchangers, which have finite size and finite airflow
rate. Three methods of capacity regulation: conventional cycling, variable-speed, or short-cycling, were compared
to this ideal. Viewed from the air side, the requirement for sensible and latent cooling capacities to be equal for all
three systems implies that the cycle time averaged sink (evaporator) temperatures must also be equal. Since the
numerator of COP is therefore constant, the amount of degradation depends solely on the power, which in turn is a
function of on-cycle temperature lift. Therefore to compare short-cycling system efficiencies with those of ideal
system, and with other systems, we monitored the increase in temperature lift. In the evaporator and condenser, the
increase is equal to the difference between the whole -cycle mean tube temperature and the on-cycle mean saturation
(∆Te = Tm,e – Tsat,e,on and ∆Tc = Tsat,c,on - Tm,c). Analysis focused on the ways in which pulsing the flow from the
compressor affected the performance of the rest of the system. Differences in compressor efficiencies were outside
the scope of the study.
5.2 Factors affecting short-cycling COP degradation Detailed analysis of ∆Te identified the three most important factors affecting COP as capacity is modulated
by short-cycling. The lift degradation term was separated into three terms, each representing one major factor
increasing the temperature lift.
5.2.1 Refrigerant side heat transfer resistance The on-cycle refrigerant side temperature difference, ∆Tref(t)=Tm,on(t) – Tsat,on(t), was identified as one
factor increasing the average on-cycle temperature lift. This term is by definition zero for ideal baseline system.
For variable-speed system it also has a finite value degrading COP. During short-cycling, on-cycle refrigerant side
heat transfer rate was greater, by almost a factor of 1/ µ than in the case of variable -speed at the same capacity, due
to the low refrigerant side heat transfer rate during the off-cycle. However the penalty in terms of increase in on-
cycle ∆Tref did not increase by the same amount (1/µ), since the on-cycle refrigerant side heat transfer coefficient
was larger than for variable-speed. The experiments showed that the evaporator refrigerant heat transfer resistance
part of COP degradation term increased significantly at longer cycle periods. This may have been due to tube dry-
out over most of the evaporator during the longer off-cycles resulting in lower heat transfer rate during the first part
of the on-cycle. Therefore evaporators for short-cycling should be designed to minimize dry-out during longer off-

39
cycles possibly by focusing on tube orientation and circuiting. Moreover the use of microchannel tubes, with their
higher refrigerant side surface to volume ratio, may help minimize the magnitude of ∆Tref.
5.2.2 Pressure drop Since the short-cycling compressor operates at full speed, it has higher on-cycle refrigerant side pressure
drop than in the case of variable -speed. Refrigerant pressure drop increases temperature lift by ∆Tsat(∆Pref). Since
pressure drop in a crossflow heat exchanger also increases capacity, the net effect of pressure drop on system
temperature lift is approximately ∆Tsat(∆Pref/2). It was shown that this pressure drop term was almost independent
of cycle period, due to the almost constant on-cycle refrigerant mass flux resulting from the constant on-cycle
compressor speed. For the same reason, the temperature lift degradation term due to the pressure drop is also nearly
independent of run time fraction. Knowing that variable-speed systems have lower pressure drops at lower run time
fractions due to lower mass fluxes, pressure drop losses relative to variable -speed systems worsen at lower run time
fractions. The heat exchangers for short-cycling systems should be designed to operate at the optimal design
pressure drop for full speed operation.
5.2.3 Heat exchanger thermal capacitance Due to the inherently exponential nature of the heat transfer process, the evaporator metal temperature
during the off-cycle approaches the air temperature nonlinearly. The same phenomenon occurs during the on-cycle
as the evaporator surface temperature is pulled down towards the steady-state refrigerant saturation temperature. As
a result, the on-cycle average metal temperature is always less than the whole-cycle average, and this difference was
defined as the temperature lift degradation due to nonlinearity. Short-cycling truncates these processes, but the
fundamental asymmetry remains. Since the compressor sees only the lower on-cycle metal temperature, there is a
penalty in pressure lift for long cycle periods where the nonlinearities are the greatest. The curvature of the
evaporator surface temperature oscillation depends on its time constant (Cm/hAair), and the magnitude of oscillation
is inversely proportional to the evaporator’s thermal capacitance, Cm=mc. This leads to two design
recommendations for minimizing COP degradation during short-cycling: 1) heat exchangers more thermally
massive; and 2) increase hAair. The latter strategy is counterintuitive, because the lower time constant increases the
curvature of the temperature oscillations, thus increasing the temperature lift by a few tenths of a degree. However
the same increase in hAair has a beneficial effect that is an order of magnitude larger; it decreases temperature lift by
several degrees, by reducing the air side ∆T. Therefore air side heat transfer surface enhancements provide a net
benefit for short-cycling heat exchangers, as they do for a variable-speed systems.
5.2.4 Other effects Theoretical analysis showed that there are benefits in isolating the evaporator during the off-cycle, so a
solenoid valve was installed upstream of the expansion device to disable the refrigerant flow into the evaporator
during off-cycle. This operation was compared to open-valve operation which allowed off-cycle refrigerant flow
into the evaporator. An experiment conducted at 50% run time fraction and a cycle period of 30 seconds showed no
significant change in energy efficiency and saturation temperature lift. Additional experiments at longer cycle
periods are needed to measure the capacity degradation, which is expected as off-cycle pressure equalization causes

40
evaporator saturation temperature to exceed the tube temperature, thus heating the evaporator mass from the
refrigerant side.
No significant difference in the COP degradation was observed for the wet and dry coil experiments.
Virtually identical increases in on-cycle temperature lift for wet and dry coil experiments caused essentially identical
decreases in COP.
5.3 Short-cycling compared to variable-speed meeting ~1/2 of design load To compare short-cycling and continuous operation directly, a nominal 1-ton rotary compressor was
installed, and degradation from ideal baseline performance was measured in the same manner as for short-cycling.
Then short-cycling experiments were done with the originally installed two-ton compressor at the run time fraction
of 0.56. In both experiments, system capacities were the same: about 4.0 kW.
Cycle efficiencies were compared by monitoring the difference between the whole-cycle mean tube
temperature (Tm,avg) and the on-cycle mean saturation temperature (Tsat,on,avg) in the evaporator and condenser, and
neglecting differences in compressor efficiency. The focus was on the incremental increase in temperature lift
attributable to short-cycling relative to variable-speed operation, where continuous operation of the smaller
compressor represented variable-speed operation without inverter losses. The temperature lift loss term was defined
as the difference between the short-cycling lift degradation term at given cycle period and variable-speed lift
degradation term, ∆Te,loss = ∆Te,sc(τ) - ∆Te,vs(τ=0). This lift loss term increased 0.7o C in evaporator and 0.6o C in the
condenser as cycle period increased from 0 to 10 seconds. Compared to continuous operation, short-cycling at this
relatively high frequency degraded COP by approximately 2.5%. As cycling period increased to 80 seconds, the
COP degradation reached 7.5% due to temperature lift losses of 2.3o C on evaporator and 2.1o C on condenser side.
5.3.1 Losses for 10-second cycle period The relatively small cycle COP losses at τ=10 seconds, compared to continuous operation of about 2.5 %,
were caused primarily by higher refrigerant side heat transfer resistance and pressure drop. The effect of thermal
capacitance (nonlinearity of temperature oscillations) is by definition zero for continuous operation at τ=0, and
negligible for short-cycling operation at 10 seconds. The losses due to refrigerant side heat transfer resistance in the
evaporator and condenser were about equal at τ=10 seconds. The same was the case for pressure drop losses, which
were almost equal in the condenser and evaporator.
5.3.2 Losses for 80-second cycle period At longer cycle periods, short-cycling losses are dominated by refrigerant side heat transfer resistance, and
by the nonlinearity of heat exchanger surface temperature oscillations. As expected, pressure drop losses, relative to
variable-speed, were essentially independent of cycle period because the mass flux did not change. At τ=80
seconds, the refrigerant side heat transfer resistance in the evaporator increased much more than in the condenser.
This was probably due to already mentioned dry-out, which occurs over most of the evaporator during the longer
off-cycles, causing a lower heat transfer rate during the first part of the on-cycle. Such an effect is not expected in
the condenser, where the walls are always wet during the on and off-cycles, and even the normally superheated zone
condenses during the off-cycle. The effect of thermal capacitance becomes significant for evaporator at long cycle
periods (τ=80 seconds), and earlier for the condenser. The on-cycle average evaporator surface temperature was

41
0.7oC lower than the whole-cycle average, and in the condenser the effect was 1.6o C. The degradation due to
nonlinearity was greatest on condenser side since its time constant was four times higher than the evaporator. Cm
was almost the same for both heat exchangers, causing almost the same metal temperature magnitude (really slightly
higher on condenser side due to 25% higher condenser capacity).
5.4 Short-cycling compared to conventional cycling The short-cycling loss of 2.5% and 7.5% at τ=10 and 80 seconds, respectively, can be compared to the
maximum 11.5% COP loss that would occur for large τ, corresponding to conventional (long) cycling operation.
The 11.5% COP loss difference between two compressors (continuous operation of the small 1-ton simulating the
variable-speed, and the nominal 2-ton, simulating conventional cycling without cycling losses) is due mainly to the
savings on condenser side, since the requirement of keeping the constant latent/sensible ratio of ~25/75% required
maintenance of a constant evaporator surface temperature.
The experiments reported here were conducted under controlled conditions to explore the effects of short-
cycling on the rest of the system, outside the compressor. For experimental purposes a switch was used to control
the compressor, and the resulting startup power spikes were excluded from the reported results (they accounted for
up to ~10% of total energy at τ=10 sec, and ~1% at τ=80 seconds). Other short-cycling compressors use a clutch
mechanism and run the motor at lower power during the off-cycle, and therefore incur a different kind of power
penalty. Similarly, our reported comparisons to variable-speed systems neglected any speed dependence of
isentropic efficiency, and inverter losses. Such all compressor-specific parasitic power losses must be included,
along with fan and blower powers, when comparing performance of capacity-modulated systems. Isentropic
efficiency of the variable-speed compressor was assumed to be unaffected by speed.

42
References
Bahel, V., and S.M. Zubair. 1989. An assessment of inverter-driven variable-speed air-conditioners: sample performance comparison with a conventional system. ASHRAE Transactions 95(1): 455-464
Coulter, W.H., and C.W. Bullard. 1997. An experimental analysis of cycling losses in domestic refrigerator-freezers. ASHRAE Transactions 103(1): 587-596
Krause, P.E., and C.W. Bullard. 1996. Cycling and quasi-steady behavior of a refrigerator. ASHRAE Transactions 102(1): 1061-1070
Marquand, C.J., S.A. Tassou, Y.T. Wang, and D.R. Wilson. 1984. An economic comparison of a fixed speed, a two speed and a variable speed vapor compression heat pump. Applied energy 16(1): 59-66.
Mulroy, W.J., and D.A. Didion. 1985. Refrigerant migration in a split-unit air conditioner. ASHRAE Transactions 91(1A): 193-206
Murphy, W.E., and V.W. Goldschmidt. 1986. Cycling characteristics of a residential air-conditioner – modeling of shutdown transients. ASHRAE Transactions 92(1A): 186-202
Parken, W.H. Jr., R.W. Beausoliet, and G.E. Kelly. 1977. Factors affecting the performance of a residential air-to-air heat pump. ASHRAE Transactions 83(1): 839-849.
Tassou, S.A., C.J. Marquand, and D.R. Wilson. 1983. Comparison of performance of capacity controlled and conventional on/off controlled heat pump. Applied energy 14(4): 241-256.
Toshiba (UK) Limited. 1987. Toshiba inverter aided air-conditioner. Survey, United Kingdom.
Umezu, K., and S. Suma. 1984. Heat pump room air-conditioner using a variable capacity air-conditioner. ASHRAE Transaction 90(1A): 335-349.
Wang, J., and Y. Wu. 1990. Start -up and shut-down operation in a reciprocating compressor refrigeration system with capillary tubes. International Journal of Refrigeration 13(3): 187-190
Watlow Electric Manufacturing Company. 1995. SCR Power control. Book six of the Watlow Educational Series. St. Louis, United States.
Watlow Electric Manufacturing Company. 1995. Temperature control. Book five of the Watlow Educational Series. St. Louis, United States.

43
Appendix A: Short-cycling experiments on R134a mobile a/c system
A.1 Purpose The purpose of this experiment was to determine coefficient of performance (COP) for short-cycling (SC)
and variable speed (VS) capacity regulation method for several evaporator capacities (Qe) lower than the design
evaporator capacity, which was chosen to be the capacity of the continuous system operation at the compressor
speed of 1700 rpm.
A.2 Experimental setup The mobile air conditioning system in the Air Conditioning and Refrigeration Center (ACRC) at the
University of Illinois is equipped with an open scroll compressor having both clutch and compressor motor
frequency controller, enabling experiments by regulating evaporator capacity using both short-cycling (SC) and
variable speed (VS) capacity regulation method.
Condenser for experiments had micro-channel, brazed Al tube heat exchanger. Evaporator was brazed Al
plate and fin heat exchanger. Refrigerant was R134a. The system also included, suction line heat exchanger and
high-side refrigerant receiver.
The mobile air conditioning experimental facility (Nelson, 2001) was designed to allow three procedures to
determine evaporator capacity: refrigerant side, air side, and calorimetric chamber energy balance. During short-
cycling experiments, refrigerant side energy balance cannot be used due to intermittent flow and system operation.
Analyzed parameters were changed very quickly during experiments (on the order of seconds), so the chamber
balance also is not useful for short periods of time, which are on the order of a few cycle duration, due to the thermal
capacitance of the chamber. However, the chamber balance could be useful when integrated over long time periods.
The air side energy balance was used to determine evaporator capacity during the mobile a/c system experiments.
Air side evaporator capacity integrated over a cycle (Qe,avg), was calculated from the air side energy balance.
Power was calculated every 0.1 seconds by measuring compressor speed (rpm) and torque. The
compressor torque was measured during the experiments by torque meter and the compressor speed by tachometer.
A.3 Experiment description Short-cycling experiments was done at 1700 rpm. It should be mentioned that 1700 rpm was not
necessarily been optimized rpm for SC operation but arbitrarily chosen for the experiment.
The system was run at three run time fractions (µ=0.8, 0.6 and 0.35). Run time fraction µ=1 corresponds to
the baseline continuous operation for this experiment (chosen as the design, maximum capacity operation). The
baseline continuous operation (100% on) was at the compressor speed of 1700 rpm. Three cycle periods were tested
(τ=15s, 10s, and 5s) for each run time fraction.
For comparison with the variable speed capacity regulation method three additional steady-state
experiments were conducted at 1350 rpm, 1000 rpm and 700 rpm using a VS frequency controller. The baseline
continuous operation (chosen as the design, maximum capacity operation) was chosen to be at the compressor speed
of 1700 rpm.

44
All experiments were conducted with constant air inlet temperature in the evaporator of 32 C. The
condenser air inlet temperature was 38 C. Experiments were done with a dry evaporator surface to facilitate
repeatability. The air flow rates over condenser and evaporator were kept constant for all experiments ( eV& =0.129
m3/s and cV& =0.406m3/s).
A.4 Experimental results and analysis Evaporator capacity and compressor power were measured and calculated for all run time fractions and
cycle periods of short-cycling operation at 1700 rpm and shown in the top section of Table A.1. Evaporator
capacity and compressor power have been calculated for different speeds (rpm) as well, and shown in the bottom
section of Table A.1.
Table A.1 Experimental results for short-cycling and variable speed capacity regulation method
Short-cycling (1700 rpm) run time fraction µ
cycle period τ
COP W cp Q e
[s] [kW] [kW] 1 no cycles 2.32 1.42 3.30
0.8 15 n/a n/a n/a 0.6 15 3.16 0.83 2.63
0.35 15 3.90 0.49 1.92 1 no cycles 2.32 1.42 3.30
0.8 10 2.62 1.13 2.95 0.6 10 3.23 0.83 2.70
0.35 10 4.01 0.48 1.93 1 no cycles 2.32 1.42 3.30
0.8 5 2.68 1.11 2.97 0.6 5 3.19 0.83 2.65
0.35 5 4.20 0.47 1.98
rpm Variable-speed 1700 2.32 1.42 3.30 1350 2.69 1.10 2.95 1000 3.27 0.77 2.53 700 4.02 0.51 2.06
Note: the results for SC operation at µ=0.8 and τ=15 sec are not available due to errors in the experimental procedure for this experimental point.
After obtaining the evaporator capacity and the compressor power, coefficient of performance for cycle
was calculated as the ratio of the two: COP=Qe/Wcp. The coefficients of performance calculated for cycle are shown
in Figure A.1 as a function of evaporator capacity Qe. COP is shown with three lines for short-cycling, and one
bolded line for variable speed (VS) capacity regulation method. SC experimental points are connected for run time
fractions µ=1.0, 0.8, 0.6 and 0.35 at a constant cycle period (one line). There are three lines, each for different cycle
period (τ=5,10 and 15 sec). The fourth line, which is bold, connects VS experimental points obtained for 1700 rpm,

45
1350 rpm, 1000 rpm and 700 rpm. The VS point at 1700 rpm is SC experimental point at µ=1.0. The lines are
shown in Figure A.1 only to connect experimental points and emphasize a trend of increase in COP with decreasing
Qe.
In all cases, the measured efficiency (increase in COP) results from increasing the evaporating temperature
from approximately 0 C at the maximum capacity condition (3.3 kW) to about 13o C as capacity is reduced to about
2 kW. This was the effect of keeping the evaporator air flow rate constant with decreasing capacity (which will not
be the case in the residential a/c experiments).
It is obvious from Figure A.1 that coefficient of performance of VS operation is almost the same as a
coefficient of performance of SC operation for the range of capacities tested, and COP increases as capacity is
reduced. A COP decrease was expected for longer cycle periods, but these results suggest that the longest cycle
period tested (τ=15 sec) is still not long enough to degrade the system performance.
COP increase at lower capacities comes from the highest percentage decrease in compressor power than in
evaporator capacity. Figures A.2 and A.3 show, for a 10 second cycle period, that compressor power decreased by
about 65%, while the capacity decreased by only 40%, increasing COP by about 70%.
Coefficient of performance COP increases with decreasing capacity due to decreased pressure lift
(condenser and evaporator saturation pressure difference) at lower capacities. The measure of a COP increase for VS
operation is a decrease in the condenser and evaporator saturation temperature (pressure) difference (∆Tsat,vs). COP
increases at lower speeds for VS operation, since the saturation temperature difference decreases. The reason for
COP increase is in lower compressor work required for each unit of refrigerant mass compressed, when compressor
operates in between lower pressure difference (lower pressure lift). The measure of a COP increase for short-
cycling (SC) operation is a decrease in the condenser and evaporator saturation temperature (pressure) difference
during the on-cycle (∆Tsat,on,sc), not the whole cycle period. One would expect that the condenser and evaporator
saturation temperature (pressure) difference during the on-cycle for SC operation (∆Tsat,on,sc) is the same as ∆Tsat,vs
during VS operation since COP for SC and VS operation are the same. This is shown for SC at τ=10 sec and VS
operation in Figure A.4. Saturation temperatures used in Figure A.4 are shown in Table A.2.
It is also important to mention that COP of conventional cycling (CC) operation (τ~20-30 min in
residences) wouldn’t increase at lower capacities and would stay approximately constant if CC cycle losses were
neglected. The reason is in on-cycle operation between maximum saturation pressure (temperature) difference.
Thus CC on-cycle capacity and power are equal to design values while almost no heat is exchanged during off-
cycle.

46
0
1
2
3
4
1.8 2.3 2.8 3.3
Qe [kW]
CO
P
sc tau=15ssc tau=10ssc tau=5svs
µ=1
µ=0.8
µ=0.6
µ=0.35
1700 rpm
1350 rpm
1000 rpm
700 rpm
Figure A.1 Experiment results for short-cycling (SC) and variable speed (VS) capacity regulation method
0
1
2
3
1.8 2.0 2.2 2.4 2.6 2.8 3.0 3.2 3.4
Qe [kW]
Qe [
kW]
Wc
p [k
W]
Wcp,short-cycling
Wcp,variable-speed
Qe,short-cycling
Qe,variable-speed
τ=10 sec
~ 40% decrease
~ 65% decrease
Figure A.2 Change of compressor work and evaporator capacity for SC at τ=10 sec and VS

47
0
1
2
3
4
5
1.8 2.0 2.2 2.4 2.6 2.8 3.0 3.2 3.4
Qe [kW]
CO
P
COPshort-cycling
COPvariable-speed
τ=10 sec
~ 70 % increase
Figure A.3 Change of coefficient of performance of cycle for SC at τ=10 sec and VS
Table A.2 Condenser and evaporator saturation temperatures for VS and SC operation (τ=10s)
Compressor speed Q e T sat,e T sat,c rpm [kW] [C] [C] 1700 3.30 -0.5 50.6 1350 2.95 1.8 49.1 1000 2.53 4.7 47.1 700 2.06 8.9 45.0
run time fraction µ
cycle period τ
Q e T sat,e,on T sat,c,on
[s] [kW] [C] [C] 1 10 3.30 -0.5 50.6
0.8 10 2.97 2.1 49.3 0.6 10 2.71 5.1 47.3
0.35 10 1.95 10.1 44.4

48
-5
5
15
25
35
45
55
1.5 2.0 2.5 3.0 3.5
Qe [kW]
T [C
]
Tsat,c,vs
VS
Tsat,e,vsVS
Tsat,e,on,sc
SC
Tsat,c,on,sc
SC
Figure A.4 Saturation temperatures averaged over on-cycle for VS and SC
A change in evaporator and condenser saturation temperatures during two cycles of short-cycling operation
is shown in Figure A.5 for µ=0.35 and τ=10 sec. Constant saturation temperatures integrated over whole cycle
period, and integrated over only on-cycle are shown by using straight lines.
-10
0
10
20
30
40
50
60
0 5 10 15 20t [s]
Tsa
t [C
]
Tsat,e,avg
Tsat,e,on,avg
Tsat,c,avg
Tsat,c,on,avg
µ=0.35 and τ=10 secCondenser
Evaporator
Figure A.5 Change in evaporator and condenser saturation temperatures for two cycles of short-cycling operation at µ=0.35 and τ=10 sec

49
Change in evaporator and condenser saturation temperatures for two cycles (τ=10 seconds cycle period) is shown
for run time fractions µ=0.8, 0.6 and 0.35 in Figure A.6. Straight lines represent integrated values of the
corresponding saturation temperatures over the on-cycle only, since these integrated temperatures, serve as a
measure of COP increase. It is obvious that the system was operating at the lowest on-cycle saturation temperature
difference for the smallest µ=0.35, resulting in the highest efficiency (COPcyc). Furthermore, the efficiency was
almost the same as the efficiency of VS operation providing the same capacity, due to establishing almost the same
integrated condenser and evaporator saturation temperature during on-cycle as the condenser and evaporator
saturation temperature during VS operation. The main reason for this is in using heat exchangers during the off-
cycle, which can be seen by comparing the air inlet temperature (32 C) and refrigerant temperature during the off-
cycle in Figure A.6 for different run time fractions.
-10
0
10
20
30
40
50
60
0 5 10 15 20Time [sec]
T sat
[C
]
µ=0.8
µ=0.6
µ=0.35
µ=0.8
µ=0.6
µ=0.35
Condenser
Evaporator
τ=10 sec
Figure A.6 Change in evaporator and condenser saturation temperatures for two cycles (τ=10 seconds) for run time fractions µ=0.8, 0.6 and 0.35
A.5 Conclusions It can be concluded that energy efficiency of short-cycling (SC) operation can be almost the same as energy
efficiency of variable speed operation (VS) for the mobile a/c system experimented under conditions explained in
previous paragraphs and cycle period of 15 seconds. The measure of an energy efficiency increase for variable
speed (VS) operation (at lower capacities) is a decrease in condenser and evaporator saturation temperature
(pressure) difference (∆Tsat,vs). The capacity of a/c system could be regulated by short-cycling (SC) method with the
same energy efficiency as by VS method if the integrated condenser and evaporator saturation temperature
(pressure) difference over the on-cycle (∆Tsat,on,sc) is the same as the condenser and evaporator saturation
temperature (pressure) difference during VS operation. The main reason for establishing lower saturation
temperature difference (∆Tsat,on,sc ) is in using heat exchangers during the off-cycle. Heat exchangers are used

50
effectively for the cycle periods experimented in analyzed experiment. One could expect ∆Tsat,on,sc increase (for the
same required capacity) with increasing cycle period to be on the order of minutes. When ∆Tsat,on,sc increases for the
same required capacity, COP decreases (for required capacity) since higher compressor work is required for each
unit of refrigerant mass compressed during the on-cycle.

51
Appendix B: Experimental setup for residential a/c system
B.1 A/C refrigeration loop and components The main components of a residential air conditioning system tested are condenser, evaporator, compressor
and expansion valve (Figure B.1). Heat exchangers (condenser and evaporator) were taken from a two-ton R-22
unitary rooftop air conditioning system (Trane model TCH024100A). Heat exchangers for this system are made of
copper tubing and plate fins. The heat exchangers were not modified from Trane’s original unitary a/c design in any
way, but compressor, piping and expansion device were.
The system contains Copeland 2-ton hermetic scroll compressor (model ZR22K3-TF5) with added
dynamic valve so the discharge plenum would not equalize with suction during off-cycle time of short-cycling
operation. Compressor is connected to a timer, which controls lengths of on and off compressor operation during
short-cycling.
The system has a manually adjusted expansion device instead of the TXV, which was installed in Trane’s
original unitary a/c. The experiments with a TXV showed significant TXV lags and unrepeatable saturation
temperature fluctuation, which made accurate averaging over a cycle impossible. Therefore, the experiments were
done by using the expansion valve, which had manually adjusted opening for each test. The solenoid valve was
installed in series with the expansion device. While in operation, the solenoid valve was fully closed simultaneously
with compressor shut-off in order to disable the refrigerant flow into the evaporator during the off-cycle of
compressor operation.
In addition to the main components of the a/c system loop, a receiver was installed at the exit of the
condenser (high side). The system is designed to enable liquid flow into the evaporator during the entire off-cycle,
by using the receiver holding enough liquid refrigerant to last during entire off-cycle of up to 40 seconds.

52
Mg
Cp.
Rec.
Heatercontroller
Evap
Tcro
Cond.
Tcpri
Tcai
Tcpsh
Tgo
Tgi
Heater controller
Wccf+ch
Wcf
WcpCompressorController
Tcchi Tccho
Mr
Tcri
SV
EV
Tero
∆Per
TemetTeao
Teai
Gecw
Techi Techo
Tdpeai
Nozzle
Hea
ter
Cooler
Blower
Weh
SpeedController
Wem
∆Pena
Tena
Tsti
3
4
1
6
8
10
12
13
15
16
17
18 19
20 21
22
24
23
25
26
28
29
14
30
31
32
33
34
MV
stv
∆Pcr9
Pevi2
Tevi
Pero
Pcpro7
11
Heater
5
Fan
SV - solenoid valveEV - expansion valve
stv - steam sol. valveMV - manual valve
Tcmet27
Figure B.1 Residential a/c facility for short-cycling

Table B.1 Short-cycling parameters and instruments used for measurements
Symbol Number Measurement Instrument Brand Range Accuracy Description/Location
Mr 1 Mass flow rateModel D25 mass flow meter
Micro Motion 0 to 680 kg/h+/- 0.15% of reading
Refrigerant mass flow rate (expansion device inlet)
Pevi 2 Pressure Model TJE pressure transducer
Sensotec 0 to 500 psia +/- 0.1% FS Expansion valve refrigerant inlet pressure
∆Per 3 Pressure drop Model Z differential pressure transducer
Sensotec 0 to 50 psid +/- 0.25% FS Evaporator refrigerant pressure drop
Tero 4 Temperature T type thermocouple probe (Model GTMQSS)
Omega -200 to 350 C +/- 0.1oCEvaporator refrigerant outlet temperature
Pero 5 Pressure Model 280E pressure transducer
Setra 0 to 500 psia +/- 0.11% FS Evaporator refrigerant outlet pressure
Tcpri 6 Temperature T type thermocouple probe (Model GTMQSS)
Omega -200 to 350 C +/- 0.1oCCompressor refrigerant inlet temperature
Pcpro 7 Pressure Model 280E pressure transducer
Setra 0 to 500 psia +/- 0.1% FS Compressor refrigerant outlet pressure
Tcri 8 Temperature T type thermocouple probe (Model GTMQSS)
Omega -200 to 350 C +/- 0.1oCCondenser refrigerant inlet temperature
∆Pcr 9 Pressure drop Model Z differential pressure transducer
Sensotec 0 to 50 psid +/- 0.25% FS Condenser refrigerant pressure drop
Tcro 10 Temperature T type thermocouple probe (Model GTMQSS)
Omega -200 to 350 C +/- 0.1oCCondenser refrigerant outlet temperature
Tevi 11 Temperature T type thermocouple probe (Model GTMQSS)
Omega -200 to 350 C +/- 0.1oCExpansion valve refrigerant inlet temperature
Teai 12 Temperature T type welded thermocouple
Omega -200 to 350 C +/- 0.1oCEvaporator air inlet temperature
Teao 13 Temperature T type welded thermocouple
Omega -200 to 350 C +/- 0.1oCEvaporator air outlet temp. (10 t/c's on a probe)
Tdpeai 14 Dew point Model D-2 chilled mirror dew point sensor
General Eastern -35 to 25 C +/- 0.2oCEvaporator air inlet dew point
∆Pena 15 Pressure drop Model 239 pressure transducer
Setra 0 to 1" water +/- 0.4% FS Air pressure drop across the nozzle
Tena 16 Temperature T type welded thermocouple
Omega -200 to 350 C +/- 0.1oCEvaporator air exit temperature at the nozzle
Tcai 17 Temperature T type welded thermocouple
Omega -200 to 350 C +/- 0.1oCCondenser air inlet temperature
53
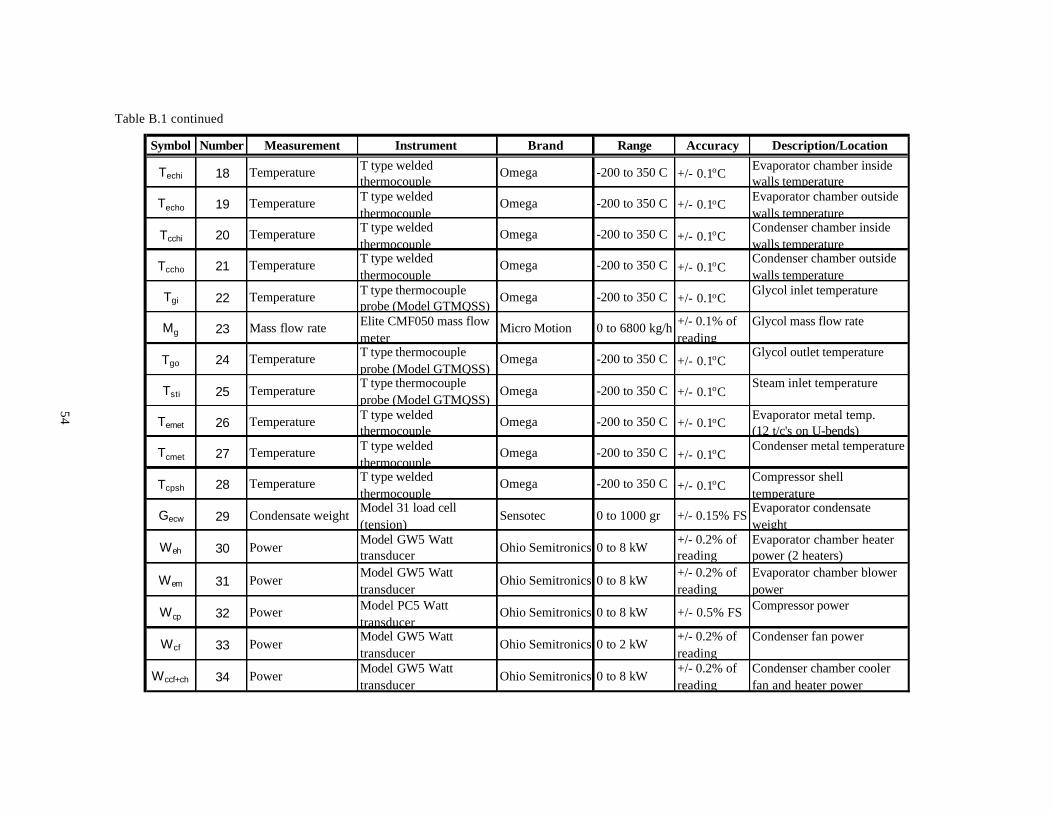
Table B.1 continued
Symbol Number Measurement Instrument Brand Range Accuracy Description/Location
Techi 18 Temperature T type welded thermocouple
Omega -200 to 350 C +/- 0.1oCEvaporator chamber inside walls temperature
Techo 19 Temperature T type welded thermocouple
Omega -200 to 350 C +/- 0.1oCEvaporator chamber outside walls temperature
Tcchi 20 Temperature T type welded thermocouple
Omega -200 to 350 C +/- 0.1oCCondenser chamber inside walls temperature
Tccho 21 Temperature T type welded thermocouple
Omega -200 to 350 C +/- 0.1oCCondenser chamber outside walls temperature
Tgi 22 Temperature T type thermocouple probe (Model GTMQSS)
Omega -200 to 350 C +/- 0.1oCGlycol inlet temperature
Mg 23 Mass flow rate Elite CMF050 mass flow meter
Micro Motion 0 to 6800 kg/h +/- 0.1% of reading
Glycol mass flow rate
Tgo 24 Temperature T type thermocouple probe (Model GTMQSS)
Omega -200 to 350 C +/- 0.1oCGlycol outlet temperature
Tsti 25 TemperatureT type thermocouple probe (Model GTMQSS)
Omega -200 to 350 C +/- 0.1oCSteam inlet temperature
Temet 26 Temperature T type welded thermocouple
Omega -200 to 350 C +/- 0.1oCEvaporator metal temp. (12 t/c's on U-bends)
Tcmet 27 Temperature T type welded thermocouple
Omega -200 to 350 C +/- 0.1oCCondenser metal temperature
Tcpsh 28 Temperature T type welded thermocouple
Omega -200 to 350 C +/- 0.1oCCompressor shell temperature
Gecw 29 Condensate weightModel 31 load cell (tension)
Sensotec 0 to 1000 gr +/- 0.15% FSEvaporator condensate weight
Weh 30 PowerModel GW5 Watt transducer
Ohio Semitronics 0 to 8 kW+/- 0.2% of reading
Evaporator chamber heater power (2 heaters)
Wem 31 PowerModel GW5 Watt transducer
Ohio Semitronics 0 to 8 kW+/- 0.2% of reading
Evaporator chamber blower power
Wcp 32 Power Model PC5 Watt transducer
Ohio Semitronics 0 to 8 kW +/- 0.5% FS Compressor power
Wcf 33 PowerModel GW5 Watt transducer
Ohio Semitronics 0 to 2 kW+/- 0.2% of reading
Condenser fan power
Wccf+ch 34 PowerModel GW5 Watt transducer
Ohio Semitronics 0 to 8 kW+/- 0.2% of reading
Condenser chamber cooler fan and heater power
54

55
B.2 Environmental chambers and evaporator wind tunnel The environmental chambers are constructed of 4-inch, class 1, urethane panels with galvanized stucco
embossed on interior and exterior of the panels
2.1 (W) x 4.6 (L) x 2.5 (H) m for the evaporator chamber, and 1.8 (W) x 3.7 (L) x 2.5 (H) m for the
condenser chamber. The chambers have one thermocouple located on the inside and outside of the walls, floor and
ceiling. The temperatures yield a temperature drop across each wall, which is used to find transmission losses.
The evaporator is installed in the duct, which is positioned in the evaporator chamber. Air from the
chamber is circulated through the duct and over the evaporator using a Dayton evaporator air blower. The
evaporator air blower is not installed from the Trane’s unitary system due to a need for experiments with changed air
flow rates over evaporator. Changing air flow rate over evaporator is possible by using blower frequency controller
which changes a frequency of 3-phase air blower motor (Trane’s blower was single phase). Air flow rate and the
evaporator air temperature difference are measured during the experiments. In order to calculate air flow rate, a
Helander 6 inch nozzle is installed in the duct and connected to the low range differential air pressure transducer
measuring air pressure drop through the nozzle (∆Pena). Discussion about measured parameters will be presented in
section B.3, and the complete list of all measured parameters in Table B.1. A nozzle is positioned about 1 meter
downstream of the evaporator, and the nozzle temperature, measured by a T thermocouple. positioned in the throat
of the nozzle, is used as the measure of evaporator air exit temperature (Tena). Two Marley 3.2 kW heaters are
installed in the evaporator chamber for maintaining constant temperature in the chamber. Generally, this evaporator
chamber temperature, is the same which is measured at the inlet of the evaporator (Teai is kept constant for each
experiment). One of the two heaters has manual on/off control while the other one is connected to Watlow SCR
heater power controller and Watlow microprocessor-based PID controller providing continuous change in power
requirement depending on the temperature sensor reading. More detailed explanation of the system of chamber air
(evaporator inlet) temperature control will be presented in section B.3.1.2.1.
The condenser and condenser fan from the Trane’s unitary system are put in a condenser chamber and not
in a duct. Air is sucked through the condenser and exits through the condenser fan, towards the ceiling where a Bohn
cooling coil is installed to maintain constant temperature in the outdoor chamber. Glycol entering the chamber at
6oC is circulated from a central chiller in the building. Three PID controlled Vulcan trim heaters (3 x 0.7 kW), are
installed between exit of the condenser and inlet to the cooler, for the purpose of easier maintenance of the constant
air temperature in the condenser chamber. The temperature at the inlet of the condenser (Tcai), is measured by a T
type thermocouple and kept at constant value.
B.3 Measured parameters The most important parameters to monitor during short-cycling operation are those needed for calculation
of COP. In addition, the purpose of experiments is not only in calculating COP, but also trying to understand system
parameters, which influence degradation or improvement of system COP. Therefore, much more parameters were
monitored than needed for only calculation of COP. See Table B.1 for complete list of measured parameters and
information about instruments used for measurements, and Figure B.1 for instrument locations. Absolute pressure

56
transducers were used to measure a pressure at the evaporator exit, the condenser inlet, the expansion device inlet
and differential pressure transducer to measure pressure drop through the condenser and the evaporator.
The air and refrigerant mass flow rates were measured by using a mass flow meter and the nozzle, which
was installed in the duct. Coriolis type mass flow meter, consisting of sensor and transmitter was used for
measuring the refrigerant mass flow rate. Watt transducers were used to measure power of the compressor, the
blowers and the heaters. The sampling frequency of data acquisition system was consistent with width of power
pulses measured by Watt transducers as explained in next section (B.3.1)..
B.3.1 Measured parameters providing information about COP Main parameters providing information about the system performance are evaporator capacity (Qe) and
compressor power (Wcp). Qe and W cp were measured and calculated in order to obtain info rmation about coefficient
of performance (COP): COP=Qe/Wcp.
The Copeland hermetic scroll compressor power was measured by using Watt transducer. It was very
important to capture very quick changes in the compressor power measurement during short-cycling, especially
during transient periods. Installed Ohio Semitronics Watt transducer averages the reading over 0.2 seconds.
Therefore, the rate of data acquisition sampling during experiments was chosen to be about 0.2 seconds per sample
which consisted not only of the compressor power but of about additional 50 measurements. The shortest
compressor on-cycle tested was 3 seconds, for which 15 samples was obtained providing enough information for
accurate compressor power averaging included in calculation of COP.
The existing commercial implementation of the short-cycling concept has the mechanical clutch
mechanism installed in the compressor for the purpose of engaging and disengaging scrolls enabling short-cycling
without high starting currents and potential reliability risk which exist when a switch is used. A switch was used in
our experiment since our focus has been on the influence of short-cycling on the rest of the system. The high
starting currents were excluded from the analyses presented in the report. The starting currents increased the
measured power about 2.5 times during initial moments of the on-cycle; the rate of data acquisition sampling during
experiments was about 0.2 seconds per sample; the data acquisition system dwelling time on specific measurement
channel is on the order of milliseconds; however the watt transducer averages the reading over also 0.2 seconds
which suggests that the measured start-up power peak lasted about 0.2 seconds and this accounted for about 0.5 – 10
% for the longest (56 sec) and shortest (3 sec) on-cycle on-cycles respectively.
The evaporator blower power was measured by using separate Watt transducer and can be used in COP
calculation. The experimental facility was designed to provide three procedures to determine evaporator capacity:
air side, calorimetric chamber and refrigerant side energy balance. Each balance yields its own energy balance
calculation to find the capacity of the system. The air side and chamber balances are usually only available balances
during short-cycling (SC) operation. The air side balance was the only one providing the fast response needed for
detailed analysis of cycling phenomenon during all experiments.
B.3.1.1 Air energy balance Measurements of the air flow rate and enthalpies of the air at the inlet and the exit of the evaporator are
needed for determining evaporator capacity by using air energy balance. Air flow rate and the evaporator air
temperature difference are measured during the experiments. Air flow rate is known by measuring pressure drop

57
across the nozzle, knowing the enthalpies of the air at the inlet and exit of the evaporator and atmospheric pressure.
For “the wet evaporator surface” experiments, the air temperatures are used in conjunction with inlet and outlet
relative humidity to find the air enthalpies and specific heats. The relative humidity in the evaporator chamber is
maintained by setting required dew point temperature in a PID controller. The PID controller controls a solenoid
valve opening of the steam supply line, which adds a steam that covers for a water removed from the air on the
evaporator surface (the evaporator latent load). The evaporator air inlet enthalpy is determined by using the
evaporator air inlet temperature (Teai) and the evaporator air inlet dew point (Tdpeai). The evaporator air inlet
humidity is calculated by knowing inlet dew point measured by using a chilled mirror dew point meter. The
evaporator air exit enthalpy is determined by obtaining information about a condensate removal rate by the means of
a scale measuring weight of condense (Gecw). The change in weight of condensate over time yields the condensate
removal rate needed for calculation of the evaporator latent load.
B.3.1.2 Chamber energy balance To determine cooling (evaporator) capacity by the chamber energy balance, all chamber energy inputs and
outputs were measured. Two electrical heaters and the blower motor provide a sensible load. SCR heater power
controller and electronic microprocessor based PID controller control the heater power and maintain the temperature
in the chamber at constant value. Process of the temperature control in environmental chambers will be explained in
more detail in section B.3.1.2.1.
Three electrical sources going into the chambers, two electrical heaters and blower power were measured
by three separate Watt transducers. The change of state of the steam (needed for keeping constant relative humidity
in the chamber) is also a part of energy input to the chamber and can be calculated by knowing temperature and
pressure of the steam supply and condensate removal rate. The transmission losses through the evaporator chamber
walls, for a system operating at 26.7 C indoor temperature, are approximately 70 W, which is only about 1% of a
chamber energy balance during continuous operation at full speed.
B.3.1.2.1 Process of the temperature control in environmental chambers The system of temperature
control in the environmental chambers consists of:
1) Temperature sensor (T type welded thermocouple) for measuring process temperature 2) Electronic PID temperature controller (Watlow microprocessor-based Series 93 PID controller) 3) Power controller output device (Watlow DIN-a-mite SCR power controller) 4) Heater
The input is the part of the PID controller, which receives and interprets the temperature sensor
information. After interpreting the input signal, the input part of PID controller sends this information as a
temperature value to the control block of PID controller. The control block of PID controller receives the input
information and compares it to the set point temperature. It then uses a control algorithm to tell the power controller
what to do. More on control algorithm and theory of PID (proportional-integral-derivative) control can be read in
Book 5 of the Watlow Educational Series (Temperature Control).
The output of Watlow Series 93 temperature controller is continuous, variable current signal in the range of
4-20 mA, and it is called a process output. For say a 25% power requirement, an 8 mA continuous signal, [((20 - 4
mA) x 25%) + 4 mA], is sent to the power controller.

58
The PID controller’s process output (4-20mA) is connected to SCR power controller (Watlow DIN-a-mite).
Based on the value of the process output signal received, the power controller sends the appropriate amount of
power to the heater. So, depending on what the PID process output signal signals, the SCR power controller rapidly
switches the heater ON and OFF accordingly (on the order of tens of milliseconds). When the output is switching so
fast, heater life increases. The slower ON and OFF switching would cause the resistance element inside of a heater
to go through a continuous heating and cooling cycle. The large temperature swings would accelerate the oxidation
of the resistance element in a heater. SCR power controller is used in the system to reduce temperature swings of
the resistance element in heater. This switching is so fast, that the resistance element experiences very little
temperature fluctuation. A SCR power controller is made up of 3 distinct parts: the silicon controlled rectifier
(SCR), sophisticated electronics which switch the SCR ON and OFF and a heat sink to dissipate the heat a SCR
produces. The electronics use the signal from the process output to calculate how often the SCR must switch the
heater ON and OFF. The electronics then adjust load current by very rapidly switching the SCR ON and OFF.
The Watlow DIN-a-mite power controller installed in our system is a zero crossing SCR controller used to
regulate the power by using detector which detects the zero crossing of the AC voltage input and allows the SCR to
conduct starting with a zero crossing of the voltage. So, controller is always fired (switched ON) at the lowest
possible voltage - zero. Switching the SCR ON when the AC sine wave crosses zero voltage is called zero-cross
switching. This eliminates electrical noise (also known as radio frequency interference or RFI) associated with the
phase angle fired SCR controller. More can be read about both zero-cross firing and phase angle firing in Book 6 of
the Watlow Educational Series (SCR Power Control).
B.3.1.3 Refrigerant energy balance Measurements of the refrigerant mass flow rate and the evaporator inlet and exit refrigerant enthalpies are
needed for determining evaporator capacity by using refrigerant energy balance. The refrigerant mass flow rate (M r)
is measured by using the mass flow meter. The refrigerant enthalpies at the inlet and exit of the evaporator are
calculated by using measurements of temperatures and pressures at the inlet and the exit of the evaporator.
Temperatures are measured by using thermocouples. Thermocouples placed in the refrigerant loop are T-type
immersion thermocouple probes placed directly into the refrigerant flow. The Omega low noise thermocouple
probes with miniature size connectors were used, which assure high accuracy measurements, providing protection
against electrical noise. They maintain an electrical connection from the sheath of the probe, through the
connectors, all the way to instrumentation. Pressures at the inlet and exit of the evaporator are measured by using
pressure transducers. Three absolute and two differential pressure transducers are used in order to get information
about pressures at several positions in the refrigerant loop (along with inlet and exit of the evaporator). More on all
measurements, instruments and their locations can be seen in Figure B.1 and Table B.1.
B.4 Data acquisition All data is taken with Hewlett-Packard data acquisition system which used HP E1313A A/D converter.
Data acquisition software was programmed for scanning samples of about 50 parameters in 0.2 seconds. Very fast
scanning speed was needed to capture quick changes in measured parameters during short-cycling. Special 7 Hz
fixed filters capable of filtering noise on thermocouple measurements were installed since electric noise makes
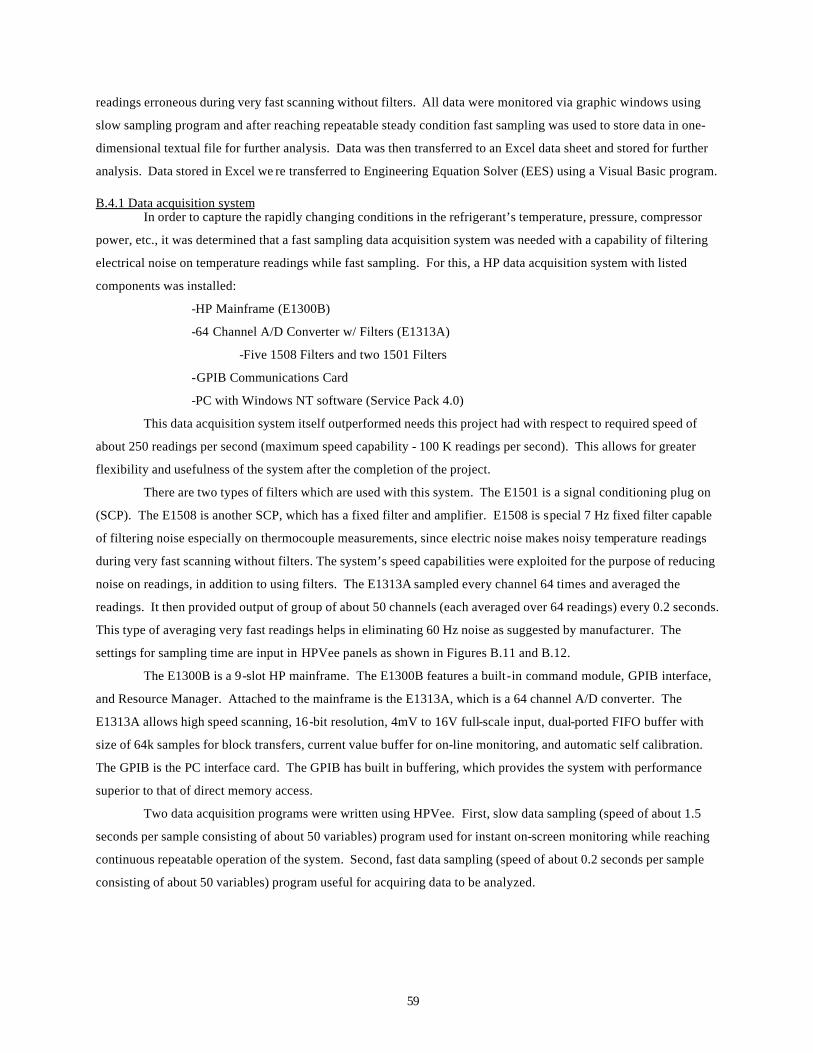
59
readings erroneous during very fast scanning without filters. All data were monitored via graphic windows using
slow sampling program and after reaching repeatable steady condition fast sampling was used to store data in one-
dimensional textual file for further analysis. Data was then transferred to an Excel data sheet and stored for further
analysis. Data stored in Excel we re transferred to Engineering Equation Solver (EES) using a Visual Basic program.
B.4.1 Data acquisition system In order to capture the rapidly changing conditions in the refrigerant’s temperature, pressure, compressor
power, etc., it was determined that a fast sampling data acquisition system was needed with a capability of filtering
electrical noise on temperature readings while fast sampling. For this, a HP data acquisition system with listed
components was installed:
-HP Mainframe (E1300B)
-64 Channel A/D Converter w/ Filters (E1313A)
-Five 1508 Filters and two 1501 Filters
-GPIB Communications Card
-PC with Windows NT software (Service Pack 4.0)
This data acquisition system itself outperformed needs this project had with respect to required speed of
about 250 readings per second (maximum speed capability - 100 K readings per second). This allows for greater
flexibility and usefulness of the system after the completion of the project.
There are two types of filters which are used with this system. The E1501 is a signal conditioning plug on
(SCP). The E1508 is another SCP, which has a fixed filter and amplifier. E1508 is special 7 Hz fixed filter capable
of filtering noise especially on thermocouple measurements, since electric noise makes noisy temperature readings
during very fast scanning without filters. The system’s speed capabilities were exploited for the purpose of reducing
noise on readings, in addition to using filters. The E1313A sampled every channel 64 times and averaged the
readings. It then provided output of group of about 50 channels (each averaged over 64 readings) every 0.2 seconds.
This type of averaging very fast readings helps in eliminating 60 Hz noise as suggested by manufacturer. The
settings for sampling time are input in HPVee panels as shown in Figures B.11 and B.12.
The E1300B is a 9-slot HP mainframe. The E1300B features a built-in command module, GPIB interface,
and Resource Manager. Attached to the mainframe is the E1313A, which is a 64 channel A/D converter. The
E1313A allows high speed scanning, 16-bit resolution, 4mV to 16V full-scale input, dual-ported FIFO buffer with
size of 64k samples for block transfers, current value buffer for on-line monitoring, and automatic self calibration.
The GPIB is the PC interface card. The GPIB has built in buffering, which provides the system with performance
superior to that of direct memory access.
Two data acquisition programs were written using HPVee. First, slow data sampling (speed of about 1.5
seconds per sample consisting of about 50 variables) program used for instant on-screen monitoring while reaching
continuous repeatable operation of the system. Second, fast data sampling (speed of about 0.2 seconds per sample
consisting of about 50 variables) program useful for acquiring data to be analyzed.

60
B.4.2 Slow data sampling for instantaneous display One of the HPVee visual program capabilities is that it enables writing programs for instant on-screen
monitoring by the means of graphical windows. For sampling at speeds slower than 1 sample per second, the
programming is rather straightforward. In this version of the sampling program, it is not very useful for acquiring
data to be analyzed. However, it is very useful to instantaneously display data when attempting to reach steady
state. Here the channels are scanned and formulas are used to convert the measurements to real time data. These
values are either viewed numerically or graphically. The program itself is documented in screen dumps for further
explanation. The screen in Figure B.2 shows the basics of the program from labeling of variables to storing the data
in the FIFO buffer. Figure B.3 shows the E1313A Direct I/O boxes (HPVee programming boxes) opened.
Figure B.2 1st slow sampling and averaging program screen shot.
These boxes set the data labels for each of the channels scanned
E1313 Direct I/O box; main part of program. This box sets channel variable types, averages channels scans between stores and sets overall scan rate
E1313A Direct I/O box, stores the data in the FIFO buffer at REAL32
Sets the trigger to immediately record data
Note program flow: data scanned, stored and then changed in formula. Here it may be viewed in alphanumeric box; then later output to plot.

61
Figure B.3 2nd Slow sampling and averaging program screen shot.
The Figure B.4 shows the bottom of the program and demonstrates how raw data can be stored to MS
Excel.
Figure B.4 3rd slow sampling and averaging program screen shot
Trigger commands once again.
Code here should be observed carefully. This box can be used to change almost any scanning action. Once familiar with this box, slow sampling can be done easily.
E1313A Direct I/O box, stores the data in the FIFO buffer at REAL32; as before.
Note: Data transfer sequence below; notice if statements and Excel outputs. This is necessary to store data rather than just “view data on the screen”.

62
Figure B.5 follows from the B.2, and shows the flow of data along the top of the program.
Figure B.5 4th slow sampling and averaging program screen shot
The screen shot shown in Figure B.6 demonstrates the final step of producing graphical view by slow
sampling program
Figure B.6 5th slow sampling and averaging program screen shot
B.4.3 Fast data sampling To samp le at speeds greater than 1 sample per second, several methods exist. However, these methods are
used to push the system to very high sampling rates (up to 100,000 readings per second). Due to the nature of this
very high sampling, the program becomes difficult. Each of these methods depends on the speed requirements of
the measurement and the noise in the system. For instance, the system can sample each channel every 15 ms,
however, if a noisy signal is present, this value may need to be held up to 16 times before it can be averaged and
output. Appendix E of the E1313A User’s Manual demonstrates 4 versions of this type of programming. A few of
these sample programs are available on the manufacturer’s website as well. However, these programs are written to
be used with the E1413A and require some heavy editing.
A method of sample and hold was used, to enhance noise reduction in the system. This method sampled
every channel 64 times and averaged the readings. It then provided output of group of about 50 channels every 0.2
seconds. The Figures B.7 to B.12 show screen dumps of the fast sampling program specifically written for this
project’s requirements, including several text boxes that explain what some formulas, loops and output scenario are
used for. Figure B.7 shows overall program and B.8 program with important text boxes opened for viewing (Note:
trigger, error, data storage loop). The panel in Figure B.9 configures the filters on each set of eight channels. The
panel in Figure B.10 designates Type-T thermocouples. The panel in Figure B11 shows sets of the channel lists to
Note flow here is from first screen shot of slow sampling.
Note data flow: here the result is output as an alphanumeric, then continues to plot on next figure.
These boxes perform “housekeeping” on the data by organizing it.
Continues data flow from above here. Final resulting
plot of refrigeration temperatures.

63
scan and their order and sets the sample timer and sets-up averaging. The panel in Figure B.12 sets-up the trigger
source and timer, which is the actual scan rate of any individual channel.
Figure B.7 1st screen shot of entire fast sampling and averaging program.
Figure B.8 2nd screen shot of fast sampling and averaging program
Alphanumeric outputs; to see that all current values are accurate.
E1313A control panel; see open views below
E1313A Direct I/O
E1313A Direct I/O
E1313A Direct I/O; output only if error
Formula box
E1313A Direct I/O for data output to file
If/Then/Else loop box
E1313A Direct I/O; output only if error
Text box sets data to REAL32, arms trigger to send data, sets first data point to initial data transmission
Sets data to be stored in FIFO buffer
Writes data in REAL32 format from CVT table and sends it in BINBLOCK form
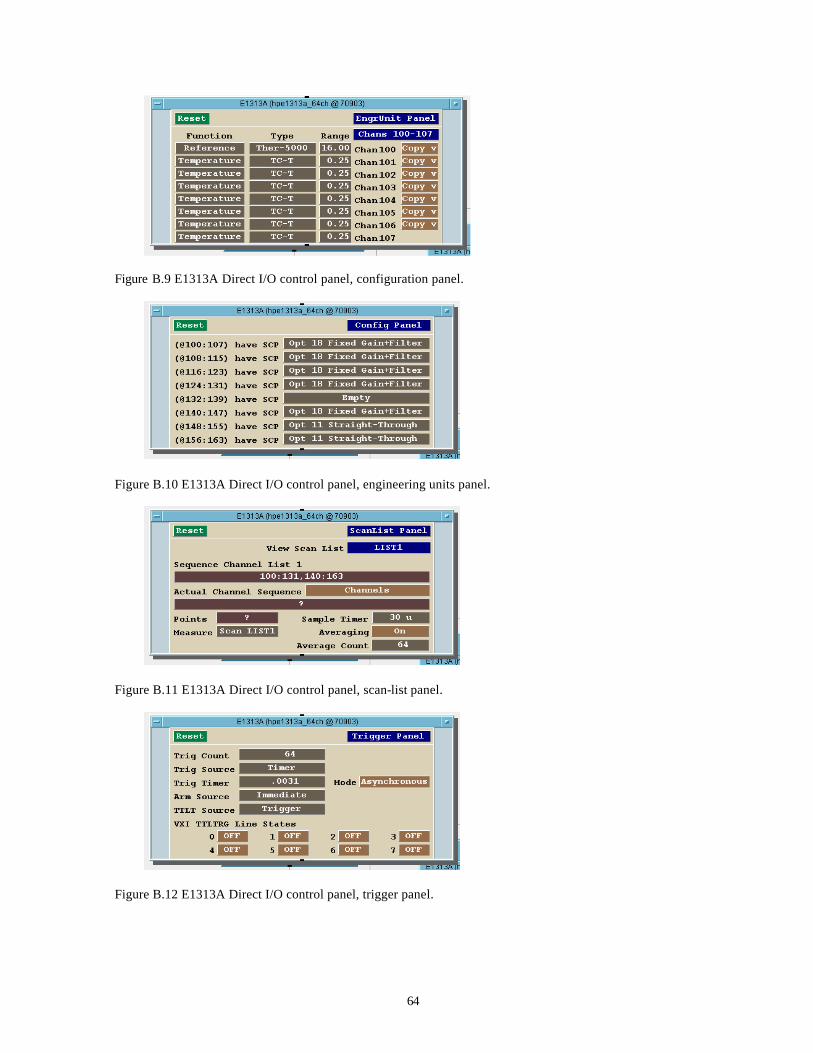
64
Figure B.9 E1313A Direct I/O control panel, configuration panel.
Figure B.10 E1313A Direct I/O control panel, engineering units panel.
Figure B.11 E1313A Direct I/O control panel, scan-list panel.
Figure B.12 E1313A Direct I/O control panel, trigger panel.

65
Appendix C: Short-cycling experiments at 26.7/27.7o C (80/82o F)
The increase of temperature lift with cycle period caused COP degradation, which was analyzed for the dry
and wet coil at 80/95o F operating condition in Chapter 3 and 4. Similar analysis for dry (section C.1) and wet
(section C.2) operation at 80/82o F will be presented in this Appendix. All results are consistent with results in
Chapter 3 and 4 and lead to the same general conclusions.
C.1 Dry coil experiments
C.1.1 Short-cycling losses at µ=0.57 compared to continuous operation System efficiencies were compared by monitoring the difference between the whole-cycle mean tube
temperature (Tm,avg) and the on-cycle mean saturation temperature (Tsat,on,avg) in the evaporator and condenser. The
larger those differences, the greater the COP degradation relative to the ideal baseline operation at a given capacity.
Figure C.1 shows how temperature lift increases with cycle period. Evaporator and condenser temperature lift
degradation terms (∆Te and ∆Tc) were compared at two different cycle periods (τ=10 and 50 seconds).
0
10
20
30
40
0 20 40 60 80 100 τ [sec]
T [o
C]
Tm,e
Tsat,e,on
Tm,c
Tsat,c,on
∆Tc
∆Te
Temperature lift
Figure C.1 Saturation temperature lift and degradation terms increase with τ
In order to compare cycle COP's the effect of potentially different compressor efficiencies was eliminated
by calculating the smaller compressor's steady-state specific power using steady-state compressor calorimeter data
provided by the manufacturer of the larger scroll compressor. The experimental points at τ=0 represent continuous
operation of the smaller compressor. The temperature lift degradation for continuous operation relative to ideal
baseline operation is 2.3o C on evaporator and 1.9o C on condenser side (as can be seen in Figures C.1, C.3 and C.4).
In the same way as in the Chapter 4 the focus in this Appendix is on the incremental increase in
temperature lift attributable to short-cycling (SC) relative to variable speed (VS) operation, where the continuous
operation of smaller compressor represents theoretical VS operation without inverter losses. This incremental
temperature lift term is defined as the difference between the short-cycling lift degradation term at given cycle

66
period and continuous operation lift degradation term, ∆Te,loss = ∆Te,sc(τ) - ∆Te,vs(τ=0). This term represents the
temperature lift degradation of short-cycling operation at given cycle period compared to the operation at τ=0.
The lift loss term can be seen in Figures C.3 and C.4 as the temperature lift degradation term increases
0.5o C on evaporator and 0.4o C on condenser side as cycle period increases from 0 to 10 seconds. Compared to
continuous operation (VS), short-cycling at this relatively high frequency degrades COP by approximately 2% as
shown in Figure C.2.
As cycling period increased to 50 seconds, the COP degradation reached about 5.5% due to the "lift loss" of
1.5o C on evaporator and 1.5o C on condenser side shown in Figures C.3 and C.4.
0
1
2
3
4
5
6
0 20 40 60 80 100τ [sec]
CO
P
5.5 % loss2 % lossVS
Figure C.2 Coefficient of performance decrease with τ
0
1
2
3
4
5
0 20 40 60 80 100τ [sec]
∆Te
[oC
]
∆Te,vs =2.3oC
loss(10 s) = 0.5oC
∆Te,sc
loss(50 sec) = 1.5oC
Figure C.3 Evaporator side lift degradation term increase with τ

67
0
1
2
3
4
5
0 20 40 60 80 100τ [sec]
∆T c
[oC
]
loss(10 s)=0.4oC
∆Tc,sc
loss(80 s)=1.5oC
∆Tc,vs = 1.9oC
Figure C.4 Condenser side lift degradation term increase with τ
C.1.2 Temperature lift degradation breakdown for τ=0, 50 seconds at µ=0.57 Recall from Chapter 3 and 4 that three factors cause degradation of temperature lift: refrigerant heat
transfer (rht) resistance, pressure drop and nonlinearity due to thermal capacitance (nonlin). Figures C.5 and C.6
quantify these effects for the evaporator and condenser respectively. The effect of thermal capacitance (nonlinearity
of temperature oscillations) is by definition zero for continuous operation at τ=0, and negligible for short-cycling
operation at 10 seconds. It becomes significant for evaporator at long cycle periods (τ=50 seconds), and earlier for
the less massive condenser.
0
1
2
3
4
5
6
∆T
e [
o C]
nonlinrhtpressure drop
τ=0 sec
τ=10 sec
τ=50 sec
Evaporator
Figure C.5 Lift degradation term breakdown on evaporator side

68
0
1
2
3
4
5
6
∆T
c [
o C]
nonlinrhtpressure drop
τ=0 sec
τ=10 sec
τ=50 secCondenser
Figure C.6 Lift degradation term breakdown on condenser side
C.1.3 Lift loss for τ=10 and 50 seconds at µ=0.57 The graphs in this section focus on the incremental degradation of temperature lift due to short-cycling.
Figures C.7 and C.8 present detailed analysis of this lift loss term at τ=10 and τ=50 seconds on condenser and
evaporator side. It is by definition zero for continuous operation. Recall from Figure C.2 that this additional
temperature "lift loss" caused COP losses of about 2% and 5.5% at τ=10 and τ=50, respectively, compared to VS
operation.
0
1
2
3
∆T
e,lo
ss [
o C]
nonlinrhtpressure drop
τ=10 sec
τ=50 sec
Evaporator
0.3oC
0.3oC
0.9oC
0.4oC
0.2oC
0oC (nonlin)
Figure C.7 Breakdown of the lift loss term on evaporator side

69
0
1
2
3
∆T
c,lo
ss [
oC
]
nonlinrhtpressure drop
τ=10 sec
τ=50 sec
Condenser
0.2oC
0.3oC
0.3oC
0.2oC
1.0oC
0oC (rht)
Figure C.8 Breakdown of the lift loss term on condenser side
C.1.4 Short-cycling comparison to conventional cycling Figure C.9 shows an 9% COP difference (at τ=0) between continuous operation of the small 1-ton
compressor simulating the variable -speed case, and the nominal 2-ton compressor, simulating conventional cycling.
It also shows how short-cycling reduced this loss (cycling relative to VS operation) to 2% and 5.5% at cycle periods
of 10 seconds and 50 seconds, respectively. As in Chapter 4 for 80/95o F operating condition, the comparison is
approximate, since it neglects cycling losses in the CC case, and difference between blower power requirements,
both of which should favor SC over CC.
0
1
2
3
4
5
6
0 20 40 60 80 100τ [sec]
CO
P
5.5 % loss
Conventional (long) cycling (CC) 9 % loss
2 % lossVS
Figure C.9 COP comparison to conventional cycling

70
C.2 Wet coil experiments at 26.7/27.7 C (80/82 F) The purpose of the wet surface exp eriments at 80/82o F was to determine whether the latent load had any
effect on COP degradation caused by short-cycling. Results presented in section 3.6 of Chapter 3 showed that there
was no significant difference in between wet and dry coil tests at 80/95o F operating condition.
Almost the same COP degradation for wet and dry experiments at the 80/82o F operating condition was
expected, since the refrigerant sees only the constant tube wall temperature, which is nearly identical for both cases.
Virtually identical increases in on-cycle temperature lift for wet and dry coil experiments caused essentially
identical decreases in COP. The experimental results showing an increase in the on-cycle temperature lift with cycle
period, for a given run time fraction were almost the same for both dry and wet coil experiments as shown in in
Figures C.1 and C.10, respectively. There is no significant difference in COP degradation observed, for the wet and
dry coil experiments, as shown in Figures C.2 and C.11.
0
10
20
30
40
0 20 40 60 80 100 τ [sec]
T [
oC
]
Tm,e
Tsat,e,on
Tm,c
Tsat,c,on
∆Tc
∆Te
Temperature lift
Figure C.10 Saturation temperature lift and degradation terms increase with τ

71
0
1
2
3
4
5
6
7
0 20 40 60 80 100τ [sec]
CO
P
11.5 % loss2 % loss
VS
6.5 % loss
Figure C.11 Coefficient of performance decrease with τ

72
APPENDIX D: Temperature lift degradation for open vs. closed valve
Table D.1 shows the three components of the evaporator lift degradation term, ∆Te, for both OV and CV
operation. For the OV strategy ∆Te was 0.5 C higher, refrigerant side heat transfer term was 0.9 C higher, and the
nonlinearity term was negative, suggesting the possibility of experimental error.
Table D.1 Lift degradation term and its components for OV and CV operation
µ τ [sec] ∆Te [oC] ∆Te(rht) [oC] ∆Te(nonlin) [oC] ∆Te(∆P) [oC]
CV 0.5 30 2.9 2.2 0.2 0.6
OV 0.5 30 3.4 3.1 -0.2 0.5
Figures D.1 and D.2 show evaporator saturation and metal temperatures for CV and OV operation respectively.
Off-cycle evaporation persisted a few seconds longer in the OV case, and the on-cycle metal temperature fluctuation
differed between two experiments. Measured on-cycle refrigerant ∆T was much higher during OV operation, due to
higher on-cycle metal temperature, not lower saturation temperature. It is possible that the valve opening was not
set properly for OV causing difficulty maintaining the no-superheat condition at the exit of evaporator. On the other
hand, the repeated transient in the superheat shown in Figure D.3 may reflect the existence of a transient or even
periodic two-phase flow regime during OV operation. Whatever the causes, the result was a higher weighted on-
cycle average metal temperature. higher ∆Te(rht), and negative ∆Te(nonlin) for the OV operation.
The pressure drop part of temperature lift degradation term was apparently not affected, as shown in Figure
D.5. The equality of refrigerant side pressure drops may seem surprising for such radically different flow
management strategies. Near the evaporator inlet the off-cycle flow velocities are obviously different. However,
most of the pressure drop in an evaporator occurs in the high-quality regions where the velocities are up to 5 times
higher than at the inlet. At the evaporator exit, refrigerant velocity is determined by the compressor, and is by
definition zero during the off-cycle for both strategies. Therefore it should be expected that the pressure drops would
be almost equal for OV and CV operation as shown in Figure D.5.

73
4
7
10
13
16
0 10 20 30
Time [sec]
T [
o C]
Tm,e
Tsat,e
CV
Figure D.1 Evaporator metal and saturation temperature for CV
4
7
10
13
16
0 10 20 30
Time [sec]
T [
o C]
Tm,e
Tsat,e
OV
Figure D.2 Evaporator metal and saturation temperature for OV

74
0
5
10
15
20
0 10 20 30
Time [sec]
T [o
C]
Tsat,e
Tref,e,out
CV
SHe
Figure D.3 Evaporator superheat for CV
0
5
10
15
20
0 10 20 30
Time [sec]
T [ o
C]
Tsat,e
Tref,e,out
OV
SHe
Figure D.4 Evaporator superheat for OV

75
-5
5
15
25
35
45
0 5 10 15 20 25 30
Time [sec]
∆P
[kP
a]
OV
CV
Figure D.5 Evaporator pressure drop overlaid for OV and CV operation
It is clear from the analysis done in section 3.6 of Chapter 3, that COP differences are almost negligible
when off-cycles are as short as 15 seconds. The conclusion was that to see bigger differences between OV and CV,
one would need to look at longer cycle periods.
The experiments at τ=80 seconds and µ=0.5 were conducted for both OV and CV operation, but the
maintenance of compressor inlet superheat at the same level for both strategies was impossible using available
expansion device and tape heater (EEV and tape heater use was explained in section 2.2 of Chapter 2). Therefore
experiments were incomparable, and better superheat management at longer cycle periods is recommended for
future tests. Ideally, fast electronic expansion device without time lags between the superheat sensor and valve
controller is recommended. Time lags in superheat response to the valve opening may be an issue as well.