effect of surfactants on the yield stress of cement paste
TRANSCRIPT
HAL Id: hal-01990783https://hal.archives-ouvertes.fr/hal-01990783
Submitted on 31 Jan 2019
HAL is a multi-disciplinary open accessarchive for the deposit and dissemination of sci-entific research documents, whether they are pub-lished or not. The documents may come fromteaching and research institutions in France orabroad, or from public or private research centers.
L’archive ouverte pluridisciplinaire HAL, estdestinée au dépôt et à la diffusion de documentsscientifiques de niveau recherche, publiés ou non,émanant des établissements d’enseignement et derecherche français ou étrangers, des laboratoirespublics ou privés.
Effect of surfactants on the yield stress of cement pasteBlandine Feneuil, Olivier Pitois
To cite this version:Blandine Feneuil, Olivier Pitois. Effect of surfactants on the yield stress of cement paste. Cement andConcrete Research, Elsevier, 2017, 100, pp.32-39. �10.1016/j.cemconres.2017.04.015�. �hal-01990783�
Contents lists available at ScienceDirect
Cement and Concrete Research
journal homepage: www.elsevier.com/locate/cemconres
Effect of surfactants on the yield stress of cement paste
Blandine Feneuil, Olivier Pitois, Nicolas Roussel*
Laboratoire Navier, UMR 8205, École des Ponts ParisTech, IFSTTAR, CNRS, UPE, Champs-sur-Marne, France
A R T I C L E I N F O
Keywords:SurfactantRheology (A)Adsorption (C)Cement paste (D)Pore solution (B)
A B S T R A C T
Although many surfactant molecules are available to produce stable aqueous foams, these molecules canstrongly interact with cement grains. We focus therefore here on the interactions between various surfactantsand cement grains in order to identify some selection criteria for surfactants dedicated to foam cementproduction. First, we check the surfactant ability to produce aqueous foam in synthetic cement pore solution.Then, we observe that most surfactants do adsorb on cement grains, inducing concentration-dependent effects onthe yield stress of cement paste. Our results suggest that, for some of these surfactants, the yield stress increasessignificantly as inter-particle hydrophobic attractive forces develop at the surface of the grains. However, abovea concentration threshold, those attractive forces sharply drop because of the formation of surface micellesacting as steric barriers between particles, which results in a strong decrease in yield stress
1. Introduction
Cement foams are promising materials. Indeed, addition of air intocement paste may offer, besides substantial material savings, improvedthermal properties. This is why, since several years, the study of aeratedcementitious materials has become an active field of research. In orderto control cement foam morphology, the destabilization mechanisms offresh cement foams, until cement hardening, must be stopped orslowed. Stabilization can be achieved by monitoring rheologicalproperties of the fresh cement paste, especially its yield stress [1–3].
Most formulations of cement foams include chemicals known assurfactants. Surfactants can either enhance air entrainment into cementpaste (air entraining agents) during fast stirring of the cement slurry, orthey can be used to create a pre-formed aqueous foam which is laterincorporated into the cement slurry. In both processes, surfactantsremain in the cement paste and may thus affect the rheological andearly age properties of the cement matrix.
Besides cement foams, surfactants can be used as air entrainingagents in frost-resistant concrete and as shrinkage reducing admix-tures [4].
In this study, we consider the interaction of surfactants with acement paste. We first investigate the effect of a synthetic pore solutionon the foaming ability of these surfactants. Then, we measure the effectof surfactant addition on the yield stress of the cement paste. Ourresults show the major role played by the amounts of surfactantadsorbed at the surface of the cement grains both on fresh cementpaste yield stress and on the hydrophobization of the cement grains.
2. Background
2.1. Surfactant molecules in cement paste
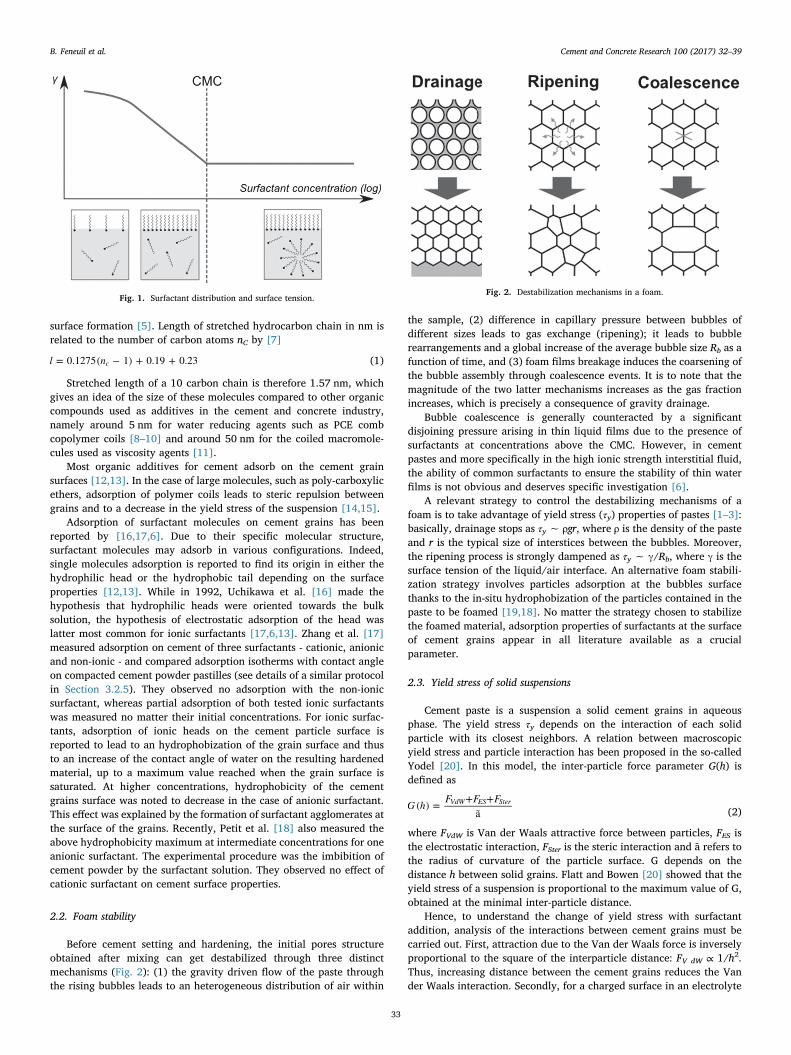
Surfactant molecules are composed of a hydrophilic head and ahydrophobic hydrocarbon tail. In aqueous solution, some surfactantmolecules adsorb at the air-water interface, with their hydrophobic tailstowards air, which reduces the liquid-air surface tension γ [5,6]. Abovethe Critical Micelle Concentration (CMC), the air-water interfacebecomes saturated with surfactant molecules while residual surfactantmolecules in bulk solution gather into elements called micelles. As aconsequence, above CMC, liquid-air surface tension does not decreaseany more with increasing surfactant concentration as shown in Fig. 1.
The hydrophilic head can either be charged (ionic surfactants) orpolar (non-ionic surfactants). Ionic surfactants are said cationic if theircharge is positive, anionic if their charge is negative and amphotericwhen their head include both types of charge [5,6]. Surfactantsenhance foam creation and foam stability through several mechanisms.First, lowering surface tension means that less energy is needed tocreate air-water interface. Then, layers of surfactant on both sides of thewater film separating two bubbles repel each other due to some stericinteractions and, in the case of ionic surfactants, some electrostaticinteraction. In addition, it was shown that micelles or other structuresinside the film may contribute to its stabilization [5]. It is worth notingthat dynamics of surfactant adsorption at air-water interface is also animportant aspect for foam generation and stability: to stabilize newlyformed interfaces, surfactant adsorption must indeed be faster than
http://dx.doi.org/10.1016/j.cemconres.2017.04.015Received 22 December 2016; Received in revised form 21 April 2017; Accepted 26 April 2017
* Corresponding author.E-mail address: [email protected] (N. Roussel).
Cement and Concrete Research 100 (2017) 32–39
0008-8846/ © 2017 Elsevier Ltd. All rights reserved.
MARK
surface formation [5]. Length of stretched hydrocarbon chain in nm isrelated to the number of carbon atoms nC by [7]
l n= 0.1275( − 1) + 0.19 + 0.23c (1)
Stretched length of a 10 carbon chain is therefore 1.57 nm, whichgives an idea of the size of these molecules compared to other organiccompounds used as additives in the cement and concrete industry,namely around 5 nm for water reducing agents such as PCE combcopolymer coils [8–10] and around 50 nm for the coiled macromole-cules used as viscosity agents [11].
Most organic additives for cement adsorb on the cement grainsurfaces [12,13]. In the case of large molecules, such as poly-carboxylicethers, adsorption of polymer coils leads to steric repulsion betweengrains and to a decrease in the yield stress of the suspension [14,15].
Adsorption of surfactant molecules on cement grains has beenreported by [16,17,6]. Due to their specific molecular structure,surfactant molecules may adsorb in various configurations. Indeed,single molecules adsorption is reported to find its origin in either thehydrophilic head or the hydrophobic tail depending on the surfaceproperties [12,13]. While in 1992, Uchikawa et al. [16] made thehypothesis that hydrophilic heads were oriented towards the bulksolution, the hypothesis of electrostatic adsorption of the head waslatter most common for ionic surfactants [17,6,13]. Zhang et al. [17]measured adsorption on cement of three surfactants - cationic, anionicand non-ionic - and compared adsorption isotherms with contact angleon compacted cement powder pastilles (see details of a similar protocolin Section 3.2.5). They observed no adsorption with the non-ionicsurfactant, whereas partial adsorption of both tested ionic surfactantswas measured no matter their initial concentrations. For ionic surfac-tants, adsorption of ionic heads on the cement particle surface isreported to lead to an hydrophobization of the grain surface and thusto an increase of the contact angle of water on the resulting hardenedmaterial, up to a maximum value reached when the grain surface issaturated. At higher concentrations, hydrophobicity of the cementgrains surface was noted to decrease in the case of anionic surfactant.This effect was explained by the formation of surfactant agglomerates atthe surface of the grains. Recently, Petit et al. [18] also measured theabove hydrophobicity maximum at intermediate concentrations for oneanionic surfactant. The experimental procedure was the imbibition ofcement powder by the surfactant solution. They observed no effect ofcationic surfactant on cement surface properties.
2.2. Foam stability
Before cement setting and hardening, the initial pores structureobtained after mixing can get destabilized through three distinctmechanisms (Fig. 2): (1) the gravity driven flow of the paste throughthe rising bubbles leads to an heterogeneous distribution of air within
the sample, (2) difference in capillary pressure between bubbles ofdifferent sizes leads to gas exchange (ripening); it leads to bubblerearrangements and a global increase of the average bubble size Rb as afunction of time, and (3) foam films breakage induces the coarsening ofthe bubble assembly through coalescence events. It is to note that themagnitude of the two latter mechanisms increases as the gas fractionincreases, which is precisely a consequence of gravity drainage.
Bubble coalescence is generally counteracted by a significantdisjoining pressure arising in thin liquid films due to the presence ofsurfactants at concentrations above the CMC. However, in cementpastes and more specifically in the high ionic strength interstitial fluid,the ability of common surfactants to ensure the stability of thin waterfilms is not obvious and deserves specific investigation [6].
A relevant strategy to control the destabilizing mechanisms of afoam is to take advantage of yield stress (τy) properties of pastes [1–3]:basically, drainage stops as τy ∼ ρgr, where ρ is the density of the pasteand r is the typical size of interstices between the bubbles. Moreover,the ripening process is strongly dampened as τy ∼ γ/Rb, where γ is thesurface tension of the liquid/air interface. An alternative foam stabili-zation strategy involves particles adsorption at the bubbles surfacethanks to the in-situ hydrophobization of the particles contained in thepaste to be foamed [19,18]. No matter the strategy chosen to stabilizethe foamed material, adsorption properties of surfactants at the surfaceof cement grains appear in all literature available as a crucialparameter.
2.3. Yield stress of solid suspensions
Cement paste is a suspension a solid cement grains in aqueousphase. The yield stress τy depends on the interaction of each solidparticle with its closest neighbors. A relation between macroscopicyield stress and particle interaction has been proposed in the so-calledYodel [20]. In this model, the inter-particle force parameter G(h) isdefined as
G h F F F( ) = + +ã
VdW ES Ster(2)
where FVdW is Van der Waals attractive force between particles, FES isthe electrostatic interaction, FSter is the steric interaction and ã refers tothe radius of curvature of the particle surface. G depends on thedistance h between solid grains. Flatt and Bowen [20] showed that theyield stress of a suspension is proportional to the maximum value of G,obtained at the minimal inter-particle distance.
Hence, to understand the change of yield stress with surfactantaddition, analysis of the interactions between cement grains must becarried out. First, attraction due to the Van der Waals force is inverselyproportional to the square of the interparticle distance: FV dW ∝ 1/h2.Thus, increasing distance between the cement grains reduces the Vander Waals interaction. Secondly, for a charged surface in an electrolyte
Fig. 1. Surfactant distribution and surface tension.Fig. 2. Destabilization mechanisms in a foam.
B. Feneuil et al. Cement and Concrete Research 100 (2017) 32–39
33
solution, the range of the electrostatic force is given by the Debyelength κ−1. The Debye length gives the thickness of the ions layerbalancing the electrostatic charge close to the solid surface. In cementpaste, the Debye length is rather small because of the high ionicity ofthe interstitial solution, i.e. κ−1 ≃ 0.7 nm [14]. Thirdly, steric interac-tion depends on the thickness of the layer of adsorbed molecules ongrains surface. Adsorbed layers on grain surfaces can hardly interpene-trate. For instance, poly-carboxylate superplasticizers are polymerswhich adsorb on cement grain surface. The layer they form is at least2.5 nm thick. If hSter is the thickness of the layer of adsorbed molecules,steric interaction imposes h ≥ 2hSter. The increase of the distancebetween the grains leads to a lowering of the attractive Van der Waalsforces and thus to fluidification of the paste.
3. Materials and methods
3.1. Materials
3.1.1. CementCement is a CEM I from Lafarge, Saint Vigor. Specific surface
provided by the manufacturer is 0.784 m2/g. Chemical composition isgiven in Table 1.
3.1.2. Synthetic cement pore solutionTo study the effects of ions from the cement paste on surfactants, a
synthetic cement pore solution is prepared by dissolving in distilledwater 1.72 g/L of CaSO4 ⋅ 2H2O, 6.959 g/L of Na2SO4, 4.757 g/L ofK2SO4 and 7.12 g/L of KOH [21].
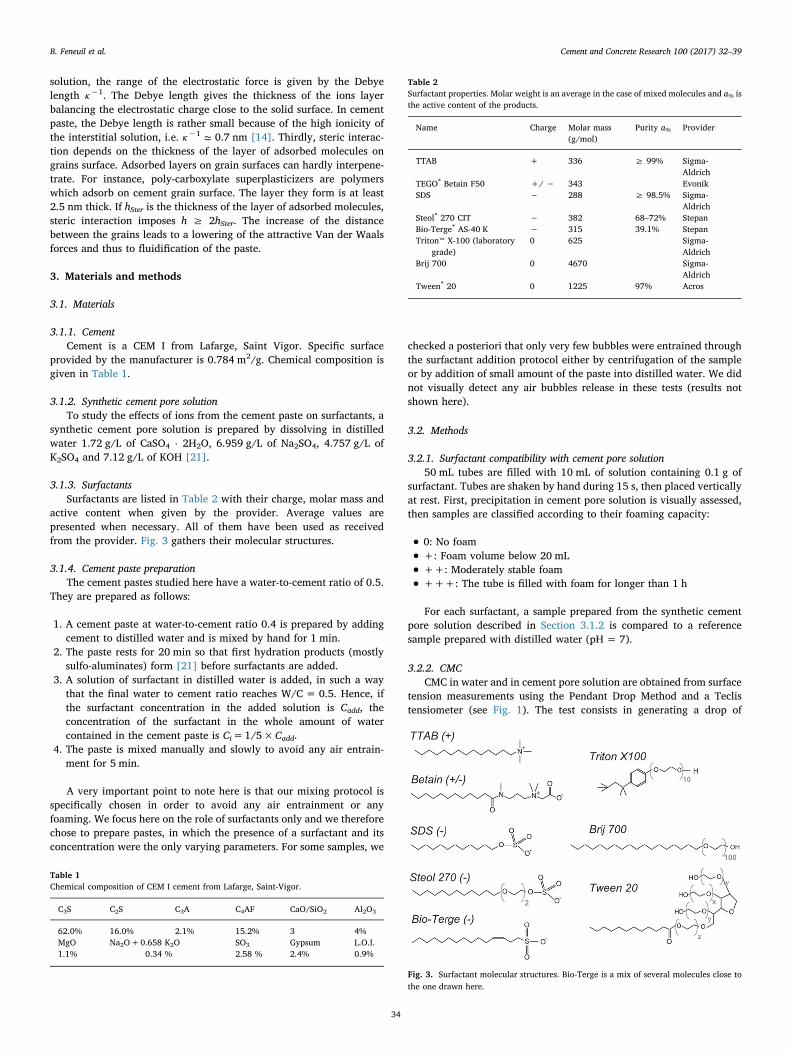
3.1.3. SurfactantsSurfactants are listed in Table 2 with their charge, molar mass and
active content when given by the provider. Average values arepresented when necessary. All of them have been used as receivedfrom the provider. Fig. 3 gathers their molecular structures.
3.1.4. Cement paste preparationThe cement pastes studied here have a water-to-cement ratio of 0.5.
They are prepared as follows:
1. A cement paste at water-to-cement ratio 0.4 is prepared by addingcement to distilled water and is mixed by hand for 1 min.
2. The paste rests for 20 min so that first hydration products (mostlysulfo-aluminates) form [21] before surfactants are added.
3. A solution of surfactant in distilled water is added, in such a waythat the final water to cement ratio reaches W/C = 0.5. Hence, ifthe surfactant concentration in the added solution is Cadd, theconcentration of the surfactant in the whole amount of watercontained in the cement paste is Ci=1/5×Cadd.
4. The paste is mixed manually and slowly to avoid any air entrain-ment for 5 min.
A very important point to note here is that our mixing protocol isspecifically chosen in order to avoid any air entrainment or anyfoaming. We focus here on the role of surfactants only and we thereforechose to prepare pastes, in which the presence of a surfactant and itsconcentration were the only varying parameters. For some samples, we
checked a posteriori that only very few bubbles were entrained throughthe surfactant addition protocol either by centrifugation of the sampleor by addition of small amount of the paste into distilled water. We didnot visually detect any air bubbles release in these tests (results notshown here).
3.2. Methods
3.2.1. Surfactant compatibility with cement pore solution50 mL tubes are filled with 10 mL of solution containing 0.1 g of
surfactant. Tubes are shaken by hand during 15 s, then placed verticallyat rest. First, precipitation in cement pore solution is visually assessed,then samples are classified according to their foaming capacity:
• 0: No foam
• +: Foam volume below 20 mL
• ++: Moderately stable foam
• +++: The tube is filled with foam for longer than 1 h
For each surfactant, a sample prepared from the synthetic cementpore solution described in Section 3.1.2 is compared to a referencesample prepared with distilled water (pH = 7).
3.2.2. CMCCMC in water and in cement pore solution are obtained from surface
tension measurements using the Pendant Drop Method and a Teclistensiometer (see Fig. 1). The test consists in generating a drop of
Table 1Chemical composition of CEM I cement from Lafarge, Saint-Vigor.
C3S C2S C3A C4AF CaO/SiO2 Al2O3
62.0% 16.0% 2.1% 15.2% 3 4%MgO Na2O+0.658 K2O SO3 Gypsum L.O.I.1.1% 0.34 % 2.58 % 2.4% 0.9%
Table 2Surfactant properties. Molar weight is an average in the case of mixed molecules and a% isthe active content of the products.
Name Charge Molar mass(g/mol)
Purity a% Provider
TTAB + 336 ≥ 99% Sigma-Aldrich
TEGO® Betain F50 +/ − 343 EvonikSDS − 288 ≥ 98.5% Sigma-
AldrichSteol® 270 CIT − 382 68–72% StepanBio-Terge® AS-40 K − 315 39.1% StepanTriton™ X-100 (laboratory
grade)0 625 Sigma-
AldrichBrij 700 0 4670 Sigma-
AldrichTween® 20 0 1225 97% Acros
Fig. 3. Surfactant molecular structures. Bio-Terge is a mix of several molecules close tothe one drawn here.
B. Feneuil et al. Cement and Concrete Research 100 (2017) 32–39
34
solution at the lower end of a vertical needle. The surface tension isthen computed from the drop profile, according to the Young-Laplaceequation.
3.2.3. Yield stressYield stress is assessed using simple spread tests. Cement paste is
poured on a horizontal flat surface. When flow stops, two perpendiculardiameters of the paste deposit are measured. The yield stress is thencomputed from the average radius R, the sample volume ω and thematerial density ρ using the following formula [22]:
τ ρgπ R
= 225 Ω128y
2
2 5 (3)
Note that Eq. (3) is valid if the thickness of the sample is smallcompared to its radius and if the surface tension effects can beneglected. The second condition writes
τ θ γR
≫ 3(1−cos )y (4)
θ is here the contact angle between the cement paste and the solidsurface. γ being smaller than the value for pure water, i.e. 70 mN/m,and R being higher than 5 cm for our tests, the second term of Eq. (4) isof the order of 0.1 Pa. Thus, all measured values computed from Eq. (3)which are below 1 Pa are taken equal to 1 Pa.
3.2.4. AdsorptionTo measure adsorption of surfactants on cement grains, we cen-
trifuge the cement paste to collect the interstitial liquid. This liquid isfiltered through a 0.45 μm polypropylene filter and analyzed with aTotal Organic Carbon analyser TOC VCSH manufactured by Shimadzu.
TOC values are converted into concentration through calibrationcurves, which have been previously identified for each surfactant. Themeasured raw value is corrected by subtracting the carbon content ofthe cement powder due to the presence of grinding aids [21]. This givesaccess to the residual concentration of surfactants in the extractedinterstitial liquid Cr. Adsorption value A in mg per gram of cement isthen calculated as follows: A=(Ci−Cr)×W/C.
It can be noted that the relative error is large for smaller residualconcentration as measured TOC values get close to the reference valuedue to grinding aid. Hence, all residual concentration values below0.01 g/L have been set to 0.01 g/L. As the smallest surfactant initialconcentration is 0.1 g/L, error on adsorption value is below 10%.
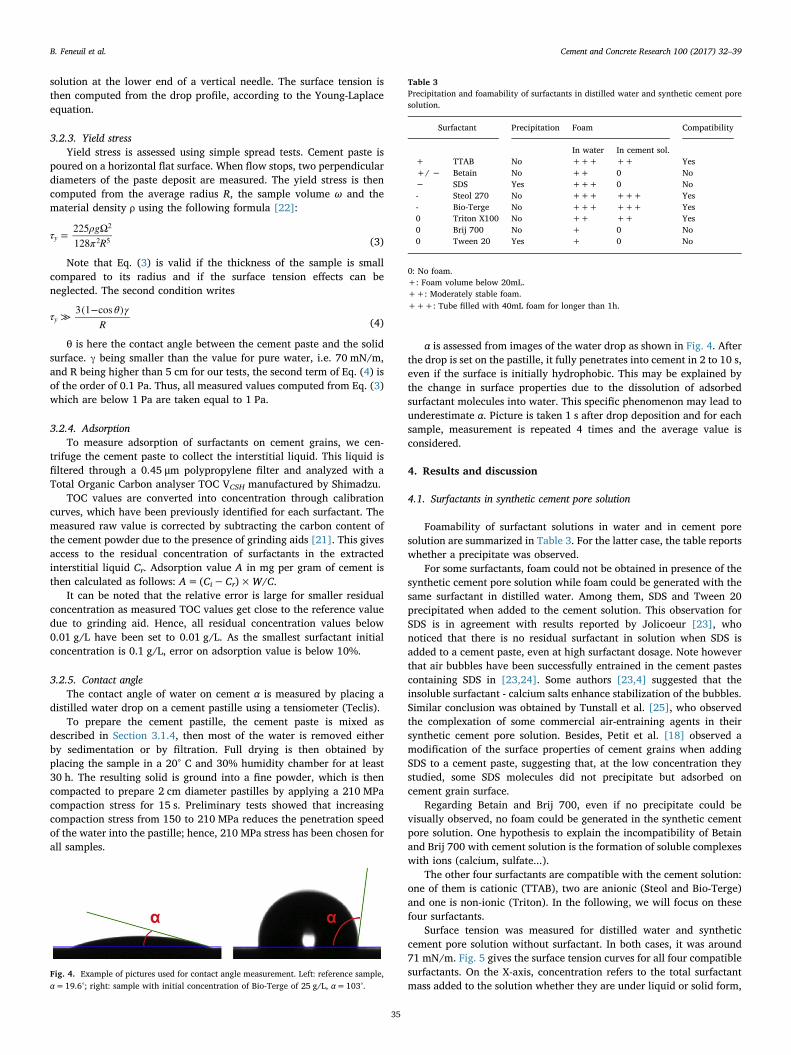
3.2.5. Contact angleThe contact angle of water on cement α is measured by placing a
distilled water drop on a cement pastille using a tensiometer (Teclis).To prepare the cement pastille, the cement paste is mixed as
described in Section 3.1.4, then most of the water is removed eitherby sedimentation or by filtration. Full drying is then obtained byplacing the sample in a 20° C and 30% humidity chamber for at least30 h. The resulting solid is ground into a fine powder, which is thencompacted to prepare 2 cm diameter pastilles by applying a 210 MPacompaction stress for 15 s. Preliminary tests showed that increasingcompaction stress from 150 to 210 MPa reduces the penetration speedof the water into the pastille; hence, 210 MPa stress has been chosen forall samples.
α is assessed from images of the water drop as shown in Fig. 4. Afterthe drop is set on the pastille, it fully penetrates into cement in 2 to 10 s,even if the surface is initially hydrophobic. This may be explained bythe change in surface properties due to the dissolution of adsorbedsurfactant molecules into water. This specific phenomenon may lead tounderestimate α. Picture is taken 1 s after drop deposition and for eachsample, measurement is repeated 4 times and the average value isconsidered.
4. Results and discussion
4.1. Surfactants in synthetic cement pore solution
Foamability of surfactant solutions in water and in cement poresolution are summarized in Table 3. For the latter case, the table reportswhether a precipitate was observed.
For some surfactants, foam could not be obtained in presence of thesynthetic cement pore solution while foam could be generated with thesame surfactant in distilled water. Among them, SDS and Tween 20precipitated when added to the cement solution. This observation forSDS is in agreement with results reported by Jolicoeur [23], whonoticed that there is no residual surfactant in solution when SDS isadded to a cement paste, even at high surfactant dosage. Note howeverthat air bubbles have been successfully entrained in the cement pastescontaining SDS in [23,24]. Some authors [23,4] suggested that theinsoluble surfactant - calcium salts enhance stabilization of the bubbles.Similar conclusion was obtained by Tunstall et al. [25], who observedthe complexation of some commercial air-entraining agents in theirsynthetic cement pore solution. Besides, Petit et al. [18] observed amodification of the surface properties of cement grains when addingSDS to a cement paste, suggesting that, at the low concentration theystudied, some SDS molecules did not precipitate but adsorbed oncement grain surface.
Regarding Betain and Brij 700, even if no precipitate could bevisually observed, no foam could be generated in the synthetic cementpore solution. One hypothesis to explain the incompatibility of Betainand Brij 700 with cement solution is the formation of soluble complexeswith ions (calcium, sulfate...).
The other four surfactants are compatible with the cement solution:one of them is cationic (TTAB), two are anionic (Steol and Bio-Terge)and one is non-ionic (Triton). In the following, we will focus on thesefour surfactants.
Surface tension was measured for distilled water and syntheticcement pore solution without surfactant. In both cases, it was around71 mN/m. Fig. 5 gives the surface tension curves for all four compatiblesurfactants. On the X-axis, concentration refers to the total surfactantmass added to the solution whether they are under liquid or solid form,
Fig. 4. Example of pictures used for contact angle measurement. Left: reference sample,α=19.6°; right: sample with initial concentration of Bio-Terge of 25 g/L, α=103°.
Table 3Precipitation and foamability of surfactants in distilled water and synthetic cement poresolution.
Surfactant Precipitation Foam Compatibility
In water In cement sol.+ TTAB No +++ ++ Yes+/ − Betain No ++ 0 No− SDS Yes +++ 0 No- Steol 270 No +++ +++ Yes- Bio-Terge No +++ +++ Yes0 Triton X100 No ++ ++ Yes0 Brij 700 No + 0 No0 Tween 20 Yes + 0 No
0: No foam.+: Foam volume below 20mL.++: Moderately stable foam.+++: Tube filled with 40mL foam for longer than 1h.
B. Feneuil et al. Cement and Concrete Research 100 (2017) 32–39
35
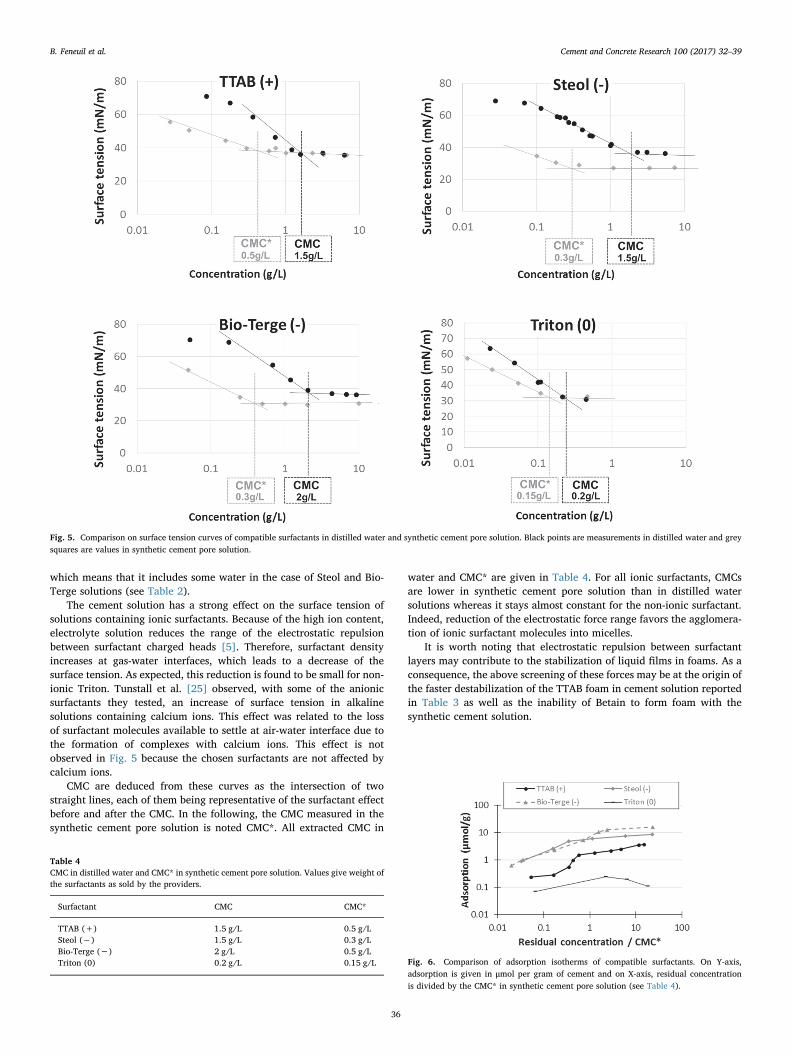
which means that it includes some water in the case of Steol and Bio-Terge solutions (see Table 2).
The cement solution has a strong effect on the surface tension ofsolutions containing ionic surfactants. Because of the high ion content,electrolyte solution reduces the range of the electrostatic repulsionbetween surfactant charged heads [5]. Therefore, surfactant densityincreases at gas-water interfaces, which leads to a decrease of thesurface tension. As expected, this reduction is found to be small for non-ionic Triton. Tunstall et al. [25] observed, with some of the anionicsurfactants they tested, an increase of surface tension in alkalinesolutions containing calcium ions. This effect was related to the lossof surfactant molecules available to settle at air-water interface due tothe formation of complexes with calcium ions. This effect is notobserved in Fig. 5 because the chosen surfactants are not affected bycalcium ions.
CMC are deduced from these curves as the intersection of twostraight lines, each of them being representative of the surfactant effectbefore and after the CMC. In the following, the CMC measured in thesynthetic cement pore solution is noted CMC*. All extracted CMC in
water and CMC* are given in Table 4. For all ionic surfactants, CMCsare lower in synthetic cement pore solution than in distilled watersolutions whereas it stays almost constant for the non-ionic surfactant.Indeed, reduction of the electrostatic force range favors the agglomera-tion of ionic surfactant molecules into micelles.
It is worth noting that electrostatic repulsion between surfactantlayers may contribute to the stabilization of liquid films in foams. As aconsequence, the above screening of these forces may be at the origin ofthe faster destabilization of the TTAB foam in cement solution reportedin Table 3 as well as the inability of Betain to form foam with thesynthetic cement solution.
Fig. 5. Comparison on surface tension curves of compatible surfactants in distilled water and synthetic cement pore solution. Black points are measurements in distilled water and greysquares are values in synthetic cement pore solution.
Table 4CMC in distilled water and CMC* in synthetic cement pore solution. Values give weight ofthe surfactants as sold by the providers.
Surfactant CMC CMC*
TTAB (+) 1.5 g/L 0.5 g/LSteol (−) 1.5 g/L 0.3 g/LBio-Terge (−) 2 g/L 0.5 g/LTriton (0) 0.2 g/L 0.15 g/L Fig. 6. Comparison of adsorption isotherms of compatible surfactants. On Y-axis,
adsorption is given in μmol per gram of cement and on X-axis, residual concentrationis divided by the CMC* in synthetic cement pore solution (see Table 4).
B. Feneuil et al. Cement and Concrete Research 100 (2017) 32–39
36
4.2. Adsorption sites and surfactant distribution
Adsorption isotherms for the four compatible surfactants are givenin Fig. 6.
First, let us note the difference of maximum adsorption for thesurfactants. Measured maximal adsorption is, for one gram of cement,4.6 mg of Steol and 13 mg of Bio-Terge, that is to say respectively8.5 μmol and 16 μmol. Maximum adsorption of TTAB is 3.7 μmol(1.3 mg) per gram of cement. As mentioned in Section 3.1.4, surfactantsare added to the cement paste 20 min after the first contact betweencement and water. At this time, solid surfaces in solution are hydro-xylate surfaces of clinker phases, mainly C3S and C2S, and firsthydration products, C-S-H, ettringite and portlandite. In high electro-lyte solution like cement pore solution, calcium ions adsorb onnegatively charged silicate surfaces (C3S, C2S, C-S-H and portlandite),resulting in positive zeta potential [26]. On the other hand, sulfate ionsadsorbed on ettringite provide for negative zeta potential [26]. Thediversity of solid surfaces accounts for the different affinities of cationicand anionic surfactants.
Very low adsorption is measured for non-ionic Triton X100 (max-imum 0.12 mg/g or 0.19 μmol/g), which is consistent with previousmeasurements of adsorption with this surfactant [17].
Isotherms of Steol, Bio-Terge and TTAB in Fig. 6 can be comparedwith adsorption isotherms of ionic surfactant from the literature. Suchadsorption has indeed been extensively studied [27–31] on silica ormetal oxides. Typical adsorption isotherm comprises four regimes(Fig. 7): (1) isolated molecules adsorb “head on” thanks to electrostaticattraction, (2) adsorption rate increases due to favorable hydrophobicinteractions with tails of previously adsorbed molecules, (3) startingfrom a residual concentration called hemimicelle concentration (HMC)surface agglomerates form by attraction of the hydrophobic tails onhydrocarbon chains of the first layer of molecules. (4) At residualconcentrations close to the CMC, adsorption reaches a plateau. Thisplateau may have two origins: first, free molecule concentration variesslowly above CMC and micelles do not adsorb on the surface [27,30](pseudophase separation model), and secondly, the solid surface maybe saturated with surface agglomerates (Fig. 7).
The above four regimes cannot be clearly identified on Steol, Bio-Terge and TTAB isotherms on Fig. 6. Main difference between cementand model systems from the literature are the diversity in potentialadsorption sites in cement paste, to which one given surfactant mayhave different affinities, making the dissociation of adsorption regimesdifficult. Though, we can observe that, for all of these three molecules, the adsorption plateau is indeed reached close to the CMC*.
Regarding cationic TTAB, at lowest concentrations, adsorption isvery low so that initial slope is close to zero and adsorption isothermhas an S-shape. S-shaped adsorption isotherms have been simulated byZhu and Gu [31] for systems where the equilibrium constant of theformation of surface agglomerates is high compared to the constantrelated to the adsorption of one molecule. In other words, in systemssimulated by Zhu et al., an adsorbed molecule hardly remains alone.This translates in a very low adsorption of single molecules at lowconcentrations and a brutal rise in adsorption as soon as concentrationallows for the formation of agglomerates.
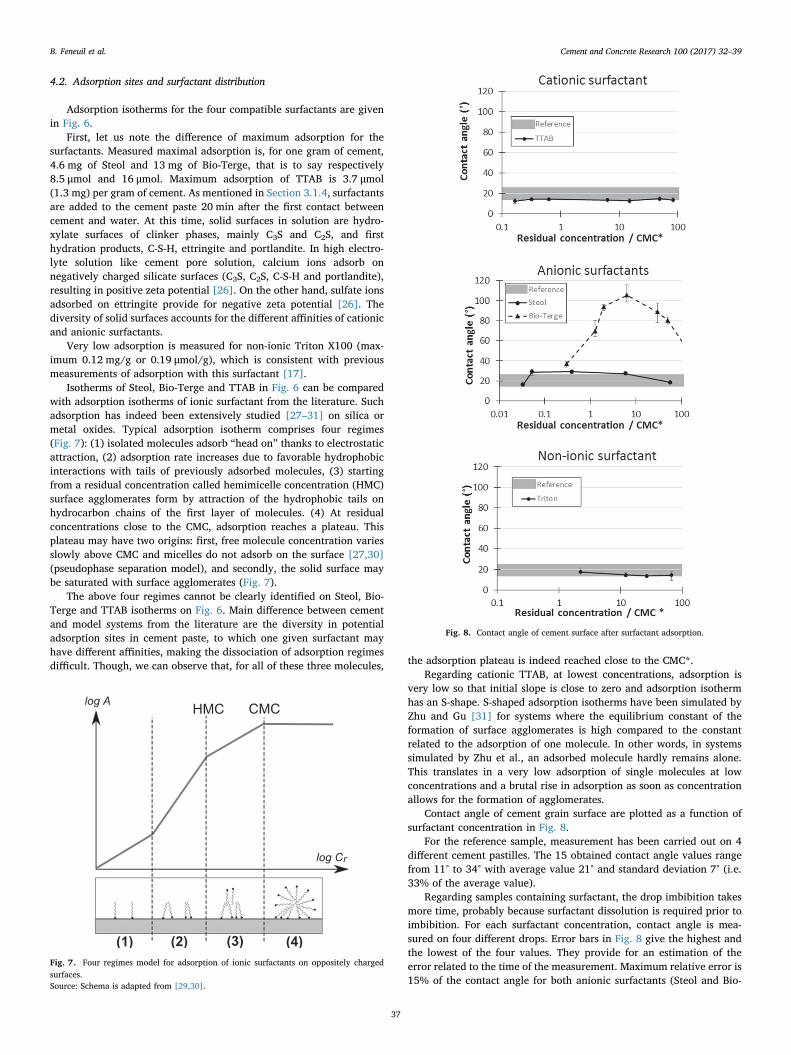
Contact angle of cement grain surface are plotted as a function ofsurfactant concentration in Fig. 8.
For the reference sample, measurement has been carried out on 4different cement pastilles. The 15 obtained contact angle values rangefrom 11° to 34° with average value 21° and standard deviation 7° (i.e.33% of the average value).
Regarding samples containing surfactant, the drop imbibition takesmore time, probably because surfactant dissolution is required prior toimbibition. For each surfactant concentration, contact angle is mea-sured on four different drops. Error bars in Fig. 8 give the highest andthe lowest of the four values. They provide for an estimation of theerror related to the time of the measurement. Maximum relative error is15% of the contact angle for both anionic surfactants (Steol and Bio-
Fig. 7. Four regimes model for adsorption of ionic surfactants on oppositely chargedsurfaces.Source: Schema is adapted from [29,30].
Fig. 8. Contact angle of cement surface after surfactant adsorption.
B. Feneuil et al. Cement and Concrete Research 100 (2017) 32–39
37
Terge), 20% for cationic TTAB and 30% for Triton. Relative errors aresmaller when surfactant adsorption is higher, which tends to show thatdrop imbibition is delayed because of the surfactant desorption time.
Anionic surfactants increased the contact angle up to a maximalcontact angle at intermediate concentrations. No change of contactangle was observed for samples containing TTAB or Triton.
Contact angle curves for anionic surfactants are consistent withprevious results from literature [17]. They confirm that surfaceagglomerates form at residual concentration close to CMC*. Indeed,contact angle increases at low concentrations indicating that a mono-layer of surfactant forms on cement grain surface. In this concentrationrange, molecules heads adsorb through electrostatic interaction andhydrocarbon chains are oriented outwards. Contact angle increases asthe number of adsorbed molecules increases. In the higher concentra-tion range, reduction of contact angle shows that orientation of theadditional molecules is opposite: hydrophilic heads are orientedtowards the solution.
Contact angle for TTAB cationic surfactant is constant. Eventually,contact angle measurement and adsorption isotherm shape both seemto show that during adsorption of TTAB, adsorbed molecules tend toagglomerate even at low concentrations while the amount of freemolecules adsorbed at low concentrations is too low to affect contactangle.
4.3. Relation between yield stress and adsorbed surfactant
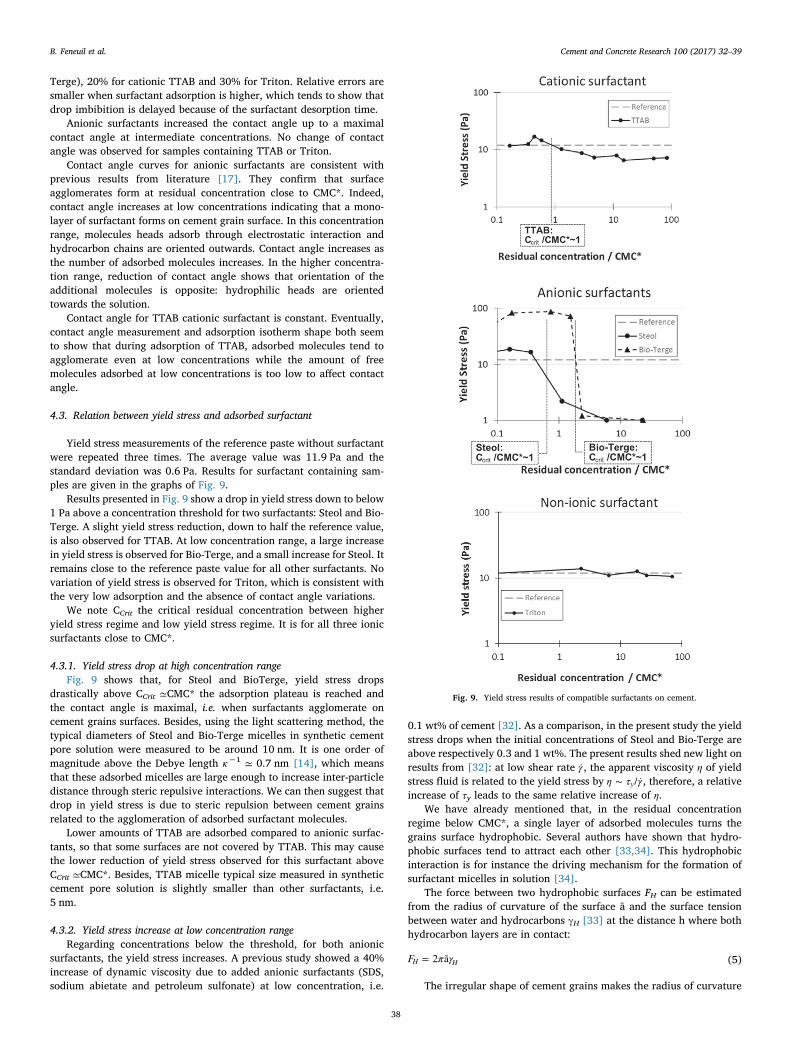
Yield stress measurements of the reference paste without surfactantwere repeated three times. The average value was 11.9 Pa and thestandard deviation was 0.6 Pa. Results for surfactant containing sam-ples are given in the graphs of Fig. 9.
Results presented in Fig. 9 show a drop in yield stress down to below1 Pa above a concentration threshold for two surfactants: Steol and Bio-Terge. A slight yield stress reduction, down to half the reference value,is also observed for TTAB. At low concentration range, a large increasein yield stress is observed for Bio-Terge, and a small increase for Steol. Itremains close to the reference paste value for all other surfactants. Novariation of yield stress is observed for Triton, which is consistent withthe very low adsorption and the absence of contact angle variations.
We note CCrit the critical residual concentration between higheryield stress regime and low yield stress regime. It is for all three ionicsurfactants close to CMC*.
4.3.1. Yield stress drop at high concentration rangeFig. 9 shows that, for Steol and BioTerge, yield stress drops
drastically above CCrit ≃CMC* the adsorption plateau is reached andthe contact angle is maximal, i.e. when surfactants agglomerate oncement grains surfaces. Besides, using the light scattering method, thetypical diameters of Steol and Bio-Terge micelles in synthetic cementpore solution were measured to be around 10 nm. It is one order ofmagnitude above the Debye length κ−1 ≃ 0.7 nm [14], which meansthat these adsorbed micelles are large enough to increase inter-particledistance through steric repulsive interactions. We can then suggest thatdrop in yield stress is due to steric repulsion between cement grainsrelated to the agglomeration of adsorbed surfactant molecules.
Lower amounts of TTAB are adsorbed compared to anionic surfac-tants, so that some surfaces are not covered by TTAB. This may causethe lower reduction of yield stress observed for this surfactant aboveCCrit ≃CMC*. Besides, TTAB micelle typical size measured in syntheticcement pore solution is slightly smaller than other surfactants, i.e.5 nm.
4.3.2. Yield stress increase at low concentration rangeRegarding concentrations below the threshold, for both anionic
surfactants, the yield stress increases. A previous study showed a 40%increase of dynamic viscosity due to added anionic surfactants (SDS,sodium abietate and petroleum sulfonate) at low concentration, i.e.
0.1 wt% of cement [32]. As a comparison, in the present study the yieldstress drops when the initial concentrations of Steol and Bio-Terge areabove respectively 0.3 and 1 wt%. The present results shed new light onresults from [32]: at low shear rate γ ,̇ the apparent viscosity η of yieldstress fluid is related to the yield stress by η τ γ∼ / ̇y , therefore, a relativeincrease of τy leads to the same relative increase of η.
We have already mentioned that, in the residual concentrationregime below CMC*, a single layer of adsorbed molecules turns thegrains surface hydrophobic. Several authors have shown that hydro-phobic surfaces tend to attract each other [33,34]. This hydrophobicinteraction is for instance the driving mechanism for the formation ofsurfactant micelles in solution [34].
The force between two hydrophobic surfaces FH can be estimatedfrom the radius of curvature of the surface ã and the surface tensionbetween water and hydrocarbons γH [33] at the distance h where bothhydrocarbon layers are in contact:
F π γ= 2 ãH H (5)
The irregular shape of cement grains makes the radius of curvature
Fig. 9. Yield stress results of compatible surfactants on cement.
B. Feneuil et al. Cement and Concrete Research 100 (2017) 32–39
38
ã difficult to estimate. Though FH can be compared with van der Waalsforce, which is also proportional to ã [33,35,20]:
⎜ ⎟⎛⎝
⎞⎠F A h
h= 1
12( ) ã
VdW 2 (6)
At separation distance of a few nanometers, Hamaker constant A(h)is close to the reference value A(0), which is of the order of magnitudeof 10−20 J in cement pastes [35]. In addition, the order of magnitude ofγH is 10−2 J/m2 [33]. The ratio of hydrophobic to van der Waalsinteractions can be roughly estimated as
F F πh γ A/ ∼ 24 / (0) ∼ 10H VdW H2 2
This shows that hydrophobic attractive interaction potentiallydominates van der Waals attractive forces between hydrophobicparticles at separation distance above h = 2 nm.
Number of carbons in hydrocarbon chains of surfactant moleculesare 12 for Steol and 14 to 16 for Bio-Terge. Estimation of their lengthwith formula (1) gives thus 1.8 nm for Steol and 2.2 nm for Bio-Terge.Either this length difference or simply the higher local hydrocarbondensity may explain why the yield stress increase is larger with Bio-Terge.
5. Conclusion
We observed in this work several distinct behaviors for surfactantswhen they are introduced into a cement paste:
1. precipitation, which in turn leads to loss of foamability of themolecule,
2. adsorption on cement grains surface and3. no interaction with cement grains.
In case (2), the surfactant noticeably affect the rheology of thecement paste. At low concentration, i.e. below a critical residualconcentration CCrit, molecules adsorb head on. Hydrophobic forcesbetween tails results in most cases in an increase of the yield stress withrespect to the surfactant-free paste. At high concentration range, aboveCCrit, the formation of large surface agglomerates is at the origin of abrutal decrease in yield stress due to steric hindrance.
To manufacture a cement foam, the low concentration regimeCr<CCrit could be promising. First, high yield stress values enhancesfoam stabilization. In addition, surfactant monolayer induces hydro-phobization of cement grains, and hydrophobic particles are known tostabilize liquid films by setting at air-water interfaces.
Acknowledgments
This work has benefited from two French government Grantsmanaged by the Agence Nationale de la Recherche [Grant numbersANR-11-LABX-022-01 and ANR-13-RMNP-0003-01]. The authors thankGéraldine Vue from Laboratoire Navier for support to make pastilles forcontact angle measurements.
References
[1] S. Guignot, S. Faure, M. Vignes-Adler, O. Pitois, Liquid and particles retention infoamed suspensions, Chem. Eng. Sci. 65 (2010) 2579–2585.
[2] I. Lesov, S. Tcholakova, N. Denkov, Factors controlling the formation and stabilityof foams used as precursors of porous materials, J. Colloid Interface Sci. 426 (2014)9–21.
[3] I. Lesov, S. Tcholakova, N. Denkov, Drying of particle-loaded foams for production
of porous materials: mechanism and theoretical modeling, RSC Adv. 4 (2014)811–823.
[4] G. Gelardi, S. Mantellato, D. Marchon, M. Palacios, R. Eberhardt, A.B. an d Flatt,Science and technology of concrete admixtures, Chemistry of Chemical Admixtures,Woodhead Publishing, 2016, pp. 149–218.
[5] I. Cantat, S. Cohen-Addad, F. Elias, F. Graner, R. Höhler, O. Pitois, F. Rouyer,A. Saint-Jalmes, Foams - Structure and Dynamics, Oxford University Press, 2013.
[6] L. Du, K. Folliard, Mechanisms of air-entrainment in concrete, Cem. Concr. Res. 35(2005) 1463–1471.
[7] B. Cabane, S. Hénon (Eds.), Liquids: Solutions, Dispersion, Émusions, Gels, Belin,2003.
[8] P. Borget, L. Galmiche, J. Le Meins, F. Lafuma, Microstructural characterisationand behaviour in different salt solutions of sodium polymethacrylate-g-PEO combcopolymers, Colloids Surf. A. Physiochem. Eng. Asp. 260 (2005) 173–182.
[9] J. Hot, H. Bessaies-Bey, C. Brumaud, M. Duc, C. Castella, N. Roussel, Adsorbingpolymers and viscosity of cement pastes, Cem. Concr. Res. 63 (2014) 12–19.
[10] G. Gelardi, N. Sanson, G. Nagy, R. Flatt, Characterization of comb-shapedcopolymers by multidetection SEC, DLS and SANS, Polymers 9 (2017) 61.
[11] C. Brumaud, H. Bessaies-Bey, C. Mohler, R. Baumann, M. Schmitz, M. Radler, N.Roussel, Cellulose ethers and water retention, Cem. Concr. Res. 53 (2013) 176–184.
[12] C. Jolicoeur, M.-A. Simard, Chemical admixture-cement interactions: phenomen-ology and physico-chemical concepts, Cem. Concr. Res. 20 (1998) 87–101.
[13] D. Marchon, S. Mantellato, R. Eberhardt, A.B. an d Flatt, Science and technology ofconcrete admixtures, Adsorption of Chemical Admixtures, Woodhead Publishing,2016, pp. 219–256.
[14] R. Flatt, I. Schober, Understanding the rheology of concrete, Superplasticizer andthe Rheology of Concrete, Woodhead publishing, 2012, pp. 144–208.
[15] A. Perrot, T. Lecompte, H. Khelifi, C. Brumaud, J. Hot, N. Roussel, Yield stressand bleeding of fresh cement pastes, Cem. Concr. Res. 42 (2012) 937–944.
[16] H. Uchikawa, S. Hanehara, T. Shirasaka, D. Sawaki, Effect of admixture onhydration of cement, adsorptive behavior of admixture and fluidity and setting offresh cement paste, Cem. Concr. Res. 22 (1992) 1115–1129.
[17] T. Zhang, S. Shang, F. Yin, A. Aishah, A. Salmiah, T. Ooi, Adsorptivebehavior of surfactants on surface of Portland cement, Cem. Concr. Res. 31 (2001)1009–1015.
[18] P. Petit, I. Javierre, P.-H. Jézéquel, A.-L. Biance, Generation and stability ofbubbles in a cement based slurry, Cem. Concr. Res. 60 (2014) 37–44.
[19] K. Ramamurthy, E. Kunhanandan Nambiar, G. Indu Siva Ranjani, A classificationof studies on properties of foam concrete, Cem. Concr. Res. 31 (2009) 388–396.
[20] R. Flatt, P. Bowen, Yodel: a yield stress model for suspensions, J. Am. Cer. Soc. 89(4) (2006) 1244–1256.
[21] H. Bessaies-Bey, Polymères et propriétés rhéologiques d’une pâte de ciment: uneapproche physique générique (Ph.D. thesis), Université Paris-Est - SIE, 2015.
[22] N. Roussel, P. Coussot, Fifty-cent rheometer for yield stress measurements: fromslump to spreading flow, J. Rheol. 49 (3) (2005) 705–718.
[23] C. Jolicoeur, T. To, T. Nguyen, R. Hill, M. Pagé, Mode of action of anionicsurfactants for air entrainment in cement pastes w-w/o fly ash, 2009 World of CoalAsh (WOCA) Conference - May 4–7, 2009 in Lexington, KY, USA, 2009.
[24] H. Atahan, J.C. Carlos, S. Chae, P. Monteiro, J. Bastacky, The morphology ofentrained air voids in hardened cement paste generated with different anionicsurfactants, Cem. Concr. Compos. 30 (2008) 566–575.
[25] L. Tunstall, G. Scherer, R. Prud’homme, Studying AEA interaction in cementsystems using tensiometry, Cem. Concr. Res. 92 (2017) 29–36.
[26] A. Zingg, F. Winnefeld, L. Holzer, J. Pakusch, S. Becker, L. Gauckler, Adsorptionof polyelectrolytes and its influence on the rheology, zeta potential, and micro-structure of various cement and hydrate phases, J. Colloid Interface Sci. 323 (2008)301–312.
[27] F. Scamehorn, R. Schechter, W. Wade, Adsorption of surfactants on mineral oxidesurfaces from aqueous solutions, J. Colloid Interface Sci. 85 (2) (1982) 463–478.
[28] L. Koopal, E. Lee, M. Böhmer, Adsorption of cationic and anionic surfactants oncharged metal oxide surfaces, J. Colloid Interface Sci. 170 (1995) 85–97.
[29] R. Atkin, V. Craig, E. Wanless, S. Biggs, Mechanism of cationic surfactantadsorption at the solid-aqueous interface, Adv. Colloid Interf. Sci. 103 (2003)219–304.
[30] S. Paria, K. Khilar, A review on experimental studies of surfactant adsorption at thehydrophilic solid-water interface, Adv. Colloid Interf. Sci. 110 (3) (2004) 75–95.
[31] B. Zhu, T. Gu, Surfactant adsorption at solid-liquid interfaces, Adv. Colloid Interf.Sci. 37 (1991) 1–32.
[32] R. Rixom, N. Mailvaganam, Chemical Admixtures for Concrete, third, E. & F.N. SponLtd, 1999 (p106+).
[33] J. Israelachvili, R. Pashley, Measurement of the hydrophobic interaction betweentwo hydrophobic surfaces in aqueous electrolyte solutions, J. Colloid Interface Sci.98 (2) (1984).
[34] E. Meyer, K. Rosenberg, J. Israelachvili, Recent progress in understandinghydrophobic interactions, PNAS 103 (43) (2006) 15739–15746.
[35] R. Flatt, Dispersion forces in cement suspensions, Cem. Concr. Res. 34 (2004)399–408.
B. Feneuil et al. Cement and Concrete Research 100 (2017) 32–39
39