effect of synthesis technique on the structural
TRANSCRIPT
Effect of Synthesis Technique on The Structural, Electrical and Magnetic properties of
zinc nanoferrite L.C. Sonia, Maisnam Victory, Sumitra Phanjoubam
Abstract— Different chemical methods like sol-gel (ZS) and co-precipitation (ZC) technique have been employed to obtain zinc ferrite in
the nanoregime, with an aim to study the effect of synthesis technique on their properties. The samples were sintered at 1000°C for 4 hr
and were investigated for their various structural, electrical and magnetic characterizations. The lattice parameter, crystallite size, and X-ray
density were calculated from the XRD data obtained. The samples synthesized by co-precipitation method were observed to have smaller
crystallite size as compared to that of sol-gel prepared samples. Microstructure of the samples was recorded using scanning electron
microscope (SEM) while the EDAX analysis confirmed the elemental composition of the sample. The dielectric measurements were also
carried out using Agilant HP 4284A LCR meter as a function of frequency in the range 100 Hz - 1 MHz. The variation showed the normal
dispersive behavior of ferrites. The magnetic properties were recorded using Vibrating Sample Magnetometer (VSM). Results obtained
from the two techniques were analysed.
Index Terms— Co-precipitation, Dielectric, Ferrites, Sol-gel, SEM, VSM, XRD
—————————— ——————————
1 INTRODUCTION
AGNETIC materials play a vital role in shaping the various development prevalent in the present society. Of all the magnetic materials, ferrites happen to be the
appropriate choice for many applications in electronics, magnetic storage, magnetic resonance imaging (MRI), magnetically controlled transfer of anti-cancer drugs, power transformers, microwave devices, detoxification of biological fluids, etc. [1], [2], [3], [4]. Nowadays, the importance of spinel-type nanoferrites having the formula MFe2O4, where M is a divalent metal ion like Ni, Co, Fe, Zn, Mn, etc. has increased notably due to its fascinating electrical and magnetic properties. The unit cell of a spinel system comprises of 8 formula units in which 32 O2- ions are assembled to form a face centered cubic with two non equivalent interstitial sites – tetrahedral or A sites and octahedral or B sites. A total of 64 A sites and 32 B sites are present, of which only 8A and 16 B sites are occupied by either of 8 M2+ and 16 Fe3+ ions. The distribution of cations at these sites determines its magnetic properties and is expressed using the formula [M1-
δFeδ]A[MδFe2-δ]B where δ defines the degree of inversion and have the value 0 for normal state and 1 for inverse state. For intermediate or partly inverted state δ lies between 0 and 1 [5], [6], [7]. The remarkable properties of ZnFe2O4 like high magnetic permeability, environment friendliness, high efficiency, high
conductivity, excellent photochemical and phase stability, small eddy current loss, low cost, etc., make it one of the most studied among the various spinel systems. The bulk ZnFe2O4 is a good example of normal spinel ferrite which behaves as an ordered antiferromagnet below 10K and exhibit paramagnetic behavior at room temperature [8], [9], [10]. Literature reveals the use of different methods for obtaining particles in the nanoregime which includes co-precipitation, combustion, ceramic, citrate precursor, sol-gel, hydrothermal, high energy ball milling, etc. [11], [12], [13], [14], [15 ].
In the present work, ZnFe2O4 nanoferrite is synthesized using sol-gel and co-precipitation method and investigations of the structural, electrical and magnetic properties were carried out using various characterization techniques.
2 EXPERIMENTAL
2.1 Synthesis methods
In sol-gel method (ZS), analytical grade iron nitrate and zinc nitrate are taken in stoichiometric proportion and dissolved in ethylene glycol in the ratio 3:1. The mixture is then heated at 40°C for about 1 hr until a clear solution is obtained. The temperature is then increased to 80°C and kept for around 20 min for gel formation. Finally, when heated at 100°C, the gel gets dried and later on gets self ignited which results in the formation of as-prepared ZnFe2O4 nanoferrite.
In co-precipitation method (ZC), appropriate amount of analytical grade ferric chloride and zinc chloride are dissolved in 150 ml of de-ionized water and heated at 40°C under constant stirring. A precise control of the pH to 11 is made through dropwise addition of sodium hydroxide, which serves as the precipitating agent. The obtained brown colored precipitate is filtered and washed several times using de-
M
————————————————
L.C. Sonia M.Sc Physics, Manipur University, India, PH-8258021850, E-mail: [email protected]
Maisnam Victory Research Scholar, Physics Department, Manipur University E-mail: [email protected]
Sumitra Phanjoubam Professor Dept. of Physics, Manipur University E-mail: [email protected]
International Journal of Scientific & Engineering Research Volume 8, Issue 5, May-2017 ISSN 2229-5518 5
IJSER © 2017 http://www.ijser.org
IJSER
ionized water until its pH becomes neutral and then dried. The as-prepared samples are pre-sintered at 750°C for 2 hr.
The powder is then mixed with 3% wt. of polyvinyl alcohol which acts as binder and pressed into pellet with 100 Kg/cm2 pressure using a hydraulic press. Final sintering of the pellet sample is done at 1000°C for 4 hr and then furnace cooled in air at room temperature.
2.2 Characterization tools
The structural investigation of the as-prepared and annealed samples are carried out using Phillips X’Pert Pro Panalytic X-ray Diffractometer with CuKα radiation of wavelength λ=1.5406 Å, and variation of the scanning angle (2θ) in the range 20 to 80 degrees. The photomicrographs taken from SEM FEI QUANTA-250 are used for analyzing the morphology and microstructure of the samples while the EDAX analysis confirms the elemental composition. The electrical and magnetic properties are investigated using Agilant HP 4284A LCR meter and Vibrating Sample Magnetometer (VSM).
3 RESULTS AND DISCUSSION
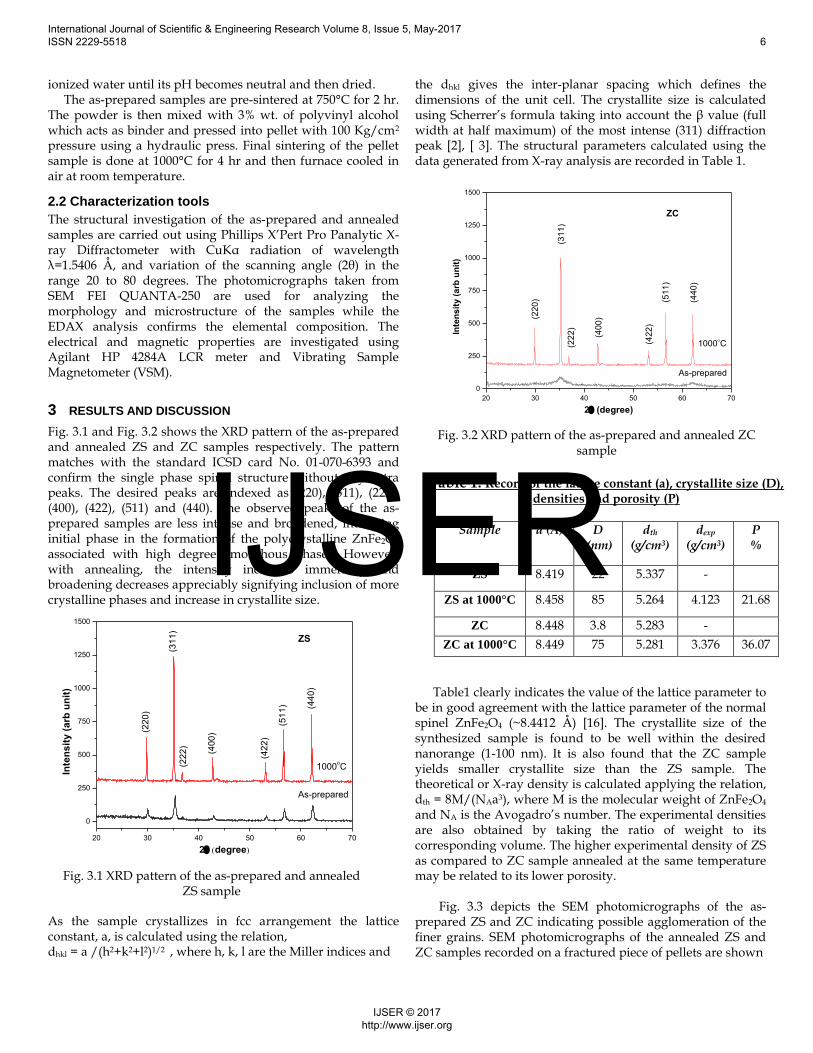
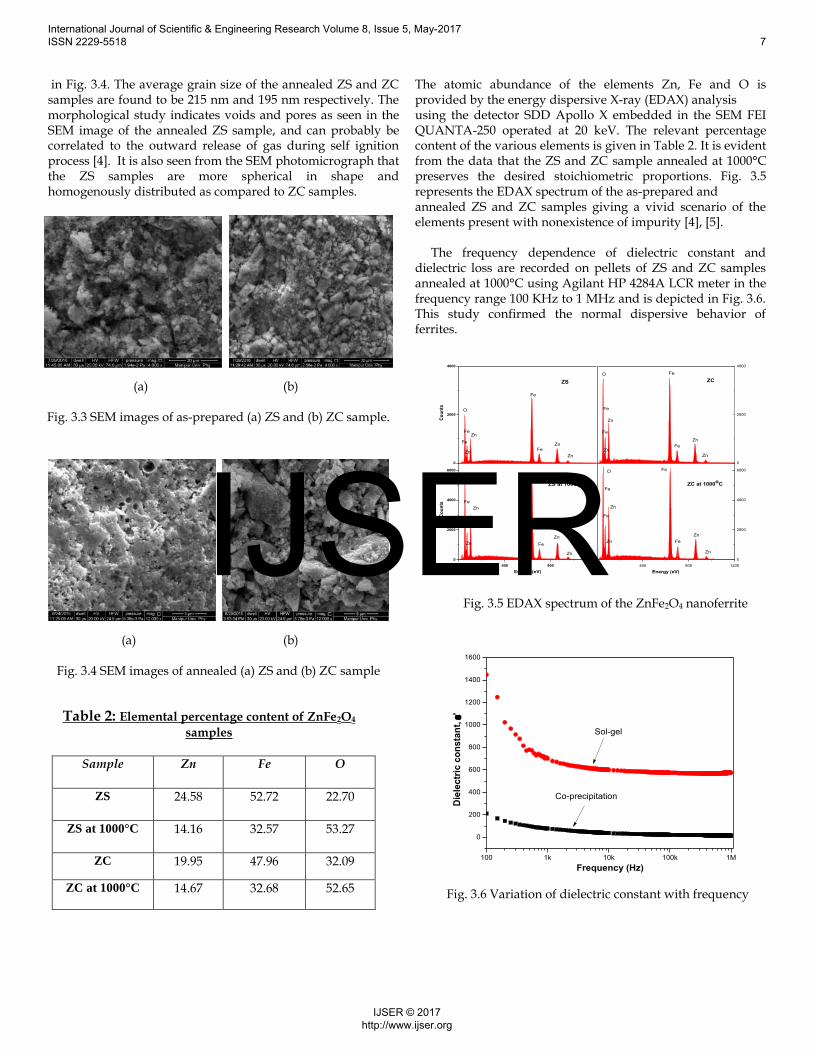
Fig. 3.1 and Fig. 3.2 shows the XRD pattern of the as-prepared and annealed ZS and ZC samples respectively. The pattern matches with the standard ICSD card No. 01-070-6393 and confirm the single phase spinel structure without any extra peaks. The desired peaks are indexed as (220), (311), (222), (400), (422), (511) and (440). The observed peaks of the as-prepared samples are less intense and broadened, indicating initial phase in the formation of the polycrystalline ZnFe2O4 associated with high degree amorphous phases. However, with annealing, the intensity increases immensely and broadening decreases appreciably signifying inclusion of more crystalline phases and increase in crystallite size. As the sample crystallizes in fcc arrangement the lattice constant, a, is calculated using the relation, dhkl = a /(h2+k2+l2)1/2
, where h, k, l are the Miller indices and
the dhkl gives the inter-planar spacing which defines the dimensions of the unit cell. The crystallite size is calculated using Scherrer’s formula taking into account the β value (full width at half maximum) of the most intense (311) diffraction peak [2], [ 3]. The structural parameters calculated using the data generated from X-ray analysis are recorded in Table 1.
Table1 clearly indicates the value of the lattice parameter to
be in good agreement with the lattice parameter of the normal spinel ZnFe2O4 (~8.4412 Å) [16]. The crystallite size of the synthesized sample is found to be well within the desired nanorange (1-100 nm). It is also found that the ZC sample yields smaller crystallite size than the ZS sample. The theoretical or X-ray density is calculated applying the relation, dth = 8M/(NAa3), where M is the molecular weight of ZnFe2O4 and NA is the Avogadro’s number. The experimental densities are also obtained by taking the ratio of weight to its corresponding volume. The higher experimental density of ZS as compared to ZC sample annealed at the same temperature may be related to its lower porosity.
Fig. 3.3 depicts the SEM photomicrographs of the as-
prepared ZS and ZC indicating possible agglomeration of the finer grains. SEM photomicrographs of the annealed ZS and ZC samples recorded on a fractured piece of pellets are shown
20 30 40 50 60 70
0
250
500
750
1000
1250
1500
Inte
ns
ity
(a
rb u
nit
)
2 degree
As-prepared
1000oC
ZS
(22
0)
(31
1)
(22
2)
(40
0)
(42
2)
(51
1) (4
40
)
Fig. 3.1 XRD pattern of the as-prepared and annealed ZS sample
20 30 40 50 60 70
0
250
500
750
1000
1250
1500
Inte
ns
ity
(a
rb u
nit
)
2 (degree)
1000C
As-prepared
ZC
(31
1)
(22
0)
(22
2)
(40
0)
(42
2)
(51
1)
(44
0)
Fig. 3.2 XRD pattern of the as-prepared and annealed ZC sample
Table 1: Record of the lattice constant (a), crystallite size (D), densities and porosity (P)
Sample a (Å) D (nm)
dth
(g/cm3) dexp
(g/cm3) P %
ZS 8.419 22 5.337 -
ZS at 1000°C 8.458 85 5.264 4.123 21.68
ZC 8.448 3.8 5.283 -
ZC at 1000°C 8.449 75 5.281 3.376 36.07
International Journal of Scientific & Engineering Research Volume 8, Issue 5, May-2017 ISSN 2229-5518 6
IJSER © 2017 http://www.ijser.org
IJSER
in Fig. 3.4. The average grain size of the annealed ZS and ZC samples are found to be 215 nm and 195 nm respectively. The morphological study indicates voids and pores as seen in the SEM image of the annealed ZS sample, and can probably be correlated to the outward release of gas during self ignition process [4]. It is also seen from the SEM photomicrograph that the ZS samples are more spherical in shape and homogenously distributed as compared to ZC samples.
The atomic abundance of the elements Zn, Fe and O is provided by the energy dispersive X-ray (EDAX) analysis using the detector SDD Apollo X embedded in the SEM FEI QUANTA-250 operated at 20 keV. The relevant percentage content of the various elements is given in Table 2. It is evident from the data that the ZS and ZC sample annealed at 1000°C preserves the desired stoichiometric proportions. Fig. 3.5 represents the EDAX spectrum of the as-prepared and annealed ZS and ZC samples giving a vivid scenario of the elements present with nonexistence of impurity [4], [5].
The frequency dependence of dielectric constant and
dielectric loss are recorded on pellets of ZS and ZC samples annealed at 1000°C using Agilant HP 4284A LCR meter in the frequency range 100 KHz to 1 MHz and is depicted in Fig. 3.6. This study confirmed the normal dispersive behavior of ferrites.
.
(a) (b)
Fig. 3.4 SEM images of annealed (a) ZS and (b) ZC sample
0
2000
4000
0 400 800 1200
0
2000
4000
6000
0 400 800 1200
0
2000
4000
6000
Co
un
ts
O
Fe
Fe
Zn
Zn
Fe
FeZn
Zn
ZS
O
Fe
Zn
Fe
Zn
Fe
Fe
Zn
Zn
ZC
0
2000
4000
Co
un
ts
Energy (eV)
o
Fe
Zn
Fe
Zn
Fe
Fe
Zn
Zn
ZS at 1000o
C
Energy (eV)
ZC at 1000o
C
O
Fe
Fe
Zn
Zn
Fe
Fe
Zn
Zn
Fig. 3.5 EDAX spectrum of the ZnFe2O4 nanoferrite
100 1k 10k 100k 1M
0
200
400
600
800
1000
1200
1400
1600
Die
lectr
ic c
on
sta
nt,
'
Frequency (Hz)
Sol-gel
Co-precipitation
Fig. 3.6 Variation of dielectric constant with frequency
Table 2: Elemental percentage content of ZnFe2O4
samples
Sample Zn Fe O
ZS 24.58 52.72 22.70
ZS at 1000°C 14.16 32.57 53.27
ZC 19.95 47.96 32.09
ZC at 1000°C 14.67 32.68 52.65
(a) (b)
Fig. 3.3 SEM images of as-prepared (a) ZS and (b) ZC sample.
International Journal of Scientific & Engineering Research Volume 8, Issue 5, May-2017 ISSN 2229-5518 7
IJSER © 2017 http://www.ijser.org
IJSER
High value of the dielectric constant is observed at lower frequency which decreases abruptly with increase in frequency. As the frequency is further increased the dielectric constant reduces to a low value and becomes nearly constant. The obtained dispersive nature of the ferrites may be explained using Koops two layer model and conduction mechanism which connects with the space charge polarization [17], [18], [19]. As known, ferrites are composed of conducting grains which are separated by non-conducting grain boundaries. Their conduction mechanism is governed by the electron hopping between the ions of different valency located at crystallographic equivalent sites and is popularly known as the Verwey mechanism of electron hopping [20]. The electron hopping in ZnFe2O4 takes place between the Fe2+ ions formed during sintering and the Fe3+ ions at the B-sites since the Fe2+ ions have preference for B-sites. The non-conductive grain boundaries offer high resistance thereby blocking the mobile charge carriers displaced in accordance with the direction of the applied field. The hinderance in charge migration leads to collection of space charge carriers at the boundary causing polarization in the low frequency region. With increase in frequency, the direction reversal of electron motion increases thereby, decreasing the probability of electrons reaching the grain boundary and hence the observed decrease in the dielectric constant. The almost constant low value of dielectric constant at much higher frequency may be due to inability of the electron hopping to follow the frequencies of the applied field [21], [22], [23]. As seen from Fig. 3.7 the dielectric loss decreases continuously in the frequency range under investigation. The observed trend may be understood from the relation tanδ=1/ωε'ρ, where angle δ is the lag in phase by the induced current from the applied field, ω gives the angular frequency and ρ is the resistivity of the sample under investigation. The observed dielectric loss may due to various process like decrease in polarization contributed by grain boundaries, crystal imperfections and presence of impurities. The porosity of the sample which depends on the density factor may also
contribute to the observed trend. The higher porosity of the annealed ZC sample in comparision with ZS sample implies low denseness resulting in lower dielectric constant and higher dielectric loss [24], [25].
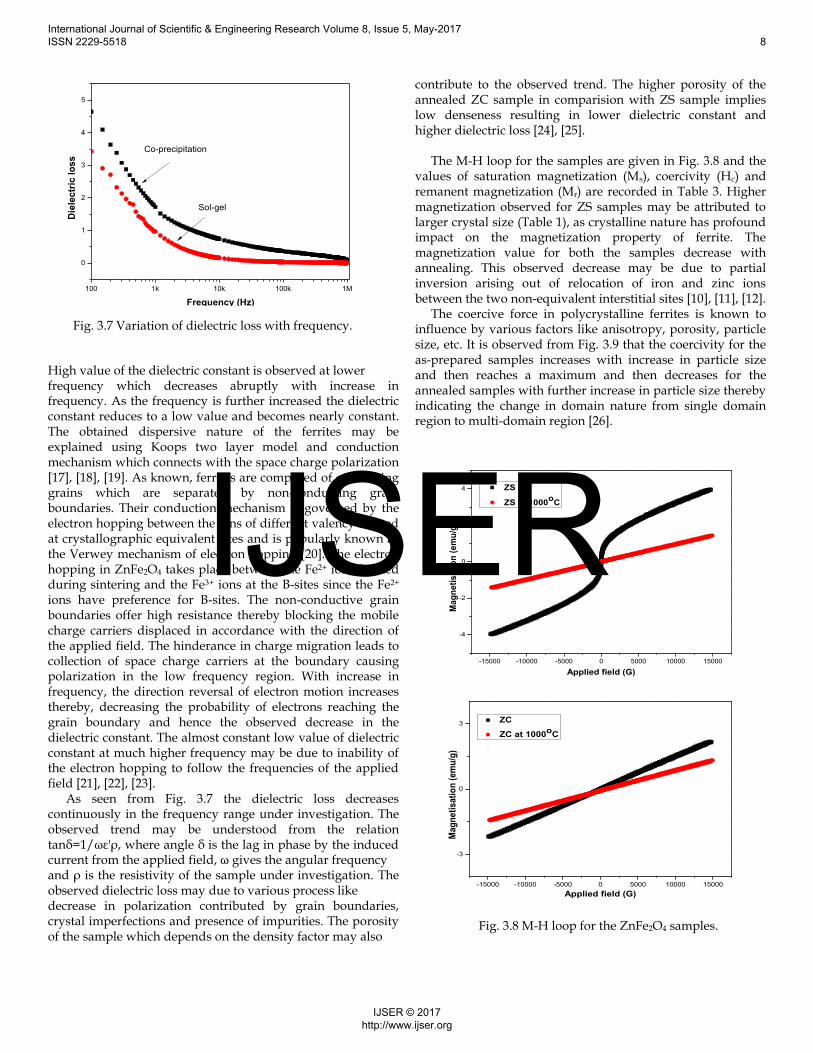
The M-H loop for the samples are given in Fig. 3.8 and the values of saturation magnetization (Ms), coercivity (Hc) and remanent magnetization (Mr) are recorded in Table 3. Higher magnetization observed for ZS samples may be attributed to larger crystal size (Table 1), as crystalline nature has profound impact on the magnetization property of ferrite. The magnetization value for both the samples decrease with annealing. This observed decrease may be due to partial inversion arising out of relocation of iron and zinc ions between the two non-equivalent interstitial sites [10], [11], [12].
The coercive force in polycrystalline ferrites is known to influence by various factors like anisotropy, porosity, particle size, etc. It is observed from Fig. 3.9 that the coercivity for the as-prepared samples increases with increase in particle size and then reaches a maximum and then decreases for the annealed samples with further increase in particle size thereby indicating the change in domain nature from single domain region to multi-domain region [26].
Fig. 3.8 M-H loop for the ZnFe2O4 samples.
-15000 -10000 -5000 0 5000 10000 15000
-4
-2
0
2
4
Mag
neti
sati
on
(em
u/g
)
Applied field (G)
ZS
ZS at 1000o
C
0 2 4 6 8 10
-15000 -10000 -5000 0 5000 10000 15000
-3
0
3 ZC
ZC at 1000o
C
Mag
neti
sati
on
(em
u/g
)
Applied field (G)
100 1k 10k 100k 1M
0
1
2
3
4
5
Die
lec
tric
lo
ss
Frequency (Hz)
Co-precipitation
Sol-gel
Fig. 3.7 Variation of dielectric loss with frequency.
International Journal of Scientific & Engineering Research Volume 8, Issue 5, May-2017 ISSN 2229-5518 8
IJSER © 2017 http://www.ijser.org
IJSER
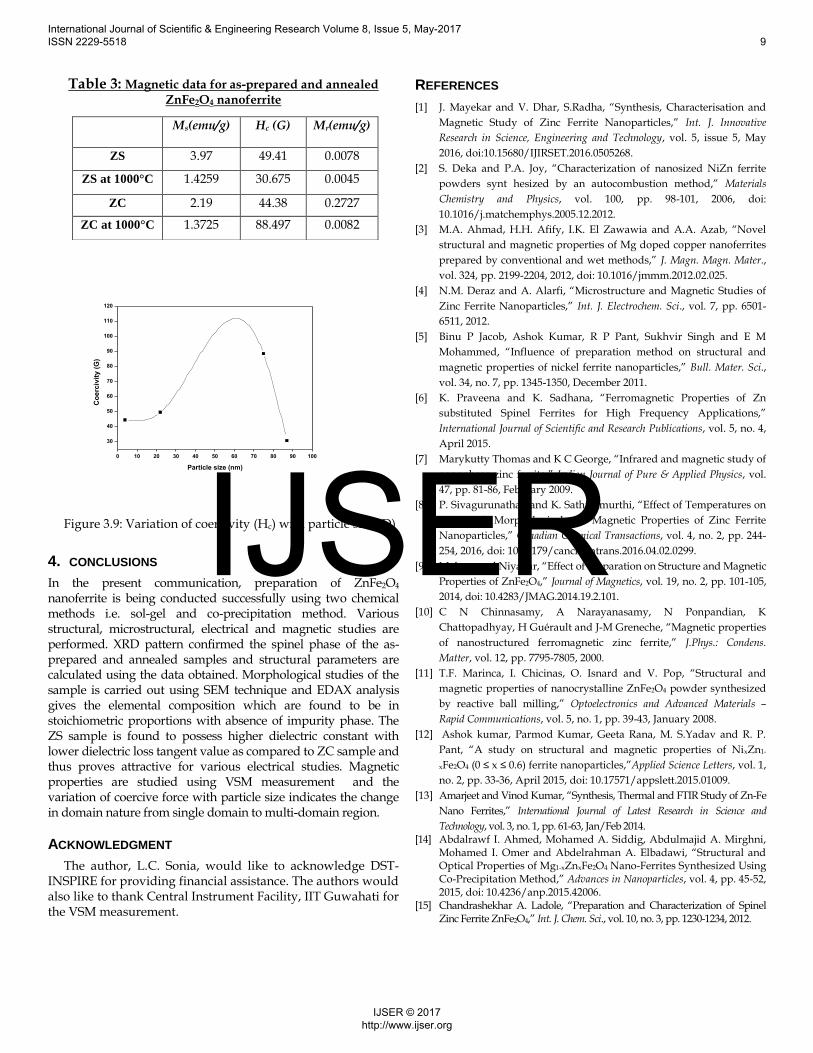
Table 3: Magnetic data for as-prepared and annealed ZnFe2O4 nanoferrite
Figure 3.9: Variation of coercivity (Hc) with particle size (D)
4. CONCLUSIONS
In the present communication, preparation of ZnFe2O4 nanoferrite is being conducted successfully using two chemical methods i.e. sol-gel and co-precipitation method. Various structural, microstructural, electrical and magnetic studies are performed. XRD pattern confirmed the spinel phase of the as-prepared and annealed samples and structural parameters are calculated using the data obtained. Morphological studies of the sample is carried out using SEM technique and EDAX analysis gives the elemental composition which are found to be in stoichiometric proportions with absence of impurity phase. The ZS sample is found to possess higher dielectric constant with lower dielectric loss tangent value as compared to ZC sample and thus proves attractive for various electrical studies. Magnetic properties are studied using VSM measurement and the variation of coercive force with particle size indicates the change in domain nature from single domain to multi-domain region.
ACKNOWLEDGMENT
The author, L.C. Sonia, would like to acknowledge DST-INSPIRE for providing financial assistance. The authors would also like to thank Central Instrument Facility, IIT Guwahati for the VSM measurement.
REFERENCES
[1] J. Mayekar and V. Dhar, S.Radha, “Synthesis, Characterisation and
Magnetic Study of Zinc Ferrite Nanoparticles,” Int. J. Innovative
Research in Science, Engineering and Technology, vol. 5, issue 5, May
2016, doi:10.15680/IJIRSET.2016.0505268.
[2] S. Deka and P.A. Joy, “Characterization of nanosized NiZn ferrite
powders synt hesized by an autocombustion method,” Materials
Chemistry and Physics, vol. 100, pp. 98-101, 2006, doi:
10.1016/j.matchemphys.2005.12.2012.
[3] M.A. Ahmad, H.H. Afify, I.K. El Zawawia and A.A. Azab, “Novel
structural and magnetic properties of Mg doped copper nanoferrites
prepared by conventional and wet methods,” J. Magn. Magn. Mater.,
vol. 324, pp. 2199-2204, 2012, doi: 10.1016/jmmm.2012.02.025.
[4] N.M. Deraz and A. Alarfi, “Microstructure and Magnetic Studies of
Zinc Ferrite Nanoparticles,” Int. J. Electrochem. Sci., vol. 7, pp. 6501-
6511, 2012.
[5] Binu P Jacob, Ashok Kumar, R P Pant, Sukhvir Singh and E M
Mohammed, “Influence of preparation method on structural and
magnetic properties of nickel ferrite nanoparticles,” Bull. Mater. Sci.,
vol. 34, no. 7, pp. 1345-1350, December 2011.
[6] K. Praveena and K. Sadhana, “Ferromagnetic Properties of Zn
substituted Spinel Ferrites for High Frequency Applications,”
International Journal of Scientific and Research Publications, vol. 5, no. 4,
April 2015.
[7] Marykutty Thomas and K C George, “Infrared and magnetic study of
nanophase zinc ferrite,” Indian Journal of Pure & Applied Physics, vol.
47, pp. 81-86, February 2009.
[8] P. Sivagurunathan and K. Sathiyamurthi, “Effect of Temperatures on
Structural, Morphological and Magnetic Properties of Zinc Ferrite
Nanoparticles,” Canadian Chemical Transactions, vol. 4, no. 2, pp. 244-
254, 2016, doi: 10.13179/canchemtrans.2016.04.02.0299.
[9] Mohammad Niyaifar, “Effect of Preparation on Structure and Magnetic
Properties of ZnFe2O4,” Journal of Magnetics, vol. 19, no. 2, pp. 101-105,
2014, doi: 10.4283/JMAG.2014.19.2.101.
[10] C N Chinnasamy, A Narayanasamy, N Ponpandian, K
Chattopadhyay, H Guérault and J-M Greneche, “Magnetic properties
of nanostructured ferromagnetic zinc ferrite,” J.Phys.: Condens.
Matter, vol. 12, pp. 7795-7805, 2000.
[11] T.F. Marinca, I. Chicinas, O. Isnard and V. Pop, “Structural and
magnetic properties of nanocrystalline ZnFe2O4 powder synthesized
by reactive ball milling,” Optoelectronics and Advanced Materials –
Rapid Communications, vol. 5, no. 1, pp. 39-43, January 2008.
[12] Ashok kumar, Parmod Kumar, Geeta Rana, M. S.Yadav and R. P.
Pant, “A study on structural and magnetic properties of NixZn1-
xFe2O4 (0 ≤ x ≤ 0.6) ferrite nanoparticles,”Applied Science Letters, vol. 1,
no. 2, pp. 33-36, April 2015, doi: 10.17571/appslett.2015.01009.
[13] Amarjeet and Vinod Kumar, “Synthesis, Thermal and FTIR Study of Zn-Fe
Nano Ferrites,” International Journal of Latest Research in Science and
Technology, vol. 3, no. 1, pp. 61-63, Jan/Feb 2014. [14] Abdalrawf I. Ahmed, Mohamed A. Siddig, Abdulmajid A. Mirghni,
Mohamed I. Omer and Abdelrahman A. Elbadawi, “Structural and Optical Properties of Mg1-xZnxFe2O4 Nano-Ferrites Synthesized Using Co-Precipitation Method,” Advances in Nanoparticles, vol. 4, pp. 45-52, 2015, doi: 10.4236/anp.2015.42006.
[15] Chandrashekhar A. Ladole, “Preparation and Characterization of Spinel Zinc Ferrite ZnFe2O4,” Int. J. Chem. Sci., vol. 10, no. 3, pp. 1230-1234, 2012.
Ms(emu/g) Hc (G) Mr(emu/g)
ZS 3.97 49.41 0.0078
ZS at 1000°C 1.4259 30.675 0.0045
ZC 2.19 44.38 0.2727
ZC at 1000°C 1.3725 88.497 0.0082
0 10 20 30 40 50 60 70 80 90 100
30
40
50
60
70
80
90
100
110
120
Co
erc
ivit
y (
G)
Particle size (nm)
International Journal of Scientific & Engineering Research Volume 8, Issue 5, May-2017 ISSN 2229-5518 9
IJSER © 2017 http://www.ijser.org
IJSER

[16] R. Raeisi Shahraki, M. Ebrahimi, S.A. Seyyed Ebrahimi and S.M.
Masoudpanah, “Structural characterization and magnetic properties
of superparamagnetic zinc ferrite nanoparticles synthesized by the
coprecipitation method,” J. Magn. Magn. Mater., vol. 324, pp. 3762-
3765, 2012, doi: 10.1016/j.jmmm.2012.06.020.
[17] C. G. Koops, “On the Dispersion of Resistivity and Dielectric
Constant of Some Semiconductors at Audiofrequencies,” Physical
Review, vol. 83, no. 1, July 1951.
[18] J.C Maxwell, Electricity and Magnetism, Oxford University Press,
London, vol. 1, sec 328, pp. 376, 1873.
[19] K.W. Wagner, Ann. Phys., vol. 40, pp. 817, 1913.
[20] E.J.W. Verwey and P.W. Haayman, “Electronic Conductivity and
Transition Point of Magnetite (‘Fe3O4’),” Physica, vol. 8, no. 9, pp. 979-
987, 1941, doi: 10.1016/S0031-8914(41)80005-6.
[21] K. Rama Krishna, Dachepalli Ravinder, K.Vijaya Kumar, Utpal S.
Joshi and V. A. Rana, “Dielectric Properties of Ni-Zn Ferrites
Synthesized by Citrate Gel Method,” World J. of Condensed Matter
Physics, vol. 2, pp. 57-60, May 2012, doi: 10.4236/wjcmp.2012.22010.
[22] P. U. Mahamuni and B.K. Chougule, “Structural, Dielectric and
Magnetic Properties of Nanocrystalline Ni-Zn Ferrites,” Archives of
Physics Research, vol. 1, no. 1, pp. 112-118, 2010.
[23] Anshu Sharma, Kusum Parmar, R.K. Kotnala, N.S. Negi, ”Magnetic
and Dielectric Properties of CoxZn1-xFe2O4 Synthesized by Metallo –
Organic Decomposition Technique,” Int. J. Advances in Engineering
and Technology, vol. 5, pp. 544-554, Nov. 2012.
[24] Amarendra K. Singh, A. Verma, O.P. Thakur, Chandra Prakash, T.C.
Goel and R.G. Mendiratta, “Electrical and magnetic properties of
Mn-Ni-Zn ferrites processed by citrate precursor method,” Materials
Letters, vol. 57, pp. 1040-1044, Jan 2003.
[25] Md. T. Rahman, M. Vargas and C.V. Ramana, “Structural
characteristics, electrical conduction and dielectric properties of
gadolinium substituted cobalt ferrite,” Journal of Alloys and
Compounds, vol. 617, pp. 547-562, August 2014, doi:
10.1016/j.jallcom.2014.07.182.
[26] B.D. Cullity, C.D. Graham, Introduction to Magnetic materials. IEEE
Press, John Wiley & Sons, New Jersey, pp. 360-361, 2009.
International Journal of Scientific & Engineering Research Volume 8, Issue 5, May-2017 ISSN 2229-5518 10
IJSER © 2017 http://www.ijser.org
IJSER