effect of three countermeasures against the illegal crossing of railway tracks
TRANSCRIPT
E
AV
a
ARR1A
KRRMC
1
wic2
mwreritBis2a
Ri
0d
Accident Analysis and Prevention 43 (2011) 1089–1094
Contents lists available at ScienceDirect
Accident Analysis and Prevention
journa l homepage: www.e lsev ier .com/ locate /aap
ffect of three countermeasures against the illegal crossing of railway tracks
nne Silla ∗, Juha Luoma1
TT Technical Research Centre of Finland, Vuorimiehentie 3, P.O. Box 1000, 02044 VTT, Finland
r t i c l e i n f o
rticle history:eceived 14 April 2010eceived in revised form6 November 2010ccepted 15 December 2010
eywords:
a b s t r a c t
This study was designed to investigate the effects of three countermeasures – landscaping, building afence and prohibitive signs – on the frequency of trespassing, which in this case means crossing thetrack at places where it is forbidden. At each location the official route was no more than 300 m away.The main results showed that the effect of each countermeasure on the frequency of trespassing wasstatistically significant. Specifically, the fencing reduced trespassing by 94.6%, followed by landscaping(91.3%) and prohibitive signs (30.7%). The majority of illegal crossings were committed alone and the
ailway trespassingailwayseasurement
ountermeasures
persons trespassing were mostly adults and men. In addition, the results demonstrated some tendenciesof how the effects of the selected countermeasures can vary with the characteristics of the trespassers.The main implication of this study is that the building of physical barriers such as landscaping or fencingis recommended for reducing trespassing. However, if the required resources are not available or the siteis not suitable for such measures, the use of prohibitive signs is recommended. Further, there is a needto tailor the countermeasures to the characteristics of the trespassers in order to ensure that the most
ures
appropriate countermeas. Introduction
Trespassing is one of the leading railway safety challengesorldwide (e.g. Lobb et al., 2003; Lobb, 2006; Pelletier, 1997). This
s also the case in Finland, where most fatalities involving rail vehi-les result from collisions between trains and pedestrians (Eurostat,007).
Trespassers are people who cross railway lines at places notarked for that purpose, or who loiter or walk illegally in the rail-ay area. Nearly every pedestrian walking in the area close to the
ailway lines is a potential trespasser if the railway lines are notffectively isolated from the surrounding areas. While trespassingefers to using the railway as a short cut or even to commit vandal-sm (Robinson, 2003), the main reason for trespassing seems to beaking a short cut (e.g. Lobb et al., 2001; Rail Safety and Standardsoard, 2007). For example, recent trespasser interviews carried out
n Finland showed that the route across the railway tracks was thehortest and fastest alternative for trespassers (Silla and Luoma,008). Many of them had used the route for years and clear paths
cross the railway lines had made trespassing easy.In Finland, 5794 km of railway lines are currently in use (Finnishail Administration, 2008). Usually they are not fenced. Trespass-
ng concentrates in urban areas where the population density is
∗ Corresponding author. Tel.: +358 207224517; fax: +358 207227000.E-mail addresses: [email protected] (A. Silla), [email protected] (J. Luoma).
1 Tel.: +358 207224533; fax: +358 207227000.
001-4575/$ – see front matter © 2010 Elsevier Ltd. All rights reserved.oi:10.1016/j.aap.2010.12.017
are applied.© 2010 Elsevier Ltd. All rights reserved.
high and rail traffic is heavy (Silla and Luoma, 2008). Railway lineshave always divided communities, in some cases increasingly overthe years. Thus new developments within the city such as resi-dential areas, shopping areas and schools are frequently located onboth sides of the railway lines, increasing people’s need to crossthe tracks. As pointed out by Nelson (2008), the division of com-munities generates a tension between the railway authorities, whohave the responsibility to ensure that the railway can be crossedsafely by restricting the points at which the public can cross the rail-way, and pedestrians who wish to find the shortest route betweentwo points. Consequently, the railway authorities need applicableinformation about possible measures to prevent trespassing.
Many studies have argued that trespassing tends to be specific toa location (e.g. Law, 2004; Rail Safety and Standards Board, 2007;Savage, 2007). If this is the case, countermeasures should be tai-lored to specific characteristics by identifying who is trespassingand why. However, the only published study investigating this issueis our earlier study, which included trespasser interviews (Silla andLuoma, 2008). The main factor that determined the suggested coun-termeasures was distance to the closest official crossing site. Peoplewere more willing to accept fencing if the distance was relativelyshort, but for a relatively long distance they somewhat preferredan overpass or underpass.
These findings suggest that countermeasures should be tai-lored to location and environment-related factors. In addition, thecountermeasures should possibly also vary in line with trespassercharacteristics. Without a good understanding of the problem,the risk remains that allocated resources are wasted or that

1 is and
i2
taaBwpiadadt
topadfar(smsmbe
urwio(i(
ctltmtFihaennRas
2
2
itt
090 A. Silla, J. Luoma / Accident Analys
mplemented measures may be counterproductive (Savage,007).
There are several countermeasures that have been used to deterrespass. Suggested interventions include limitation of pedestrianccess to railroad areas, public education, reward or punishment,nd different technical solutions (e.g. Rail Safety and Standardsoard, 2007). The limitation of pedestrian access can be achievedith e.g. fencing, signage, attendance of station staff or securityersonnel, and landscaping. Technical solutions include e.g. warn-
ng devices, closed-circuit television with or without a link to audionnouncements and/or motion detectors, and cameras with motionetectors. The Rail Safety and Standards Board (2007) suggests thatmultifaceted approach, using a mix of measures designed to beirected at specific issues, can be effective in discouraging accesso the railway lines.
Regardless of the large number of proposed countermeasures,here is little published research evaluating the effectiveness of anyf these interventions (Lobb, 2006). Lobb et al. (2001) combinedublic education and access prevention by fences to reduce trespasst a suburban station in Auckland. The results showed that imme-iately after these interventions the rate of trespassing decreasedrom 59% to 40% and after 3 months the decrease was sustainednd even slightly enhanced (from 40% to 36%). Furthermore, theeduction was higher for adults (from 65% to 37%) than for childrenfrom 47% to 34%). Lobb et al. (2003) evaluated the effects of railafety education, continuous punishment and intermittent punish-ent on reducing the trespass. The target group included pupils in
econdary/high school. Lobb et al. (2003) concluded that punish-ent might be more effective than education in reducing unsafe
ehaviour in the vicinity of railway stations, and substantially moreffective than communications to raise awareness.
The above review suggests that more research is needed tonderstand trespassing behaviour and to broaden the knowledgeelated to trespassing. In order to counter the trespassing problem,e identified the sites of frequent trespassing on Finnish railways,
nvestigated trespassing behaviour at selected sites, and exploredpinions about possible countermeasures to prevent trespassingSilla and Luoma, 2008). In addition, we have investigated the opin-ons on railway trespassing of people living close to the railway lineSilla and Luoma, submitted for publication).
The aim of this study was to investigate the effects of threeountermeasures on the frequency of trespassing and the charac-eristics of trespassing behaviour. The countermeasures includedandscaping, building a fence and prohibitive signs. It was assumedhat landscaping and fencing are effective countermeasures as they
ake trespassing physically difficult. However, the effectiveness ofhese measures might differ with the characteristics of trespassers.urthermore, these countermeasures are relatively expensive tonstall, and especially fencing needs maintenance as well. Pro-ibitive signs were selected as the third countermeasure, as theyre inexpensive to install and require limited maintenance. How-ver, it was assumed that the effects of signs on trespassing wouldot be substantial, because it is well known that pedestrians doot always comply with established prohibitions. For example,osenbloom (2009) found in Tel Aviv that 13.5% of the pedestri-ns arriving in the red-light phase at an intersection crossed thetreet on red.
. Method
.1. Countermeasures
The tested countermeasures included (1) landscaping, (2) build-ng a fence and (3) prohibitive signs. Each countermeasure wasested at one site. The selection of a suitable site for each coun-ermeasure was based on environment-related factors.
Prevention 43 (2011) 1089–1094
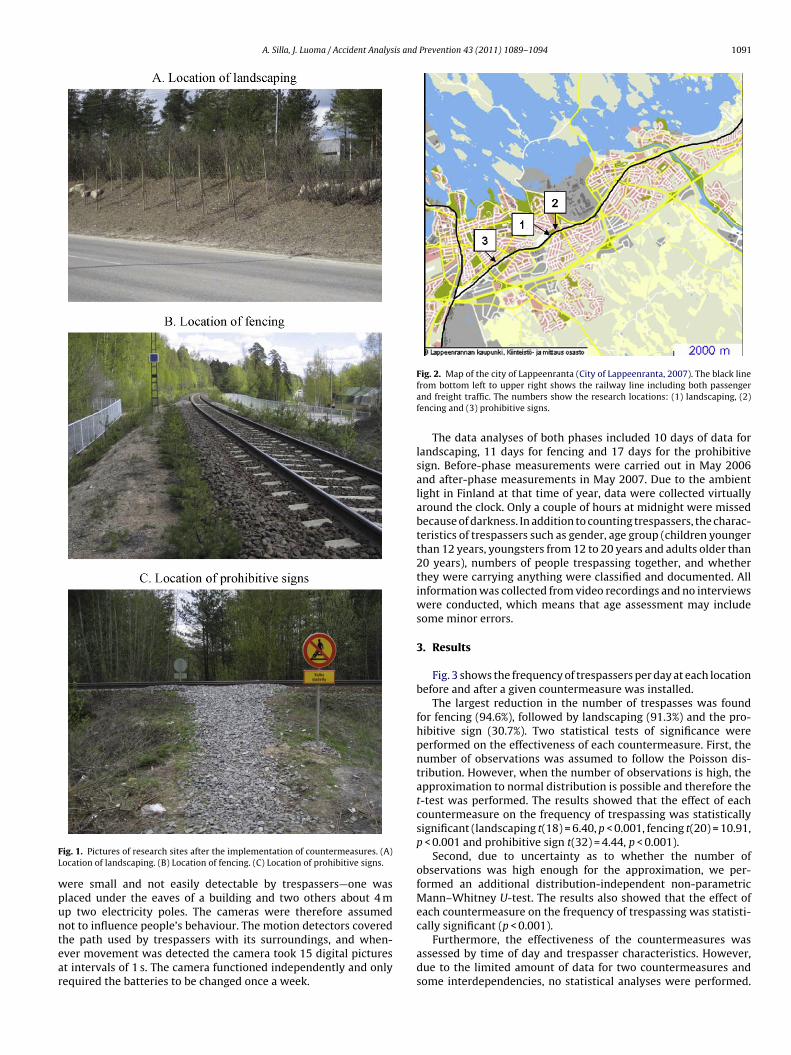
The characteristics of the countermeasures were as follows:(1) the landscaping included removal of the existing path acrossthe railway line, steepening the sides of the railway line, plant-ing trees and bushes to form a natural fence, planting grass anddecorating the sides with a few large stones. The landscaping wasapproximately 1.5 m high and 200 m long, the unofficial path beingroughly in the middle of it. (2) The fences installed on both sidesof the railway line were approximately 1.0 m high and extendedroughly 100 m from the unofficial path in both directions. The fenc-ing started at an underpass and continued to a landscaping area. (3)The design of the prohibitive sign was based on existing prohibitivesigns used in Finnish rail and road transportation, with the supple-mental text “No trespassing”. The sign was erected on both sides ofthe railway line. No additional enforcement was introduced duringdata collection. The countermeasures are shown in Fig. 1.
2.2. Research locations
All the research locations were selected in the city of Lappeen-ranta, as our earlier study (Silla and Luoma, 2008) had shown thatthe area is very prone to trespassing. Lappeenranta is a relativelysmall city in Eastern Finland. At the time of data collection thecity included some 60,000 inhabitants. The age distribution of theinhabitants was as follows: younger than 19 years 19.9%, 19–24years 8.2%, 25–44 years 24.7%, 45–64 years 29.2% and older than64 years 17.9%. The transport system is dominated by cars. How-ever, there is a local bus transport system and an extensive networkof pedestrian and bicycle paths. Crucially, the tracks divide the cityinto two parts (Fig. 2), which leads to frequent crossing of the tracks.There is a 4 km stretch of track that includes 12 locations with fre-quent trespassing. This track section includes five official crossingplaces.
At each location the official route was no more than 300 m awayfrom the illegal crossing site. Residential areas, shopping areas andschools are located on both sides of the railway lines, increasingpeople’s need to cross the tracks. This is compounded by areas forleisure activities such as an ice hall and outdoor routes within thecity. Preliminary site observations showed that the path across thetracks in the vicinity of the prohibitive sign was used more activelythan the paths located near fencing or landscaping.
During working days more than 50 trains pass through thisrailway section, of which 14 are regular passenger trains. The max-imum speed limit through the railway section is 140 km/h, but inpractice the local topography keeps speeds at 100 km/h or less. Dur-ing the period 2002–2008 two people were unintentionally killedby rolling stock in motion on this section of railway (VR GroupLtd, 2010). However, neither of these fatalities occurred during thestudy period.
2.3. Design
The main analysis was based on comparison of trespassing fre-quency before and after a given countermeasure was set up. Thenumber of working days and weekend days for each location wassimilar for both the before and after phase. The underlying assump-tion was that the travel behaviour of people (in terms of timingor starting point and destination) in the area would not changebetween the before and after measurements.
2.4. Procedure
The landscaping was installed at the end of autumn 2006. Thefences were built and prohibitive signs erected in early May 2007,one week before the after-phase measurements.
Video cameras equipped with motion detectors were used tocount trespassers. The cameras (AVN-4090E, 37(Dia) × 99(L) mm)
A. Silla, J. Luoma / Accident Analysis and Prevention 43 (2011) 1089–1094 1091
FL
wpuntear
ig. 1. Pictures of research sites after the implementation of countermeasures. (A)ocation of landscaping. (B) Location of fencing. (C) Location of prohibitive signs.
ere small and not easily detectable by trespassers—one waslaced under the eaves of a building and two others about 4 mp two electricity poles. The cameras were therefore assumed
ot to influence people’s behaviour. The motion detectors coveredhe path used by trespassers with its surroundings, and when-ver movement was detected the camera took 15 digital picturest intervals of 1 s. The camera functioned independently and onlyequired the batteries to be changed once a week.Fig. 2. Map of the city of Lappeenranta (City of Lappeenranta, 2007). The black linefrom bottom left to upper right shows the railway line including both passengerand freight traffic. The numbers show the research locations: (1) landscaping, (2)fencing and (3) prohibitive signs.
The data analyses of both phases included 10 days of data forlandscaping, 11 days for fencing and 17 days for the prohibitivesign. Before-phase measurements were carried out in May 2006and after-phase measurements in May 2007. Due to the ambientlight in Finland at that time of year, data were collected virtuallyaround the clock. Only a couple of hours at midnight were missedbecause of darkness. In addition to counting trespassers, the charac-teristics of trespassers such as gender, age group (children youngerthan 12 years, youngsters from 12 to 20 years and adults older than20 years), numbers of people trespassing together, and whetherthey were carrying anything were classified and documented. Allinformation was collected from video recordings and no interviewswere conducted, which means that age assessment may includesome minor errors.
3. Results
Fig. 3 shows the frequency of trespassers per day at each locationbefore and after a given countermeasure was installed.
The largest reduction in the number of trespasses was foundfor fencing (94.6%), followed by landscaping (91.3%) and the pro-hibitive sign (30.7%). Two statistical tests of significance wereperformed on the effectiveness of each countermeasure. First, thenumber of observations was assumed to follow the Poisson dis-tribution. However, when the number of observations is high, theapproximation to normal distribution is possible and therefore thet-test was performed. The results showed that the effect of eachcountermeasure on the frequency of trespassing was statisticallysignificant (landscaping t(18) = 6.40, p < 0.001, fencing t(20) = 10.91,p < 0.001 and prohibitive sign t(32) = 4.44, p < 0.001).
Second, due to uncertainty as to whether the number ofobservations was high enough for the approximation, we per-formed an additional distribution-independent non-parametricMann–Whitney U-test. The results also showed that the effect ofeach countermeasure on the frequency of trespassing was statisti-
cally significant (p < 0.001).Furthermore, the effectiveness of the countermeasures wasassessed by time of day and trespasser characteristics. However,due to the limited amount of data for two countermeasures andsome interdependencies, no statistical analyses were performed.

1092 A. Silla, J. Luoma / Accident Analysis and Prevention 43 (2011) 1089–1094
18.4
35.1
69.9
1.91.6
48.3
0
20
40
60
80
100
Prohibitive sign (N=2,005)Fencing (N=407)Landscaping (N=200)Mean
fre
qu
en
cy o
f tr
esp
asses p
er
day
Befo
before
Sttdaa
rcc
tc
Ht
wwtsdo
lrtFs
ccewqatowtp
4
s
Fig. 3. Frequency of trespasses per day
pecifically, the most evident interdependencies before the coun-ermeasures were installed included the following: 94% of therespassers in groups involving more than two persons were chil-ren or youngsters, 86% of people with dogs were adults andll trespassers equipped with poles (i.e. Nordic walkers) weredults.
Table 1 shows the number of trespassers by time of day. Theesults show that the prohibitive sign lowered the amount of illegalrossings only during the day and not during night. For the otherountermeasures, no clear differences were found.
With the above proviso in mind, Table 2 shows the frequency ofrespassing and the effectiveness of countermeasures by trespasserategory.
Overall, males were trespassing more frequently than females.owever, landscaping seemed to reduce trespassing by males more
han by females.Before any installation, the largest age group at each location
as adults, followed by youngsters and children. The landscapingas highly effective among children and adults but not that effec-
ive among youngsters. The effectiveness of fencing was roughlyimilar in each age group. The sign was quite effective among chil-ren, but relatively few youngsters and adults obeyed the messagen the sign.
Overall, in the before phase most trespassers were alone, fol-owed by groups of two. Larger groups were quite rare. Landscapingeduced relatively well trespassing by all but groups of more thanwo. Notably, most groups of more than two involved youngsters.urthermore, the effect of the fencing and the sign did not varyubstantially by size of group.
In the before phase, most trespassers were travelling withoutarrying or having anything with them, followed by trespassersarrying their bicycle, trespassers with their dog(s), trespassersquipped with poles (i.e. Nordic walking) and a few trespassersith something else, like a pram or scooter. Although many fre-
uencies are too small to draw any conclusions, some tendenciesre worth mentioning. First, after the installation of landscaping norespassers were carrying or had anything with them. Second, theverall effect of the fencing was high, except for people exercisingith poles. In the case of the sign the effect was the opposite, with
he highest effectiveness among (adult) people exercising witholes.
. Costs and benefits
A simple cost–benefit analysis of the implemented countermea-ures was carried out. Each countermeasure was compared with the
re After
and after countermeasure installation.
situation when no countermeasure was implemented. The presentvalue of costs and benefits over 30 years was estimated with adiscount rate of 5% (Finnish Rail Administration, 2004).
The cost estimate first assumed the following implementa-tion cost for each countermeasure: landscaping 30,000 D , fencing30,000 D and signing 5000 D . Secondly, the yearly cost of time lostusing an official route instead of trespassing was estimated forthose who did not trespass after the implementation of a givencountermeasure. The mean lost time per crossing was 0.12 h (dis-tance 2 × 300 m, walking speed 5 km/h). The monetary value oftime for commuting, shopping and leisure was 4.07 D /h (FinnishRail Administration, 2004).
The benefit estimate included the assessed safety benefits andthe depreciation value of the investment. Specifically, the 4 kmlong railway section (for which the number of fatalities was avail-able) includes 12 trespassing sites, each involving approximately41 trespassers per day on average (i.e. the mean number of tres-passers per site before implementation of the countermeasures).These figures result in 179,580 trespassings per year along a givenrail section. There had been two fatal trespassing accidents in thepast 7 years, the fatality risk per trespassing then being 1.59 × 10⁻⁶
(2/(7 × 179,580)). The monetary benefit of one avoided trespasserfatality is 1,964,161 D (Finnish Rail Administration, 2004). Conse-quently, the mean benefit per avoided trespassing was 3.08 D . Thedepreciation value of the investment was 25% of its original value(Finnish Rail Administration, 2004).
Table 3 shows the results of the cost–benefit analysis for twoscenarios. Scenario 1 was based on the actual number of trespassersat each site. However, to generalise the results, the same number oftrespassers before implementation (mean value of 41 in this case)was used for Scenario 2.
Both scenarios showed that the benefits of each countermea-sure were substantially higher than the cost. The benefit–cost ratiowas highest for prohibitive signs, but the differences among thecountermeasures were not substantial if the number of originaltrespassers was the same (Scenario 2).
5. Discussion
The aim of this study was to investigate the effects of three coun-termeasures on the frequency of trespassing at locations where
the official route was no more than 300 m away. The main resultsshowed that each implemented countermeasure had a statisticallysignificant effect on the frequency of trespassing. The largest reduc-tion in the frequency of daily trespasses was found for fencing(94.6%), followed by landscaping (91.3%) and a prohibitive sign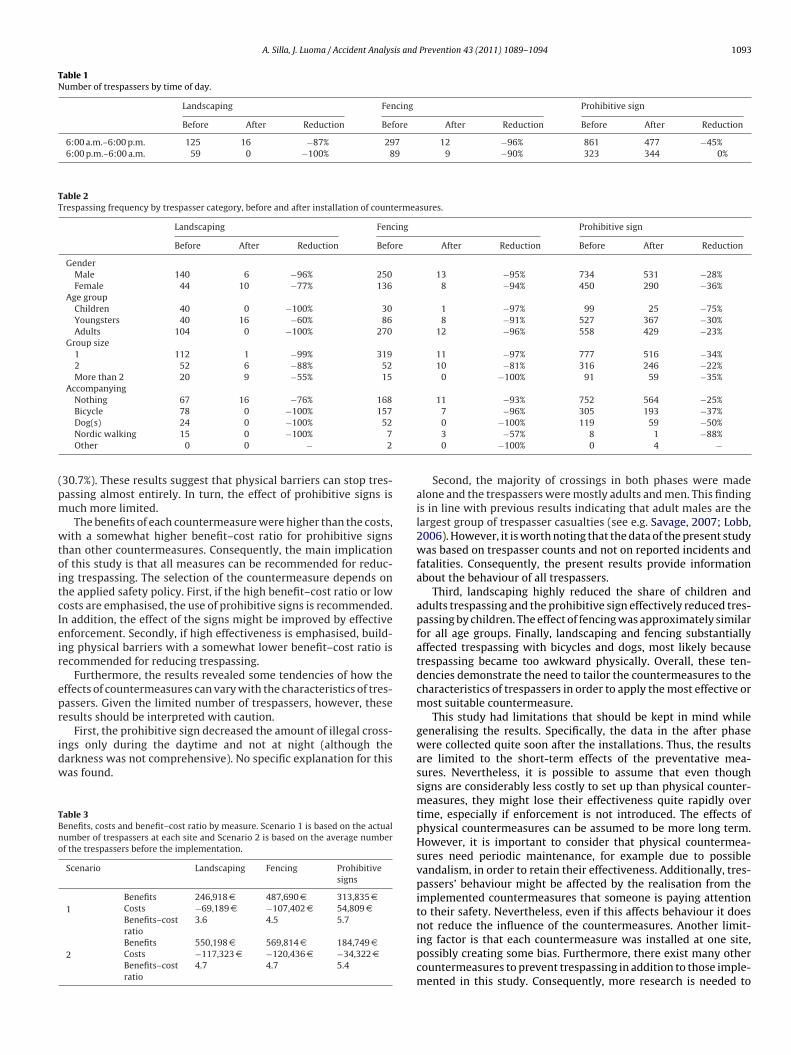
A. Silla, J. Luoma / Accident Analysis and Prevention 43 (2011) 1089–1094 1093
Table 1Number of trespassers by time of day.
Landscaping Fencing Prohibitive sign
Before After Reduction Before After Reduction Before After Reduction
6:00 a.m.–6:00 p.m. 125 16 −87% 297 12 −96% 861 477 −45%6:00 p.m.–6:00 a.m. 59 0 −100% 89 9 −90% 323 344 0%
Table 2Trespassing frequency by trespasser category, before and after installation of countermeasures.
Landscaping Fencing Prohibitive sign
Before After Reduction Before After Reduction Before After Reduction
GenderMale 140 6 −96% 250 13 −95% 734 531 −28%Female 44 10 −77% 136 8 −94% 450 290 −36%
Age groupChildren 40 0 −100% 30 1 −97% 99 25 −75%Youngsters 40 16 −60% 86 8 −91% 527 367 −30%Adults 104 0 −100% 270 12 −96% 558 429 −23%
Group size1 112 1 −99% 319 11 −97% 777 516 −34%2 52 6 −88% 52 10 −81% 316 246 −22%More than 2 20 9 −55% 15 0 −100% 91 59 −35%
AccompanyingNothing 67 16 −76% 168 11 −93% 752 564 −25%
(pm
wtoitcIeir
epr
idw
TBno
Bicycle 78 0 −100% 157Dog(s) 24 0 −100% 52Nordic walking 15 0 −100% 7Other 0 0 − 2
30.7%). These results suggest that physical barriers can stop tres-assing almost entirely. In turn, the effect of prohibitive signs isuch more limited.The benefits of each countermeasure were higher than the costs,
ith a somewhat higher benefit–cost ratio for prohibitive signshan other countermeasures. Consequently, the main implicationf this study is that all measures can be recommended for reduc-ng trespassing. The selection of the countermeasure depends onhe applied safety policy. First, if the high benefit–cost ratio or lowosts are emphasised, the use of prohibitive signs is recommended.n addition, the effect of the signs might be improved by effectivenforcement. Secondly, if high effectiveness is emphasised, build-ng physical barriers with a somewhat lower benefit–cost ratio isecommended for reducing trespassing.
Furthermore, the results revealed some tendencies of how theffects of countermeasures can vary with the characteristics of tres-assers. Given the limited number of trespassers, however, theseesults should be interpreted with caution.
First, the prohibitive sign decreased the amount of illegal cross-ngs only during the daytime and not at night (although thearkness was not comprehensive). No specific explanation for thisas found.
able 3enefits, costs and benefit–cost ratio by measure. Scenario 1 is based on the actualumber of trespassers at each site and Scenario 2 is based on the average numberf the trespassers before the implementation.
Scenario Landscaping Fencing Prohibitivesigns
1Benefits 246,918D 487,690D 313,835DCosts −69,189D −107,402D 54,809DBenefits–costratio
3.6 4.5 5.7
2Benefits 550,198D 569,814D 184,749DCosts −117,323D −120,436D −34,322DBenefits–costratio
4.7 4.7 5.4
7 −96% 305 193 −37%0 −100% 119 59 −50%3 −57% 8 1 −88%0 −100% 0 4 −
Second, the majority of crossings in both phases were madealone and the trespassers were mostly adults and men. This findingis in line with previous results indicating that adult males are thelargest group of trespasser casualties (see e.g. Savage, 2007; Lobb,2006). However, it is worth noting that the data of the present studywas based on trespasser counts and not on reported incidents andfatalities. Consequently, the present results provide informationabout the behaviour of all trespassers.
Third, landscaping highly reduced the share of children andadults trespassing and the prohibitive sign effectively reduced tres-passing by children. The effect of fencing was approximately similarfor all age groups. Finally, landscaping and fencing substantiallyaffected trespassing with bicycles and dogs, most likely becausetrespassing became too awkward physically. Overall, these ten-dencies demonstrate the need to tailor the countermeasures to thecharacteristics of trespassers in order to apply the most effective ormost suitable countermeasure.
This study had limitations that should be kept in mind whilegeneralising the results. Specifically, the data in the after phasewere collected quite soon after the installations. Thus, the resultsare limited to the short-term effects of the preventative mea-sures. Nevertheless, it is possible to assume that even thoughsigns are considerably less costly to set up than physical counter-measures, they might lose their effectiveness quite rapidly overtime, especially if enforcement is not introduced. The effects ofphysical countermeasures can be assumed to be more long term.However, it is important to consider that physical countermea-sures need periodic maintenance, for example due to possiblevandalism, in order to retain their effectiveness. Additionally, tres-passers’ behaviour might be affected by the realisation from theimplemented countermeasures that someone is paying attentionto their safety. Nevertheless, even if this affects behaviour it does
not reduce the influence of the countermeasures. Another limit-ing factor is that each countermeasure was installed at one site,possibly creating some bias. Furthermore, there exist many othercountermeasures to prevent trespassing in addition to those imple-mented in this study. Consequently, more research is needed to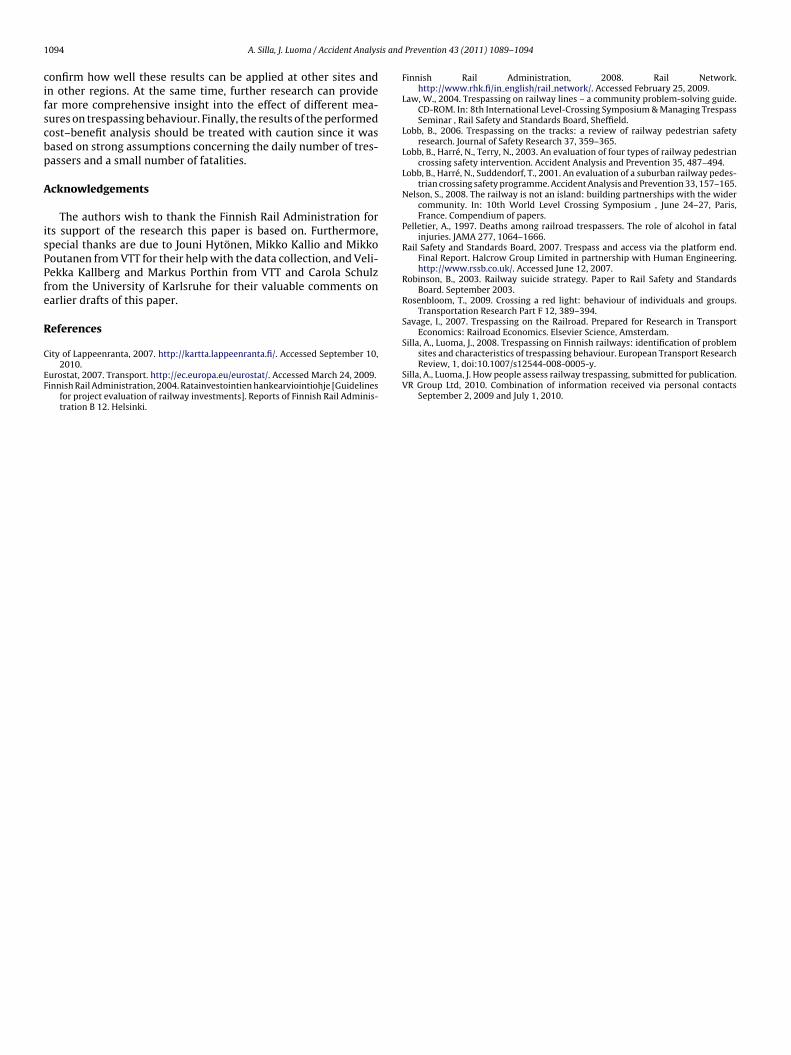
1 is and
cifscbp
A
isPPfe
R
C
EF
Silla, A., Luoma, J., 2008. Trespassing on Finnish railways: identification of problem
094 A. Silla, J. Luoma / Accident Analys
onfirm how well these results can be applied at other sites andn other regions. At the same time, further research can providear more comprehensive insight into the effect of different mea-ures on trespassing behaviour. Finally, the results of the performedost–benefit analysis should be treated with caution since it wasased on strong assumptions concerning the daily number of tres-assers and a small number of fatalities.
cknowledgements
The authors wish to thank the Finnish Rail Administration forts support of the research this paper is based on. Furthermore,pecial thanks are due to Jouni Hytönen, Mikko Kallio and Mikkooutanen from VTT for their help with the data collection, and Veli-ekka Kallberg and Markus Porthin from VTT and Carola Schulzrom the University of Karlsruhe for their valuable comments onarlier drafts of this paper.
eferences
ity of Lappeenranta, 2007. http://kartta.lappeenranta.fi/. Accessed September 10,2010.
urostat, 2007. Transport. http://ec.europa.eu/eurostat/. Accessed March 24, 2009.innish Rail Administration, 2004. Ratainvestointien hankearviointiohje [Guidelines
for project evaluation of railway investments]. Reports of Finnish Rail Adminis-tration B 12. Helsinki.
Prevention 43 (2011) 1089–1094
Finnish Rail Administration, 2008. Rail Network.http://www.rhk.fi/in english/rail network/. Accessed February 25, 2009.
Law, W., 2004. Trespassing on railway lines – a community problem-solving guide.CD-ROM. In: 8th International Level-Crossing Symposium & Managing TrespassSeminar , Rail Safety and Standards Board, Sheffield.
Lobb, B., 2006. Trespassing on the tracks: a review of railway pedestrian safetyresearch. Journal of Safety Research 37, 359–365.
Lobb, B., Harré, N., Terry, N., 2003. An evaluation of four types of railway pedestriancrossing safety intervention. Accident Analysis and Prevention 35, 487–494.
Lobb, B., Harré, N., Suddendorf, T., 2001. An evaluation of a suburban railway pedes-trian crossing safety programme. Accident Analysis and Prevention 33, 157–165.
Nelson, S., 2008. The railway is not an island: building partnerships with the widercommunity. In: 10th World Level Crossing Symposium , June 24–27, Paris,France. Compendium of papers.
Pelletier, A., 1997. Deaths among railroad trespassers. The role of alcohol in fatalinjuries. JAMA 277, 1064–1666.
Rail Safety and Standards Board, 2007. Trespass and access via the platform end.Final Report. Halcrow Group Limited in partnership with Human Engineering.http://www.rssb.co.uk/. Accessed June 12, 2007.
Robinson, B., 2003. Railway suicide strategy. Paper to Rail Safety and StandardsBoard. September 2003.
Rosenbloom, T., 2009. Crossing a red light: behaviour of individuals and groups.Transportation Research Part F 12, 389–394.
Savage, I., 2007. Trespassing on the Railroad. Prepared for Research in TransportEconomics: Railroad Economics. Elsevier Science, Amsterdam.
sites and characteristics of trespassing behaviour. European Transport ResearchReview, 1, doi:10.1007/s12544-008-0005-y.
Silla, A., Luoma, J. How people assess railway trespassing, submitted for publication.VR Group Ltd, 2010. Combination of information received via personal contacts
September 2, 2009 and July 1, 2010.