effect of tropical cyclones on the stratosphere ... · the north indian ocean during 2007–2013....
TRANSCRIPT

Atmos. Chem. Phys., 16, 8581–8591, 2016www.atmos-chem-phys.net/16/8581/2016/doi:10.5194/acp-16-8581-2016© Author(s) 2016. CC Attribution 3.0 License.
Effect of tropical cyclones on the stratosphere–troposphere exchangeobserved using satellite observations over the north Indian OceanM. Venkat Ratnam1, S. Ravindra Babu2, S. S. Das3, G. Basha1, B. V. Krishnamurthy4, and B. Venkateswararao2
1National Atmospheric Research Laboratory (NARL), Gadanki, India2Centre for Earth, Atmosphere and Weather Modification Technologies (CEA&WMT),Jawaharlal Nehru Technological University, Hyderabad, India3Space Physics Laboratory (SPL), VSSC, Trivandrum, India4CEBROSS, Chennai, India
Correspondence to: M. Venkat Ratnam ([email protected])
Received: 8 December 2015 – Published in Atmos. Chem. Phys. Discuss.: 18 January 2016Revised: 23 June 2016 – Accepted: 27 June 2016 – Published: 15 July 2016
Abstract. Tropical cyclones play an important role in mod-ifying the tropopause structure and dynamics as well asstratosphere–troposphere exchange (STE) processes in theupper troposphere and lower stratosphere (UTLS) region. Inthe present study, the impact of cyclones that occurred overthe north Indian Ocean during 2007–2013 on the STE pro-cesses is quantified using satellite observations. Tropopausecharacteristics during cyclones are obtained from the GlobalPositioning System (GPS) radio occultation (RO) measure-ments, and ozone and water vapour concentrations in theUTLS region are obtained from Aura Microwave LimbSounder (MLS) satellite observations. The effect of cycloneson the tropopause parameters is observed to be more promi-nent within 500 km of the centre of the tropical cyclone. Inour earlier study, we observed a decrease (increase) in thetropopause altitude (temperature) up to 0.6 km (3 K), and theconvective outflow level increased up to 2 km. This changeleads to a total increase in the tropical tropopause layer (TTL)thickness of 3 km within 500 km of the centre of cyclone.Interestingly, an enhancement in the ozone mixing ratio inthe upper troposphere is clearly noticed within 500 km fromthe cyclone centre, whereas the enhancement in the watervapour in the lower stratosphere is more significant on thesouth-east side, extending from 500 to 1000 km away fromthe cyclone centre. The cross-tropopause mass flux for dif-ferent intensities of cyclones is estimated and it is found thatthe mean flux from the stratosphere to the troposphere forcyclonic storms is 0.05± 0.29× 10⁻³ kg m−2, and for verysevere cyclonic storms it is 0.5± 1.07× 10⁻³ kg m−2. More
downward flux is noticed on the north-west and south-westside of the cyclone centre. These results indicate that the cy-clones have significant impact in effecting the tropopausestructure, ozone and water vapour budget, and consequen-tially the STE in the UTLS region.
1 Introduction
The tropical cyclones with deep convective synoptic-scalesystems, persisting for a few days to week, play an impor-tant role in the mass exchange between the troposphere andthe stratosphere, and vice versa (Merrill, 1988; Emmanuel,2005). They transport a large amount of water vapour, energyand momentum to the upper troposphere and lower strato-sphere (UTLS) region (Ray and Rosenlof, 2007). Cyclonesprovide favourable conditions for the entry of the water-vapour-rich and ozone-poor air from the surface to the lowerstratosphere (LS) and dry and ozone-rich air from the LSto the upper troposphere (UT), leading to the stratosphere–troposphere exchange (STE) (Romps and Kuang, 2009; Zhanand Wang, 2012; Vogel et al., 2014). These exchanges occurmainly around the tropopause and change the thermal andchemical structure of the UTLS region. The concentrationof the water vapour transported from troposphere to strato-sphere is controlled by the cold temperatures present at thetropopause, and this is a major factor in the STE (Fueglistaleret al., 2009). As a consequence, the STE events play an im-portant role in controlling the ozone in the UTLS region,
Published by Copernicus Publications on behalf of the European Geosciences Union.

8582 M. Venkat Ratnam et al.: Effect of tropical cyclones on the stratosphere–troposphere exchange
which will affect the radiation budget of the Earth atmo-sphere (IPCC, 1996).
Water vapour has major consequences for the radia-tive balance and heat transport in the atmosphere. En-hanced ozone loss is a secondary effect of increasing wa-ter vapour (Rind and Lonergan, 1995; Forster and Shine,1999; Dvortsov and Solomon, 2001; Forster and Shine, 2002;Myhre et al., 2007; IPCC, 2007). Even very small changesin lower stratospheric water vapour could affect the surfaceclimate (Riese et al., 2012). Soloman et al. (2010) reportedthe role of stratospheric water vapour in global warming. LSwater vapour plays an important role in the distribution ofozone in the lower stratosphere (Shindell, 2001). It is an im-portant contributor for long-term change in the LS tempera-tures (Maycock et al., 2014).
In general, most of the air enters into the stratosphere overthe tropics (Brewer, 1949; Dobson, 1956). As suggested byNewell and Gould-Stewart (1981), the Bay of Bengal (BoB)is one of the most active regions where tropospheric air entersinto the stratosphere. It is also one of the active regions forthe formation of deep-convection-associated cyclones whichcontain strong updrafts. Earlier studies have shown a closerelationship between cyclones and moistening of the uppertroposphere (Wang et al., 1995; Su et al., 2006; Ray andRosenlof, 2007).
Several studies have been carried out related to watervapour and ozone transport, as well as STE processes aroundthe UTLS region during cyclones. Koteswaram (1967) de-scribed the thermal and wind structure of cyclones in theUTLS region, with the major findings of cold core persist-ing just above 15 km and the outflow jets very close to thetropopause. Penn (1965) reported enchantment in ozone andwarmer air situated above the tropopause over the eye re-gion during Hurricane Ginny. Danielsen (1993) reported ontroposphere–stratosphere transport and dehydration in thelower tropical stratosphere during the cyclone period. Barayet al. (1999) studied the STE during Cyclone Marlene andthey observed a maximum of ozone change at 300 hPa level.Zou and Wu (2005) observed the variations of columnarozone in different stages of hurricane by using satellite mea-surements. Bellevue et al. (2007) observed an increase inozone concentration in the upper troposphere during tropi-cal cyclone (TC) events. The significant contribution of cy-clones to the hydration of the UT is reported by Ray andRosenlof (2007), and injection of tropospheric air into thelow stratosphere due to overshooting convection by cyclonesis reported by Romps and Kuang (2009). Das (2009) andDas et al. (2016b) have studied the stratospheric intrusioninto the troposphere during the passage of cyclone by usingmesosphere-stratosphere-troposphere (MST) radar observa-tions. Strong enhancement of ozone in the upper troposphereis observed during TCs over the BoB (Fadnavis et al., 2011).The increased ozone levels in the boundary layer as well asthe near surface by as much as 20 to 30 ppbv due to strongdownward transport of ozone in the tropical convection is
also observed (Betts et al., 2002; Sahu and Lal, 2006; Grantet al., 2008). Cairo et al. (2008) reported that the coldertemperatures are observed in the tropical tropopause layer(TTL) region during Cyclone Davina and also reported onthe impact of the TCs on the UTLS structure and dynam-ics at a regional scale. A detailed review on the effect ofTCs on the UTLS can be found in same report. Recently,Ravindra Babu et al. (2015) reported the effect of cycloneson the tropical tropopause parameters using temperature pro-files obtained from Constellation Observing System for Me-teorology, Ionosphere and Climate (COSMIC) Global Posi-tioning System radio occultation (GPS-RO) measurements.Many studies have been carried out on the role of extratrop-ical cyclones in STE (for example Reutter et al., 2015 andreferences therein), though the quantitative estimates of STEprovided by these case studies varied considerably. How-ever, the vertical and horizontal variation of ozone and watervapour in the UTLS region and cross-tropopause flux quan-tification during cyclones over the north Indian Ocean is notwell investigated.
In the present study, we investigate the spatial and verti-cal variations of ozone and water vapour in the UTLS re-gion for all the cyclones which occurred over the north In-dian Ocean during 2007 to 2013, by using Aura MicrowaveLimb Sounder (MLS) satellite observations. The effect of cy-clones on the tropopause characteristics is also presented us-ing COSMIC GPS-RO measurements. We also present thecross-tropopause mass flux estimated for each of the cy-clones.
2 Data and methodology
In the present study, we used Aura MLS water vapourand ozone measurements (version 3.3) provided by the JetPropulsion Laboratory (JPL). The version 3.3 was released inJanuary 2011 and this updated version has changed in termsof the vertical resolution. The vertical resolution of the watervapour is in the range 2.0 to 3.7 km from 316 to 0.22 hPa,and the along-track horizontal resolution varies from 210 to360 km for pressure greater than 4.6 hPa. For ozone, ver-tical resolution is ∼ 2.5 km and the along-track horizontalresolution varies between 300 and 450 km (Livesey et al.,2011). The Aura MLS gives around 3500 vertical profilesper day and it crosses the Equator at∼ 01:40 and∼ 13:40 lo-cal time. For calculating the cross-tropopause mass flux, weused ERA-Interim winds obtained during cyclone period.
We have taken the cyclone track information data from In-dia Meteorological Department (IMD) observed best trackdata for tropical cyclones from the years 2007–2013. Dur-ing this period, around 50 cyclones formed over the northIndian Ocean. Due to the considerable variability of cyclonelife cycles, for the present study we selected only 16 cyclonesthat lasted for more than 4 days. The tracks of all the cy-clones used for the present study are shown in Fig. 1. Ta-
Atmos. Chem. Phys., 16, 8581–8591, 2016 www.atmos-chem-phys.net/16/8581/2016/

M. Venkat Ratnam et al.: Effect of tropical cyclones on the stratosphere–troposphere exchange 8583
Figure 1. Tropical cyclone tracks of different categories (cy-clonic storm (CS, blue colour), severe cyclonic storm (SCS, or-ange colour), very severe cyclonic storm (VSCS, red colour), andsuper cyclonic storm (SuCS, magenta colour)) that occurred overthe north Indian Ocean during 2007–2013.
ble 1 shows the classification of the cyclones over the northIndian Ocean. The TCs over the north Indian Ocean are clas-sified into different categories by IMD based on their max-imum sustained wind speed. They are classified as (1) lowpressure when the maximum sustained wind speed at thesea surface is < 17 knots (32 km h−1), (2) depression (D) at17–27 knots (32–50 km h−1), (3) deep depression (DD) at28–33 knots (51–59 km h−1), (4) cyclonic storm (CS) at 34–47 knots (60–90 km h−1), (5) severe cyclonic storm (SCS) at48–63 knots (90–110 km h−1), (6) very severe cyclonic storm(VSCS) at 64–119 knots (119–220 km h−1), and (7) super cy-clonic storm (SuCS) at > 119 knots (220 km h−1) (Pattnaikand Rama Rao, 2008). Table 2 shows the different cyclonesused in the present study and their maximum intensity, sus-tained time, and sustained time for the peak intensity periodof each cyclone. The mean sustained time for cyclones thatoccurred during pre-monsoon, monsoon, and post-monsoonseasons is 85.5± 52.4, 122± 46.5, and 112.6± 29.47 h, re-spectively. Out of the16 cyclones, 4 cyclones (CS-1, SCS-2,and VSCS-1)formed during the pre-monsoon season, 3 cy-clones formed during monsoon season (CS-1, VSCS-1, andSuCS-1) and 9 cyclones (CS-1, SCS-2, and VSCS-6) formedduring post-monsoon season (Table 2). Depressions and deepdepressions are not considered. The total available MLS pro-files for each cyclone that are used in the present study arelisted in Table 2. We have 94± 21 mean MLS profiles foreach cyclone used in the present study and when segregatedseason-wise, there are 108± 6, 99± 21, and 88± 23 duringthe monsoon, pre-monsoon, and post-monsoon season, re-spectively. The available total MLS profiles for each cyclonevary with respect to the sustained period of the cyclone andoverall, we have 1517 MLS profiles within 1000 km fromthe cyclone centre from all the 16 cyclones (Fig. 2b). Since
Table 1. IMD classification of cyclonic systems over the north In-dian Ocean.
Intensity of the system Maximum sustained surfacewinds (knots) at sea
(1 knot= 0.5144 m s−1)
Low pressure area < 17Depression 17–27Deep depression (DD) 28–33Cyclonic storm (CS) 34–47Severe cyclonic storm (SCS) 48–63Very severe cyclonic storm (VSCS) 64–119Super cyclonic storm (SuCS) > 119
there are (temporal) limitations in the satellite measurements,mean cross-tropopause flux is only estimated for those casesof the cyclones that lasted for more than 4 days. However,our quantification of the cross-tropopause flux will not be af-fected by this limitation as earlier studies revealed that themaximum STE occurs during the mature to peak stage of thecyclone. Details on the selection of 16 cyclones are presentedin Ravindra Babu et al. (2015). In Fig. 1, different colours in-dicate different categories of the cyclones.
Tropopause characteristics observed during cyclones
As mentioned earlier, in the tropical region, the amount ofwater vapour transported into the lower stratosphere from thetroposphere is controlled by the cold tropical tropopause tem-peratures (Fueglistaler et al., 2009). Large convection aroundthe eye of the cyclone and strong updrafts near the eye walltransports a large amount of water vapour into the lowerstratosphere through the tropopause. In this way, cycloneswill affect the tropopause structure (altitude/temperature).Thus, before quantification of STE, we show the tropopausecharacteristics observed during the TCs. We used post-processed products of level 2 dry temperature profiles withvertical resolution around 200 m provided by the COSMICData Analysis and Archival Center (CDAAC) for estimat-ing the tropopause parameters during cyclones in the periodfrom 2007 to 2013. COSMIC GPS-RO is a constellation ofsix microsatellites equipped with GPS receivers (Anthes etal., 2008). We also used CHAllenging Minisatellite Payload(CHAMP) GPS-RO data that are available between the years2002 and 2006 and COSMIC data from 2007 to 2013 forobtaining background climatology of tropopause parametersover the north Indian Ocean.
The climatological mean of all the tropopause parametersis obtained by combining GPS-RO measurements obtainedfrom CHAMP and COSMIC (2002–2013). The tropopauseparameters include cold-point tropopause altitude (CPH) andtemperature (CPT), lapse rate tropopause altitude (LRH)and temperature (LRT), and the thickness of the tropicaltropopause layer (TTL), defined as the layer between con-vective outflow level (COH) and CPH, and these parameters
www.atmos-chem-phys.net/16/8581/2016/ Atmos. Chem. Phys., 16, 8581–8591, 2016

8584 M. Venkat Ratnam et al.: Effect of tropical cyclones on the stratosphere–troposphere exchange
Table 2. Tropical cyclones which occurred during different seasons, cyclone name, cyclone intensity (CI), cyclone period, total sustainedtime, sustained time with maximum intensity, and total number of available MLS profiles.
Season Cyclone name Cyclone Cyclone Total sustained Sustained time with Total availableintensity (CI) period (days) time (h) maximum intensity (h) MLS profiles
Monsoon 03B (2007) CS > 4 75 6 104(JJA) PHET (2010) VSCS > 4 168 42 116
Gonu (2007) SuCS > 4 123 72 105
Pre-monsoon Mahasen (2013) CS > 4 24 24 119(MAM) Aila (2009) SCS 4 72 9 79
Laila (2010) SCS 4 96 27 82Nargis (2008) VSCS > 4 150 87 118
Post-monsoon Nilam (2012) CS > 4 102 36 52(SON) Jal (2010) SCS 4 99 30 75
Helen (2013) SCS 4 78 30 72Giri (2010) VSCS 4 66 15 65Phailin (2013) VSCS > 4 147 66 111Leher (2013) VSCS > 4 114 36 111SIDR (2007) VSCS > 4 138 72 114
Winter Madi (2013) VSCS > 4 150 36 104(DJF) Thane (2011) VSCS > 4 120 36 90
Figure 2. Cyclone-centred composite of total available (a) COSMIC GPS RO occultations and (b) MLS profiles obtained from all the16 cyclones that are used in the present study.
are calculated for each profile of GPS-RO collected duringthe above-mentioned period. First, we separated the RO pro-files available with respect to distance away from the cy-clone centre, around 1000 km for an individual cyclone foreach day of the respective cyclone. After separating, we cal-culated the tropopause parameters as mentioned above foreach RO profile. The total number of occultations used inthe present study is shown in Fig. 2a. Then we separated thetropopause parameters with respect to the different cycloneintensity. After estimating the tropopause parameters for allthe 16 TCs with respect to different intensity, a cyclone-centre composite of all tropopause parameters is obtained.After careful analysis, it is found that there is not muchvariation in the tropopause parameters observed between Dand DD, and between CS and SCS, and thus they are com-
bined to DD and CS, respectively. To quantify the effect ofthe TCs on the tropopause characteristics, the climatologi-cal mean is removed from the individual tropopause parame-ters. The climatological mean tropopause parameters is esti-mated from the temperature profiles obtained by using GPS-RO data from 2002 to 2013. We also calculated the differ-ence of tropopause parameters for different cyclone inten-sities (figures are not shown). Figure 3 shows the cyclone-centred composite of the mean difference in the tropopauseparameters (CPH, LRH, CPT, LRT, COH, and TTL thick-ness) between climatological mean (2002–2013) and indi-vidual tropopause parameters observed during cyclones (ir-respective of cyclone intensity), and more detailed results onthe effect of TCs on the tropopause variations and mean tem-perature structure in UTLS region during TCs can be found
Atmos. Chem. Phys., 16, 8581–8591, 2016 www.atmos-chem-phys.net/16/8581/2016/

M. Venkat Ratnam et al.: Effect of tropical cyclones on the stratosphere–troposphere exchange 8585
Figure 3. Cyclone-centred composite of mean difference in thetropopause parameters between climatological mean (2002–2013)and individual tropopause parameters observed during cyclones (ir-respective of cyclone intensity) in (a) CPH (km), (b) LRH (km),(c) CPT (K), (d) LRT (K), (e) COH (km), and (f) TTL thickness(km). Black circles are drawn to show distances 250, 500, 750, and1000 km away from the cyclone centre.
in Ravindra Babu et al. (2015). We have reported that theCPH (LRH) is lowered by 0.6 km (0.4 km) in most of theareas within a 500 km radius of the cyclone centre, and thetemperature (CPT/LRT) is more or less colder or equal tothe climatological values from the area around 1000 km fromthe cyclone centre. Note that the effect of a cyclone can befelt up to 2000 km away but since the latitudinal variationalso comes into the picture when we consider a 2000 km ra-dius, we restrict our discussion related to variability to within1000 km of the cyclone centre. COH (TTL thickness) has in-creased (reduced) up to 2 km within 500 km of the cyclonesand in some areas up to 1000 km. Note that this decreasein TTL thickness is not only because of pushing up of theCOH but also due to a decrease of CPH. From the aboveresults, we concluded that the tropical tropopause is signifi-cantly affected by the cyclones and the effect is more promi-nent within 500 km of the cyclone centre. These changes inthe tropopause parameters are expected to influence watervapour and ozone transport in the UTLS region during cy-clones.
3 Results and discussion
3.1 Ozone variability in the UTLS region duringcyclones
To see the variability and the transport of ozone during thepassage of cyclones, we investigate the spatial and verticalvariability of ozone in the UTLS region using MLS satelliteobservations. As mentioned in Sect. 2.1, we also separatedthe MLS profiles based on the distance from the TC centrefor each day of the individual cyclone. From all the 16 cy-clone cases, we separated the available MLS profiles withrespect to distance from the cyclone centre, around 1000 km,and we also separated the MLS profiles with respect to dif-ferent intensities of the cyclones. Figure 4 shows the normal-ized cyclone-centred composite of mean ozone mixing ra-tio (OMR) observed during cyclones (irrespective of cycloneintensity) at 82, 100, 121, and 146 hPa pressure levels dur-ing 2007–2013. Note that we have a reasonable number ofMLS profiles (1517) from 16 cyclones to generate the mean-ingful cyclone-centre composite of ozone. Black circles aredrawn to show distances 250, 500, 750, and 1000 km awayfrom the cyclone centre. Since large variability in OMR isnoticed from one pressure level to another, we normalizedthe values to the highest OMR value at a given pressurelevel. The highest OMR values at 82, 100, 121, and 146 hPapressure levels are 0.38, 0.28, 0.19, and 0.13 ppmv, respec-tively. Large spatial variations in the OMR are observedwith respect to the cyclone centre. At 82 hPa, higher OMR(∼ 0.4 ppmv) in the south-west (SW) side up to 1000 km andcomparatively low OMR values (∼ 0.2 ppmv) are noticed inthe north of the cyclone centre. At 100 hPa, an increase in theOMR (∼ 0.2 ppmv) near the cyclone centre within 500 kmis clearly observed. This enhancement in OMR extends upto 146 hPa and is more prominent slightly to the westernand eastern side of the cyclone. In general, the large subsi-dence located at the top of the cyclone centre is expectedto bring lower stratospheric ozone to the upper troposphere.This might be the reason for the enhancement of ozone in thecyclone centre within 500 km. Several earlier studies have re-ported on the intrusion of the stratospheric air into the tropo-sphere due to the subsidence in the eye region (Penn, 1965;Baray et al., 1999; Das et al., 2009, 2016a). The present re-sults also support this aspect that the detrainment of ozonewhich reached 146 hPa might be due to strong subsidence.Interestingly, an enhancement in OMR in the south-east (SE)side at 121 hPa, but not at either 100 or at 146 hPa, can benoticed; this needs to be investigated further. Thus, in gen-eral, higher ozone concentrations are observed at the cyclonecentre within 500 km and are slightly aligned to the westernside of the cyclone centre.
In order to quantify the impact of cyclones on UTLS ozonemore clearly, we have obtained anomalies by subtractingthe mean cyclone-centred ozone observed during cyclonesfrom the background climatology of UTLS ozone that is
www.atmos-chem-phys.net/16/8581/2016/ Atmos. Chem. Phys., 16, 8581–8591, 2016

8586 M. Venkat Ratnam et al.: Effect of tropical cyclones on the stratosphere–troposphere exchange
Figure 4. Normalized cyclone-centred composite of mean ozonemixing ratio observed during cyclones (irrespective of cyclone in-tensity) at (a) 82, (b) 100, (c) 121, and (d) 146 hPa levels by MLSduring 2007–2013. (e–h) Same as panels (a–d) but for normalizedmean difference in the ozone mixing ratio between climatologicalmean (2007–2013) and individual events. Black circles are drawn toshow distances 250, 500, 750, and 1000 km away from the cyclonecentre. Sectors showing C1 (NW), C2 (NE), C3 (SW), and C4 (SE)are also shown in panel (a).
calculated by using the total available MLS profiles from2007 to 2013. Figure 4e–h show the normalized mean differ-ence of cyclone-centred ozone obtained after removing thebackground climatology values for different pressure levelsshown in Fig. 4a–d. The maximum difference in OMR forcorresponding normalized value at 82, 100, 121, and 146 hPapressure levels is −0.089, −0.19, −0.09, and −0.06 ppmv,respectively. Enhancement in the OMR (∼ 0.1 ppmv) up to1000 km from the cyclone centre is observed at 82 hPa. In-terestingly, at 100 hPa, the OMR is more or less uniformthroughout the radius 1000 km of the cyclone centre except∼ 500 km radius from the centre where significant increaseof OMR (∼ 0.2 ppmv) is observed. This increase in the OMRis within 500 km of the cyclone centre and it extends up to121 hPa. However, enhancement in OMR at 146 hPa extendsup to 1000 km but is distributed towards eastern and westernsides of the cyclone centre. Thus, it is clear that the detrain-ment of lower stratospheric ozone will reach up to 146 hPaduring the cyclone period due to the presence of strong sub-sidence in the cyclone centre. We also calculated the cyclone-centre composite of ozone based on different cyclone inten-sities such as DD, SCS, and VSCS. After carefully going
through them, we have found that this detrainment of ozonereaching up to 146 hPa is more in the higher intensity pe-riod of the TCs. We do not know what happens below thispressure level due to limitation in the present data; however,studies (Das et al., 2016a; Jiang et al., 2015) have shownthat LS ozone can reach as low as the boundary layer dur-ing cyclones. It will be interesting to see the variability inthe water vapour, as a large amount of it is expected to crossthe tropopause during the cyclone period and reach the lowerstratosphere.
3.2 Water vapour variability in the UTLS regionduring cyclones
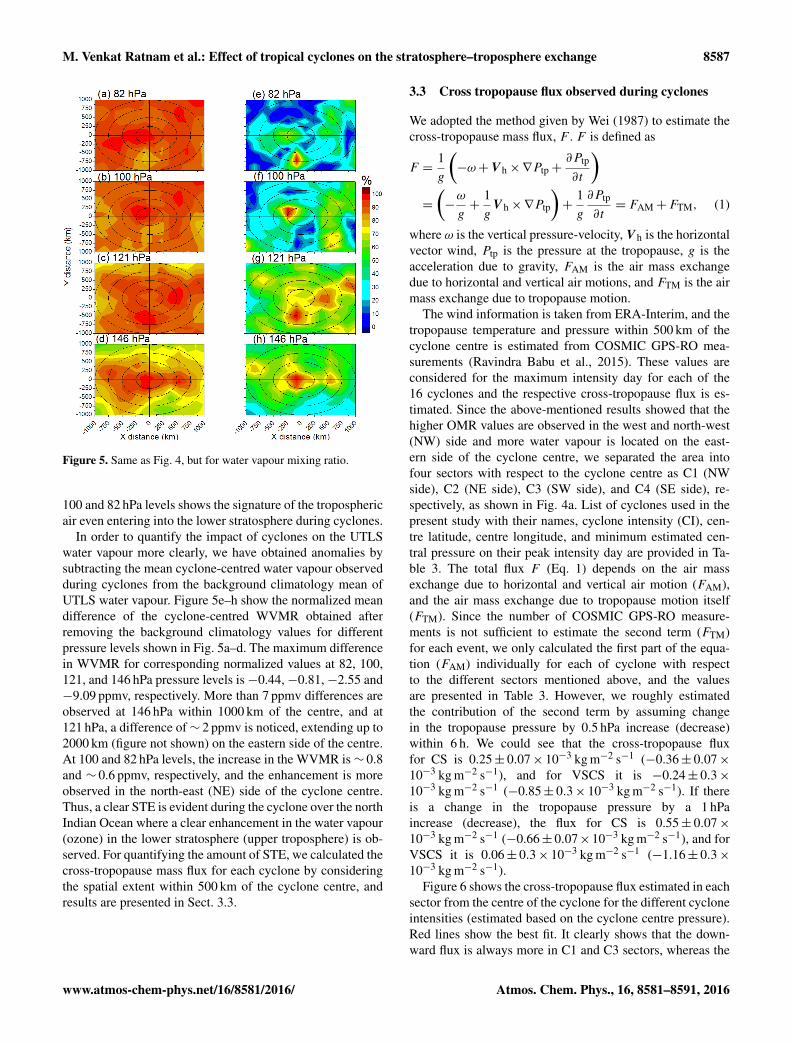
As mentioned earlier, an enormous amount of water vapouris expected to be pumped from the lower troposphere to theupper troposphere, and it can even penetrate into the lowerstratosphere during cyclones. To see the linkage betweentropopause variability and the transport of water vapour dur-ing cyclones, we investigated the horizontal and vertical vari-ability of water vapour in the UTLS region using MLS satel-lite observations. Figure 5 shows the normalized cyclone-centred composite of mean water vapour mixing ratio ob-served during cyclones (irrespective of cyclone intensity) at82, 100, 121, and 146 hPa pressure levels observed by MLSduring 2007–2013. Black circles are drawn to show distances250, 500, 750, and 1000 km away from the cyclone cen-tre. The highest water vapour mixing ratio (WVMR) val-ues for corresponding normalized values at 82, 100, 121, and146 hPa pressure levels are 4.44, 4.49, 6.9, and 16.03 ppmv,respectively. Significantly higher WVMR values are noticed,extending from 500 up to 1000 km from the cyclone centreat 121 (∼ 6.5 ppmv) and 146 hPa (∼ 15 ppmv) levels, withmore prominence on the eastern side of the cyclone centre.Comparatively low values are noticed in the centre of the cy-clone, especially at 121 hPa. These results compare well withhigher WVMR observed on the eastern side of cyclones overAtlantic and Pacific oceans (Ray and Rosenlof, 2007). Theseresults also compare well with those reported by RavindraBabu et al. (2015), who used GPS-RO measured relative hu-midity (RH) and found enhancement in RH on the easternside of the centre in the upper troposphere (10–15 km) overthe north Indian Ocean. Higher WVMR values observed onthe eastern side of the cyclone centre might be due to theupper level anticyclonic circulation over the cyclones. It isinteresting to note that high WVMR lies not at the centre butextends from 500 to 1000 km away from the centre of thecyclone. The WVMR is higher at 121 and 146 hPa than at100 and 82 hPa. It seems less water vapour has been trans-ported to 100 and 82 hPa from below. As we know, watervapour mostly originates from the lower troposphere and de-creases with height. Therefore, vertical transport of watervapour from the lower troposphere to the UTLS may lead towater vapour enhanced at 121 and 146 hPa, and at some time,it reaches higher altitudes. The higher WVMR presented at
Atmos. Chem. Phys., 16, 8581–8591, 2016 www.atmos-chem-phys.net/16/8581/2016/
M. Venkat Ratnam et al.: Effect of tropical cyclones on the stratosphere–troposphere exchange 8587
Figure 5. Same as Fig. 4, but for water vapour mixing ratio.
100 and 82 hPa levels shows the signature of the troposphericair even entering into the lower stratosphere during cyclones.
In order to quantify the impact of cyclones on the UTLSwater vapour more clearly, we have obtained anomalies bysubtracting the mean cyclone-centred water vapour observedduring cyclones from the background climatology mean ofUTLS water vapour. Figure 5e–h show the normalized meandifference of the cyclone-centred WVMR obtained afterremoving the background climatology values for differentpressure levels shown in Fig. 5a–d. The maximum differencein WVMR for corresponding normalized values at 82, 100,121, and 146 hPa pressure levels is−0.44,−0.81,−2.55 and−9.09 ppmv, respectively. More than 7 ppmv differences areobserved at 146 hPa within 1000 km of the centre, and at121 hPa, a difference of∼ 2 ppmv is noticed, extending up to2000 km (figure not shown) on the eastern side of the centre.At 100 and 82 hPa levels, the increase in the WVMR is∼ 0.8and ∼ 0.6 ppmv, respectively, and the enhancement is moreobserved in the north-east (NE) side of the cyclone centre.Thus, a clear STE is evident during the cyclone over the northIndian Ocean where a clear enhancement in the water vapour(ozone) in the lower stratosphere (upper troposphere) is ob-served. For quantifying the amount of STE, we calculated thecross-tropopause mass flux for each cyclone by consideringthe spatial extent within 500 km of the cyclone centre, andresults are presented in Sect. 3.3.
3.3 Cross tropopause flux observed during cyclones
We adopted the method given by Wei (1987) to estimate thecross-tropopause mass flux, F . F is defined as
F =1g
(−ω+V h×∇Ptp+
∂Ptp
∂t
)=
(−
ω
g+
1g
V h×∇Ptp
)+
1g
∂Ptp
∂t= FAM+FTM, (1)
where ω is the vertical pressure-velocity, V h is the horizontalvector wind, Ptp is the pressure at the tropopause, g is theacceleration due to gravity, FAM is the air mass exchangedue to horizontal and vertical air motions, and FTM is the airmass exchange due to tropopause motion.
The wind information is taken from ERA-Interim, and thetropopause temperature and pressure within 500 km of thecyclone centre is estimated from COSMIC GPS-RO mea-surements (Ravindra Babu et al., 2015). These values areconsidered for the maximum intensity day for each of the16 cyclones and the respective cross-tropopause flux is es-timated. Since the above-mentioned results showed that thehigher OMR values are observed in the west and north-west(NW) side and more water vapour is located on the east-ern side of the cyclone centre, we separated the area intofour sectors with respect to the cyclone centre as C1 (NWside), C2 (NE side), C3 (SW side), and C4 (SE side), re-spectively, as shown in Fig. 4a. List of cyclones used in thepresent study with their names, cyclone intensity (CI), cen-tre latitude, centre longitude, and minimum estimated cen-tral pressure on their peak intensity day are provided in Ta-ble 3. The total flux F (Eq. 1) depends on the air massexchange due to horizontal and vertical air motion (FAM),and the air mass exchange due to tropopause motion itself(FTM). Since the number of COSMIC GPS-RO measure-ments is not sufficient to estimate the second term (FTM)for each event, we only calculated the first part of the equa-tion (FAM) individually for each of cyclone with respectto the different sectors mentioned above, and the valuesare presented in Table 3. However, we roughly estimatedthe contribution of the second term by assuming changein the tropopause pressure by 0.5 hPa increase (decrease)within 6 h. We could see that the cross-tropopause fluxfor CS is 0.25± 0.07× 10⁻³ kg m−2 s−1 (−0.36± 0.07×10⁻³ kg m−2 s−1), and for VSCS it is −0.24± 0.3×10⁻³ kg m−2 s−1 (−0.85± 0.3× 10⁻³ kg m−2 s−1). If thereis a change in the tropopause pressure by a 1 hPaincrease (decrease), the flux for CS is 0.55± 0.07×10⁻³ kg m−2 s−1 (−0.66± 0.07×10⁻³ kg m−2 s−1), and forVSCS it is 0.06± 0.3× 10⁻³ kg m−2 s−1 (−1.16± 0.3×10⁻³ kg m−2 s−1).
Figure 6 shows the cross-tropopause flux estimated in eachsector from the centre of the cyclone for the different cycloneintensities (estimated based on the cyclone centre pressure).Red lines show the best fit. It clearly shows that the down-ward flux is always more in C1 and C3 sectors, whereas the
www.atmos-chem-phys.net/16/8581/2016/ Atmos. Chem. Phys., 16, 8581–8591, 2016
8588 M. Venkat Ratnam et al.: Effect of tropical cyclones on the stratosphere–troposphere exchange
Table 3. Cyclone name, cyclone intensity (CI), centre latitude, centre longitude, estimated central pressure, and estimated cross-tropopausemass flux, with respect to cyclone centre for C1 (NW side), C2 (NE side), C3 (SW side), and C4 (SE side), respectively.
Flux at 500 km
Cyclone CI Centre Centre Estimated central C1 C2 C3 C4latitude longitude pressure (hPa)
03B CS 23.5 66 986 (25 Jun 2007) −0.013 0.661 −0.603 −0.258Aila SCS 22 88 968 (25 May 2009) 1.90× 10⁻⁴ 0.191 −0.299 −0.072Helen SCS 16.1 82.7 990 (21 Nov 2013) 0.025 0.216 −0.095 −0.11Jal SCS 11 84 988(6 Nov 2010) 0.025 0.384 −0.4 −0.218Laila SCS 14.5 81 986 (19 May 2010) −0.012 0.123 −0.352 −0.299Mahasen CS 18.5 88.5 990 (15 May 2013) −0.006 0.354 −0.473 −0.256Nilam CS 11.5 81 990 (31 Oct 2012) 0.016 0.313 −0.274 −0.097Nargis VSCS 16 94 962 (2 May 2008) −0.828 0.094 −1.946 0.384Giri VSCS 19.8 93.5 950 (22 Oct 2010) −0.518 0.022 −0.823 0.032Gonu SuCS 20 64 920 (4 Jun 2007) −0.502 0.123 −2.563 0.37Lehar VSCS 13.2 87.5 980 (26 Nov 2013) −0.55 0.119 −2.019 0.411Madi VSCS 13.4 84.7 986 (10 Dec 2013) −0.375 0.054 −1.449 0.352Phailin VSCS 18.1 85.7 940 (11 Oct 2013) −0.9 0.179 −2.576 0.479Phet VSCS 18 60.5 964 (2 Jun 2010) −1.058 0.203 −2.698 0.559SIDR VSCS 19.5 89 944 (15 Nov 2007) −0.493 0.066 −0.926 0.231Thane VSCS 11.8 80.6 970 (29 Dec 2011) −1.272 0.356 −2.979 0.558
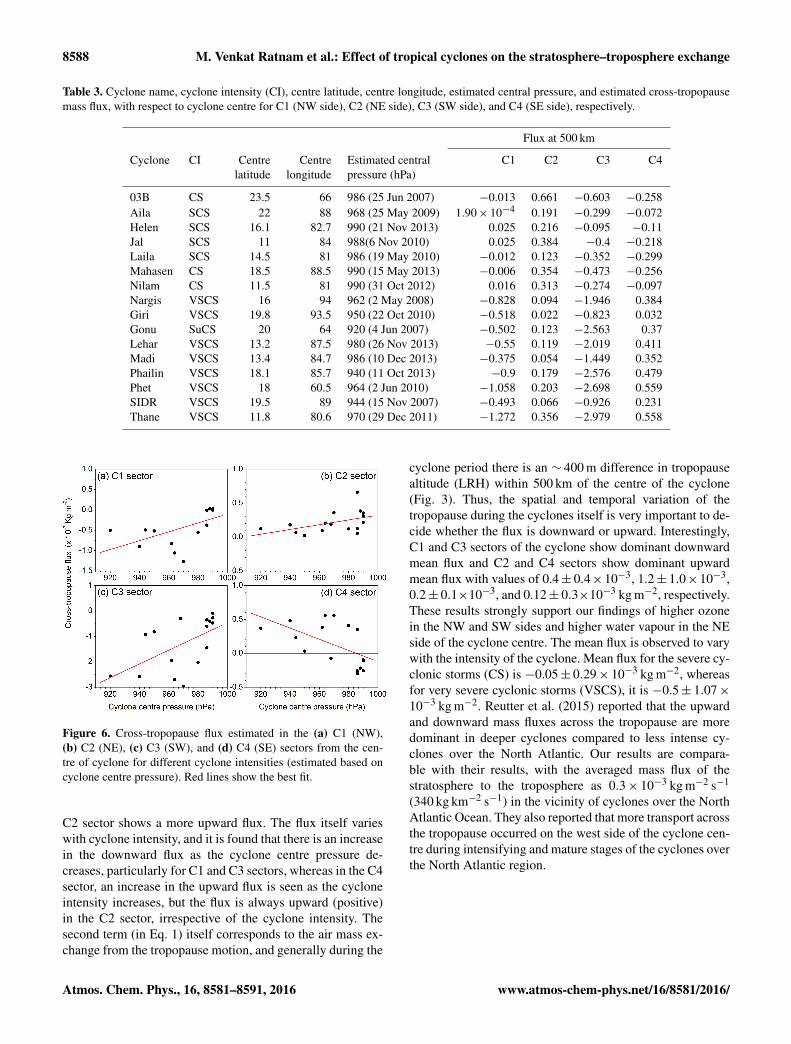
Figure 6. Cross-tropopause flux estimated in the (a) C1 (NW),(b) C2 (NE), (c) C3 (SW), and (d) C4 (SE) sectors from the cen-tre of cyclone for different cyclone intensities (estimated based oncyclone centre pressure). Red lines show the best fit.
C2 sector shows a more upward flux. The flux itself varieswith cyclone intensity, and it is found that there is an increasein the downward flux as the cyclone centre pressure de-creases, particularly for C1 and C3 sectors, whereas in the C4sector, an increase in the upward flux is seen as the cycloneintensity increases, but the flux is always upward (positive)in the C2 sector, irrespective of the cyclone intensity. Thesecond term (in Eq. 1) itself corresponds to the air mass ex-change from the tropopause motion, and generally during the
cyclone period there is an ∼ 400 m difference in tropopausealtitude (LRH) within 500 km of the centre of the cyclone(Fig. 3). Thus, the spatial and temporal variation of thetropopause during the cyclones itself is very important to de-cide whether the flux is downward or upward. Interestingly,C1 and C3 sectors of the cyclone show dominant downwardmean flux and C2 and C4 sectors show dominant upwardmean flux with values of 0.4± 0.4×10⁻³, 1.2± 1.0×10−3,0.2± 0.1×10⁻³, and 0.12± 0.3×10⁻³ kg m−2, respectively.These results strongly support our findings of higher ozonein the NW and SW sides and higher water vapour in the NEside of the cyclone centre. The mean flux is observed to varywith the intensity of the cyclone. Mean flux for the severe cy-clonic storms (CS) is −0.05± 0.29× 10⁻³ kg m−2, whereasfor very severe cyclonic storms (VSCS), it is −0.5± 1.07×10⁻³ kg m−2. Reutter et al. (2015) reported that the upwardand downward mass fluxes across the tropopause are moredominant in deeper cyclones compared to less intense cy-clones over the North Atlantic. Our results are compara-ble with their results, with the averaged mass flux of thestratosphere to the troposphere as 0.3× 10⁻³ kg m−2 s−1
(340 kg km−2 s−1) in the vicinity of cyclones over the NorthAtlantic Ocean. They also reported that more transport acrossthe tropopause occurred on the west side of the cyclone cen-tre during intensifying and mature stages of the cyclones overthe North Atlantic region.
Atmos. Chem. Phys., 16, 8581–8591, 2016 www.atmos-chem-phys.net/16/8581/2016/
M. Venkat Ratnam et al.: Effect of tropical cyclones on the stratosphere–troposphere exchange 8589
4 Summary and conclusions
In this study, we have investigated the vertical and spatialvariability of ozone and water vapour in the UTLS regionduring the passage of cyclones which occurred between 2007and 2013 over the north Indian Ocean, by using Aura MLSsatellite observations. In order to make a quantitative esti-mate of the impact of cyclones on the ozone and water vapourbudget in the UTLS region, we removed the mean cyclone-centre ozone and water vapour from the climatological meancalculated using MLS data from 2007 to 2013. We estimatedthe mean cross-tropopause flux for each of the cyclones ontheir peak intensity day. The main findings are summarizedbelow.
1. A lowering of the CPH (0.6 km) and LRH (0.4 km) val-ues with the coldest CPT and LRT (2–3 K) within a500 km radius of the cyclone centre is noticed. A higher(2 km) COH leading to the lowering of TTL thick-ness (∼ 3 km) is clearly observed (Ravindra Babu et al.,2015).
2. The impact of cyclones on ozone and the tropopause(altitude/temperature) is more prominent within 500 kmof the cyclone centre, whereas it is high from 500 to1000 km in the case of water vapour.
3. Detrainment of ozone is highest in the cyclone cen-tre (within 500 km of the centre) due to strong sub-sidence above the cyclone centre, and this detrainedozone reaches as low as the 146 hPa level (∼ 13–14 km).
4. The detrainment of ozone is higher in the higher inten-sity period (SCS or VSCS) of the cyclone compared tothe low-intensity period (D or DD).
5. Interestingly, significant enhancement in the lowerstratospheric (82 hPa) water vapour is noticed in the eastand SE side of the cyclone centre.
6. Dominant downward (upward) cross-tropopause flux isobserved in C1 (NW) and C3 (SW) (C2 (NE) and C4(SE)) sectors of the cyclone.
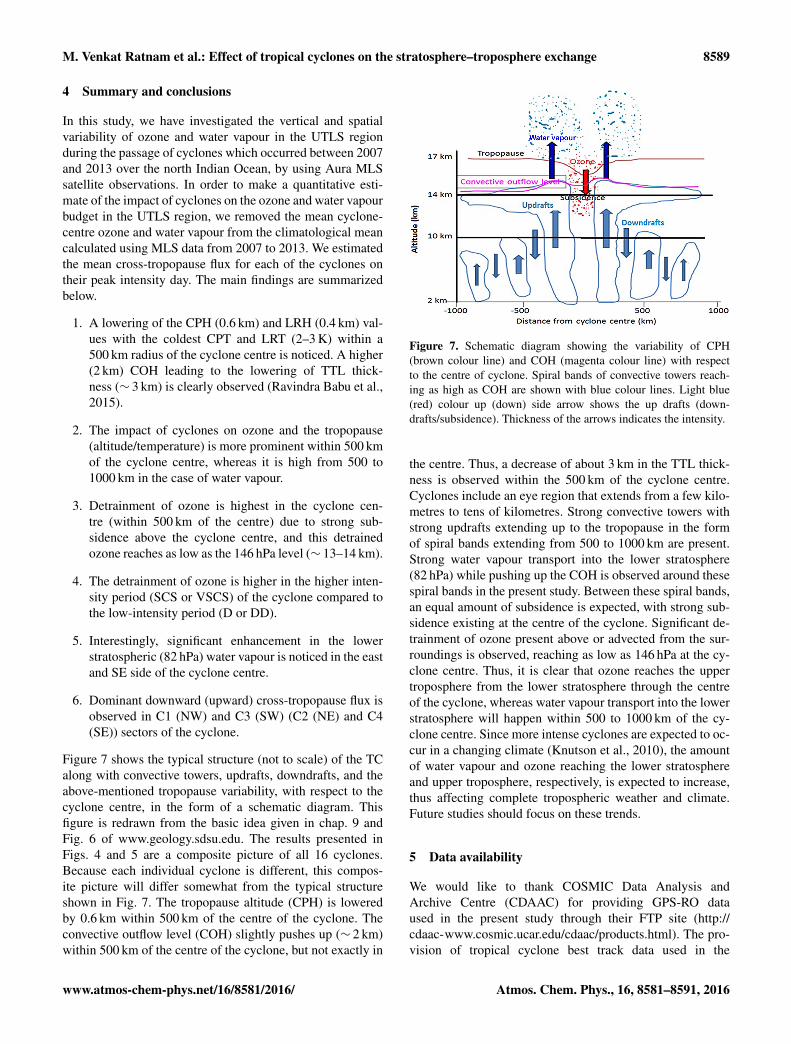
Figure 7 shows the typical structure (not to scale) of the TCalong with convective towers, updrafts, downdrafts, and theabove-mentioned tropopause variability, with respect to thecyclone centre, in the form of a schematic diagram. Thisfigure is redrawn from the basic idea given in chap. 9 andFig. 6 of www.geology.sdsu.edu. The results presented inFigs. 4 and 5 are a composite picture of all 16 cyclones.Because each individual cyclone is different, this compos-ite picture will differ somewhat from the typical structureshown in Fig. 7. The tropopause altitude (CPH) is loweredby 0.6 km within 500 km of the centre of the cyclone. Theconvective outflow level (COH) slightly pushes up (∼ 2 km)within 500 km of the centre of the cyclone, but not exactly in
Figure 7. Schematic diagram showing the variability of CPH(brown colour line) and COH (magenta colour line) with respectto the centre of cyclone. Spiral bands of convective towers reach-ing as high as COH are shown with blue colour lines. Light blue(red) colour up (down) side arrow shows the up drafts (down-drafts/subsidence). Thickness of the arrows indicates the intensity.
the centre. Thus, a decrease of about 3 km in the TTL thick-ness is observed within the 500 km of the cyclone centre.Cyclones include an eye region that extends from a few kilo-metres to tens of kilometres. Strong convective towers withstrong updrafts extending up to the tropopause in the formof spiral bands extending from 500 to 1000 km are present.Strong water vapour transport into the lower stratosphere(82 hPa) while pushing up the COH is observed around thesespiral bands in the present study. Between these spiral bands,an equal amount of subsidence is expected, with strong sub-sidence existing at the centre of the cyclone. Significant de-trainment of ozone present above or advected from the sur-roundings is observed, reaching as low as 146 hPa at the cy-clone centre. Thus, it is clear that ozone reaches the uppertroposphere from the lower stratosphere through the centreof the cyclone, whereas water vapour transport into the lowerstratosphere will happen within 500 to 1000 km of the cy-clone centre. Since more intense cyclones are expected to oc-cur in a changing climate (Knutson et al., 2010), the amountof water vapour and ozone reaching the lower stratosphereand upper troposphere, respectively, is expected to increase,thus affecting complete tropospheric weather and climate.Future studies should focus on these trends.
5 Data availability
We would like to thank COSMIC Data Analysis andArchive Centre (CDAAC) for providing GPS-RO dataused in the present study through their FTP site (http://cdaac-www.cosmic.ucar.edu/cdaac/products.html). The pro-vision of tropical cyclone best track data used in the
www.atmos-chem-phys.net/16/8581/2016/ Atmos. Chem. Phys., 16, 8581–8591, 2016
8590 M. Venkat Ratnam et al.: Effect of tropical cyclones on the stratosphere–troposphere exchange
present study by IMD through their website (http://www.rsmcnewdelhi.imd.gov.in) and Aura MLS observations ob-tained from the GES DISC through their FTP site (https://mls.jpl.nasa.gov/index-eos-mls.php) is highly acknowl-edged.
Acknowledgements. This work is supported by the Indian SpaceResearch Organization (ISRO) through CAWSES India Phase-IITheme 3 programme. The authors would like to thank the editor,Rolf Müller, and three anonymous reviewers whose commentshelped considerably in improving the quality of this paper.
Edited by: R. MüllerReviewed by: three anonymous referees
References
Anthes, R. A., Bernhardt, P. A., Chen, Y., Cucurull, L., Dymond,K. F., Ector, D., Healy, S. B., Ho, S.-H., Hunt, D. C., Kuo, Y.-H.,Liu, H., Manning, K., McCormick, C., Meehan, T. K., Randel, W.J., Rocken, C., Schreiner, W. S., Sokolovskiy, S. V., Syndergaard,S., Thompson, D. C., Trenberth, K. E., Wee, T.-K., Yen, N. L.,and Zeng, Z.: The COSMIC/Formosat/3 mission: Early results,B. Am. Meteorol. Soc., 89, 313–333, 2008.
Baray, J. L., Ancellet, G., Radriambelo T., and Baldy, S.: Tropi-cal cyclone Marlene and stratosphere-troposphere exchange, J.Geophys. Res., 104, 13953–13970, doi:10.1029/1999JD900028,1999.
Bellevue, J., Baray, J. L., Baldy, S., Ancellet, G., Diab, R. D., andRavetta, F.: Simulations of stratospheric to tropospheric transportduring the tropical cyclone Marlene event, Atmos. Environ., 41,6510–6526, doi:10.1016/j.atmosenv.2007.04.040, 2007.
Betts, A. K., Gatti, L. V., Cordova, A. M., Silva Dias, M. A.F., and Fuentes, J. D.: Transport of ozone to the surface byconvective downdrafts at night, J. Geophys. Res., 107, 8046,doi:10.1029/2000JD000158, 2002.
Brewer, A. W.: Evidence for a world circulation provided bythe measurements of helium and water vapor distributionin the stratosphere, Q. J. Roy. Meteor. Soc., 75, 351–363,doi:10.1002/qj.49707532603, 1949.
Cairo, F., Buontempo, C., MacKenzie, A. R., Schiller, C., Volk,C. M., Adriani, A., Mitev, V., Matthey, R., Di Donfrancesco,G., Oulanovsky, A., Ravegnani, F., Yushkov, V., Snels, M.,Cagnazzo, C., and Stefanutti, L.: Morphology of the tropopauselayer and lower stratosphere above a tropical cyclone: a casestudy on cyclone Davina (1999), Atmos. Chem. Phys., 8, 3411–3426, doi:10.5194/acp-8-3411-2008, 2008.
Danielsen, E. F.: In situ evidence of rapid, vertical, irreversibletransport of lower tropospheric air into the lower tropical strato-sphere by convective cloud turrets and by larger-scale up-welling in tropical cyclones, J. Geophys. Res., 98, 8665–8681,doi:10.1029/92JD02954, 1993.
Das, S. S.: A new perspective on MST radar observa-tions of stratospheric intrusions into troposphere associatedwith tropical cyclone, Geophys. Res. Lett., 36, L15821,doi:10.1029/2009GL039184, 2009.
Das, S. S., Ratnam, M. V., Uma, K. N., Subrahmanyam, K. V.,Girach, I. A., Patra, A. K., Aneesh, S., Suneeth, K. V., Kumar,K. K., Kesarkar, A. P., Sijikumar, S., and Ramkumar, G.: Influ-ence of tropical cyclones on tropospheric ozone: possible impli-cations, Atmos. Chem. Phys., 16, 4837–4847, doi:10.5194/acp-16-4837-2016, 2016a.
Das, S. S., Ratnam, M. V., Uma, K. N., Patra, A. K., Subrah-manyam, K. V., Girach, I. A., Suneeth, K. V., Kumar, K. K., andRamkumar, G.: Stratospheric intrusion into the troposphere dur-ing the tropical cyclone Nilam (2012), Q. J. Roy. Meteor. Soc.,doi:10.1002/qj.2810, 2016b.
Dobson, G. M. B.: Origin and Distribution of the PolyatomicMolecules in the Atmosphere, Proc. R. Soc. Lon. Ser. A, 236,187–193, doi:10.1098/rspa.1956.0127, 1956.
Dvortsov, V. L. and Solomon, S.: Response of the stratospheric tem-peratures and ozone to past and future increases in stratospherichumidity, J. Geophys. Res., 106, 7505–7514, 2001.
Emanuel, K. A.: Increasing destructiveness of tropical cy-clones over the past 30 years, Nature, 436, 686–688,doi:10.1038/nature03906, 2005.
Fadnavis, S., Berg, G., Buchunde, P., Ghude, S. D., and Krish-namurti, T. N.: Vertical transport of ozone and CO during su-per cyclones in the Bay of Bengal as detected by TroposphericEmission Spectrometer, Environ. Sci. Pollut. R., 18, 301–315,doi:10.1007/s11356-010-0374-3, 2011.
Forster, P. M. de F. and Shine, K. P.: Stratospheric water vapourchanges as a possible contributor to observed stratospheric cool-ing, Geophys. Res. Lett., 26, 3309–3312, 1999.
Forster, P. M. de F. and Shine, K. P.: Assessing the climate impactsof trends in stratospheric water vapour, Geophys. Res. Lett., 29,1086–1089, doi:10.1029/2001GL013909, 2002.
Fueglistaler, S., Dessler, A. E., Dunkerton, T. J., Fu, I., Folkins, Q.,and Mote, P. W.: Tropical tropopause layer, Rev. Geophys., 47,RG1004, doi:10.1029/2008RG000267, 2009.
Grant, D. D., Fuentes, J. D., DeLonge, M. S., Chan, S., Joseph, E.,Kucera, P., Ndiaye, S. A., and Gaye, A. T.: Ozone transport bymesoscale convective storms in western Senegal, Atmos. Envi-ron., 42, 7104–7114, doi:10.1016/j.atmosenv.2008.05.044, 2008.
IPCC: IPCC, Climate Change 1995 – The Science of ClimateChange, Contribution of Working Group I to the Second Assess-ment Report, section 2, edited by: Houghton, J. T., MeiraFilho,L. G., Callander, B. A., Harris, N., Kattenberg, A., and Maskell,K., University Press, Cambridge, UK, 572 pp., 1996.
IPCC: Climate Change 2007: The Physical Science Basis. Con-tribution of Working Group I to the Fourth Assessment Reportof the Intergovernmental Panel on Climate Change, edited by:Solomon, S., Qin, D., Manning, M., Chen, Z., Marquis, M., Tig-nor, K. B. M., and Miller, H. L., Cambridge University Press,Cambridge, UK and New York, NY, USA, 996 pp., 2007.
Jiang, Y. C., Zhao, T. L., Liu, J., Xu, X. D., Tan, C. H., Cheng, X. H.,Bi, X. Y., Gan, J. B., You, J. F., and Zhao, S. Z.: Why does sur-face ozone peak before a typhoon landing in southeast China?,Atmos. Chem. Phys., 15, 13331–13338, doi:10.5194/acp-15-13331-2015, 2015.
Knutson, T. R., McBride, J. L., Chan, J., Emanuel, K., Holland, G.,Landsea, C., Held, I., Kossin, J. P., Srivastava, A. K., and Sugi,M.: Tropical cyclones and climate change, Nat. Geosci., 3, 157–163, 2010.
Atmos. Chem. Phys., 16, 8581–8591, 2016 www.atmos-chem-phys.net/16/8581/2016/

M. Venkat Ratnam et al.: Effect of tropical cyclones on the stratosphere–troposphere exchange 8591
Koteswaram, P.: On the structure of hurricanes in the upper tropo-sphere and lower stratosphere, Mon. Weather Rev., 95, 541–564,1967.
Livesey, N., Read, W. G., Frovideaux, L., Lambert, A., Manney, G.L., Pumphrey, H. C., Santee, M. L., Schwartz, M. J., Wang, S.,Cofield, R. E., Cuddy, D. T., Fuller, R. A., Jarnot, R. F., Jiang, J.H., Knosp, B. W., Stek, P. C., Wagner, P. A., and Wu, D. L.: EarthObserving System (EOS) Aura Microwave Limb Sounder (MLS)Version 3.3 Level 2 data quality and description document, JPLD-33509, JPL publication, New Orleans, USA, 2011.
Maycock, A. C., Joshi, M. M., Shine, K. P., Davis, S. M., andRosenlof, K. H.: The potential impact of changes in lowerstratospheric water vapour on stratospheric temperatures overthe past 30 years, Q. J. Roy. Meteor. Soc., 140, 2176–2185,doi:10.1002/qj.2287, 2014.
Merrill, R. T.: Characteristics of the upper-tropospheric environ-mental flow around hurricanes, J. Atmos. Sci., 45, 1665–1677,doi:10.1175/1520-0469(1988)045<1665:COTUTE>2.0.CO;2,1988.
Myhre, G., Nilsen, J. S., Gulstad, L., Shine, K. P., Rognerud, B.,and Isaksen, I. S. A.: Radiative forcing due to stratospheric watervapour from CH4 oxidation, Geophys. Res. Lett., 34, L01807,doi:10.1029/2006gl027472, 2007.
Newell, R. E. and Gould-Stewart, S.: A stratospheric foun-tain, J. Atmos. Sci., 38, 2789–2796, doi:10.1175/1520-0469(1981)038<2789:ASF>2.0.CO;2, 1981.
Pattnaik, D. R. and Rama Rao, Y. V.: Track Prediction of very severcyclone “Nargis” using high resolution weather research fore-casting (WRF) model, J. Earth Syst. Sci., 118, 309–329, 2008.
Penn, S.: Ozone and temperature structure in a Hurricane, J. Appl.Meteorol., 4, 212–216, 1965.
Ravindra Babu, S., Venkat Ratnam, M., Basha, G., Krishnamurthy,B. V., and Venkateswararao, B.: Effect of tropical cycloneson the tropical tropopause parameters observed using COS-MIC GPS RO data, Atmos. Chem. Phys., 15, 10239–10249,doi:10.5194/acp-15-10239-2015, 2015.
Ray, E. A. and Rosenlof, K. H.: Hydration of the upper tropo-sphere by tropical cyclones, J. Geophys. Res., 112, D12311,doi:10.1029/2006JD008009, 2007.
Reutter, P., Škerlak, B., Sprenger, M., and Wernli, H.: Stratosphere–troposphere exchange (STE) in the vicinity of North Atlantic cy-clones, Atmos. Chem. Phys., 15, 10939–10953, doi:10.5194/acp-15-10939-2015, 2015.
Riese, M., Ploeger, F., Rap, A., Vogel, B., Konopka, P., Dameris,M., and Forster, P.: Impact of uncertainties in atmospheric mix-ing on simulated UTLS composition and related radiative effects,J. Geophys. Res., 117, D16305, doi:10.1029/2012JD017751,2012.
Rind, D. and Lonergan, P.: Modeled impacts of stratosphericozone and water vapor perturbations with implications for high-speed civil transport aircraft, J. Geophys. Res., 100, 7381–7396,doi:10.1029/95JD00196, 1995.
Romps, D. M. and Kuang, Z. M.: Overshooting convec-tion in tropical cyclones, Geophys. Res. Lett., 36, L09804,doi:10.1029/2009GL037396, 2009.
Sahu, L. K. and Lal, S.: Changes in surface ozone levels due toconvective downdrafts over the Bay of Bengal, Geophys. Res.Lett., 33, L10807, doi:10.1029/2006GL025994, 2006.
Shindell, D. T.: Climate and ozone response to increased strato-spheric water vapor, Geophys. Res. Lett., 28, 1551–1554, 2001.
Solomon, S., Rosenlof, K. H., Portmann, R. W., Daniel, J. S., Davis,S. M., Sanford, T. J., and Plattner, G.-K.: Contributions of Strato-spheric Water Vapor to Decadal Changes in the Rate of GlobalWarming, Science, 327, 1219–1223, 2010.
Su, H., Read, W. G., Jiang, J. H., Waters, J. W., Wu, D. L., andFetzer, E. J.: Enhanced positive water vapor feedback associatedwith tropical deep convection: New evidence from Aura MLS,Geophys. Res. Lett., 33, L05709, doi:10.1029/2005GL025505,2006.
Vogel, B., Günther, G., Müller, R., Grooß, J.-U., Hoor, P., Krämer,M., Müller, S., Zahn, A., and Riese, M.: Fast transport fromSoutheast Asia boundary layer sources to northern Europe: rapiduplift in typhoons and eastward eddy shedding of the Asianmonsoon anticyclone, Atmos. Chem. Phys., 14, 12745–12762,doi:10.5194/acp-14-12745-2014, 2014.
Wang, C., Crutzen, P. J., Ramanathan, V., and Williams, S. F.: Therole of a deep convective storm over the tropical Pacific Ocean inthe redistribution of atmospheric chemical species, J. Geophys.Res., 100, 11509–11516, doi:10.1029/95JD01173, 1995.
Wei, M. Y.: A new formulation of the exchange of massand trace constituents between the stratosphere and tropo-sphere, J. Atmos. Sci., 44, 3079–3086, doi:10.1175/1520-0469(1987)044<3079:ANFOTE>2.0.CO;2, 1987.
Zhan, R. and Wang, Y.: Contribution of tropical cyclonesto stratosphere–troposphere exchange over the north-west Pacific: estimation based on AIRS satellite retrievalsand ERA-Interim data, J. Geophys. Res., 117, D12112,doi:10.1029/2012JD017494, 2012.
Zou, X., and Y. Wu.: On the relationship between Total Ozone Map-ping Spectrometer (TOMS) ozone and hurricanes, J. Geophys.Res., 110, D06109, doi:10.1029/2004JD005019, 2005.
www.atmos-chem-phys.net/16/8581/2016/ Atmos. Chem. Phys., 16, 8581–8591, 2016