effect of tubular reactor geometry on the saponification
TRANSCRIPT

AN ABSTRACT OF THE THESIS OF
Terry George McClary for the M. S. in Chemical Engineering (Name)
Date thesis is presented
(Degree) (Major)
r1----tat-v I (C. , r ci 4 Z
Title EFFECT OF TUBULAR REACTOR GEOMETRY ON THE
SAPONIFICATION OF ETHYL ACETATE WHEN OPERATING AT
FIXED RESIDENCE TIMES
Abstract Approved Major Professor)
The effect of reactor geometry on the percent completion of a
second order reaction was studied in four different tubular reactors. An aqueous solution of ethyl acetate and sodium hydroxide was al-
lowed to react at equimolar initial concentrations in each tubular
reactor at several different flow rates. Since all flow rates were
in laminar flow, provision was made to develop a laminar velocity
profile in the reactant fluid before the reactants entered the reactor.
All four experimental reactors had the same volume. Reactors
of 1-, 1 -1 /4 -, 1 -1 /2 -, and 2 -inch diameters were used. Six different
flow rates were used with each reactor. The amount of reaction at
each flow rate was determined by means of a titration method.
The 1 -, 1-1/4-, and 1-1/2-inch diameter reactors gave data
very similar to each other. At high flow rates all four reactors gave
similar data; however, at the low flow rates the 2 -inch diameter reactor gave a marked decrease in amount of reactant conversion.

Comparison of the experimental data with the data calculated
for a theoretical laminar flow reactor showed that the 1-, 1-1/4-,
and 1 -1/2 -inch diameter reactors approached the theoretical results
only at the very low flow rates. At high flow rates all four experi-
mental reactors gave results very close to those calcualted for a
plug flow reactor.

EFFECT OF TUBULAR REACTOR GEOMETRY ON THE SAPONIFICATION OF ETHYL ACETATE WHEN
OPERATING AT FIXED RESIDENCE TIMES
by
TERRY GEORGE McCLARY
A THESIS
submitted to
OREGON STATE UNIVERSITY
in partial fulfillment of the requirements for the
degree of
MASTER OF SCIENCE
June 1963

APPROVED:
ro essor of Chemical Engineering
In Charge of Major
o Department of Chemical Engineering
Chairman of School Graduate Committee
cano Graduate School
Date thesis is presented û -e ,t/-e-& (e6 11 6 Z f
Typed by Carol Baker

ACKNOWLEDGEMENT
The author wishes to express his appreciation to the following:
Dr. C. E. Wicks for his help and encouragement during the
course of this investigation;
Professor J. S. Walton for his helpful suggestions and
constructive criticisms of the thesis manuscript;
Department of Chemical Engineering whose assistantship and
facilities made this investigation possible;
Engineering Experiment Station for its financial help.

TABLE OF CONTENTS
INTRODUCTION
THEORETICAL CONSIDERATION
EXPERIMENTAL APPARAT US
CHEMICALS AND PURIFICATION
EXPERIMENTAL PROCEDURE
CALCULATIONS
DISCUSSION OF RESULTS
SUMMARY
RECOMMENDATIONS FOR FUTURE WORK
NOME NC LA T URE
BIBLIOGRAPHY
APPENDIX
Page
1
4
14
20
22
28
30
37
39
42
44
46
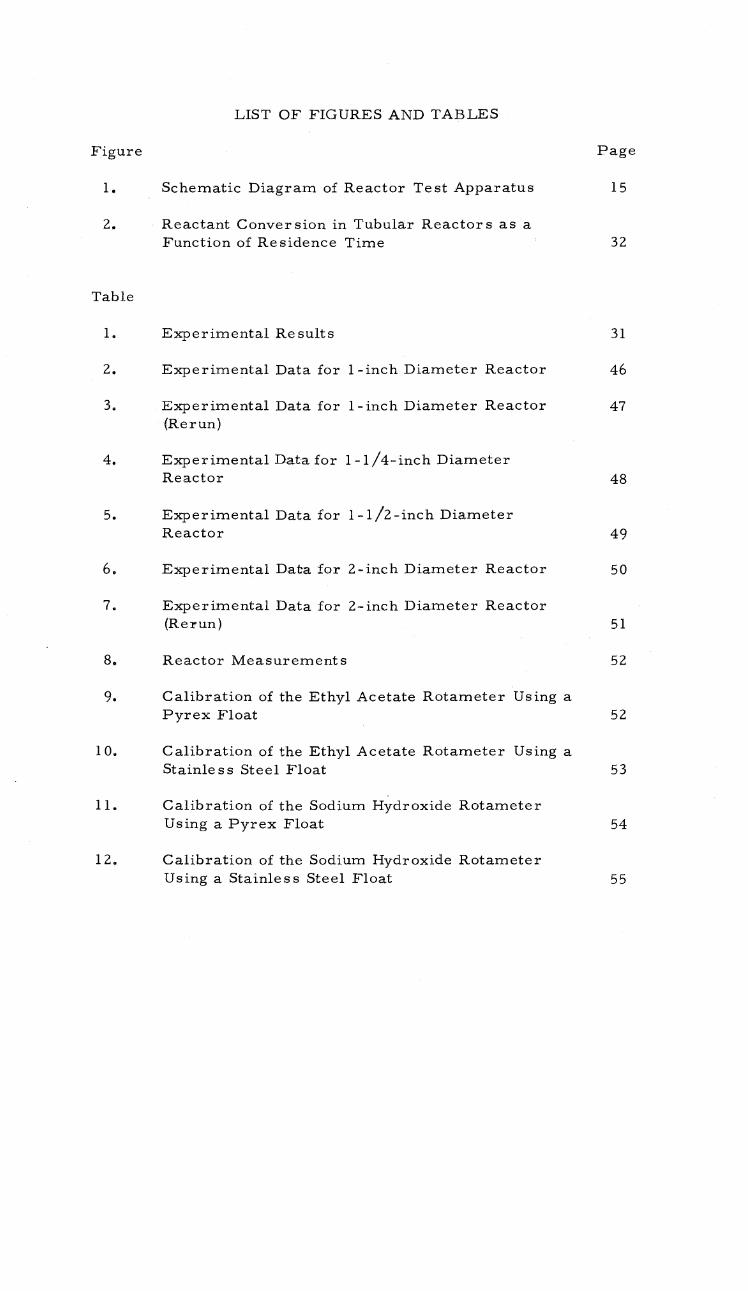
LIST OF FIGURES AND TABLES
Figure Page
1. Schematic Diagram of Reactor Test Apparatus 15
2. Reactant Conversion in Tubular Reactors as a Function of Residence Time 32
Table
1. Experimental Results 31
2. Experimental Data for 1-inch Diameter Reactor 46
3. Experimental Data for 1 -inch Diameter Reactor 47 (Rerun)
4. Experimental Data for 1-1/4-inch Diameter Reactor 48
5. Experimental Data for 1 -1/2 -inch Diameter Reactor 49
6. Experimental Data for 2 -inch Diameter Reactor 50
7. Experimental Data for 2 -inch Diameter Reactor (Rerun) 51
8. Reactor Measurements 52
9. Calibration of the Ethyl Acetate Rotameter Using a Pyrex Float 52
10. Calibration of the Ethyl Acetate Rotameter Using a Stainless Steel Float 53
11. Calibration of the Sodium Hydroxide Rotameter Using a Pyrex Float 54
12. Calibration of the Sodium Hydroxide Rotameter Using a Stainless Steel Float 55

Table Page
13. Calculated Data for the Equimolar Reaction of 0.1 Normal Ethyl Acetate with 0. 1 Normal Sodium Hydroxide at 29. 4 °C 56
14. Reynolds Number for Various Flow Rates 57

EFFECT OF TUBULAR REACTOR GEOMETRY ON THE SAPONIFICATION OF ETHYL ACETATE WHEN
OPERATING AT FIXED RESIDENCE TIMES
INTRODUCTION
Tubular flow chemical reactors have been very popular in
industry because of their ease of control, mechanical simplicity,
adaptability to heat transfer and high throughput capacity.
It has been shown (3, 9) that a flow reactor is most effi-
cient when there is no backmixing. A condition of no backmixing
would be represented when all the molecules flowing in a tubular
reactor spend exactly the same amount of time in flowing through
the reactor. The condition of no backmixing is approximated
when turbulent flow exists in a tubular flow reactor. However,
in many applications, it would take an extremely long tubular
reactor to obtain the desired residence time with the high turbu-
lent flow- rates. In order to achieve a sufficient residence time
while using a reasonable reactor length, it is often necessary to
flow the reactants through the reactor at lower than turbulent
flow rates.
The use of low flow rates, within tubular reactors, tends
to lower the percent conversion of reactants for a given average
residence time. It has been shown (3, 5, 9), for the same

2
given average residence time, a laminar flow reactor is less
efficient than a tubular reactor with the reactants flowing . in
turbulent flow. The laminar velocity profile is such that the longer
times some molecules spend in the reactor do not compensate for the
shorter times other molecules spend.
It is of interest to know how the percentage conversion in a flow
reactor is influenced by changes in the fluid velocity for any given
average residence time. The velocity of a fluid flowing through a
tubular reactor in any given residence time can be changed by in-
creasing or decreasing the diameter of the reactor. By increasing
the reactor diameter, a given average residence time can be main-
tained with a shorter reactor.
This research project was designed to determine the effect of
different reactor tube diameters on the percent conversion of react-
ants for given theoretical residence times. This study involved
using a constant length of one inch diameter copper pipe to mix the
reactants; four different diameter copper pipes were then individual-
ly attached to the mixing section of pipe to comprise the reactor.
Each of the four reactor sections had the same total internal volume.
The effect of the different diameters on the percent conversion of
the reactants was studied at six different flow rates. The reaction
involving the saponification of ethyl acetate by sodium hydroxide
was used in this kinetic study. This particular reaction was chosen

3
because it had previously been thoroughly investigated and because
its reaction constants at many temperatures are readily available
(10, p. 86).

4
THEORETICAL CONSIDERATION
Tubular reactor include many different types of design. Each
design influences the amount of backmixing in the reactor. Back-
mixing has been defined as a condition of axial mixing which causes
a decrease in the efficiency of a chemical reactor (7). Backmixing
has an adverse effect on the size of a chemical reactor required for
a theoretical minimum conversion of reactants.
Non- uniform reaction throughout the tubular cross - section
caused by backmixing may sometimes produce many undesirable ef-
fects. As an example, in the polymerization of viscous mixtures
under laminar flow conditions within a tubular reactor, the molecu-
lar weight of the polymer will be quite variable as compared to the
polymer produced in a thoroughly mixed reactor. This broadening
of the molecular weight distribution will result in some differences
in physical properties such as the softening range (14, p. 109).
The amount of conversion in a tubular reactor will, of course,
be directly influenced by the type of flow, whether laminar, turbu-
lent or somewhere in between. In the case of laminar flow in a
tubular reactor, the effect of the parabolic velocity profile on the
percent conversion of reactants can be calculated. Tubular flow
reactors will always give an amount of conversion between the

5
amount calculated for a plug flow reactor and that for a stirred tank reactor.
Plug Flow Reactor
A plug flow reactor represents the theoretical case for a flow
reactor in which there is no backmixing. Greenhalgh (6, p. 44)
defines plug flow as the case where "particles of feed leave the re-
actor in the same order in which they enter, and do not intermix or
interact with each other. Each particle of feed can be considered
to be a small batch reactor, "
For the bimolecular reaction A + B Y + Z, similar to the
reaction used in this investigation, the reaction rate is equal to
dx k 2
(a-x)(b-x) (1)
where x = amount of product formed in time, t.
a = initial concentration of reactant A.
b = initial concentration of reactant B.
k2 = reaction rate constant for the second order reaction.
If in a batch reactor the reactants are reacted in equimolar
concentrations, then equation 1 becomes
-dx = k2 (a-x) , 2
dt or after integration
--
dt -

X = a2k2t
1 + ak2F (2)
For a tubular reactor in which the reactants are flowing in plug
flow, the time, T, can be replaced by V/F where,
V = reactor volume
F = volumetric flow rate a
then x = F +1 V ak
Laminar Flow Reactor
(3)
6
A laminar flow reactor is a tubular reactor where the react-
ants flow through the reactor with a fully developed laminar velocity
profile. Denbigh (5) has given the equations describing a second
order reaction with equimolar concentration of reactants while pas-
sing through a flow reactor in laminar flow. A fully developed lam-
inar velocity profile was assumed and the effect of molecular dif-
fusion was neglected. Bosworth (1, p. 58) has shown that the effect
of molecular diffusion both axial and longitudinal, can be neglected
in most liquid flow reactors.
The velocity profile of a liquid flowing in completely laminar
flow can be described by Poiseuille's equation. For a fluid flowing
in a tube with a laminar velocity profile,

where,
V = -it' (R2 - r2) 411
(4)
7
= the pressure gradient acting down a cylindrical reaction vessel of length L.
R = the radius of the reactor.
r = the distance from the center of the reaction vessel.
= the viscosity of the fluid flowing in the vessel.
v = the velocity at a distance r from the center of the reactor.
By using equation 4 the volume, F, flowing through a reactor in unit
time is
R F =
J 2IIrvdr
o
11d) R4
811
(5)
If there is no radial or longitudinal mixing of a particle flowing in
the reactor, then the time, t, taken by a particle which is at a
radius, r, from the center of the vessel, to travel the length, L, of
the reactor is given by
L 4r}L 1
v ci) (R2 - r2) (6)
f
r

Upon differentiating
dt = 8r Lr ( R2
1 2
dr cio
r2) (7)
8
If only a hollow cylinder of fluid of internal radius r and exter-
nal radius r + dr is considered, the time required by the fluid in
this annulus to pass through the reactor is given by equation 6. The
volume of fluid entering this annulus in unit time is equal to 2flrvdr.
If the fraction of the total volume of fluid which enter the annulus
at any time is called frdr then
f dr r 4rIII (OR4
21Ir0) (R2 - r 2 ) 87)dr
= 4(R2 - r2)r dr
R4
The fraction ftdt of the molecules which pass through the re-
action zone with transit time lying between t and t + dt is given by
ftdt = frdr = fr 1
dt dr
dt
= 4(R2-r2)3r dt R4 8r1Lr
32n2L2 1 dt .1)2R4 t3
(9)
=
=
(8)

9
Since the minimum time of passage through the reactor, to, exists
at the center of the reactor,
41,11 to = vo cia2
Combining equation 9 with equation 10 one obtains
2 dt ftdt = 2t - o t3
(10)
The mean reaction time, t , is obtained by averaging over all values
of t from t = to at the center of the reactor to t = oowhich is the ef-
fective value at the reactor wall. Then,
t= t ft dt to
S.:
o t
f dt
2to (12)
Thus the average time of passage is just twice the time of passage
down the center of the reactor.
For a second order reaction, such as A + B -Y + Z, in which
there is no volume change andthere is equimolar initial concentra-
tions of A and B, the reaction rate is
dx k2 (a - x)2 dt
(1)
This equation is the same equation as given for plug flow. If each
L
00
00
t
=

10
particle flowing at a particular velocity through a tubular reactor at
laminar flow is considered a small batch reactor, then equation 2
also is applicable. For a laminar flow tubular reactor, the outflow
can be obtained by averaging over all the times of passage from to
to t =00.
Then,
X =
oo
xftdt o
Go
C ft dt
to
Jx ft dt to
(13)
where x is the average concentration of the product flowing out the
reactor, or
and
oo
= 2k2a2to2 dt
9 t2 (ak2t+l )
ak to x = 2a2k2to[ l+toak21n( 2 )].
ak2to+1
For a flow reactor, t = V/F or to = V 2F
By using equation 16 in equation 15, one obtains
(14)
(15)
(16)
2 ak V x_ a 2 k 2V [ 1+ ak2V ln
( 2 )] (17) F 2 F ak2V + 2F
Equation 17 represents the average concentration of product
co
=
1
x

11
flowing out of a tubular reactor assuming a completely developed
laminar flow profile. Equation 17 also assumes that no molecular
diffusion occurs and that the reaction is isothermal.
Stirred Tank Reactor
A stirred tank reactor is a reactor where reactants enter a
perfectly- stirred tank. As long as the amount and concentrations of
the reactants entering the tank remain constant, the concentration of
product in the overflow leaving the tank will reach a constant value
which is equal to the concentration within the tank itself. Greenhalgh
(6, p. 44) defines a stirred tank reactor by "particles of feed inter-
mix with all the other particles in the reactor immediately. Thus
the particles lose their identity. The contents of the reactor are
uniform and identical with those of the outgoing stream. "
Corrigan (3) derived an equation for the product concentration of a
second order reaction occurring in a stirred tank reactor. Corrigan
assumed that the reactants entered the reactor at equimolar concen-
trations.
By making a steady state material balance over a stirred tank
reactor one can obtain the equation
Fa - FCA= k2 (a-x)2V (18)

12
for the second order reaction
A + B +Z where
CA = the concentration of A in the overflow from the reactor.
Since CA = (a - x), then equation 18 becomes
or
Fa - F(a - x) = k2V(a2 - 2ax + x2)
x2-x( F +2a)+a2= 0 k2V
Solving the quadratic equation 19, one obtains
or
F [ k2V
X =
+ 2a] ± C
(k (k2v V
+ 2a)2- 4a210. 5
2a
(a - x) = L
( 2k V )2 k k2V
10. 5 - 2
(19)
(20)
A tubular reactor will never obtain the values given by equation
20; however, these values given represent the minimum amount of
product that could theoretically be obtained within a tubular reactor.
Therefore equation 20 is often used in discussing the efficiency of a
tubular flow reactor.
Saponification of Ethyl Acetate with Sodium Hydroxide
The aqueous reaction C2H5 -O -C- CH3 + NaOH -- Na -O -G` CH3
+ C2H5OH, used in this research, has been shown by many
F aF F 2k2V +
-Y

13
investigators (8, 12, 13, 15, 16) to be bimolecular and second order.
These investigators have shown that this reaction is essentially an
irreversible reaction.
The rate constants as a function of temperature are in excellent
agreement with the Arrhenius equation (10, p. 86). Warder (17),
using his experimental data, obtained the equation (7. 5 k2)(62. 2)(62.5-T)
= 521.4 for the rate constant where T is the temperature in degrees
centigrade.
Two main methods have been used to determine the degree of
conversion in the hydrolysis of ethyl acetate with sodium hydroxide.
One is the conductivity method used by Walker (15) and the other
involves a titration method as used by Warder (16), Terry (13) and
Stead (12). The titration method uses a slight excess of acid to
neutralize the sodium hydroxide in the reactants and thus stop fur-
ther reaction. Since the hydrolysis of ethyl acetate by acid is very
much slower than with base (12), this method provides an accurate
way of determining the amount of reactant conversion for the ethyl
acetate - sodium hydroxide reaction. One main disadvantage to this
method is that it takes a finite amount of time to neutralize the
sodium hydroxide with the acid.
+

14
EXPERIMENTAL APPARATUS
The basic equipment used in this investigation consisted of con-
stant head and storage tanks, temperature controllers, flow regula-
tors, and the tubular reactors. A schematic drawing of the appara-
tus is shown in Figure 1.
The constant head assembly consisted of four covered poly-
ethylene tanks. Reactants were charged into fifteen gallon storage
tanks. From the storage tanks the reactants were pumped to the
constant head tanks located fifteen feet above the storage tanks.
Eastern Industries model E -1 pumps were used for transferring
the reactants from the storage to the constant head tanks. The
'seven gallon constant head tanks were fitted with a reactant inlet at
the bottom of the tanks, a reactant outlet near the middle of the tank,
and an overflow line at the top of the tank. The inlet, outlet and
overflow lines to the constant head tanks were constructed out of
3/8 -inch copper tubing. The constant head tank inlets leading to the
pumps from the storage tanks were fitted with 3/8 -inch brass globe'
valves which were used to control the flow of reactants to the
constant head tanks. A twenty inch long glass heat exchanger was
inserted in each inlet line to the constant head tanks. The glass heat
exchangers were connected to the 3/8 -inch copper tubing by means
of rubber tubing. The glass heat exchangers were used to lower

V V
I J
Figure 1. Schematic Diagram of Reactor Test Apparatus
A Ethyl Acetate Storage Tank
B Sodium Hydroxide Storage Tank
C NaOH Constant Head Tank D EtOAC Constant Head
Tank E NaOH Flow Control Valve F EtOAC Flow Control Valve G NaOH Rotameter H EtOAC Rotameter I Calming Section J Reactor Section K Reactor Outflow M Conductivity Electrode
Leads N Transfer Pumps O EtOAC Pump Control
Valve P NaOH Pump Control
Valve Q EtOAC Heat Exchanger R NaOH Heat Exchanger
lri
P
1
D
G
Q
C
R
I
-_1

16
the temperature of the reactants flowing into the constant head
tanks.
Temperature controllers and knife blade heaters were inserted
through the covers on the constant head tanks. The temperature
controllers used in each head tank were H -B Instrument Company
"red top" mercury thermoregulators. Each regulator was connected
to a No. 7550 H -B Instrument Company mercury plunger relay.
The relay in turn was wired to a 110 volt power source and to a knife
blade heater. The Central Scientific Company knife blade heaters
were rated at 250 watts. Each constant head tank contained one
knife blade heater and one temperature controller.
The reactant outlet line from each constant head tank was con-
nected by 3/8 inch copper tubing to a rotameter and in turn to a
brass needle valve prior to connecting into the reactor. The rota-
meter was connected to the 3/8 -inch copper tubing with rubber
tubing. The rotameter tubes were size 6 -15 -2 Brooks Rotameter
Company tubes. Two different floats were used in the rotameter:
pyrex floats for the low flow rates and stainless steel floats for the
high flow rates. Flow rates to the reactor were controlled by the
two 3/8 -inch needle valves.
The flow reactor consisted of two main parts; a short "calming
section" of pipe and the main reactor tube. The calming section

17
consisted of three feet of 1 -inch diameter copper pipe. Inserted
into one end of the calming section was a 0 to 51° C thermometer
and a seven inch long piece of 3/8 -inch diameter copper tubing. The
seven inch long piece of copper tubing was connected to a copper
tube, "T", fitting. Each side of the "T "was connected by 3/8 inch
copper tubing to the control needle valve. One -tenth normal ethyl ace -
tate flowed into one side of the "T "while one -tenth normal sodium hy-
droxide entered the other side of the Approximately four inches of
the seven inch long copper tubing was perforated with O. 0520 inch diame-
ter holes. This was done at the end of the tubing opposite from the end
connected to the middle of the IT The holes in the tubing were spaced
in six rows along the length of the tubing. The reactants flowed into both
ends of the brass "T " and then through the seven inch long copper tubing
and out the holes into the calming section. The perforated tubing was
designed to mix the reactants thoroughly upon entering the reactor.
The other end of the calming section was threaded and then
screwed into a 2 -inch cast iron flange with the aid of a 2 to 1 -inch
brass bushing. The 1-inch copper pipe was screwed through the
brass bushing until the copper pipe was flush with the face of the
flange. The space between the 1 -inch copper pipe and the flange
body was filled with lead and then filed flush with the flange face.
This procedure eliminated any extraneous volume which would af-
fect the residence time of the reactants.
"T':

18
Four different diameter reactors were used in the apparatus.
Each reactor has a total internal volume of 1, 310 ± 10 milliliters.
The nominal diameter sizes were 1 -inch, 1-1/4 -inch, 1-1/2 -inch,
and 2 inch. The size and volume of each reactor are given in
Table 8 in the appendix. All sizes of reactors were constructed out
of copper pipe. Both the reactor and calming section were mounted
so that there was a five degree slope upward from the end where the
reactants entered. The slight upward slope prevented any air being
trapped in the reactor.
Both ends of each reactor were threaded and screwed into cast
iron flanges similar to those previously described. One end
of the reactor was flanged to the calming section of pipe using a rub-
ber gasket between the flange faces to prevent leakage. The other
end of the reactor was flanged to a 1 -inch diameter copper pipe 2-
1/2 inches long. This short piece of copper pipe was fitted to a
flange exactly like the calming section.
Inserted in the open end of the seven inch long piece of copper
pipe was a rubber stopper. Protruding through the stopper was a
0 to 51° C thermometer, conductivity electrodes and supports for a
copper disc. The disc had a diameter slightly smaller than the
diameter of the 1-inch copper pipe. Thus liquid could flow between
the wall of the pipe and the edge of the disc. In this way the velocity

19
profile of the flowing liquid was broken up allowing the conductivity
electrodes to measure the average conductivity of the liquid.
The products from the reactor left through a short length of
3/8 -inch copper tubing fittedto the 1 -inch copper pipe. The exit
for the reactants was situated next to the rubber stopper.
The conductivity electrodes consisted of two 1/8 -inch diameter
pieces of sheet platinum mounted in glass and spaced 5/8 -inch apart.
Before the electrodes were used they were coated with a film of
platinum black. The conductivity electrodes were wired to a stand-
ard Wheatstone bridge circuit. The Wheatstone bridge consisted of
two 0- 1,000 ohms, number 4775, and one 0- 100 ohms, number
4776, Leeds and Northrup decade boxes. A General Radio Company
type 1212 -A unit null detector was used to ascertain the point of
minimum current flow in the Wheatstone bridge. A 1,000 cycle
General Radio oscillator was used to supply current to the conduc-
tivity electrode. A variable capacitor box was used to minimize the
effect of electrode capacitance on the sensitivity of the Wheatstone
bridge.
The conductivity apparatus was not actually used to determine
the extent of reaction but was used to determine when the reaction
had reached a steady state conversion within the reactor.

CHEMICALS AND PURIFICATION
Water
20
The distilled water used for all experimental work was freed of
carbon dioxide by passing a stream of air first through a column of
"Ascarite" then into the distilled water. Air was bubbled into the
water for at least three hours according to the procedure given by
Willard (18, p. 15).
Sodium Hydroxide
The sodium hydroxide used in this research was manufactured
by Allied Chemical Company, General Chemical Division. The
sodium hydroxide passed the A.C.S. test for reagent grade chemi-
cals. It was necessary to remove the one percent sodium carbonate
present in the sodium hydroxide in order to prevent the carbonate
from interfering with the phenolphthalein endpoint. The sodium
hydroxide was freed of the carbonate by using a procedure developed
by Daniels (4, p. 469). This involved preparing a saturated solution
of the sodium hydroxide in water and then withdrawing the clear
supernatant solution, leaving the sodium carbonate behind as a pre-
cipitate.

21
Ethyl Acetate
The ethyl acetate used in preparing reactant solutions was re-
agent grade manufactured by Matheson- Coleman and Bell Company.
The ethyl acetate contained a maximum of 0.001 percent acid given
as acetic acid. No further purification was required.
Chemicals Used for Standardizations
Reagent grade hydrochloric acid was standardized with reagent
grade sodium carbonate according to the method given by Willard
(18, p. 146-147). Before weighing out samples, the sodium carbon-
ate was heated for two hours at 290 °C to remove any water and to
decompose any sodium bicarbonate.
The sodium hydroxide solutions were standardized with Eastman
Kodak No. 37 benzoic acid. The benzoic acid was heated at 115°C
for two hours to remove any water. All standard solutions of sodi-
um hydroxide and hydrochloric acid were made with carbon dioxide
free distilled water.

22
EXPERIMENTAL PROCEDURE
The procedure followed for the experimental runs involved the
careful preparation of 0.1000 ± 0.0005 normal aqueous solutions of
sodium hydroxide and ethyl acetate, the establishment of the desired
operating temperature, the adjusting of the control needle valves
until the desired flow rates were obtained, the verification of steady
operating conditions by conductivity measurements, and the sampling
and analysis of the products leaving the reactor.
In the initial step of preparing the reactant solutions, fifty gal-
lons of distilled water were treated to eliminate any dissolved car-
bon dioxide. This was accomplished by passing air, which had been
previously treated in a column filled with "Ascarite ", up through the
distilled water. The carbon dioxide -free distilled water was then
siphoned into the reactant storage tanks. The transfer pumps were
started to fill both constant head tanks to their respective overflow
lines. Each storage tank was filled with water until the water level
reached a desired mark, previously established on the side of the
storage tank.
A saturated solution of sodium hydroxide was added to one of
the storage tanks. The sodium hydroxide was mixed by turning on
the transfer pump and pumping the solution to the constant head tank

23
and then letting the head tank overflow back to the storage tank.
After mixing for over 1/2 -hour, a sample of solution was withdrawn
and the normality of the sodium hydroxide solution was determined
by titration with a standard acid. The amount of saturated sodium
hyrdoxide solution required to obtain a 0.1 normal sodium hydroxide
solution was calculated and added to the storage tank. After an ad-
ditional 1/2 -hour mixing period, the sodium hydroxide solution was
rechecked and if it was not 0.1000 ± O. 0005 normal, steps were
taken to correct the normality to the desired limits.
After the sodium hyroxide solution was within the prescribed
normality, 642.2 milliliters of reagent grade ethyl acetate were add-
ed to the second storage tank through a hole in the tank cover.
This was the amount required to make a 0.1 normal ethyl acetate
solution. The hole in the tank cover was then plugged with a rubber
stopper and the transfer pumps were started on both the sodium hy-
droxide and ethyl acetate systems. At the same time, both temper-
ature controllers were turned on. After a period of one and one-
half hours, two 50 milliliters samples of ethyl acetate solution were
withdrawn and added to a glass- stoppered flask containing 50 milli-
liters of 0.2484 normal sodium hydroxide. The samples were set
aside for latter analysis.
Flow into the reactor was begun by opening the needle valves on

24
the constant head outlet lines. The flow of each reactant was con-
trolled by adjusting the needle valve until the rotameter indicated
that the desired amount of reactant was flowing into the reactor.
The progress of the reaction was followed with the conductivity
apparatus. After the conductivity of the reactor product stream be-
came constant, samples of the product were taken and analyzed.
Four different size reactors were used, with six different flow
rates through each size reactor. Three different flow rates were
run using pyrex floats in the rotameters and three flow rates were
obtained using stainless steel floats in the rotameters. Due to the
quantity of reactants required for each run, additional reactant solu-
tions were prepared after three experimental runs.
After the reactor had reached steady state, as indicated by the
conductivity apparatus, and the inlet and outlet temperatures were
within 29.4 °C ± 0.2 °C, samples of the reactor product were taken.
Two samples were taken at each flow rate. Each sample was col-
lected in a 250 milliliter volumetric flask, to which an amount of
acid had been previously added. The amounts of acid added to the
flasks for each flow rate are shown in Tables 2 -7 in the appendix.
The acid in the flask had been calculated to be slightly in excess of
the amount needed to completely neutralize the sodium hydroxide and
thus stop the reaction between ethyl acetate and sodium hydroxide.

25
As the sample was collected the flask was vigorously shaken in
order to completely mix the acid with the sample. The sample was
collected until the level of the liquid in the flask was just below the
neck of the flask. The volumetric flask was then filled with distilled
water, so that the total volume of liquid contained in the flask was
exactly 250 milliliters. The amount of distilled water added was
recorded. The inlet and outlet reactor temperatures were recorded
after the sampling.
After shaking the flask to thoroughly mix the distilled water
with the sample, a 100 milliliter sample from the flask was pipeted
into a 250 milliliter conical flask. The 100 milliliter sample was
immediately titrated with 0.02050 normal sodium hydroxide using
phenolphthalein as the indicator. The amount of base required was
recorded.
Before another sample was taken at the same flow rate, the
rotameters, thermometers and conductivity apparatus were checked
to make sure the operating variables were at the desired values. A
second sample was then taken, after which the needle valves were
used to change the flow rates to the next desired value. After re-
cording the inlet and outlet temperatures, the second sample was
treated exactly as the first one
This procedure was repeated for each desired flow rate until
'.

26
three successive flow rates were run. The pumps and temperature
controllers were then shut off. Two 50 milliliter samples of the
ethyl acetate feed solution were withdrawn and treated as the first
two ethyl acetate samples. All of the ethyl acetate solution was
sucked out of both the storage and constant head tanks. Carbon di-
oxide-free distilled water was added to the empty ethyl acetate
storage tank and to the partially filled sodium hydroxide storage
tank. The procedure of filling the tanks with water and adding the
sodium hydroxide and ethyl acetate was exactly the same as the
procedure described above. The higher flow rate runs were made
using exactly the same procedure as previously described.
The flasks containing 50 milliliter samples of the ethyl acetate
solution with 50 milliliters of 0.2484 normal sodium hydroxide were
heated for over two hours to saponify the ethyl acetate. A ground
glass, water- cooled condenser was attached to each flask to mini-
mize any loss of ethyl acetate by vaporization. After each sample
had been heated, slightly below boiling conditions, for two hours, a
known excess of standard acid was added to each flask. The sam-
ples were then back -titrated, using 0. 02050 normal sodium hydrox-
ide with phenolphthalein as the indicator. This procedure, used for
analyzing ethyl acetate, is similar to the one described by
Siggia (11, p. 24).

27
As stated above, two samples of ethyl acetate feed solution were
taken before and two after completion of a run. This was done in
order to verify the concentration of the ethyl acetate solution. Due
to the high vapor pressure of the ethyl acetate, the storage tank con-
taining the ethyl acetate solution was carefully sealed with poly-
ethylene tape. However, it was soon discovered that a leakproof
system was essentially impossible; accordingly, the double sam-
pling of the ethyl acetate feed was believed necessary to establish
its average concentration level.
After all the data were complete for a given size reactor,
another size was inserted into the system and the complete pro-
cedure was repeated again. This was done for a total of four
reactors. In order to check the consistency of the data two of the
reactor sizes were rerun at the same six flow rates.

28
CALCULATIONS
Each sample taken from the tubular reactor was collected in a
250 milliliter volumetric flask into which a known amount of 0.09937
normal acid had been added previously. Distilled water was added
to the flask to make exactly 250 milliliters. A 100 milliliter sam-
ple was then pipeted out into a 250 milliliter conical flask and ti-
trated using phenolphthalein as an indicator.
If H = milliliters of 0.09937 normal acid added to the 250 milliliter volumetric flask.
W = milliliter of distilled water needed to make up a total volume of 250 milliliters in the volumetric flask containing the sample and the acid.
M = volume of sample taken from reactor.
S = milliliters of 0. 02050 normal sodium hydroxide used to titrate the 100 milliliter sample removed from the volumetric flask.
N = normality of the sodium hydroxide in the sample taken from the tubular reactor.
E = percent completion of the reaction.
then 250
H(0. 09937) = N(M) + 100 (0. 02050)S (21)
and 0.09937(H) - 0. 05125(S) NW (22)
M now
M = 250-H-W (23)

29
therefore
N a 0. 09937(H) m 0. 05125(S) (24) 250-HmW
Since the original normality of the sodium hydroxide entering the
tubular reactor was 0. 05,
then
or
(0.05-N)(100) 0. 05
E 100 m 9. 937(H) + 5.125(S) _ 0.05(250aH-W)
(25)
(26)
E

30
DISCUSSION OF RESULTS
The results of this experiment are summarized in Table 1 and
are illustrated in Figure 2. The 1-inch, 1-1/4-inch, and 1-1 /2-
inch diameter reactors gave data very similar to each other. There
was a slight lowering of the amount of reactant conversion as the
reactor diameter was increased, but there was not enough differ-
ence between the reactors to establish a trend. However, the 2-
inch diameter reactor showed a definite lowering of the percentage
conversion of reactants at the lower flow rates. At the higher flow
rates the percent conversion of reactants in all the different size
reactors were essentially the same.
The marked decrease in percent conversion of reactants inthe 2-
inch reactor at low flow rates was checked by rerunning the 2 -inch reac-
tor at the flow rates. Both sets of data agreed well with each other. The
difference between data obtained with the 2-inch reactor and with the oth-
er three reactor sizes might be caused either by molecular diffusion
or by "short circuiting" of the fluid in the 2 -inch reactor. However,
Bosworth (1, p. 858) was able to show mathematically that axial
molecular diffusion could be neglected when the length, L, is
greater than 255 h,FDT and radial diffusion could be neglected when
the radius, R, is greater than 13 [DT. D is the diffusivity of the

Table 1 Experimental Results
Residence time in minute s
Rate of flow in the reactor in milliliters per minute
Percent Percent Percent conversion conversion conversion of reactants of reactants of reactants in 1-inch in 1 -inch in 1-1/4 inch reactor reactor reactor
Percent Percent conversion conversion of reactants of reactants in 1-1/2 inch in 2 -inch
reactor reactor
Percent conversion of reactants in 2
reactor
4.68 400 61.80 62.77 61.25 61.22 56.79 55.40 62. 27 62.79 61.14 61.08 56.46 56.72
3. 12 600 54. 52 55. 64 54. 65 53. 35 50. 86 49. 54
54.22 53. 52 55. 02 52.58 51.43 47.79
2.34 800 48.43 48.69 47. 98 45.60 47.14 46.60 47. 86 48. 04 48.99 46.52 47.22 46.94
1.56 1200 370 90 41. 31 42. 15 40. 66 40.62 40. 83
42. 57 41.60 42. 02 41.77 40.21 41. 06
1.34 1400 36. 09 37. 68 38. 07 37.41 36.10 36.67 36. 57 37.65 36. 39 36. 83 36. 37 36. 05
1.17 1600 33.21 34. 17 34. 20 34.24 34.46 33.40 33.79 34. 09 35. 17 34. 40 33.72 34.68
w

Perc
ent
Con
vers
ion
of R
eact
ants
70
60
Figure 2 32
20
10
0
o 1.0
,REACTANT CONVERSION IN TUBU- LAR REACTORS AS A FUNCTION OF RESIDENCE TIME
O - Experimental data for 1, 1-1/4, - and 1-1/2 inch diameter reactors.
- Experimental data for 2 inch diameter reactor. o Calculated values for a plug flow reactor Calculated values for a laminar flow reactor
Calculated values for a stirred ® tank reactor I i Í
2.0 3. 0 4.0 Residence Time, Minutes
5. 0
Each point plotted for the 1, 1-1/4- and 1-1/2-inch diameter reactors is an average of eight experimental data points. Each point plotted for the 2 -inch reactor is an average of four experimental data points.
50
40
30
g."
I
b
m
á
c
>
0 U
q 0
w
a

33
reactants and t is the average time the reactants spend in the reactor.
According to Bosworth °s criteria, the effect of molecular diffusion
can be neglected in all four sizes of reactors which were used in this
experiment. If diffusion can be eliminated as a factor in the varia-
tion of the data from the 2 -inch reactor with the other reactor sizes,
the variation probably was caused by the short circuiting of the re-
actor fluid. This short circuiting of fluid could be caused by dead
spaces within the 2 -inch reactor where the reactants entered the 2-
inch pipe from the 1 -inch diameter calming section and where the
reactants left the 2 -inch pipe at the other end of the reactor. In
these two areas the main flow of liquid could short circuit and not
flow into these volumes. A dead space in the reactor would essen-
tially lower the effective reactor volume, thus lowering the percent
conversion of reactants in the overall reactor. At higher flow rates
in the 2 -inch reactor the fluid velocity was evidently high enough to
eliminate the dead space in the reactor. The 1-1/4-inch and 1-1/2-
inch diameter reactors probably had a high enough fluid velocity at
all flow rates to eliminate any dead spaces within the reactors.
Comparison of the experimental data with values calculated
for a laminar flow reactor shows that at low flow rates the 2 -inch
reactor gives less conversion than the calculated data. The three
other size reactors give more percent conversion at all flow rates

34
than the theoretical laminar flow reactor. At the lowest flow rate
the three smallest diameter reactors seem to be approaching the
percent conversion of reactants expected for a laminar flow reactor.
Hovorka (7) studied the effect of baffles on the percent con-
version of the reaction of aqueous ethyl acetate with sodium hydrox-
ide in a flow reactor. One of Hovorka's runs was made in an unbaf-
fled reactor consisting of six feet of 1 -inch diameter polyethylene
tubing. His data included percent conversions for residence times
varying from 0.5 minutes to 2.75 minutes in the unbaffled reactor.
These residence times corresponded to flow rates of 560 to 2,070
cubic centimeters per minute. Hovorka °s data values plotted close
to the curve calculated for a laminar flow reactor; however at all
flow rates, the experimental data were slightly lower than the cal-
culated values. The data obtained by Hovorka did not agree with the
values obtained in the present investigation, except possibly at the
very low flow rates. It is possible that the different method used to
introduce reactants had a great effect on the velocity profile through-
out the reactor and in turn on the conversion level. Also in the
present investigation the flanged joints used at both ends of the re-
actor section would have affected the velocity profile in the reactor.
Any radial mixing would increase the amount of conversion of react-
ants and axial mixing would decrease the conversion.

35
Cleland and Wilhelm (2) used a first order reaction to study
the effect of laminar flow in a reactor on the amount of reactant con-
version. All of their data were obtained at Reynold's numbers less
than 400. Stainless steel pipes of 1/4 -inch and 1/2 -inch diameter
were used for the tubular reactors. The 1/2 -inch reactor gave a
percent conversion consistently higher than the theoretically calcu-
lated amount. The calculated percentage conversion allowed for
diffusion in the reactor. The long small diameter reactor used at
low flow rates prevented Cleland and Wilhelm from ignoring the ef-
fect of diffusion in calculating the theoretical amount of reactant con-
version.
Comparison of the experimentally determined curves with
the calculated curve for a plug flow reactor show that at the high flow
rates the experimental curves lie slightly above the conversion theo-
retically obtained for a plug flow reactor. It is, of course, theoretic-
ally impossible for the experimental reactors to be more efficient
than a plug flow reactor. This discrepancy was probably due to the
finite amount of time required to stop the reaction when obtaining a
sample from the reactor. The extra reaction time would have the
same effect as increasing the reactor volume and, hence, would
cause a greater conversion of the reactants. The effect of additional
reaction time would be greater at higher flow rates. For example,

36
if it takes five seconds to stop the reaction when obtaining a sample,
this time would produce a 4. 5 percent increase in the amount of con-
version at the highest flow rate. The 4. 5 percent increase in con-
version of reactants would be enough to make the experimental data
higher than the values calculated for a plug flow reactor. A differ-
ence of five seconds in reaction time at the lowest flow rate would
make the amount of reactant conversion high by only about 0.7 per-
cent. The additional residence time would not change the relative
amounts of conversion for the different size experimental reactors;
however, it would make a slight difference in a comparison with cal-
culated reactor conversions such as those for plug flow and stirred
tank reactors.
Variations among data were caused by the reactants not
staying at exactly 29.4 C and by slight surges of reactants through
the rotameters. Variations in the amount of reactants entering at any
set flow rate would make the reactor enter unsteady state operation
until the disturbances damped out.
Slight errors in the calibration of the rotameters and in the
standardization of the acid and basic solutions were probably much
smaller than the error introduced in stopping the reaction while ob-
taining a sample from the reactor.

37
SUMMARY
This investigation was designed to determine the effect of
different diameter tubular reactors on the percent completion of a
chemical reaction. This involved the reaction of ethyl acetate with
sodium hydroxide at low flow rates in a tubular reactor. The react-
ants were first introduced into a short calming section of pipe and
then allowed to flow into the tubular reactor. Four different diame-
ter reactors were used. Six different flow rates were used with
each of the experimental reactors. All of the reactors had the same
internal volume. Samples were collected from the exit of each re-
actor and added to a measured volume of acid. The acid was in
sufficient quantity to allow the sample to be back titrated with a
standard base. The percent completion of the reaction could then be
determined from the volumes of acid and base used for each sample.
The experimental data obtained for the three smallest di-
ameter reactors, 1 -inch, 1 -1/4 -inch and 1-1/2-inch, were very
similar. However, the data for the largest diameter reactor, the
2- inch, showed a marked drop in percent conversion of reactants
when compared to the other size reactors. This drop in reactant
conversion was only apparent at the lower flow rates. At the higher
flow rates all diameter reactors gave approximately the same

38
conversion of reactants. It was concluded that the difference in re
actant conversion between the largest diameter reactor and the other
reactors was probably caused by "dead spaces" in the largest di-
ameter reactor. These spaces were areas where the efficiency of
reactant conversion was much less than other areas in the reactor.
The so called "dead spaces" probably existed at each end of the
largest diameter reactor. The fluid velocity in these areas was
probably close to zero. At the higher flow rates the fluid velocity
was probably high enough to permit greater areas in the largest
diameter reactor to be used with equivalent efficiency.
Comparison of experimental data with values calculated for
a theoretical laminar flow reactor show that the experimental results
approach the calculated values only at the low flow rates. At high
flow rates, all four experimental reactors gave better conversion
rates than were calculated for a laminar flow reactor.

39
RECOMMENDATIONS FOR FUTURE WORK
Additional experimental work needs to be done to find out what
factors caused the 2 -inch reactor to give a smaller reactant con-
version than the other diameter reactors studied in this project.
It would be desirable to know whether the decrease in reactant con-
version starts all at once at some size reactor between the 1-1/2 -
inch and 2 -inch diameter reactors, or if the change takes place
gradually between the two size reactors. This could be done with
the present experimental apparatus by using several reactor sizes
between 1-1/2- and 2 -inch inch diameters. Since there are no
standard copper pipe sizes between 1 -1/2- and 2 -inch diameters,
the reactors would have to be specially fabricated. Many different
size reactors could be studied. Also the effect of different methods
of reactant introduction should be investigated. It would be possible
to change the length and diameter of the calming section and deter.
mine what effect these variations would have on the percent conver-
sion of the reactants.
Some of the above proposed investigations could be performed
using equipment identical to the apparatus used in this research;
however many of the investigations would require different chemical
reactions and different apparatus. One reaction could not be used

40
for studying a large number of different reactor sizes. The reaction
rate constant sets certain practical limits for the use of any one re-
action. Reactions with large reaction rate constants would be used
for studying small tubular reactors, while reactions with small rate
constants should be used for studying large reactors. Many different
esters can be substituted for the ethyl acetate used in this experi-
ment. The basic hydrolysis of methyl acetate has a much higher re-
action rate constant than does the saponification reaction of ethyl
acetate. Esters such as propyl acetate and butyl acetate have much
lower reaction rate constants than the reaction of ethyl acetate.
Other type reactions could be used. For example, the first order
reactions involving the hydrolysis of acetic anhydride has been used
for studying very small volume tubular reactors (2).
The use of a conductivity cell in determining the percent com-
pletion of a reaction would eliminate errors caused by the time need-
ed to stop a reaction when using a titration method of analysis. How-
ever a conductivity cell is very hard to keep calibrated. Any con-
tamination present in the reactor can change the calibration of the
cell. Any conductivity cell used in a flow system will require a
special design of the electrodes to minimize variation in the cell
constant. It might be feasible to make the two conductivity elec-
trodes part of the wall of the tubular reactor. A special mixing

41
device would be needed to make the reactor fluid uniform across the
cross section of the reactor where the conductivity is to be
measured.

42
NOMENCLATURE
a - initial concentration of reactant A
b - initial concentration of reactant B
- concentration of reactant A at any time
D - diffusivity
E - percent completion of a chemical reaction
F - volumetric flow rate
H - milliliters of 0. 09937 normal acid used in stopping chemical reaction in a sample removed from a chemical reactor
k2 - second -order reaction rate constant
L - length of a chemical reactor
M - volume of a sample removed from a chemical reactor
N - normality of sodium hydroxide in a sample removed from a chemical reactor
R - radius of a tubular chemical reactor
r - distance measured from the center of a chemical reactor
S - milliliters of 0. 02050 normal sodium hydroxide needed to titrate a 100 milliliter sample of reactor product
T - temperature in degrees centigrade
t - time
to - minimum retention time in a laminal flow reactor
t average retention time in a laminar flow reactor
- volume of a tubular reactor
CA
-

43
v - fluid velocity at any point, r , in a laminar flow chemical reactor
vo - fluid velocity at the center of a laminar flow chemical reactor
W - volume of distilled water added to a sample removed from a chemical reactor
x - amount of product in a chemical reaction
x - average concentration of products from a laminar flow reactor
- viscosity of a liquid
- pressure gradient acting down a cylindrical reaction vessel.
q
q

44
BIBLIOGRAPHY
1. Bosworth, R.C. L. Distribution of reaction times for laminar flow in cylindrical reactors. The Philosophical Magazine 39:847-862. 1948.
2. Cleland, F.A. and R. H. Wilhelm. Diffusion and reaction in viscous -flow tubular reactor. A. I. Ch. E. Journal 2:489- 497. 1956.
Corrigan, T.E. and F.E. Young. Chemical engineering funda- mentals. General considerations in reactor design - III. Chemical Engineering 63:217-220. Nov. 1955. /r,/,':
4. Daniels, Farrington et al. Experimental physical chemistry. 5th ed. New York, McGraw -Hill, 1956. 482 p.
5. Denbigh, K. G. The kinetics of continuous reaction processes: Application to polymerization. Journal of Applied Chemistry 1:227 -236. 1951.
6. Greenhalgh, R. E. , Ronald L. Johnson and Howard D. Nott. Mixing in continuous reactors. Chemical Engineering Progress 55:44 -48. Feb. 1959.
7. Hovorka, R. B. and H. B. Kendall. Tubular reactor at low flow rates. Chemical Engineering Progress 56:58 -62. Aug. 1960.
8. Jenson, F. W. , G. M. Watson and J. B. Beckham. Study of saponification reaction of ethyl acetate by high frequency titrimetry. Analytical Chemistry 23:1770 - 1773. 1951.
9. Lessells, Gerald A. Evaluate kinetic data rapidly. Chemical Engineering 64:251 -256. Aug. 1957.
O.; Moelwyn -Hughes, E.A. The kinetics of reactions in solution. Oxford, Clarendon Press, 1933. 313 p. 7
11. Siggia, Sidney. Quantitative organic analysis via functional groups. New York, Wiley, 1949. 152 p.
-f
(3.`,

45
12. Stead, Brenda, F.M. Page and K. G. Denbigh. An experimental method for use in chemical kinetics and in the study of tran- sient intermediates. Discussions of the Faraday Society 2:263 -270. 1947.
13. Terry, Ethyl M. and Julius Stieglitz. The coefficient of saponi- fication of ethyl acetate by sodium hydroxide. The Journal of the American Chemical Society 49:2216 -2222. 1927.
14. Wales, Stanley M. Reaction kinetics for chemical engineers. New York, McGraw -Hill, 1959. 338 p.
15. Walker, James. A method for determining velocities of saponification. Proceedings of the Royal Society of London, ser. A, 78:157 -160. 1906.
16. Warder, R. B. Geschwindigkeit der Verseifung von Essig'.ther. Berichte der Deutschen Chemischen Gesellschaft 14:1361- 1365. 1881.
17. Warder, R. B. Relation between temperature and the rate of chemical action. American Chemical Journal 3:203-204. 1881.
18. Willard, Hobart H. , N. Howell Furman and Clark E. Bricker. Elements of quantitative analysis. 4th ed. Princeton, Van Nostrand, 1956. 576 p.

APPENDIX

46
Table 2. Experimental Data for 1 -inch Diameter Reactor
ROTAMETERS WITH PYREX FLOATS At Start At Finish
Ethyl Acetate Reactant Concentration . 0.09971 N. O. 0989 N.
Sodium Hydroxide Reactant Concentration 0. 1003 N. -
Flow Rate Reading Reading Reactor Reactor ML of Ml. of ML of
Run in Reactor of NaOH of EtOAC Inlet Outlet 0.09937 Distilled 0.02050 Number ml. /min. Rotameter Rotameter Temperature
oC Temperature N. Acid Water N. Base
°C Used Added Needed to Sam- ple
1
2
400 400
6. 4
6.4 7. 1
7.1 29. 45 29.5 29.35 29.5
42
42
5, 82
7.52 6.09 7.64
3 600 8.7 9.4 29.25 29.45 49 2.99 7.16 4 600 8.7 9.4 29.35 29.5 49 2.22 6.23
5 800 10.8 11.4 29.25 29.5 53 3.41 5.36 6 800 10.8 11.4 29.35 29.4 53 2.67 3.92
ROTAMETERS WITH STAINLESS STEEL FLOATS At Start At Finish
Ethyl Acetate Reactant Concentration 0. 1001 N. 0.0994 N.
Sodium Hydroxide Reactant Concentration 0, 1002 N.
1200 7.5 8.3 29.4 29,5 61 5.23 6.94 1200 7.5 8.3 29.4 29.4 61 7.67 16.68
9 1400 8.6 9.3 29.4 29.5 63 1.73 6.64 10 1400 8.6 9.3 29.3 29.5 63 8.29 11.56
11 1600 9.6 10.3 29.3 29.5 64 9.43 9.03 12 1600 9.6 10.3 29.3 29.3 64 4.60 6.92
7
8
-- -

47
Table 3, Experimental Data for 1 -inch Diameter Reactor (Rerun)
ROTAMETERS WITH PYREX FLOATS
At Start Ethyl Acetate Reactant Concentration 0.0998 N.
Sodium Hydroxide Reactant Concentration 0. 1001 N.
At Finish 0.0995 N.
Flow Rate Reading Reading Reactor Reactor Ml. of Ml. of Ml. of
in Reactor of NaOH of EtOAC Inlet Outlet 0. 09937 Distilled 0.02050 Run ml. /min. Rotameter Rotameter Temperature Temperature N. Acid Water Ad- N. Base
Number °C °C Used ded to Needed Sample
13 400 6. 4 7, 1 29, 4 29. 4 42 5, 53 7. 89
14 400 6.4 7.1 29.4 29.4 42 5.54 7.94
15 600 8.7 9.4 29.5 29.6 49 3.45 9.51 16 600 8.7 9.4 29.3 29.3 49 5.62 6.41
17 800 10.8 11.4 29.4 29.4 53 5.09 4.70 18 800 10.8 11.4 29.4 29.6 53 0.00 2.90
Ethyl Acetate Reactant Sodium Hydroxide
ROTAMETERS WITH STAINLESS STEEL FLOATS At Finish
Concentration Reactant Concentration
At Start 0. 1002 N. 0. 1003 N.
0. 0992 N.
19 1200 7. 5 8.3 29.4 29.6 61 9.31 15.39 20 1200 7.5 8.3 29.4 29.4 61 1, 60 11.51
21 1400 8.6 9.3 29.4 29.5 63 15.00 17.58 22 1400 8.6 9. 3 29.4 29.4 63 4.60 11.20
23 1600 9.6 10.3 29.4 29.5 64 9,94 11.02 24 1600 9.6 10.3 29.4 29.5 64 0.00 4.49

48
Table 4, Experimental Data for 1 -1/4 Inch Diameter Reactor
ROTAMETERS WITH PYREX FLOATS
Ethyl Acetate Reactant Concentration Sodium Hydroxide Reactant Concentration
At Start At Finish 0. 1001 N. O. 0995 N. 0.0999 N.
Flow Rate Reading Reading Reactor in Reactor of NaOH of EtOAC Inlet
Reactor Ml. of Ml. of Ml. of Outlet 0, 09937 Distilled 0.02050
Run Number
ml. /min. Rotameter Rotameter Temperature Temperature N. Acid Water Ad- N. Base
°C °C Used de to Needed Sample
25 400 6.4 7.1 29.4 29.5 42 3.73 4.21 26 400 6.4 7.1 29.3 29.4 42 2.74 3.62
27 600 8.7 9.4 29.45 29.6 49 1.32 6.65 28 600 8.7 9.4 29.3 29.4 49 0.55 7.05
29 800 10.8 11.4 29.3 29.4 53 2.42 4.02 30 800 10.8 11.4 29.4 29.4 53 1.23 5.34
ROTAMETERS WITH STAINLESS STEEL FLOATS
Ethyl Acetate Reactant Concentration Sodium Hydroxide Reactant Concentration
At Start At Finish 0. 1006 N. 0.0998 N.
0,0990N..
31 1200 7.5 8.3 29.3 29.4 61 1.61 12.50 32 1200 7.5 8.3 29.3 29.5 61 2. 02 12.50
33 1400 8.6 9.3 29.3 29.4 63 2.08 10.43 34 1400 8.6 9.3 29.3 29.4 63 1.94 7.30
35 1600 9.6 10.3 29.4 29.5 64 2.94 6.57 36 1600 9.6 10.3 29.3 29.5 64 1.44 7.36

49
Table 5, Experimental Data for 1-1/2 Inch Diameter Reactor
ROTAMETERS WITH PYREX FLOATS
At Start 0.0996 N.
0. 1000 N.
Ethyl Acetate Reactant Concentration Sodium Hydroxide Reactant Concentration
At Finish 0.0994 N.
Flow Rate Reading Reading Reactor Reactor Ml. of Ml. of Ml. of
Run in Reactor of NaOH of EtOAC Inlet Outlet 0.09937 Distilled 0.02050 Number ml. /min. Rotameter Rotameter Temperature Temperature N. Acid Water Ad- N. Base
°C oC Used ded to Sample
Needed
37 400 6.4 7.1 29.3 29.5 42 3.22 3.96 38 400 6.4 7.1 29.3 29.4 42 2.40 3.37
39 600 8.7 9.4 29.3 29.6 49 3.99 5.35 40 600 8.7 9.4 29.3 29.5 49 3.33 3.56
41 800 1.0.8 11.4 29.3 29.6 53 4.59 0.65 42 800 10.8 11.4 29.3 29.6 53 8.89 4.62
ROTAMETERS WITH STAINLESS STEEL FLOATS
At Start At Finish Ethyl Acetate Reactant Concentration Sodium Hydroxide Reactant Concentration
0.0997 N.
0. 1000 N.
0.0988 N.
43 1200 7.5 8.3 29.3 29.5 61 5.07 11.80 44 1200 7.5 8.3 29.4 29.5 61 4.63 13. 53
45 1400 8.6 9.3 29.3 29.6 63 7.45 12.52 46 1400 8. 6 9.3 29.3 29.6 63 5.47 10.27
47 1600 9.6 10.3 29.3 29.5 64 1.62 5.81 48 1600 9.6 10.3 29.3 29.5 64 8.35 10.39
- - --

50
Table 6«. Experimental Data for 2 Inch Diameter Reactor
ROTAMETERS WITH PYREX FLOATS At Start
Ethyl Acetate Reactant Concentration Sodium Hydroxide Reactant Concentration
0. 0998 N.
0. 0999 N.
At Finish 0. 0993 N.
Flow Rate Reading Reading Reactor Reactor Ml. of Ml. of Ml. of Run in Reactor of NaOH of EtOAC Inlet Outlet 0.09937 Distilled 0. 02050 Number ml. /min. Rotameter Rotameter Temperature Temperature N. Acid Water Ad- N. Base
°C °C Used ded to Sample
Needed
49 400 6,4 7.1 29.4 29.5 42 24.48 4.07 50 400 6.4 7.1 29.4 29.5 42 51.61 15.01
51 600 8.7 9.4 29,3 29.5 49 18. 70 7.61 52 600 8.7 9.4 29.3 29.45 49 22.48 10.42
53 800 10.8 11.4 29.4 29.5 53 17.11 10.00 54 800 10.8 11.4 29.3 29.5 53 17.19 10.18
ROTAMETERS WITH STAINLESS STEEL FLOATS
Ethyl Acetate Reactant Concentration Sodium Hydroxide Reactant Concentration
At Start At Finish 0.0998 N. 0.0993 N.
0. 1000 N.
55 1200 7.5 8.3 29.3 29.4 61 6.61 12.62 56 1200 7.5 8.3 29.4 29.4 61 7.63 12.48
57 1400 8.6 9.3 29.6 29.4 63 5.66 9.11 58 1400 8.6 9.3 29.3 29.6 63 1.51 7.00
59 1600 9.6 10.3 29.4 29.6 64 5.94 8.95 60 1600 9.6 10.3 29.4 29.6 64 8.00 8.99

51
Table 7 Experimental Data for 2 Inch Diameter Reactor (Rerun)
ROTAMETERS WITH PYREX FLOATS
Ethyl Acetate Reactant Concentration Sodium Hydroxide Reactant Concentration
At Start At Finish 0. 1002 N. O. 0991 N. 0.0998 N. - ---
Flow Rate Reading Reading Reactor Reactor Ml. of Ml. of ML of Run in Reactor of NaOH of EtOAC Inlet Outlet 0.09937 Distilled 0.02050 N. Number ml. /min. Rotameter Rotameter Temperature Temperature N. Acid Water Ad- Base
°C °C Used ded to Needed Sample
61 400 6.4 7.1 29.3 29.4 42 37.31 7.16 62 400 6.4 7.1 29.4 29.6 42 35.53 8.61
63 600 8.7 9.4 29.35 29.5 49 13.90 2,91 64 600 8.7 9.4 29.3 29.45 49 22.46 4.06
65 800 10.8 11.4 29.3 29.5 53 24.53 12.91 66 800 10.8 11.4 29.4 29.6 53 6.82 4,31
ROTAMETERS WITH STAINLESS STEEL FLOATS
At Start At Finish Ethyl Acetate Reactant Concentration Sodium Hydroxide Reactant Concentration
0. 1000 N. O. 0993 N. 0.1004 N. ----
67 1200 7.5 8.3 29.4 29.6 61 10.63 15.31 68 1200 7.5 8.3 29.4 29.6 61 0.41 9.83
69 1400 8.6 9.3 29.4 29.7 63 6.84 10.84 70 1400 8.6 9.3 29.4 29.5 63 3.58 7.72
71 1600 9.6 10.3 29.3 29,5 64 6.25 7.30 72 1600 9.6 10.3 29.3 29.5 64 0.47 5.86

52
Table 8, Reactor Measurements
Section Nominal Pipe Actual Internal Size in Inches Pipe Diameter
In Inches
Internal Pipe Volume in Milliliters
Length of Pipe Section in Feet
Reactor 1 1.055 1305 7.56
Reactor 1 -1/4 1.365 1310 4,53
Reactor 1 -1/2 1.592 1320 3.34
Reactor 2 2.057 1310 2.00
Calming 1 1. Q55 520 3.00
Outflow 1 1.055 42 0.19
Table 9, Calibration of the Ethyl Acetate Rotameter Using a Pyrex Float
Brooks Rotameter Tube 6 -15 -2 Water Temperature -70° F
Reading on Time in Volume of Water Calculated Rate of Rotameter Seconds Collected in the Flow In Milliliters
Given Time in Per Minute Milliliters
13 250.4 2014 482.59
12 280.8 2015 431.56
11 318,2 2009 378.82
10 366.6 2022 330.93
9 430.0 2025 282.56
8 505.7 2010 238.48
7 606.0 2020 200.00
6 375.4 1008 161.11
2 468.2 198 25.37
1 336.7 32 5.70

53
Table 10. Calibration of the Ethyl Acetate Rotameter Using a Stainless Steel Float
Brooks Rotameter Tube 6 -15 -2 Water Temperature -70°F
Reading on Rotameter
Time in Seconds
Volume of Water Collected in the Given Time in Milli - liters Per Minute
Calculated Rate of Flow in Milliliters Per Minute
13 112.3 2054 1097.42
12 123.7 2032 985.61
11 138.0 2021 878.69
10 156.3 2019 775.05
9 182.3 2035 669.78
8 211.9 2025 573.38
7 268.3 2021 451.96
6 166.0 1025 370.48
5 205.7 1006 293.44
4 63.3 245 232.23
3 93.3 248 159.48

54
Table 11. Calibration of the Sodium Hydroxide Rotameter Using a Pyrex Float
Brooks Rotameter Tube 6 -15 -2 Water Temperature -70°F
Reading on Rotameter
Time in Seconds
Volume of Water Collected in the Given Time in Milli- liters
Calculated Rate of Flow in Milliliters Per Minute
13 239.4 2019 506.01
12 264.4 2021 458.62
11 296.8 2025 409.36
10 335.8 2026 362.00
9 386.4 2023 314.13
8 452.9 2023 268.00
7 535.3 2015 225.85
6 328.1 1012 185.06
5 415.6 1014 146.39
2 253.8 180 42.55
1 300.0 57 11.40

55
Table 12. Calibration of the Sodium Hydroxide Rotameter Using a Stainless Steel Float
Brooks Rotameter Tube 6 -15 -2 Water Temperature -70 °F
Reading on Rotameter
Time in Seconds
Volume of Water Collected in the Given Time in Milli- liters
Calculated Rate of Flow in Milliliters Per Minute
13 104.4 2025 1163.79
12 114.3 2015 1057.74
11 127.6 2028 953.60
10 143.0 2023 848.81
9 163.2 2021 743.01
8 189.2 2029 643.4S
7 221.0 2028 550.59
6 134.6 1022 455.57
5 166,7 1016 365.69
4 51.0 240 282.35
3 68.7 240 209.61
2 91.3 190 124.86
1 120.0 120 60.00

56
Table 13. Calculated Data for the Equimolar Reaction of 0. 1 Normal Ethyl Acetate with 0. 1
Normal Sodium Hydroxide at 29. 4°C
Residence Time in Minutes
Percent Completion of Reaction in a Plug Flow Reactor
Percent Completion of Reaction is a Laminar Flow Reactor
Percent Completion of Re action in a
Stirred Tank Reactor
4.68
3.75
3. 12
66.20
61.10
56.66
60.73
55. 78
51.35
49.66
45.94
42. 78
2.68 52.90 47.79 40. 18
2. 34 49.50 44.60 37.86
1.87 43.94 39,36 34.00
1.56 39.52 35. 45 31.06
1.34 35.96 32. 18 28. 62
1.17 32.90 29. 48 26.48
0.75 23.90 21.55 20. 10
0. 50 17. 32 15.78 15. 20
0. 25 9.48 8.83 8. 80

57
Table 14. Reynolds Number for Various Flow Rates
Flow Rate in Reactor in Milliliters Per Minute
Pipe Diameters (I. D. )
1 inch 1 -1/4 inch 1 -1/2 inch 2 inch
400 395 305 262 202
600 592 458 392 304
800 790 610 523 405
1200 1184 916 785 607
1400 1382 1068 916 708
1600 1579 1221 1046 810