effective antithrombotic bio-interface supplementary
TRANSCRIPT
Supplementary Information
Introducing Multiple Bio-functional Groups on
Poly(ether sulfone) Membrane Substrate to Fabricate an
Effective Antithrombotic Bio-interface
Lingren Wang,a,b Min He,b Tao Gong,a Xiang Zhang,b Lincai Zhang,a Tao Liu,a Wei Ye,a Changjiang
Pan,*,a and Changsheng Zhao*,b
a Jiangsu Provincial Key Laboratory for Interventional Medical Devices. Huaiyin Institute of
Technology, Huaian 223003, China
b College of Polymer Science and Engineering, State Key Laboratory of Polymer Materials
Engineering, Sichuan University, Chengdu 610065, China
MATERIALS
The 3,3’ -disulfonated-4,4’ -difluorophenyl, disodium salt (≧99%), 4,4’ -
difluorobiphenyl sulfone (≧99%), 4,4’ -sulfonyldiphe- nol (≧99%), 3,3’ -diamino-
4,4’ -dihydroxydiphenyl sulfone (≧99%) and heparin sodium salt were purchased
from Xiya Reagent Corporation (China) and used without purification. Toluene, N,
N-dimethylacetamide (DMAc) and other solvents (Chemical Reagent Factory of
Kelong, China) were dried by stirring with CaH2 and then distilled before use.
Poly(ether sulfone) (PES; Ultrason E6020P) was purchased from BASF (Germany),
and dried at 90 °C for 24 h before use. 2-(N-Morpholino)ethanesulfonic acid (MES),
N-Hydroxysuccinimide (NHS), carbodiimide (EDC), bovine serum albumin (BSA),
Electronic Supplementary Material (ESI) for Biomaterials Science.This journal is © The Royal Society of Chemistry 2017

bovine serum fibrinogen (BFG), 3-(4,5-dimethylthiazol-2-yl)-2,5-diphenyltetrazolium
bromide (MTT), fluorescein isothiocyanate isomer I (FITC) were purchased from
Sigma Aldrich (US). All the other chemicals (analytical grade) were obtained from
Chemical Reagent Factory of Kelong (China), and were used without further
purification.
Characterization of PBHs:
Characterization of CPES and SNPES: The morphology of the hydrogels was
observed by scanning electron microscopy (SEM) using a scanning electron micro-
scope (JSM-7500F, JEOL). To prepare the SEM samples, the hydrated hydrogels
were frozen, and then lyophilized and sectioned. Subsequently, the samples were
attached to a support and coated with a gold layer. Finally, the SEM experiment was
carried out at an accelerating voltage of 5 kV. Fourier transform infrared (FT-IR)
spectra were obtained on a Nicolet-560 spectrophotometer (Nicol, US) between 4000
and 500 cm-1 with the resolution of 2 cm-1. A Q500 Thermogravimetric analyzer (TA
instruments, USA) was used to obtain the thermogravimetric analysis (TGA) curves
of the hydrogels under a dry nitrogen atmosphere, and the temperature range was
from 50 °C to 700 °C at a heating rate of 10 °C/min. The swelling ratio of the
hydrogel was measured by a gravimetric method. A certain amount of dry hydrogel
piece was weighed (Wd) and immersed in PBS (PH = 7.4) at room temperature. The
weight of the swollen gel (Ws) at different times, t, was directly measured after gently
removing excess of water using a filter paper. The swelling ratio was calculated using
eqn (1):
Fourier transform infrared (FT-IR) spectra were obtained on a Nicolet-560
spectrophotometer (Nicol, US) between 4000 and 500 cm-1 with the resolution of 2
cm-1. 1H NMR data were obtained with a BRUKER spectrometer (400 MHz,
BRUKER, Germany). The number-average molecular weight of the polymer was
determined by gel permeation chromatography (GPC) with an HP 1100 device
(Waters, US), in which two PL gel columns (10 μm, 104 Å; 10 μm, 500 Å) were used,
monodisperse polystyrene was the standard, and the mobile phase was dimethyl form
amide. The sample concentration was 1.0 g/L. The detector was refractive index
detector, and the flow rate was 1.0 ml/min.
Characterization of Membranes: Attenuated Total Reflection-Fourier transform
infrared spectroscopy (ATR-FTIR) was obtained on a Nicolet-560 spectrophotometer
(Nicol, US) between 4000 and 500 cm-1, with a resolution of 2 cm-1.
The cross-sectional morphologies of the membranes were observed by scanning
electron microscope (SEM) (Hitachi, Japan). AFM images of the samples were
acquired using a Multimode Nanoscope V scanning probe microscopy (SPM) system
(Bruker, USA). The hydrophilicity of the membrane surface was characterized by
contact angle measurement using a contact angle goniometer (OCA20, Dataphysics,
Germany) equipped with video capture.
Steady water flux of the prepared membrane was measured using the apparatus
as described in our previous study.3 The pressure was supplied by an air compressor.
The dead-end ultrafiltration (UF) cell was used with an effective membrane area of
13.8 cm2. The test membranes were pre-compacted by solution flow for 30 min in
order to get steady filtration. Then, the water flux was determined at the pH values
ranging from 2.2 to 11.2, randomly, and the filtration experiments were performed at
room temperature. The water flux was calculated using Eq. S1:
(S1) Flux( mL
m2h mm Hg) =V
Stp
where V is the volume of the permeate solution (mL), S is the effective
membrane area (m2), t is the time (h), and P is the pressure applied to the membrane
(mm Hg).
Protein Adsorption: Protein adsorption experiments were carried out using BSA and
BFG solutions under static conditions. First, the membrane with an area of 1 × 1 cm2
was immersed into phosphate buffer solution (PBS, pH 7.4), containing BSA or FBG
with a concentration of 1 mg/mL, and incubated at 37 °C for 1 h; it was subsequently
rinsed slightly with PBS solution and double distilled water. Then the membrane was
placed in a washing solution (2 % sodium dodecyl sulfate at 37 °C) and shaken for 2
h to remove the adsorbed protein. The protein concentration in the washing solution
was determined by the Micro BCATM Protein Assay Reagent Kit (PIERCE), and then
the adsorbed protein amount was calculated. The experiments were repeated three
times, and the data were expressed as mean ± SD.
BLOOD COMPATIBILITY

The collection of human blood, preparation of plasma and related experiments
were all performed in the Institute of Blood Transfusion. All the experiments were
performed in compliance with the relevant laws and institutional guidelines, and all
the experiments are informed and approved by the institutional committee and
performed by the staff of the institute.
Platelet Adhesion: To study the platelet adhesion, the modified membrane (1 × 1 cm2)
was immersed in phosphate-buffered saline (PBS, pH 7.4) solution and equilibrated at
37 °C for 1 h. The PBS solution was removed, and 1 mL of fresh PRP was dropped in
each well of the culture plate and then incubated at 37 °C for 2 h. Then the PRP was
decanted off, the membrane was rinsed three times with PBS solution. The adhered
platelets were fixed using 2.5 wt.% glutaraldehyde in PBS at 4 °C for 24 h. Finally,
the sample was washed with PBS solution, and dehydrated with a series of
ethanol/PBS solution mixtures with increasing ethanol concentration (25, 50, 75 and
100 wt.%), and then dried at room temperature. The platelet adhesion was observed
using SEM (Hitachi, Japan).
Clotting Time: To evaluate the antithrombogenicity of the modified membranes,
activated partial thromboplastin time (APTT) and thromboplastin time (TT) were
measured by a semi-automatic blood coagulation analyzer CA-50 (Sysmex
Corporation, Kobe, Japan).
The APTT test method was performed as follows: The membrane (0.5 × 0.5 cm2,
three pieces) was immersed into 0.2 mL PBS buffer (pH 7.4) for 1 h. Then, the PBS

was removed, and 0.1 mL of fresh PPP was introduced. After incubating at 37 °C for
30 min, 50 μL of APTT agent (Dade Actin Activated Cephaloplastin Reagent,
Siemens; incubated 10 min before use) was added, followed by the addition of 50 μL
of the incubated PPP, and incubated at 37 °C for 3 min. Thereafter, 50 μL of 0.025 M
CaCl2 solution was added, and then the APTT was measured. For TT test, 50 μL
incubated PPP was mixed well with 100 μL of TT agent (Thromborel® S, Siemens;
incubated 10 min before use) at 37 °C for 2 min, and the TT was measured. At least
three measurements were averaged to get a reliable value, and the results were
analyzed by a statistical method.
Elisa Kit Method: For platelet activation test: The whole blood was collected with a
net venipuncture without tourniquet using vacuum tubes containing sodium heparin as
anticoagulant (anticoagulant to blood ratio, 1:9) and centrifuged for 15 min at 2500 g
(4 °C) to obtain plasma. The plasma was diluted 10 fold in the PF-4 Sample Diluent
to obtain PF-4 Standard Solution. A series of graded PF-4 Standard Solution/PF-4
Sample Diluent (1/0, 0.5/0.5, 0.2/0.8, 0.1/0.9, 0.05/0.95, 0/1) were generated by
reconstituting the Standard Solution with Sample Diluent, and the Sample Diluent
served as the zero standard. Then the plasma was mixed with specific inhibitors. The
control experiment was conducted simultaneously using the same method without
adding samples. 200 μL of PF-4 Standard Solution was added per well, and the wells
were covered with a sealing tape and incubated for 1 hour. After incubating, the plate
was washed as described above. Then, 200 μL of Conjugate Solution which was
prepared by reconstituting Conjugate with 7.5 mL of Conjugate Diluent was added
per well and incubated at room temperature for 1 hour. After incubating, the plate was
washed as described above. Then, 200 μL of TMB Substrate was added to each well
and incubated for 5 min. Finally, 50 μL of Stop Solution was added to each well, and
the color would change. The whole experiment was manipulated free from light. The
absorbance could be read on a microplate reader (the microplate reader was turned on
and the program was set up in advance) at a wavelength of 450 nm immediately, and
then the PF-4 amount was calculated. At least three measurements were averaged to
get a reliable value, and the results were analyzed by a statistical method.
For thrombin-antithrombin complex activation test: For coagulation activation
test, the whole blood was collected using one-tenth volume of 0.1 M sodium citrate as
an anticoagulant, and centrifuged for 10 min at 3000 g (4 °C) to obtain plasma. The
TAT reagents were freshly diluted and brought to room temperature before use. 120
ng/mL standard solution was generated by reconstituting the 180 ng of Human TAT
Complex Standard with 1.5 mL of MIX Diluent. Prepared duplicate standard points
by serially diluting the standard solution 1:3 with MIX Diluent to produce 40, 13.33,
4.444 and 1.481 ng/mL solutions, and the MIX Diluent served as the zero standard.
Then the plasma was mixed with specific inhibitors. The control experiment was
conducted simultaneously using the same method without adding samples. 50 μL of
Human TAT Complex Standard was added per well, and the wells were covered with
a sealing tape and incubated for 2 hours (37 °C). Then the wells were washed for 7
times with 200 μL of Wash Buffer manually (Invert the plate each time and decant the
contents hit 10-15 times on absorbent material to completely remove the liquid. 50 μL
of Biotinylated Human Thrombin Antibody was added to each well and incubated for
1 hour. After incubating, the plate was washed as described above. Then 50 μL of
Streptavidin-Peroxidase Conjugate was added to each well and incubated for about 30
min. The plate was washed as described above. Then 50 μL of Chromogrn Substrate
was added per well and incubated for about 20 min or till the optimal color density
developed. Gently tap the plate to ensure thorough mixing and break the bubbles in
the well with pipette tip. Finally, 50 μL of Stop Solution was added to each well, and
the color would change from blue to yellow. The whole experiment was manipulated
free from light. The absorbance could be read on a microplate reader (the microplate
reader was turned on and the program was set up in advance) at a wavelength of 450
nm immediately, and then the TAT amount was calculated. At least three
measurements were averaged to get a reliable value, and the results were analyzed by
a statistical method.
For Blood Related Complement Activation tests: For C3a test, the whole blood
was collected using vacuum tubes containing disodium EDTA as anticoagulant
(anticoagulant to blood ratio, 1:9) and centrifuged for 15 min at 1 000 g (4 °C) to
obtain plasma. The plasma was diluted 500 fold in the C3a Sample Diluent to obtain
Standard Solution. 5 ng/mL standard solution was generated by reconstituting the 9.6
ng of C3a Standard with 1.92 mL of Standard Diluent. Prepared duplicate standard
points by serially diluting the standard solution 1:2 with Standard Diluent to produce
2.5, 1.25, 0.63, 0.31, 0.16 and 0.08 ng/mL solutions, and the C3a Standard Diluent
served as the zero standard. Then the plasma was mixed with specific inhibitors. The
control experiment was conducted simultaneously using the same method without
adding samples. 100 μL of C3a Standard Solution was added to each well, followed
by the addition of 50 μL of ELISA Diluent, and then the wells were covered with a
sealing tape and incubated at room temperature for 2 hours. After incubating, the plate
was washed as described above. Then, 100 μL of Working Detector which was
prepared by reconstituting 48 μL of Enzyme Concentrate with 120 mL of Detection
Antibody was added per well and incubated for 1 hour. After incubating, the plate
was washed as described above. Then, 100 μL of TMB One Step Substrate Reagent
was added to each well and incubated for 30 min. Finally, 50 μL of Stop Solution was
added to each well, and the color would change. The whole experiment was
manipulated free from light. The absorbance could be read on a microplate reader (the
microplate reader was turned on and the program was set up in advance) at a
wavelength of 450 nm immediately, and then the C3a amount was calculated. At least
three measurements were averaged to get a reliable value, and the results were
analyzed by a statistical method.
For C5a test, the whole blood was collected using vacuum tubes containing
disodium EDTA as anticoagulant (anticoagulant to blood ratio, 1:9) and centrifuged
for 15 min at 1000 g (4 °C) to obtain plasma. The plasma was diluted 10 fold in the

C5a Sample Diluent to obtain Standard Solution. 5 ng/mL standard solution was
generated by reconstituting the 9.6 ng of C5a Standard with 1.92 mL of Standard
Diluent. Prepared duplicate standard points by serially diluting the standard solution
1:2 with Standard Diluent to produce 2.5, 1.25, 0.63, 0.31, 0.16 and 0.08 ng/mL
solutions, and the C5a Standard Diluent served as the zero standard. Then the plasma
was mixed with specific inhibitors. The control experiment was conducted
simultaneously using the same method without adding samples. 100 μL of C5a
Standard Solution was added to each well, followed by the addition of 50 μL of
ELISA Diluent, and then the wells were covered with a sealing tape and incubated at
room temperature for 2 hours. After incubating, the plate was washed as described
above. Then, 100 μL of Working Detector which was prepared by reconstituting 48
μL of Enzyme Concentrate with 120 mL of Detection Antibody was added per well
and incubated for 1 hour. After incubating, the plate was washed as described above.
Then, 100 μL of TMB One Step Substrate Reagent was added to each well and
incubated for 30 min. Finally, 50 μL of Stop Solution was added to each well, and the
color would change. The whole experiment was manipulated free from light. The
absorbance could be read on a microplate reader (the microplate reader was turned on
and the program was set up in advance) at a wavelength of 450 nm immediately, and
then the C5a amount was calculated. At least three measurements were averaged to
get a reliable value, and the results were analyzed by a statistical method.
Flow Cytometry: Neutrophil cell surface markers were evaluated by flow cytometry.
Flow cytometric samples were prepared as described previously, and the whole blood
flow cytometry for leukocyte CD11b analysis has been described in detail elsewhere.4
The control experiment was conducted simultaneously using the same method
without adding the test samples. CD11b expression was determined as the mean
fluorescence intensity. The experiments were repeated three times, and the results
were expressed as mean ± SD. The statistical significance was assessed by Student’s
t-test, with the level of significance set at P < 0.05.
CYTOCOMPATIBILITY
Cell Culture: Human umbilical vein endothelial cells (HUVECs) were grown in R1
640 medium supplemented with 10 % fetal bovine serum (FBS, Hyclone, USA), 2
mmol L-glutamine and 1 % (V/V) antibiotics mixture (10000 U penicillin and 10 mg
streptomycin). Cultures were maintained in humidified atmosphere of 5 % CO2 at 37
°C (Queue Incubator, Paris, France). Confluent cells were detached from the culture
flask with sterile PBS and 0.05 % trypsin/EDTA solutions, and the culture medium
was changed every day.
The PES and GCMs were cut into 1 × 1 cm2 to suit the size for 24-well cell-
culture polystyrene plates, and pre-wetted by immersion in the culture medium for 3 h
in a 37 °C incubator. And then the membranes were placed into the cell-culture plates,
rinsed with PBS and sterilized by γ-ray.
Fluorescence Staining: In this work, the cells cultured in the well without membrane
was served as control; and the HUVECs were seeded onto the membrane at a density
of approximately 2.5 × 10⁴ cells/cm2. After predetermined time intervals, the 24-well
cell culture polystyrene plate was washed by PBS solutions for three times, and then 2
mL 4 % paraformaldehyde solution (PBS) was added to each well and fastened for 30
min at 4 °C. The cell culture plate was washed by PBS solution for three times again.
Then the cell culture plate was placed into an incubator (37 °C, 5 % CO2) and
incubated for 10 min, and then 300 μL FITC (0.01 mg/mL) was added to each well.
After incubating, the cell culture plate was washed by PBS solution for three times.
The whole experiment was manipulated free from light. Then the cell culture plate
was enwrapped in a foil paper, and fluorescence microscope was used to observe the
fluorescence images of the samples.
MTT Assay: The endotheliocytes were seeded onto the membrane at a density of
approximately 2.5 × 10⁴ cells/cm2. Cells cultured in the wells without membrane
served as control in this study. For the MTT assay, the viability of the vein endothelial
cells was determined after cell culture for 2, 4, and 6 days. After predetermined time
intervals, 45 μL MTT solution (1 mg/mL in the test medium) was added to each well
and incubated for 4 h at 37 °C. Mitochodrial dehydrogenases of viable cells
selectively cleave the tetrazolium ring, yielding blue/purple formazan crystals. Then,
400 μL of ethanol was added to dissolve the formazan crystals. Thus, the quantity of
the formazan dissolved in the ethanol reflects the level of cell metabolism. The
solution was shaken homogeneously for about 15 min. The sample solution was
aspirated into microtiter plates and the optical density was read in a Microplate reader
(model 550, Bio-Rad) at 492 nm. All the experiments were repeated three times, and
the results were expressed as means ± SD. The statistical significance was assessed by
Student’s t-test with the level of significance set at P < 0.05.
RESULTS AND DISCUSSION
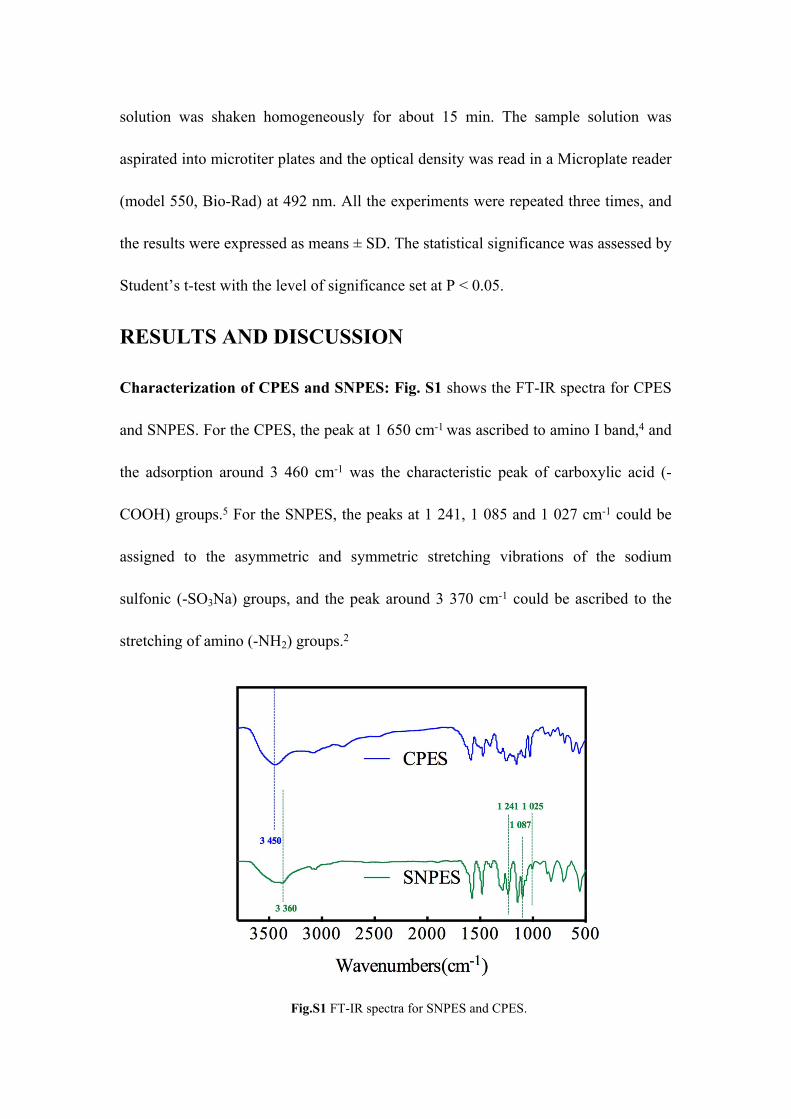
Characterization of CPES and SNPES: Fig. S1 shows the FT-IR spectra for CPES
and SNPES. For the CPES, the peak at 1 650 cm-1 was ascribed to amino I band,4 and
the adsorption around 3 460 cm-1 was the characteristic peak of carboxylic acid (-
COOH) groups.5 For the SNPES, the peaks at 1 241, 1 085 and 1 027 cm-1 could be
assigned to the asymmetric and symmetric stretching vibrations of the sodium
sulfonic (-SO3Na) groups, and the peak around 3 370 cm-1 could be ascribed to the
stretching of amino (-NH2) groups.2
Fig.S1 FT-IR spectra for SNPES and CPES.
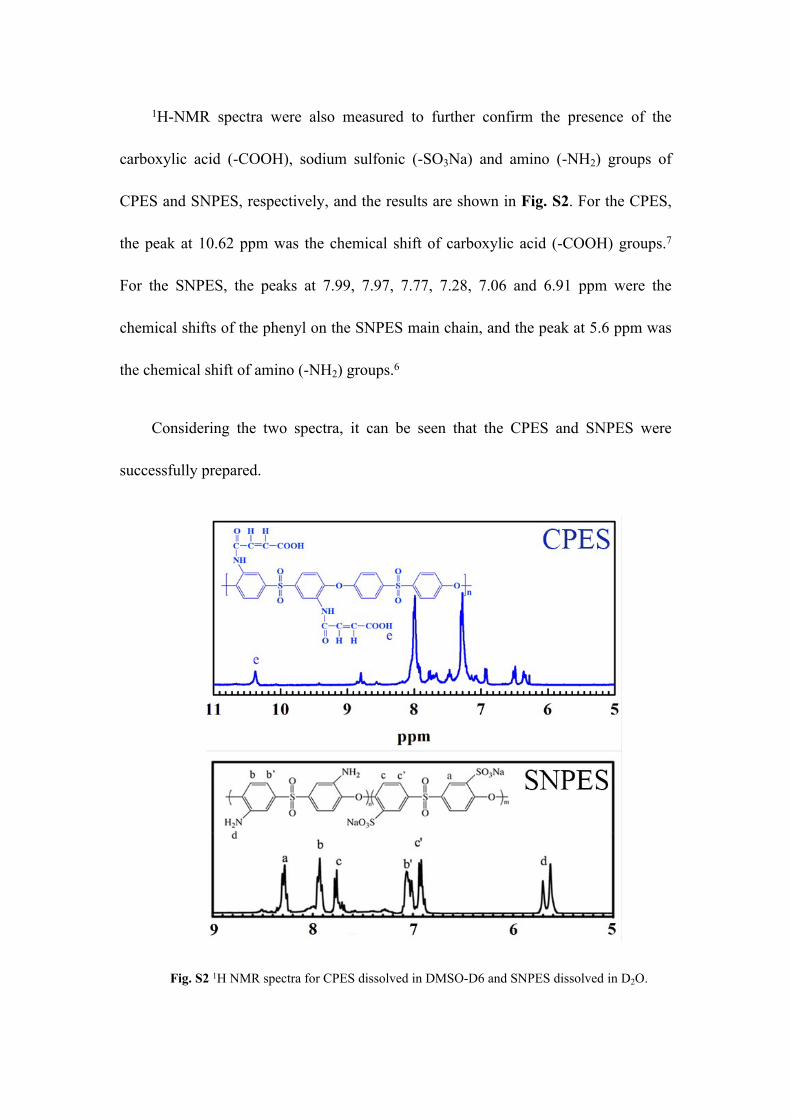
1H-NMR spectra were also measured to further confirm the presence of the
carboxylic acid (-COOH), sodium sulfonic (-SO3Na) and amino (-NH2) groups of
CPES and SNPES, respectively, and the results are shown in Fig. S2. For the CPES,
the peak at 10.62 ppm was the chemical shift of carboxylic acid (-COOH) groups.7
For the SNPES, the peaks at 7.99, 7.97, 7.77, 7.28, 7.06 and 6.91 ppm were the
chemical shifts of the phenyl on the SNPES main chain, and the peak at 5.6 ppm was
the chemical shift of amino (-NH2) groups.6
Considering the two spectra, it can be seen that the CPES and SNPES were
successfully prepared.
Fig. S2 1H NMR spectra for CPES dissolved in DMSO-D6 and SNPES dissolved in D2O.
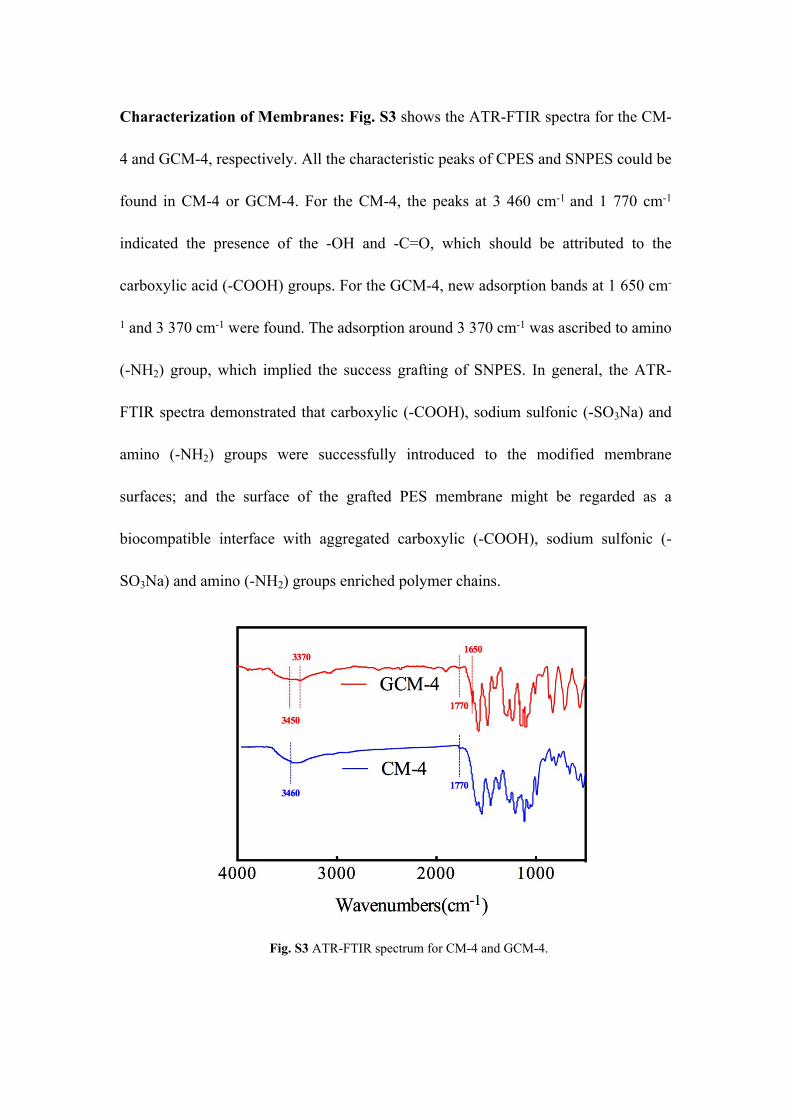
Characterization of Membranes: Fig. S3 shows the ATR-FTIR spectra for the CM-
4 and GCM-4, respectively. All the characteristic peaks of CPES and SNPES could be
found in CM-4 or GCM-4. For the CM-4, the peaks at 3 460 cm-1 and 1 770 cm-1
indicated the presence of the -OH and -C=O, which should be attributed to the
carboxylic acid (-COOH) groups. For the GCM-4, new adsorption bands at 1 650 cm-
1 and 3 370 cm-1 were found. The adsorption around 3 370 cm-1 was ascribed to amino
(-NH2) group, which implied the success grafting of SNPES. In general, the ATR-
FTIR spectra demonstrated that carboxylic (-COOH), sodium sulfonic (-SO3Na) and
amino (-NH2) groups were successfully introduced to the modified membrane
surfaces; and the surface of the grafted PES membrane might be regarded as a
biocompatible interface with aggregated carboxylic (-COOH), sodium sulfonic (-
SO3Na) and amino (-NH2) groups enriched polymer chains.
Fig. S3 ATR-FTIR spectrum for CM-4 and GCM-4.

Fig. S4 XPS spectra for CM-4 and GCM-4 surface.
Fig. S4 presents the XPS spectrum of GCM-4 surface at an X-ray incidence
angle of 85°. The elemental content of N for the CM-4 and GCM-4 surface was 1.6 %
and 3.1 %, which revealed that the SNPES was successfully grafted on the surface of
CM-4.
Coagulation Activation: Thrombin activation is generated as soon as blood is in
contact with a material surface, and it is central to studies assessing materials blood
compatibility, critically positioned in the coagulation cascade to cleave fibrinogen to
fibrin, resulting in blood clot formation. However, quantification of thrombin
generation by the unphysiologic surface has been the primary challenge for the
hemostasis laboratory. In the present study, thrombin generation was evaluated via the
measurement of the amount of thrombin-antithrombin III (TAT), since the thrombin
would be immediately neutralized when reacted with antithrombin-III, resulting in the
formation of a TAT complex.8 Thus, the compatibility of the grafted membranes with
coagulation system was investigated in terms of TAT generation.
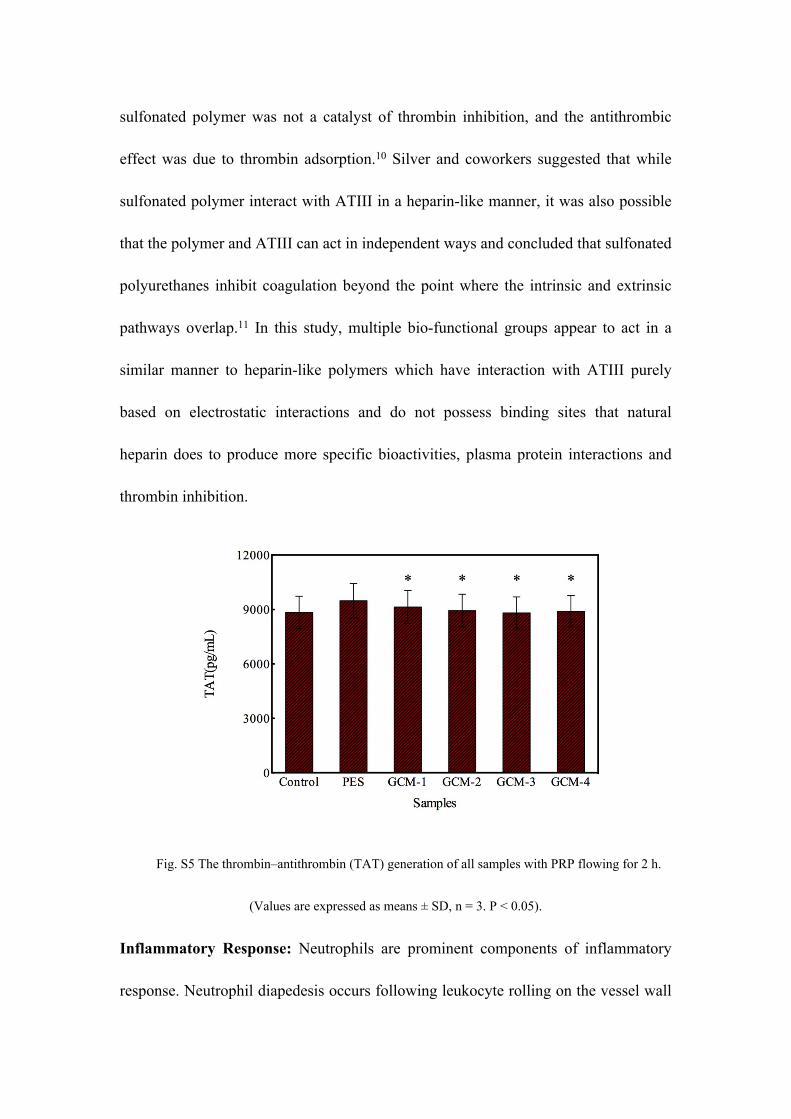
Fig. S5 shows the thrombin-antithrombin (TAT) generation results for the
membranes. It could be noticed that the concentration of TAT for the pristine PES
membrane was slightly higher than that of the control sample, and no significant
increase was observed in the values of the TAT generation amounts for the GCMs.
This phenomenon suggested that the TAT generation was not affected by the addition
of the CPES and SNPES (P < 0.05), and the generated TAT level of PES membrane
was ameliorated through the modification. This might be caused by the introduction
of heparin-like (sodium carboxylic and sodium sulfonic) groups and increased
membrane hydrophilicity as the results of the addition of the CPES and SNPES.
Yahapour et. al observed a reduction in thrombin generation on hydrophilic surfaces
compared to hydrophobic ones.9 However, Charef and coworkers showed that the
sulfonated polymer was not a catalyst of thrombin inhibition, and the antithrombic
effect was due to thrombin adsorption.10 Silver and coworkers suggested that while
sulfonated polymer interact with ATIII in a heparin-like manner, it was also possible
that the polymer and ATIII can act in independent ways and concluded that sulfonated
polyurethanes inhibit coagulation beyond the point where the intrinsic and extrinsic
pathways overlap.11 In this study, multiple bio-functional groups appear to act in a
similar manner to heparin-like polymers which have interaction with ATIII purely
based on electrostatic interactions and do not possess binding sites that natural
heparin does to produce more specific bioactivities, plasma protein interactions and
thrombin inhibition.
Fig. S5 The thrombin–antithrombin (TAT) generation of all samples with PRP flowing for 2 h.
(Values are expressed as means ± SD, n = 3. P < 0.05).
Inflammatory Response: Neutrophils are prominent components of inflammatory
response. Neutrophil diapedesis occurs following leukocyte rolling on the vessel wall

promoted by selectins, and firm adhesion of rolling leukocytes is mediated by
members of the β2 integrin, which are four heterodimers with distinct α subunits
(CD11a-CD11d) sharing a β subunit. Among these, CD11b, which pairs with CD18
to form a heterodimeric type 1 transmembrane receptor known as macrophage-
1/complement receptor 3, has been suggested to mediate various leukocyte adhesion-
dependent events. In this study, flow cytometry technology could be applied for the
measurement, and this easily adoptable approach compares CD11b expression levels
on granulocytes and monocytes of activation markers of leukocytes at the level of the
CD11b expression on granulocytes and monocytes with anchor CD11b expression
levels in blood neutrophils identifies CD11b upregulation as a hallmark of leukocytes
activation.12
Fig. S6 CD11b expression on monocytes and granulocytes in whole blood. (Values are expressed
as mean ± SD, n = 3. P < 0.05 compared with plasma and pristine PES membrane, respectively).

Fig. S6 shows the expressions of CD11b on monocytes and granulocytes from
the blood incubated for 2 h, and the data were analyzed by statistical methods (P <
0.05). As shown in the figure, the expression of CD11b for the pristine PES
membrane was the highest, and the CD11b expressions decreased compared with that
of the pristine PES membrane by introducing sodium carboxylic (-COONa), sodium
sulfonic (-SO3Na) and amino (-NH2) groups on the surface of the membranes; and
with the increase in the content of functional groups, the CD11b expression decreased.
The results indicated that the activation of leukocytes could be significantly inhibited
by GCMs. The decrement in the activation of leukocytes might be attributed to the
bio-functional groups. In this study, the CPES and SNPES contained bio-functional
heparin-like groups (-SO3Na and -COONa), which endowed the GCM surfaces with
heparin-like property. Mounting studies indicates that heparin possesses various anti-
inflammatory and immunomodulatory properties, though the exact benefit and safety
of heparin and its derivatives as anti-inflammatory agents in clinical setting have not
definitely proved yet.13
Notes and References
1 Wang, H. Li, S. Chen, C. Nie, C. Cheng and C. Zhao, ACS Biomater. Sci. Eng, 2015, 1, 1183–
1193.
2 L. Wang, H. Qin, S. Nie, S. Sun, F. Ran and C. Zhao, Acta Biomater, 2013, 9, 8851-8863.
3 L. Li, Z. Yin, F. Li, T. Xiang, Y. Chen and C. Zhao, J. Mem. Sci, 2010, 349, 56–64.
4 A. Dong, S. Prestrelski, S. Allison and J. Carpenter, J. Pharm. Sci, 1995, 84, 415–24.

5 S. Zinadini, A. Zinatizadeh, M. Rahimi, V. Vatanpour and H. Zangeneh, J. Mem. Sci, 2014,
453, 292-301.
6 Z. Yi, L. Zhu, L. Cheng L B. Zhu and Y. Xu, Polymer, 2012, 53, 350-358.
7 D. Wang, W. Zou, L. Li, S. Sun, C. Zhao, J. Mem. Sci, 2011, 374, 93-101.
8 R. Kremers, B. Laat, R. Wagenvoord and H. Hemker, J. Thromb. Haemost, 2017, 15, 395-396.
9 N. Yahyapour, C. Eriksson, P. Malmberg and H. Nygren, Biomaterials, 2004, 25, 3171-3176.
10 S. Charef, J. Tapon-Bretaudière, A. Fischer, F. Pflüge and M. Jozefowicz and D. Labarre,
Biomaterials, 1996, 17, 903-912.
11 J. Silver, A. Hart, E. Williams and S. Cooper, Biomaterials, 1992, 13, 339-344.
12 M. Duan, D. Steinfort, D. Smallwood, M. Hew, W. Chen, M. Ernst, L. Irving, G. Anderson
and M. Hibbs, Mucosal. Immunol, 2016, 9, 550-563.
13 S. Mousavi, M. Moradi, T. Khorshidahmad and M. Motamedi, Adv. Pharmacol. Sci, 2015,
2015.