effective estimation of contact force and torque for
TRANSCRIPT

Effective Estimation of Contact Force and Torque for Vision-basedTactile Sensor with Helmholtz-Hodge Decomposition
Yazhan Zhang1, Zicheng Kan1, Yang Yang1, Member, IEEE, Yu Alexander Tse1
and Michael Yu Wang2, Fellow, IEEE
Abstract— Retrieving rich contact information from robotictactile sensing has been a challenging, yet significant task for theeffective perception of object properties that the robot interactswith. This work is dedicated to developing an algorithm to es-timate contact force and torque for vision-based tactile sensors.We first introduce the observation of the contact deformationpatterns of hyperelastic materials under ideal single-axial loadsin simulation. Then based on the observation, we propose amethod of estimating surface forces and torque from the contactdeformation vector field with the Helmholtz-Hodge Decomposi-tion (HHD) algorithm. Extensive experiments of calibration andbaseline comparison are followed to verify the effectiveness ofthe proposed method in terms of prediction error and variance.The proposed algorithm is further integrated into a contactforce visualization module as well as a closed-loop adaptivegrasp force control framework and is shown to be useful in bothvisualization of contact stability and minimum force graspingtask.
I. INTRODUCTION
Tactile sensing has been investigated and proven to playcritical roles in human interaction with the environment. Fora robotic system, tactile sensor is also a key component forits perception system, especially in contact-rich manipulationtasks. However, tactile sensing technologies are relatively un-explored, comparing with great attention drawn to studies ofvisual perception principles and developments of algorithmsin these decades, despite its complementary role to visualsensing in robotic scene perception.
The past few decades have seen vast emergence of varioustypes of tactile sensors with different transducing principles,including capacitive, piezoelectric, piezoresistive, magneto-electric, etc. [1]. Recently, vision-based tactile sensors havebeen thriving and appearing in various robotic systemswith advantages of easy fabrication, high resolution, andmulti-axial deformation sensing capability, e.g. Gelforce [2],FingerVision [3], Gelsight [4] and a more compact Gelslimin [5]. In our previous work, we have developed a vision-based tactile sensor also called FingerVision [6] (the nameFingerVision was first introduced in [3]) and it was proven tobe effective in the slip detection task. In this work, we aim at
*Research is supported by the Hong Kong Innovation and TechnologyFund (ITF) ITS-018-17FP.
1Y. Zhang, Z. Kan, Y. Tse and Y. Yang are with the Departmentof Mechanical and Aerospace Engineering, Hong Kong University ofScience and Technology, Hong Kong (e-mail: [email protected];[email protected]; [email protected]; [email protected]).
2M. Y. Wang (corresponding author) is with the Department of Me-chanical and Aerospace Engineering and the Department of Electronic andComputer Engineering, Hong Kong University of Science and Technology,Hong Kong (tel.: +852-34692544; e-mail: [email protected]).
Fig. 1: FingerVision tactile sensor. (a). Rendered 3D model (incutaway view). (b). Sensor prototype (details are referred to [6]).(c-e). Raw image obtained from sensor, image with tracked dis-placement vectors and image with grid interpolated displacementvectors overlaying on top, respectively.
further exploiting the capability of recovering contact forceand torque from the displacement field of the vision-basedtactile sensor.
There are various ways to encode tactile signals, amongwhich contact force and torque estimation from raw tactileinformation is of special interest, for it directly relates tostatics or dynamics of the object during the interaction. Forinstance, human’s intuitive feeling of finger skin traction andpressure and estimation of the center of mass of objectsgreatly enhance the success rate of dexterous, dynamic ma-nipulation. In a robotic system, similarly, accurate force feed-back helps robot capture the motion of the object and statetransitions including contact making, slipping and contactbreaking. Therefore, it endows robots with the capability ofassessing grasp stability, which is essential for the successfulexecution of complex manipulation tasks.
For FingerVision sensor we developed in [6] as reprintedin Fig. 1, the sensing body is a clear elastomer with em-bedded black markers used as vision tracking features. Themarker displacement vectors are seen as the grid samplingof the deformation in the elastomer layer. When applied withexternal force and torque, deformation occurs in the hyper-elastic body of FingerVision following continuum mechan-ics and the deformation fields show corresponding patternsunder specific single-axial surface force and torque. Bearingthis hint, decomposition of raw displacement vector field intomultiple separated vector fields with specific patterns wouldbe potentially helpful to decouple the deformation undermulti-axial loads. However, the displacement field patterns
arX
iv:1
906.
0946
0v1
[cs
.RO
] 2
2 Ju
n 20
19

are also correlated with shapes of contact area and affectedby nonlinear deformation induced by large contact forces andtorques, and interference of force and torque between axes.Thus, evaluation of method’s generalization capability andproper selection of working range are necessary.
In this paper, our goal is to effectively recover the contactsurface force and torque from vision-based tactile sensors.Toward this target, these contributions are generated in ourwork:• Introduction of the displacement field patterns of elas-
tomer on the vision-based tactile sensor when appliedwith single-axial forces and their quantitative propertiesare presented.
• Proposal of a method to decompose displacement fieldof vision-based sensors into components that can befurther used in estimating contact force and torquebased on Helmholtz-Hodge Decomposition algorithm.The proposed method is both data efficient and withlow model complexity for regression.
The rest of this paper is arranged in the following struc-ture: Section II introduces previous works related to methodsof force estimation for tactile sensors. In section III, weexplain the patterns observed and formulate mapping func-tions from vector fields of specific patterns to correspondingcontact forces in simulation. Afterwards, we propose thatHHD algorithm can be used to decompose displacementvector field into components with similar patterns that leadsto estimation of contact force and torque. In section IV,extensive characteristic experiments and comparison to state-of-the-art methods are given to show the effectiveness of theproposed method. In section V, we integrate the proposedmethod into a contact stability visualization and graspingforce feedback control framework. Finally, discussion andconclusion are drawn in section VI.
II. RELATED WORKS
A. Tactile Sensors and Force Measurement
Vision-based tactile sensors attract increasing attention forits sensing capability with multi-modal contact informationin addition to advantages of superior sensing resolution,including deformation [2][3], object texture [7]–[9], contactarea estimation [5], geometry reconstruction [7][10] andforce estimation [2][3][10][11]. Besides, vision-based tactilesensors have been shown to perform well in high-level taskslike object recognition [9], localization of dynamic object[12], and slip detection [4][6][8][13]. Surface deformationserves as a basic signal modality for above higher-levelinformation in these sensing systems.
Since the contact deformation is only one of the intermedi-ate states for robotic manipulation feedback loop, researchershave been putting efforts into developing methods for recov-ering contact forces for tactile sensors. Generally, contactpressure distribution is relatively easier to be extracted fortraditional capacitive, piezoelectric tactile array [1] or sensorsutilizing total internal reflective (TIR) principle as presentedin [14]. However, multi-axial-force estimation is much more
Fig. 2: Applied contact force configurations in simulation. (a).Normal force distributed uniformly. (b). Unidirectional tangentialforce distributed uniformly. (c). Torsional force along normal axis.(d). Combination of tangential, normal, and torsional forces.
challenging by comparison. Ohka et al. [15] presented atactile sensor made of a rubber layer and a pyramid-shapedindenter on an acrylic plate that was able to capture changesof indentations of the pyramid array into the rubber skin withcamera. According to the changes of the indentation areas,they successfully predicted three-axial contact forces. Satoet al. [2] fabricated a vision-based sensor called Gelforcewith double-layer markers in different colors as trackingtargets, which enables the measurement of motion alongthe surface normal via tracking the movement differencesbetween markers in two layers. Based on an observationalmethod and calibration, multi-axis force could be extractedfrom this complex fingertip-shaped sensor. Calibration pro-cedures were specifically designed for the sensors makingcontact with probe-shape objects and generalization testingto different contact objects were not performed. Vogt et al.[16] built a microfluid-based flexible skin that can detectand differentiate normal and shear force, whereas the systemsuffered from a lower response time that was not suitable forrobotic scenarios. In addition, the microfluid-based sensorcould only estimate force and was inferior in multi-modalitysensing by comparison with vision-based tactile sensors.
Neural network has shown its usefulness in recoveringcontact force for tactile sensors. Maria et al. [17] designeda tactile sensor using an array of paired light emitters andreceivers that was able to capture deformation in local regionand infer contact forces with trained neural network. In [18],multi-layer neural network was utilized in mapping frommarkers displacement field to three-axial contact force witha relatively low error on a Gelsight-like sensor. However,neural networks are usually not data-efficient and suffersfrom overfitting when only a small amount of data isavailable. Additionally, above works also didn’t discuss thegeneralization performance on different contact objects. Inour work, we start by observing the response patterns ofdisplacement field to different force and torque configura-tions, and based on the observation, we decompose vectorfield into components containing individual patterns to inferdecoupled contact forces. This method significantly reducesthe dimension of deformation vector field and is shown toretain good invariance to different contact objects.

Fig. 3: Displacement fields of elastomer body under three loadconfigurations shown in Fig. 2(a-c).
B. Helmholtz-Hodge Decomposition
Helmholtz-Hodge Decomposition is commonly used inmotion analysis, e.g. target tracking in computer vision,computational fluid motions analysis [19], acting as featureextraction to capture divergence source, sink and vertex ofrotational motion for vector fields. HHD describes a vectorfield in the form of the summation of a divergence-free, acurl-free, and a harmonic flow, with manually set boundarycondition imposed to get a unique solution. In [20], Bhatiaet al. proposed a natural Helmholtz-Hodge Decomposition(nHHD) method enabling defect-free analysis for variousboundaries conditions with a data-driven method. In thiswork, we adopt nHHD to decompose our displacement fieldinto separated components corresponding to the responsesof specific external contact forces. We show that this toolis effective in recovering contact forces for the deformablemedium used in most vision-based tactile sensors by quan-titative analysis, although theoretical relations between thedecomposition component patterns and patterns observed inthe simulation have not been established yet.
III. METHOD DESCRIPTION
Vision-based tactile sensors, such as Gelforce, FingerVi-sion, Gelsight, make use of the deformation captured bythe camera to infer contact forces by following hyperelas-tic continuum mechanics [2], data fitting with calibration[17][18] or both combined [2]. For analysis of hyperelasticdeformation, finite element method (FEM) is commonlyused. FEM approximates stress and strain response underexternal force that governed by continuum mechanics withfinite number of nodes. To obtain an accurate result of surfacemotion, it is a common practice to increase the numberof nodes with a proper meshing method, which results inincreased dimension of the stiffness matrix that might be overdemanding for computation in real-time applications. In thiswork, we take advantage of the insight that the displacementfields of the elastomer show unique and consistent graphicalpatterns under different single-axial loads (normal, tangen-tial, and torsional loads) in simulation. These patterns possess
Fig. 4: Decomposition result of simulated displacement field withthe multi-axial loads. (a). Displacement vector field. (b). Curl-free component. (c). Divergence-free component. (d). Harmoniccomponent.
quantitative properties that can be leveraged to formulatemapping from vector field with patterns to contact forces.
A. Behavior under Different Loads
For contact in reality, any surface traction comes in theform of contact friction, and thus tangential force wouldnot exist without normal pressure being applied simulta-neously. To explore the behavior of the displacement fieldunder loads along different axes separately, we simulatewith hyperelastic material in Abaqus. As shown in Fig. 2,within circle region on the top (in red), uniformly distributednormal force, tangential force and torsion along the surfacenormal (directions are shown with arrows) are applied withfixed bottom faces as boundary conditions. With these threeconfigurations, typical simulation results are shown in Fig.3. The displacement vector fields are obtained by furtherinterpolating on a fixed-spacing grid and rendered with colorscoding vectors’ magnitude.
Let ~vi = (δxi, δyi) denotes ith displacement vector andVi = pi, ~vi denote ith displacement vector associated withposition pi = (xi, yi) being the start of the vector. Assumethat the rotational centers c of configuration are known, let~rij be the arm of moment of ith vector w.r.t jth rotationcenter. Let ~rai be the arm of moment w.r.t divergence center(the cross in Fig. 3(a)) and ~rbi be the arm of moment w.r.t thecontact center (location of vector with maximum magnitude,the cross in Fig. 3(b)). From the displacement vector fieldsin simulation, it is observed that three graphical patterns ofdivergence, unidirection and rotation can be generated undernormal, tangential and torsional forces correspondingly. Withthese patterns in Fig. 3, we notice the following quantitativeproperties:

• For pattern (a), norm of vector summation |∑N−1i=0 ~vi|
and magnitude of summation of moments w.r.t. the di-vergence center
∑N−1i=0 ~rai × ~vi both yield small values,
while summation of vector norms∑N−1i=0 |~vi| gives a
significantly larger value.• For pattern (b), summation of moments w.r.t. the contact
center∑N−1i=0 ~rbi × ~vi yields a small magnitude, while
norm of vector summation |∑N−1i=0 ~vi| gives a larger
value by comparison.• For pattern (c), norm of vector summation |
∑N−1i=0 ~vi|
yields a small value, while summation of moments w.r.tthe rotational center
∑Mj
∑N−1i=0 ~rij × ~vi gives a much
larger magnitude.where N is the number of vectors, and M is the number ofrotational centers of the vector field.
Assuming that an arbitrary vector field ~V is composedof vector fields with these diverging ~Vn, unidirectional ~Vt,and rotational ~Vτ patterns, and following the quantitativeproperties above, we have formulations below
Sn =
N−1∑i=0,~vi∈~Vn
|~vi| =N−1∑
i=0,~vi∈~Vn+~Vτ
|~vi|
St = |N−1∑
i=0,vi∈~Vt
~vi| = |N−1∑
i=0,~vi∈~V
~vi|
Sτ =
M∑j
N−1∑i=0,~vi∈~Vτ
~rij × ~vi =
M∑j
N−1∑i=0,~vi∈~Vn+~Vτ
~rij × ~vi
(1)where ~V = ~Vn+ ~Vt+ ~Vτ , and Sn, St and Sτ are summationof vector norms on ~Vn, norm of vector summation on ~V ,and total moments of vectors w.r.t. rotational centers on ~Vτ .
In reverse, estimation of contact force and torque canfollow the scheme of computing St given a displacementfield ~V first, then decomposing ~V into ~Vn and ~Vτ forcomputation of Sn and Sτ following Eq. (1). The problemboils down to finding a suitable decomposition method.
B. Decomposition Algorithm
HHD method is a tool widely used in flow physicsanalysis to gain insights into such features as critical points,divergence source, sink, rotational vertex and curl distri-bution, etc.[19]. H. Bhatia et al. [20] presented a naturalHHD (nHHD) to tackle data-dependent boundary conditionselection problem. In our work, we adopt nHHD to computeseparated vector fields for the reason that in a 2D space, thedisplacement of elastomer under torsional and normal loadsfrom simulation results have similar pattern representationsto that in divergence-free and curl-free fields decomposed bynHHD.
According to [20], considering the above smooth displace-ment vector field ~V : Ω → Rn, where Ω ⊆ Rn (e.g. n = 2in 2D case), we have
~V = ~d + ~r + ~h (2)
Fig. 5: Contact force and torque computation pipeline.
where ~d denotes curl-free component (∇ × ~d = ~0), ~r isdivergence-free component (∇ · ~r = 0) and ~h is harmonic(∇×~h = ~0,∇·~h = 0). Eq. (2) is further transformed into Eq.(3) in the form of gradients of two scalar potential functionsR and D
~V = ∇D +∇×R+ ~h
= ∇D + J∇R+ ~h(3)
where ~d = ∇D and ~r = ∇ × R = J∇R with J beingthe π/2-rotation matrix. By applying divergence and curloperations, we obtain following Poisson equations
∆D = ∇ · ~V∆R = −∇· J ~V
(4)
Therefore, Eq. (4) can be solved using Green’s function inthe domain to obtain ~d and ~r, and data-dependent boundaryconditions are imposed to derived harmonic component ~huniquely. For more implementation details of the solvingprocess, it is recommended to refer to [20]. The rotationalcenters c+ and(or) c− in ~r are localized where the maximaand(or) the minima of R are achieved over the discretedomain of ~V if the extrema exist, and the arms of moments~ri+ and(or) ~ri− of ith vector can be obtained as Eq. (5)presents.
c+ = pimax |imax = argmaxi
Ri
c− = pimin |imin = argmini
Ri
~ri+ = pi − c+~ri− = pi − c−
(5)
where Ri is the value of the potential function R at pi.The result of HHD for the simulated displacement field
under multi-axial loads is given in Fig. 4. Although it isnoticeable that the patterns given in the separated compo-nents are not identical to those shown in Fig. 3 in terms ofdistribution of vector magnitude, calculation of Sn, St, andSτ remains valid according to Eq. (1). By combining theprocedure proposed in section III-A and nHHD algorithm,we present the procedure to compute Sn, St and Sτ . Stis obtained from the raw displacement field following Eq.(1), and in parallel, the raw displacement field is fed intoHHD module to generate two fields of interests: curl-free anddivergence-free fields. Sn and Sτ are calculated from these
two vector fields with Eq. (1) and Eq. (5). The calculationscheme is illustrated in Fig. 5.
Let the mapping from Sn, St and Sτ to contact normalforce Fn, tangential force Ft and torque along surface normalFτ be functions gn, gt and gτ , respectively which connectto the estimations of contact force and torque in Eq. (6).With the significantly dimensional reduction from tactiledisplacement vector field to Sn, St and Sτ , it can be expectedthat the complexity of the model used to predict contact forceand torque using decomposed results will be much lower,compared to that using raw displacement field.
Fn = gn(Sn)
Ft = gt(St)
Fτ = gτ (Sτ )
(6)
IV. EXPERIMENTS AND EVALUATION
This section gives description of the characteristic experi-ments for the proposed decomposition algorithm includingmapping function calibration and baseline comparison toevaluate the advantages of the decomposition method, com-pared with the method taking raw tactile displacement fieldas input.
A. Mapping Function Calibration
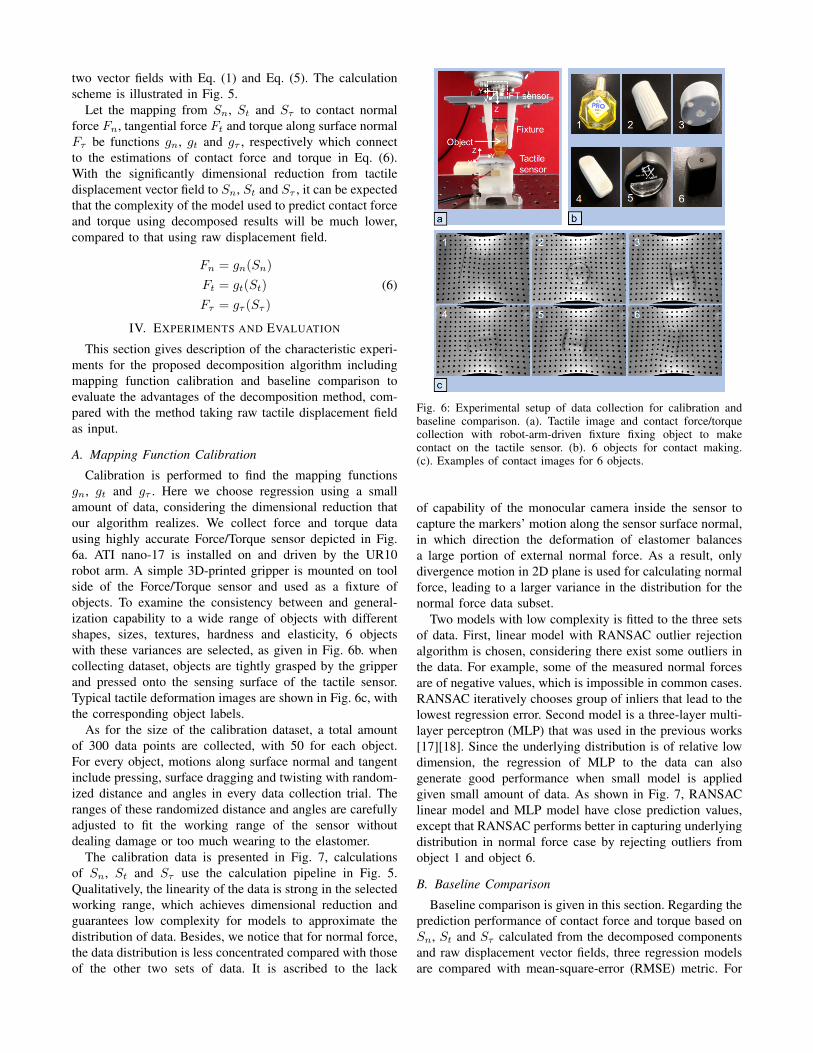
Calibration is performed to find the mapping functionsgn, gt and gτ . Here we choose regression using a smallamount of data, considering the dimensional reduction thatour algorithm realizes. We collect force and torque datausing highly accurate Force/Torque sensor depicted in Fig.6a. ATI nano-17 is installed on and driven by the UR10robot arm. A simple 3D-printed gripper is mounted on toolside of the Force/Torque sensor and used as a fixture ofobjects. To examine the consistency between and general-ization capability to a wide range of objects with differentshapes, sizes, textures, hardness and elasticity, 6 objectswith these variances are selected, as given in Fig. 6b. whencollecting dataset, objects are tightly grasped by the gripperand pressed onto the sensing surface of the tactile sensor.Typical tactile deformation images are shown in Fig. 6c, withthe corresponding object labels.
As for the size of the calibration dataset, a total amountof 300 data points are collected, with 50 for each object.For every object, motions along surface normal and tangentinclude pressing, surface dragging and twisting with random-ized distance and angles in every data collection trial. Theranges of these randomized distance and angles are carefullyadjusted to fit the working range of the sensor withoutdealing damage or too much wearing to the elastomer.
The calibration data is presented in Fig. 7, calculationsof Sn, St and Sτ use the calculation pipeline in Fig. 5.Qualitatively, the linearity of the data is strong in the selectedworking range, which achieves dimensional reduction andguarantees low complexity for models to approximate thedistribution of data. Besides, we notice that for normal force,the data distribution is less concentrated compared with thoseof the other two sets of data. It is ascribed to the lack
Fig. 6: Experimental setup of data collection for calibration andbaseline comparison. (a). Tactile image and contact force/torquecollection with robot-arm-driven fixture fixing object to makecontact on the tactile sensor. (b). 6 objects for contact making.(c). Examples of contact images for 6 objects.
of capability of the monocular camera inside the sensor tocapture the markers’ motion along the sensor surface normal,in which direction the deformation of elastomer balancesa large portion of external normal force. As a result, onlydivergence motion in 2D plane is used for calculating normalforce, leading to a larger variance in the distribution for thenormal force data subset.
Two models with low complexity is fitted to the three setsof data. First, linear model with RANSAC outlier rejectionalgorithm is chosen, considering there exist some outliers inthe data. For example, some of the measured normal forcesare of negative values, which is impossible in common cases.RANSAC iteratively chooses group of inliers that lead to thelowest regression error. Second model is a three-layer multi-layer perceptron (MLP) that was used in the previous works[17][18]. Since the underlying distribution is of relative lowdimension, the regression of MLP to the data can alsogenerate good performance when small model is appliedgiven small amount of data. As shown in Fig. 7, RANSAClinear model and MLP model have close prediction values,except that RANSAC performs better in capturing underlyingdistribution in normal force case by rejecting outliers fromobject 1 and object 6.
B. Baseline Comparison
Baseline comparison is given in this section. Regarding theprediction performance of contact force and torque based onSn, St and Sτ calculated from the decomposed componentsand raw displacement vector fields, three regression modelsare compared with mean-square-error (RMSE) metric. For

Fig. 7: Calibration data and fitting results. Data collected using different objects are scattered with different colors. Data regression methodsinclude RANSAC linear model and MLP regression. From left to right, charts are Fn vs. Sn, Ft vs. St and Fτ vs. Sτ .
TABLE I: RMSE of different methods on estimating the contactforce and torque based on the decomposed deformation vector fieldsor raw deformation one.
RMSE Decomposition No decomposition
Method RANSACLinear
MLPRegression
MLPRegression
Modelcomplexity 2 10 512× 128× 10
Normal (N) Mean 2.952 3.286 4.482Stdv 2.584 2.497 1.295
Tangential (N) Mean 0.241 0.242 1.544Stdv 0.033 0.032 0.813
Torsional (Nmm) Mean 5.862 5.621 6.769Stdv 1.547 1.353 3.621
decomposed 1D data fitting, RANSAC linear model, andMLP regression with three-layer structure with 10 hiddenunits are adopted. As for input vectors without decompo-sition, a significantly larger MLP regressor with five-layerstructure and 512× 128× 10 hidden units is used.
Two MLP models are all fully trained with L-BFGSoptimizer. 6-fold cross validation with splits of the data fromdifferent objects are used for evaluation of the overall perfor-mances of models and also biases toward certain objects. Theresults are shown in Table I. RANSAC linear model excels interms of the mean RSME of the prediction for normal forceand tangential force cases, whereas MLP regressor on the 1Ddata performs better in the aspect of the prediction variancesand slightly better in the mean RSME for torsional case.This could be attributed to the outlier rejection mechanism ofRANSAC linear model to sustain the disturbance of noises,which lead to lower average prediction errors. As expected,all three models give a larger RSME in the normal forcecase when being evaluated on data collected with object6 after being trained on the other 5 objects during crossvalidation. However, the combination of raw displacementvector with complex MLP gives a lower variance in thiscase, showing more consistent performance across differentobjects and with noises. In summary, linear models with de-composition capture the underlying distribution better givensmall amount of available data, while one can expect MLPwithout decomposition can improve highly if large dataset iscollected.
Fig. 8: Contact force signals under multiple sliding motion trials.Upper right chart is generated by measuring ratios Ft/Fn at peaksof Ft (as blue circles marked). Lower right chart is the ratio Ft/Fninside the window delineated in purple dash rectangle.
Fig. 9: Adaptive grasping force control experiment. (a). Robotiq 2-finger 140 gripper with FingerVision as fingertips holding an objectand then the object is pressed by hand till slip occurs. (b). Gripperwith FingerVision holds an object and then the tangential load isincreased/decreased by loading and unloading weights on top of theobject.
V. GRASPING TASKS
In this section, effectiveness of the proposed contact forceand torque estimation method for vision-based sensors istested in grasping tasks. Sensing and visualization of contactinformation as well as adaptive control under external distur-bances have been challenging tasks in robotic manipulation.Besides, situations are even more complex when introducingsoft contact that brings in nonlinearity in deformation. Fig.

8 shows tangential force and normal force signals duringmultiple surface sliding trials (data collected by ATI nano-17 Force/Torque sensor). It is noticed from the chart on theupper right in Fig. 8 that the friction coefficient (equals to theratio of tangential and normal forces Ft/Fn when tangentialforce reaches each peak, as marked by blue circles) does notremain constant under different normal forces, which is oneof the significant properties differences between hyperelasticcontact and rigid contact. It also shows that within each trialof surface sliding, the ratio Ft/Fn follows similar evolution:the ratio first rises; once reaches the maximum static frictioncoefficient, the ratio vibrates in a narrow band; the ratiodrops afterwards, suggesting the occurrence of shear slip,as exhibited in the lower right chart of Fig. 8.
A. Grasping Stability Visualization
Taking behavior of Ft/Fn during slip phases into consid-eration, we implement a visualization system for monitoringof grasping force and slip, as shown in Fig. 10. Since thefriction coefficient is not constant, we take the average offriction coefficients across working range of normal force asthe nominal value for simplification and visually illustratefriction cones [21] with this coefficient. The FingerVisionsensors are installed on Robotiq 2-finger 140 gripper, servingas finger tips and sensing units, mimicking human fingertips.With the force and torque estimation module, we illustratetransitions of contact phases by classifying the spaces wherecontact force vectors reside w.r.t. the friction cones. Asgiven in Fig. 10(a), contact statuses are classified into 4phases: 1) Stable contact; 2) Incipient slip; 3) Slipping; 4)Recovery phase when force vector is regulated back intothe yellow or green regions. In Fig. 10(b) contact forces areshown as arrows in green (when the vectors are within thefriction cones) and red (outside of the friction cones). Thecapability of indicating contact phases is beneficial to graspreconfiguration for stable grasp.
B. Feedback Control of Grasping Force
In-hand manipulations of objects usually require mini-mal grasping forces, because the contact condition keepsswitching between unstable and stable statuses, e.g. penrolling in human hand. And when picking up fragile objects,power grasps also need to be avoided. Thus, adaptive controlfor grasping force is critical in many scenarios. Here weimplement a simple feedback controller that takes in contactforce estimation and maintains the ratios Ft/Fn in a bandon the peripheries of the friction cones (visualized withnominal friction coefficients as described previously). Detailsof the controller are given in Algorithm 1. In the algorithm,variables with subscripts l and r belong to the left and rightcontacts. A conservative control strategy is implemented inour work. To maintain the contact forces in the vicinity offriction cone margins, the gripper decreases the opening ifboth left and right forces exceed the upper limits of band ofthe cones and increases the opening while both left and rightforces are lower than the lower limits.
Algorithm 1 Grasping force controllerInput: Contact forces Fl, Fr; Gripper opening Dg;
Band width d; Friction coefficient µ.Output: Gripper requested opening Dr.
1: Initialize rl, rr with µ2: while True do3: rl ← Flt/Fln, rr ← Frt/Frn4: if rl > µ+ d/2 and rr > µ+ d/2 then5: Dr = Dg − 16: end if7: if rl < µ+ d/2 and rr < µ+ d/2 then8: Dr = Dg + 19: end if
10: end while
Fig. 10: Schematic diagram of contact phases and visualization forexperiment in Fig. 9(a). Force signals are plotted in Fig. 11(a-b).
The controller performs well in maintaining stable contactusing minimal grasping forces in the object holding experi-ment during loading and unloading of weights that result inincrease and decrease of tangential forces. As demonstratedin Fig. 11(c-d), with controller being active, there are noor much shorter periods of crossovers(indicated as periodswhen Ft/Fn dramatically rises that leads to contact slip). Theratio Ft/Fn in right-side fingertip recovers quickly from thecrossover region (rendered in yellow in Fig. 11) due to theregulation of the force controller. The regulation process canalso be seen from the visualization system, which keeps thecontact force vectors around the margins of friction cones.Without force control, there is an extended longer periodof crossover during loading process. The gripper fails tomaintain contact forces inside the friction cones. Grasp failsif at least one contact breaks. It is worth noting that afterslip happens on the surface, another crossover occurs dueto the fact that dynamic friction coefficient is lower thanstatic friction coefficient. The signals of left and right sensorsare not of exactly the same forms, which could stem fromthe variances in sensor fabrication and calibration, objectalignment difference for two contact surfaces and gripperpose not being exactly upright that leads to imbalanced loadson two fingertips.

Fig. 11: Grasping contact force signals under loads. Force x, yand z are the projections of the contact force onto the sensorsurface coordinate system in Fig. 6. (a-b). Changes of contactforces for manual press on grasped object, with constant openingdistance between two fingertips. Four contact phases are illustratedin different colors. (c-d). Contact force signals during loadingand unloading, with active grasp force controller. (e-f). Contactforce signals during loading, without grasping force controller. Theunloading process is not given since contacts are broken, whichleads to grasping failure.
VI. CONCLUSION
In this work, we develop a contact force and torque estima-tion method for vision-based tactile sensor using Helmholtz-Hodge Decomposition (HHD). Starting from observations ofthe relations between contact force and torque and markerdisplacement patterns, we establish the mapping from de-composed components of HHD to contact force and torqueestimation. In characteristic experiment, the force and torqueestimation results show high linearity and guarantee lowerdemands for data size and better accuracy on predictionsusing models with low complexity. The proposed methodis further tested in both contact stability visualization andgrasping with adaptive force control for verification of effec-tiveness and presents potential in facilitating studies of grasp-ing stability metric. Future works fall mainly on integratingsensor and algorithm into grasping system to predict high-level physical information including object center of mass,estimation of object dynamics, and prediction of graspingstability.
REFERENCES
[1] R. S. Dahiya, G. Metta, M. Valle, and G. Sandini, “Tactile sensing-from humans to humanoids.” IEEE Trans. Robotics, vol. 26, no. 1, pp.1–20, 2010.
[2] K. Sato, K. Kamiyama, N. Kawakami, and S. Tachi, “Finger-shapedgelforce: sensor for measuring surface traction fields for robotic hand,”IEEE Transactions on Haptics, vol. 3, no. 1, pp. 37–47, 2010.
[3] A. Yamaguchi and C. G. Atkeson, “Combining finger vision andoptical tactile sensing: Reducing and handling errors while cuttingvegetables,” in 2016 IEEE-RAS 16th International Conference onHumanoid Robots (Humanoids). IEEE, 2016, pp. 1045–1051.
[4] W. Yuan, R. Li, M. A. Srinivasan, and E. H. Adelson, “Measurementof shear and slip with a gelsight tactile sensor,” in 2015 IEEEInternational Conference on Robotics and Automation (ICRA). IEEE,2015, pp. 304–311.
[5] E. Donlon, S. Dong, M. Liu, J. Li, E. Adelson, and A. Rodriguez,“Gelslim: A high-resolution, compact, robust, and calibrated tactile-sensing finger,” in 2018 IEEE/RSJ International Conference on Intel-ligent Robots and Systems (IROS). IEEE, 2018, pp. 1927–1934.
[6] Y. Zhang, Z. Kan, Y. A. Tse, Y. Yang, and M. Y. Wang, “Fingervisiontactile sensor design and slip detection using convolutional lstmnetwork,” arXiv preprint arXiv:1810.02653, 2018.
[7] M. K. Johnson and E. H. Adelson, “Retrographic sensing for themeasurement of surface texture and shape,” in 2009 IEEE Conferenceon Computer Vision and Pattern Recognition. IEEE, 2009, pp. 1070–1077.
[8] S. Dong, W. Yuan, and E. H. Adelson, “Improved gelsight tactile sen-sor for measuring geometry and slip,” in 2017 IEEE/RSJ InternationalConference on Intelligent Robots and Systems (IROS). IEEE, 2017,pp. 137–144.
[9] W. Yuan, S. Wang, S. Dong, and E. Adelson, “Connecting lookand feel: Associating the visual and tactile properties of physicalmaterials,” in Proceedings of the IEEE Conference on Computer Visionand Pattern Recognition, 2017, pp. 5580–5588.
[10] W. Yuan, S. Dong, and E. H. Adelson, “Gelsight: High-resolution robottactile sensors for estimating geometry and force,” Sensors, vol. 17,no. 12, p. 2762, 2017.
[11] B. W. McInroe, C. L. Chen, K. Y. Goldberg, R. Bajcsy, and R. S. Fear-ing, “Towards a soft fingertip with integrated sensing and actuation,”in 2018 IEEE/RSJ International Conference on Intelligent Robots andSystems (IROS). IEEE, 2018, pp. 6437–6444.
[12] R. Li, R. Platt, W. Yuan, A. ten Pas, N. Roscup, M. A. Srinivasan,and E. Adelson, “Localization and manipulation of small parts usinggelsight tactile sensing,” in Intelligent Robots and Systems (IROS2014), 2014 IEEE/RSJ International Conference on. IEEE, 2014,pp. 3988–3993.
[13] K. Van Wyk and J. Falco, “Slip detection: Analysis and calibration ofunivariate tactile signals,” arXiv preprint arXiv:1806.10451, 2018.
[14] S. Begej, “Planar and finger-shaped optical tactile sensors for roboticapplications,” IEEE Journal on Robotics and Automation, vol. 4, no. 5,pp. 472–484, 1988.
[15] M. Ohka, Y. Mitsuya, K. Hattori, and I. Higashioka, “Data conversioncapability of optical tactile sensor featuring an array of pyramidalprojections,” in 1996 IEEE/SICE/RSJ International Conference onMultisensor Fusion and Integration for Intelligent Systems. IEEE,1996, pp. 573–580.
[16] D. M. Vogt, Y.-L. Park, and R. J. Wood, “Design and characterizationof a soft multi-axis force sensor using embedded microfluidic chan-nels,” IEEE Sensors Journal, vol. 13, no. 10, pp. 4056–4064, 2013.
[17] G. De Maria, C. Natale, and S. Pirozzi, “Force/tactile sensor for roboticapplications,” Sensors and Actuators A: Physical, vol. 175, pp. 60–72,2012.
[18] B. Fang, F. Sun, C. Yang, H. Xue, W. Chen, C. Zhang, D. Guo, andH. Liu, “A dual-modal vision-based tactile sensor for robotic handgrasping,” in 2018 IEEE International Conference on Robotics andAutomation (ICRA). IEEE, 2018, pp. 1–9.
[19] Q. Guo, M. K. Mandal, and M. Y. Li, “Efficient hodge–helmholtzdecomposition of motion fields,” Pattern Recognition Letters, vol. 26,no. 4, pp. 493–501, 2005.
[20] H. Bhatia, V. Pascucci, and P.-T. Bremer, “The natural helmholtz-hodge decomposition for open-boundary flow analysis,” IEEE trans-actions on visualization and computer graphics, vol. 20, no. 11, pp.1566–1578, 2014.
[21] M. T. Mason, Mechanics of robotic manipulation. MIT press, 2001.