effective field-based testing tools for rapid ard prediction
TRANSCRIPT
1
Effective Field-Based Testing Tools for Rapid ARDPrediction
Anita Parbhakar-Fox1, John Aalders1 and Bernd Lottermoser 1, 2
1 School of Physical Sciences, University of Tasmania, Australia2 Environment and Sustainability Institute / Camborne School of Mines, University of Exeter,United Kingdom
ABSTRACT
Accurate prediction of acid rock drainage (ARD) during early life-of-mine stages is critical for thedevelopment of effective waste management strategies. However, tests and methodologies used byindustry focus on the extensive use of geochemical tests i.e., those associated with acid baseaccounting. Due to the high costs and turn-around time of such tests, only a limited number ofsamples are selected for predictive testwork. Consequently, detailed ARD characteristics of adeposit cannot be understood, resulting in the development of inadequate waste managementplans and rehabilitation strategies. Instead, industry requires effective tools and protocols whichallow for a greater number of samples to be evaluated, and are simple enough to perform in a field-laboratory, thus keeping costs to a minimum and turn-around time short. To satisfy suchrequirements, simple field-based pH tests should be utilised. In addition, methods to improvemineralogical characterisation in drill core materials should be employed including an ARDfocused logging code, chemical staining and the use of portable instruments (i.e., portable XRF,Equotip). Finally, methods for evaluating geometallurgical data for ARD prediction should beused, and have real potential to add-value to existing datasets.
These new tools and protocols were developed and tested using drill core and waste rock materialsobtained from several Australian mines with differing geology, mineralogy and mineralisationstyle. Our research shows that by adopting these improved tests and methods, the industry will beable to: i) perform effective predictive ARD testwork; ii) achieve detailed deposit-widecharacterisation, iii) develop the best possible waste management plan; and iv) evaluate only themost suitable rehabilitation options.
Keywords: management, geochemical, prediction, waste rock, test

2
INTRODUCTION
Oxidative dissolution of sulphidic minerals present in mine waste materials (e.g., waste rock,tailings) has the potential to release acidic leachate (acid rock drainage, ARD), sulphate andpotentially deleterious elements e.g., As, Ag, Cd, Cr, Cu, Hg, Ni, Pb, Sb, U and Zn. Therefore, inorder for mining operations to adequately control and manage ARD during the entire life-of-mine,a comprehensive approach to ARD prediction must be adopted, benefits of which will beminimisation of environmental impacts, and reduction of financial liabilities associated withclosure. Such an approach requires: i) analysis of an adequate number of samples, and ii) a shortturnaround time frame in which to collect pertinent ARD data to allow for basic wasteclassification. The current industry approach to ARD prediction relies upon using geochemical tests(e.g., static, kinetic). However, limitations of static testing have long-since been established (i.e., theuse of sulphide-sulphur vs. total sulphur in calculation of maximum potential acidity (MPA),variations in reaction times and chemicals in acid neutralising capacity (ANC) experiments).Furthermore, kinetic tests run for a minimum of 30 weeks i.e., data returned too slowly to guidedevelopment of an adequate waste management strategy. Most significantly, neither static norkinetic testwork are suitable to perform on regulator recommended number of samples for ARDtestwork during early life-of-mine stages (e.g., several hundred; Australian Government, 2007) dueto the costs involved. For example, a basic net acid producing potential (NAPP) and net acidgenerating (NAG) package costs A$50 (Australian Laboratory Services, 2014) and can take at least 5days (on sample receipt) for data to be reported. Performing such screening tests on best practicenumber of samples (e.g. 500 samples) would cost at least A$25,000, excluding sample preparationand handling costs. Additional mineralogical testwork would likely be required (average cost persample: A$50-150), and any further geochemical testing (i.e., sulphide-sulphur determination, pHtesting, advanced NAG tests) would result in significant financial expenditures.
Ideally, industry needs to have a field-appropriate ARD prediction toolbox that allows useful datato be collected more time-efficiently and cost-effectively. If such tests can be readily performed atmine sites, then samples for more detailed ARD testwork (i.e., using the established methods) canbe better chosen. Considering this, we have evaluated several test methods (both geochemical andmineralogical) for rapid field-based ARD prediction. These included: i) chemical staining to identifyneutralising potential, ii) field-based pH testing, iii) field portable instruments and iv) ARD focusedlogging. All results were validated against established methods e.g., X-ray diffractometry (XRD), X-ray fluorescence (XRF), and static tests (total-sulphur, multi-addition NAG and Sobek methods).These methods were tested using drill core and waste materials collected from several Australianmine sites, including two operational volcanogenic massive sulphide deposits located in WesternTasmania, and one abandoned lode gold deposit located in Queensland. Examples from thesestudies are presented in this paper.
METHODOLOGY
Both drill core and waste rock samples were collected from three sites (1, 2 and 3) between 2007 and2013. Site 1 is an operational polymetallic volcanic-hosted massive sulphide deposit located on thewestern coast of Tasmania. Site 2 is an abandoned lode-Au mine operations in Queensland wherethe dominant waste rock lithologies comprise hydrothermally altered rhyolite/ rhyolite tuffs whichhost sulphide bearing quartz lodes. Site 3 is a deposit part of the large Cambrian hybridvolcanogenic-magmatic Cu-Au-Ag system at Mount Lyell, Western Tasmania.
3
Sample preparation
Each sample from site 1 and 2 was sawn in two to allow for photography and logging of a freshsurface. One portion was subjected to crushing and milling to <63 µm for geochemical andmineralogical testwork. The other portion was kept intact for mineralogical and chemical analysesusing stains and field-appropriate equipment. Drill core from site 3 were first subjected to chemicalstaining and geometallurgical testwork, followed by the selection of representative samples every 1m for validation geochemical and mineralogical analyses. These samples were also crushed andmilled to <63 µm.
Chemical staining
Chemical staining techniques are under-utilised in the mining industry despite being simple andinexpensive tools to distinguish mineralogy and texture in a range of sample types (i.e., drill core,grain mount and thin section). Various carbonate staining techniques exist as published byFreidman (1959), Warne (1962) and Reid (1969). The methods presented in Freidman (1959) wereused in this study as these are the most commonly used (Hitzman, 1999). The advantage of usingchemical stains on drill core is that carbonate materials (particularly effective neutralisers such ascalcite and dolomite) can be confidently identified, thus allowing for improved estimations of theirmodal abundance during logging or initial ARD assessments.
All drill core samples (n= 51- site 1; 70 m - site 3) were subjected to staining. Prior to staining, drillcore materials were etched with dilute hydrochloric acid (HCl) for 2 to 3 minutes, and subsequentlywashed with water. Samples were then left to dry for approximately 30 minutes. Site 1 sampleswere placed directly in a plastic container containing the stain and left to soak for approximately 15minutes in a dual stain comprising the organic dye Alizarin red-S (ARS) and potassiumferricyanide (PF) dissolved in HCl. For site 3, samples were stained directly with the same stainusing a paintbrush. The ARS produces a pink to red stain on any carbonate that will react withdilute acid. The more reactive carbonates such as calcite and aragonite stain red, but the lessreactive such as dolomite and siderite, remain unstained (Friedman, 1959; Hitzman, 1999). Whilstpure dolomite does not stain, if iron is substituted into the dolomite lattice, it becomes morereactive thus; ferroan dolomite and ankerite stain with ARS (Hitzman, 1999). The PF stain is moreeffective at identifying ferrous carbonates, as it reacts with ferrous iron causing a precipitate ofTurnbull’s blue to form (Dickinson, 1966). Siderite does not react with this stain. Therefore wherezones of high acid neutralising capacity (ANC) are reported, but no staining colour is observed, theeffective ANC can be considered low as siderite is not an effective carbonate neutraliser. Afterstaining, samples were imaged to allow for comparison against unstained images.
Environmental logging
Textural analysis is largely absent from predictive acid rock drainage (ARD) assessments despitethe direct control of texture on acid formation as discussed in Parbhakar-Fox et al. (2011). Motivatedby this, these authors developed the ‘ARD Index’ (or ARDI) which allows for simple texturalevaluations to be performed. The generated ARDI values are recommended for use in conjunctionwith sulphur assay or paste pH data to domain ARD forming potential. The ARDI proposed byParbhakar‐Fox et al. (2011) required assessments to be performed on both a mesoscale andmicroscale. However, a modified ARDI has since been developed for site 1 to allow for theperformance of simpler, more time efficient assessments. An assessment was performed on all
4
samples, over an 8.5 cm x 5.5 cm size area, with the area most dominated by sulphide chosen forassessment, as the most conservative ARDI value was sought.
Field pH testing
Paste pH testing represents the most efficient manner by which to assess a sample’s immediate acidforming characteristics. Considering this, it was performed on all samples at the University ofTasmania (UTas, School of Physical Sciences, CRC ORE laboratory), with the ASTM D4972-01(2007)method used on drill core materials (i.e., site 1 and 3) following recommendations given in Noble etal. (2012). For weathered materials from site 2, the AMIRA P387A Handbook method (Smart et al.,2002) was used. The pH value of each tested sample was measured in triplicate, with the standarddeviation calculated as <0.5.
A method to accelerate the paste pH test by using a hot electrolyte solution to encourage fasterreaction kinetics was trialed. Select pulverised (< 63 µm) materials from sites 1 and 3 (n=20) werepaste pH tested using three different electrolyte solutions: i) tap-water; ii) deionised water (DI); andiii) 0.01M CaCl2. Certified reference materials KZK-1 and NBM-1 (purchased from CANMET;Natural Resources, Ottawa) were also tested. These solutions were heated to 100°C and pouredonto 10 g of sample weighed out in 50 ml glass beakers, with a 1:2 solid: solution ratio used. Oncepoured, beakers were stirred for 30 seconds and allowed to cool to room temperature.Measurements of pH and EC were taken after 1 hour in triplicate, with standard deviationcalculated as <0.01.
Field instrumentation
Short-wave infrared
The application of short-wave infrared (SWIR) spectroscopy in determining pale, fine-grainedalteration minerals has been demonstrated in ore-deposit characterisation studies (e.g., Thompsonet al., 1999; White et al., 2010). Mineral identification is based on absorption spectra collected fromclean, dry, flat, rock surfaces (Gifkins et al., 2005). SWIR therefore has potential to improve mineralidentification of altered drill core samples for ARD characterisation. Two instruments were selectedfor testing in this research on samples from site 2; a portable infrared mineral analyser (PIMA;manufactured by Integrated Spectronics, Australia) and a TerraSpec spectroradiometer(manufactured by analytical spectral device (ASD) Inc.). Materials from site 3 were tested using theTerraSpec only, however in this study, both intact pieces and homogenised powders from each 1 minterval were analysed to assess which is a more appropriate sample type.
Portable XRF
Accurately measuring chemistry and comparing these data to ARD parameters (e.g., paste pH,total-sulphur) allows for a first-pass indication of potential leachate quality issues which may arisetowards the life-of-mine end (i.e., mine closure). This in turn allows the development of appropriatewaste management plans. Field-portable XRF (pXRF) instruments have in recent years been usedin mine site characterisation studies for determining element concentrations (e.g., Haffert andCraw, 2010; Higueras et al., 2012). Most recently, Parbhakar-Fox et al. (2014) discussed itsapplication in mesotextural classification at abandoned mine-sites. In this study, a hand-heldOlympus-InnovX instrument was used (UTas, School of Earth Sciences) on intact drill core (three

5
areas selected) and homogenised powders at site 1, and powders taken at 1 m intervals at site 3,with reference standards NIST 2781, GXR3-538 and GXR4-2843 used throughout the analyses. Abenchtop Innov-X X50 XRF instrument was used to analyse waste materials collected from site 2.Both homogenised powders and intact portions (three areas analysed) were tested in this particularstudy. The instrument was routinely calibrated by the material supplied by the manufacturerduring the analyses (i.e., after ever 10th measurement).
Equotip
Measuring the susceptibility of a lithology to weathering is required to understand how rapidlyacid forming minerals will become exposed in a waste rock pile. Therefore, the application ofEquotip (a non-destructive, core-based measurement technique) which measures hardness wasexplored. The Leeb (Ls) hardness value (0 to 1000) is automatically calculated, and is the quotient ofthe rebound velocity over the impelled velocity multiplied by 1000 (Keeney, 2008). The impactbody rebounds faster from harder test samples than it does from softer ones, resulting in a greatervalue. Approximately 3000 Equotip measurements were collected on site 3 material only, using anEquotip 3 (Proceq) instrument, across the whole 70 m interval. Average values were calculated foreach 1 m interval based on measurements taken at 2.5 cm intervals. These values were usedalongside total-sulphur values for comparison with NAG pH vs. paste pH data. This has thepotential to allow for a low-cost first-pass understanding of lag-time to ARD on a deposit-scale.
Geochemical and mineralogical validation testing
Rapid and accurate measurement of total sulphur (wt.%) for comparison against Equotip andcalculation of maximum potential acidity (MPA) was performed on samples from sites 1 and 3using an Eltra C-S 2000 instrument at UTas (School of Physical Sciences). For site 2 samples, totalsulphur was measured using a Thermo Finnigan 1112 Series Flash Elemental Analyser instrument(Central Science Laboratory (CSL), UTas). Appropriate standard materials were analysed on bothinstruments during all analyses. In addition, the total element chemistry of samples from site 2 wasmeasured for comparison against pXRF data using a Philips PW1480 X-ray Spectrometer (UTas,School of Physical Sciences). Acid neutralising capacity (ANC) was measured by the Sobek methodat ALS Brisbane for samples from all three sites. The multi-addition net acid generation (mNAG)test was performed on materials from all sites at UTas (School of Physical Sciences) following theAMIRA P387A method (Smart et al., 2002).
Mineralogical determination of material from sites 1 and 3 was performed using a benchtop BrukerD2 Phaser X-ray diffractometer at UTas (School of Physical Sciences). Mineralogical analyses forsamples from site 2 were performed at the University of Ballarat, Australia, using a traditionalSiemens D501 diffractometer.
RESULTS AND DISCUSSION
Domaining neutralising potential: staining
The dominant carbonate textures observed in drill core material from site 3 comprised of clasts (inlimestone conglomerates) and veins. The Alizarin red S-potassium ferricyanide (ARS-PF) stainappropriately reacted with calcitic material in both textural forms; with the pink stain appropriatelyuptaken, with corresponding XRD data confirming this as calcite. Comparison of samples analysed

6
by the stain painted directly on, and those soaked directly in the stain, confirmed that stains werebetter uptaken by the latter method (Figure 1).
Figure 1 Photograph images of drill core from site 3 (massive sulphide deposit, western Tasmania, Australia);A) unstained and B) after several coatings of stain were painted directly on; C) unstained drill core sample
from site 1 (operational polymetallic mine, western Tasmania, Australia); C) stained drill core sample from site1 after soaking in stain bath for 30 minutes. The pink colour seen in both examples indicates the presence of
calcite thus identifying effective acid neutralising capacity
Domaining neutralising potential: SWIR
Whilst major rock forming minerals can be easily recognised in hand-specimen based on theirdifferent rock properties (i.e., hardness, lustre, habit), hydrothermally altered minerals are muchharder to identify. Typically, they can appear as pale and fine-grained, and with such a grain size,potential for participating in neutralising reactions (cf. Plumlee, 1999) is much greater. As stated,homogenised powder samples from site 2 were used in a study to compare two commonly usedSWIR instruments, namely the PIMA and TerraSpec. Muscovite was confirmed by XRD as thedominant alteration mineral in these hydrothermally altered rhyolite samples. Two examples oftypical PIMA and TerraSpec results are shown in Figure 2. Spectra collected by TerraSpec (Figure2b and d) were better defined (i.e., less noise), and show better agreement with the referencespectra. Results from PIMA showed greater deviation from the reference spectra for sample 1(Figure 2a), and were aspectral from sample 2 (Figure 2b). Based on these results, the TerraSpec isgiven preference for use. Furthermore, the TerraSpec is not restricted to analysis of pale-colouredminerals like PIMA and can detect a greater range of minerals including iron-oxyhydroxides.

7
Figure 2 Example of alteration mineral identification in Site 2 (abandoned lode-Au mine, Queensland) wasterock materials; A) Sample A analysed on a PIMA with muscovite identified; B) Sample A analysed on a
TerraSpec with muscovite confidently identified; C) Sample B analysed on a PIMA with an aspectral result;and D) Sample B analysed on a TerraSpec with muscovite confidently identified
In order to identify the best sample type for TerraSpec analysis, both powdered and intact drill corematerials from site 1 were tested. For powdered samples, noisy spectra were collected, which wereclassified as aspectral, therefore, preference is given to using intact drill core. However, invalidation testwork, the TerraSpec was less accurate than XRD. Whilst the TerraSpec was able toconfidently identify the presence of calcite, muscovite and chlorite in 52% of the samples, itoccasionally misidentified minerals such as tourmaline and epidote, which were neither logged, nordetected by XRD. Furthermore, whilst the TerraSpec instrument correct detected the presence ofcarbonate minerals in 52% (i.e., identified as calcite) of these samples, the exact carbonate mineraltype was only correctly identified in 10% of samples when compared to XRD. This is likelyexplained by having performed these analyses on intact drill core (i.e., non-homogenised, randomlyselected areas for analysis); therefore there is a high likelihood of conflicts when compared to XRDdata. Based on these results, it is evident that applications of TerraSpec for ANC domaining arelimited.
Assessing acid forming characteristics
Paste pH measurements are shown in Figure 3 with data compared against NAG pH and totalsulphur measurements as recommended in Parbhakar-Fox et al. (2011). A spread of data was seenfor all sites. Site 1 samples were mostly classified as potentially acid forming to non-acid forming;

8
site 2 samples showed a range of classifications with both extremely acid forming and non-acidforming materials identified; and site 3 samples were potentially acid forming to acid forming.
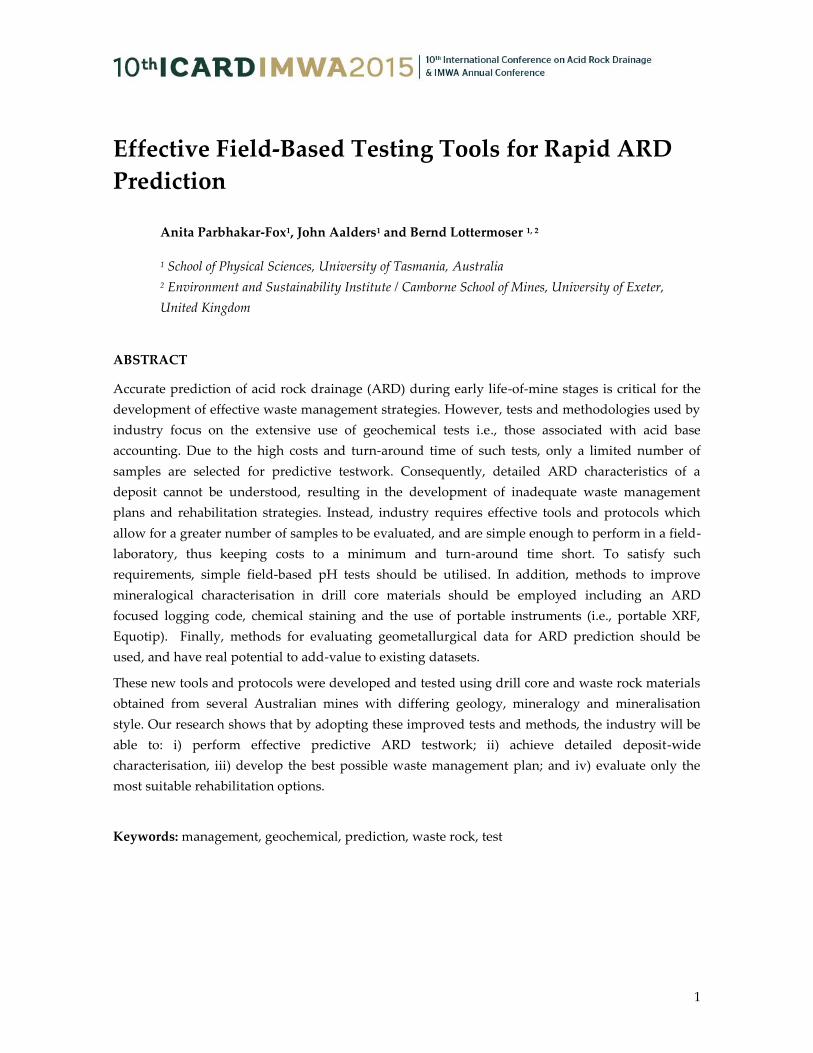
Accelerated paste pH data (DI water, tap water and ASTM D4921-01) were compared againststandard ASTM D4921-01 results for drill core materials from site 1 (Figure 4a) and site 3 (Figure4b). In general, for site 1 the accelerated ASTM D4921-01 returned the lowest pH values by up to 2.3units. Results from both accelerated water electrolyte experiments were in close approximation (R2=0.995). However, when values were compared against standard ASTM D4921-01 method data, theywere neither consistently higher, nor lower (pH unit difference range of +1.2 to -2.2). A similartrend was seen for site 3, with the accelerated ASTM D4921-01 test returning the lowest pH valuesfor the accelerated tests. When these were compared against the standard ASTM D4921-01 method,an inconsistent trend was once against observed with a pH unit different range of +1 to -2.25. Theseresults confirm that the accelerated test is encouraging reaction kinetics to proceed quicker as allaccelerated values differ to the standard ASTM method. In order to understand the changesoccurring during these tests, the supernatant chemistry will be assessed and a detailed XRD studyof the residual powder will be undertaken. In addition, a re-evaluation of field-NAG tests is to beundertaken. The aim of this will be to produce a simple pH testing methodology (which can beperformed at mine sites), the results from which can be used in more informative paste pH vs.NAG pH classifications.
Figure 3 Paste pH measurements performed on drill core and waste materials from sites 1, 2 and 3; A) NAGpH compared against paste pH (after Weber et al., 2006); B) Total sulphur compared against paste pH (afterParbhakar-Fox et al., 2011). Abbreviations: AF, acid forming; EAF, extremely acid forming; PAF, potentially
acid forming; NAF, non-acid forming)
9
Figure 4 Paste pH test results for 10 samples from site 1 (operational polymetallic mine, western Tasmania,Australia; 1 to 10) and site 3 (massive sulphide deposit, western Tasmania, Australia; 11 to 21). Data from four
experiments (3 accelerated, and one standard) are shown
Determination of bulk chemistry
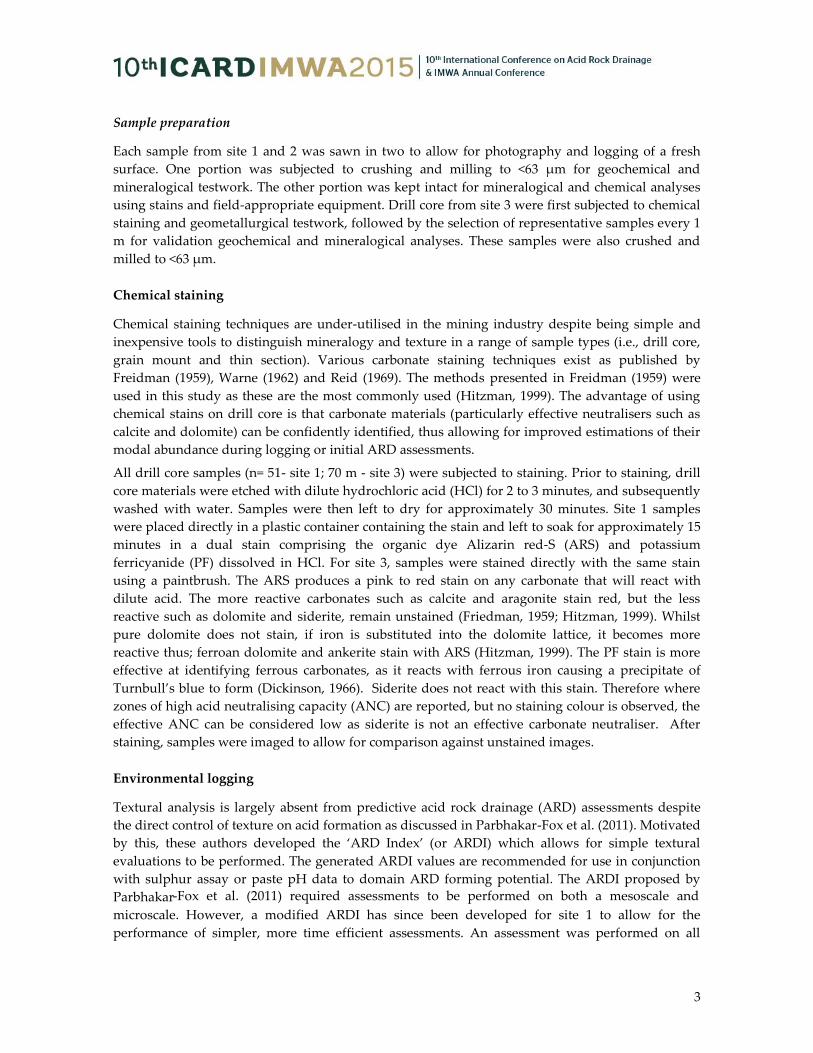
Measurements of sulphur are essential for the calculation of MPA. However, the turnaround timefor assay data may be significant (i.e., >48 hours). Alternatively, sulphur can be measured using aportable XRF or a benchtop element analyser. To test the accuracy of the various sulphurmeasurement techniques, materials from site 2 were subjected to measurements using an: i) elementanalyser; ii) traditional XRF; and iii) pXRF with results shown in Figure 5. Data from the elementanalyser and XRF were in close approximation (R2= 0.9979), however, data from the pXRF was inless agreement when compared with both methods (R2= 0.886 against EA; R2= 0.8197 against XRF).Based on these results, the use of pXRF to directly calculate MPA should be avoided. Instead, thiscan be accurately determined using an element analyser (e.g., Eltra CS 2000 instrument), wherebyreliable sulphur data can be collected efficiently. Instead, data from a pXRF instrument could beused to aid the identification of samples requiring such testwork, i.e., those with relatively highsulphur (i.e., above the specified total-sulphur cut-off).
Figure 5 Total sulphur measurements made by three different analytical instruments (portable XRF, pXRF;XRF and an element analyser, EA) on samples from site 2 (abandoned lode Au-operations, Queensland,
Australia)
10
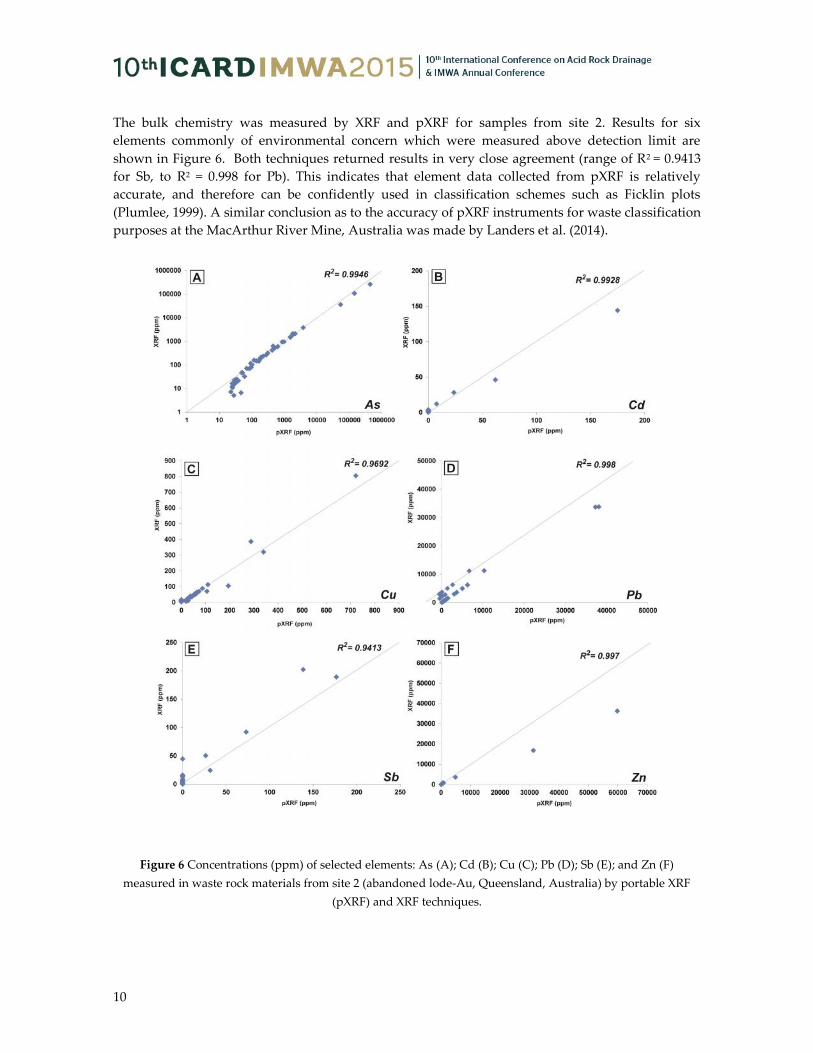
The bulk chemistry was measured by XRF and pXRF for samples from site 2. Results for sixelements commonly of environmental concern which were measured above detection limit areshown in Figure 6. Both techniques returned results in very close agreement (range of R2 = 0.9413for Sb, to R2 = 0.998 for Pb). This indicates that element data collected from pXRF is relativelyaccurate, and therefore can be confidently used in classification schemes such as Ficklin plots(Plumlee, 1999). A similar conclusion as to the accuracy of pXRF instruments for waste classificationpurposes at the MacArthur River Mine, Australia was made by Landers et al. (2014).
Figure 6 Concentrations (ppm) of selected elements: As (A); Cd (B); Cu (C); Pb (D); Sb (E); and Zn (F)measured in waste rock materials from site 2 (abandoned lode-Au, Queensland, Australia) by portable XRF
(pXRF) and XRF techniques.

11
The type of sample to use in pXRF tests was evaluated using material from site 1. Both werehomogenous powders and intact drill core were examined with results for the sum of metals (asconsidered in Ficklin plots) is shown in Figure 7. In general, there is positive correlation betweenboth datasets (R2= 0.81), with powdered samples generally returning higher values. From anefficiency perspective, collection of data on intact drill core is preferred; however, subjective (bias)sampling is introduced through identifying a particular interval for analysis. Furthermore, over agiven interval (i.e., 1 m or 5 m), if one final value is to be utilised, how many analysis should beperformed, and should an average value calculated and used? If analysis on drill core is to bepursued, a standard operating procedure must be enforced. To reduce such sampling issues, pXRFshould be performed on powdered materials (again, it would be advantageous to use the samepowdered materials as in total-sulphur and paste pH testing). In doing so, appropriate certifiedreference materials (CRMs) used here and described in Hall et al. (2014) and Piercey and Devine(2014) should also be analysed. Additionally, samples should be systematically selected forvalidation (using routine whole‐rock analysis techniques) and if necessary, specific correctionfactors developed.
Figure 7 Total metal concentrations (Cd, Cu, Co, Ni, Pb, Zn in ppm) measured by portable XRF (pXRF) in drillcore and homogenised powdered sample material collected from site 1 (operational polymetallic mine,
western Tasmania, Australia, n= 51)
Using hardness for waste classification
Mineral hardness data was measured by Equotip for all drill core material collected from site 1 (304m to 375 m). Whilst the objective was to domain ARD risk for the sulphidic schist material (345 m to375 m), the Equotip data also allowed for ANC assessment for the carbonate-breccia material (304m to 344 m). Comparisons of Equotip data against total sulphur and paste pH values are shown inFigure 8. If a mineral hardness value was <648 Ls, it was classified as soft in accordance withKeeney (2008). The schist material was classified as ‘PAF-rapid ARD likely’ by the criteria: paste pH<5.5, total-sulphur >0.3 wt. %, and < 648 Ls. Such a classification indicates that the material issusceptible to weathering as it is friable, which was observed in the field and during handling.Therefore, there is a greater likelihood of acid generation at a rapid rate, as sulphides in thismaterial (i.e., pyrite and chalcopyrite) will be quickly liberated. These findings are in agreement

12
with the NAG pH vs. paste pH classification (Figure 3a). Materials were classified as having ANCby the criteria: paste pH ≥8, total-sulphur values < 0.3 wt. % and <648 Ls (e.g., 309 m to 315 m;Figure 8d).These were taken to represent the most effective neutralisers. This study indicates thepotential assistance of Equotip data when performing field-based ARD studies. It is noteworthythat in the absence of paste pH data, mineral hardness and total sulphur data would have beensufficient to conservatively classify the behaviour of these materials.
Figure 8 Downhole geochemical and geometallurgical data from site 3 (massive sulphide deposit, westernTasmania, Australia) drill core material (304 m to 375 m, change of lithology indicated by the horizontal
dashed line at 345 m; A) Total sulphur values (wt. %; n=70) with 0.3 wt. % used as the classification cut-offcriterion (Parbhakar-Fox et al., 2011); B) Mineral hardness values as measured by Equotip and reported in Leeb
(Ls), with criteria for defining hard, medium and soft samples shown (Keeney, 2008); C) Paste pH values(n=55) with pH 5.5 used as the classification cut-off criterion; D) ARD classifications based on total sulphur,
mineral hardness and paste pH values. Abbreviations: AF, acid forming, high risk with rapid ARD formation,ANC, acid neutralising capacity, highly effective; NAF, non-acid forming; PAF, potentially acid forming,
medium risk with lag-time to ARD formation.
Geoenvironmental logging
A validation study of the acid rock drainage index (ARDI) was performed on drill core materialsfrom site 1, whereby ARDI values collected in mesotextural scale drill core material only werecompared against geochemical data (Figure 9). The ARDI was able to correctly identify sampleswith acid forming capacity (PAF, AF and EAF) when compared against total sulphur (Figure 9a),NAPP values (Figure 9b) and NAG pH (Figure 9c). The ARDI was more conservative in itsclassification of samples with neutralising capacity with several identified as NAF by the ARDI, butwere identified as having an ANC by Sobek testing (Figure 9d). In this instance, the ARDI was

13
considered more accurate, as it evaluated the content of sulphides in proximity to, and the mineralassociations of carbonate minerals. This study demonstrates the application of the ARDI,consequently, more mine sites should adopt such an ARD focused logging code in order topopulate their mine database with this environmental attribute. Additionally, this method can beperformed at mining operations in various stages of the life-of mine; for example: duringexploration on hand specimen samples, during mine operations to check the correct placement ofwaste materials, and post-closure at historic or abandoned sites.
Figure 9 Comparison of acid rock drainage index (ARDI) scores given to site 1 (operational polymetallic mine,western Tasmania, Australia) drill core materials (n=51) against: A. Total sulphur (wt. %); B.net acid producing
potential values (NAPP; kg H2SO4/t); C. net acid generation (NAG) pH; and D. acid neutralising capacity(ANC; kg H2SO4/t).
CONCLUSION
To effectively select the most appropriate samples for detailed geochemical and mineralogical testwork, which allows for ARD prediction and waste classification during early life-of-mineoperations, a pre-screening testing stage is required as described in Parbhakar-Fox et al. (2011).Such a stage must allow for a deposit-appropriate number of samples to be evaluated in order tobuild a database of ARD information allowing for the construction of a deposit-wide ARD model.Such a pre-screening stage must utilise efficient and cost-effective field-based tools. This permitssite-based staff to characterise their own materials, thus reducing turnaround time for obtainingARD relevant data, and improving the quality of decision making with regards to wastemanagement (e.g., scheduling, handling and placement). A range of both existing and newlydeveloped tools were examined in this study using materials collected from three Australian minesites.

14
Our study indicates that chemical staining is an appropriate technique by which to identify thepresence of carbonates if traditional mineral identification methods fail (e.g., if it is very finegrained and present in the rock matrix). Whilst the best stain responses are returned from soakingdrill core directly in chemical stains, it may not be practical to perform in a field laboratory.Therefore, painting stains directly onto core gives sufficient results. Carbonate staining responsesshould be used to assist with environmental logging using a modified ARDI (i.e., mesoscaleanalysis evaluation only). The use of automated hyperspectral loggers (e.g., HyLogger) as used forgeometallurgical testwork should be considered, as was demonstrated in Parbhakar-Fox andLottermoser (2014). Short-wave infrared data collected by a TerraSpec instrument can be used toconfirm the presence of carbonate but will only provide an indication of the exact carbonatemineral. Such analysis should only be performed on intact drill core materials and not onhomogenised powders. In order to classify the geochemical behaviour of the materials, paste pHtests should be performed and used against portable XRF data (collected from homogenisedpowders) on Ficklin plots. However, paste pH testing must be standardised industry-wide, andmethods in which to turn this simple method into a predictive test must be developed. Theaccelerated paste pH test represents one option; however, alternatives exist such as using a fieldNAG pH test. In addition, sulphur data should be collected on a bench-top instrument (if no assaydata exist), and used with mineral hardness values (as collected by Equotip) and paste pH todomain lag-time to ARD.
The benefit of utilising these field-based techniques is that it enables a database of ARD data to becollected and held on site thus allowing for in-house expertise to be built up. Ultimately, this willlead to an improved quality of waste management strategies, and better forecasting of appropriateof rehabilitation options. Additionally, as demonstrated by using materials from site 2 (abandonedlode-Au operations, Queensland, Australia) these simple field-techniques can be used at mines inthe final life-of-mine stage i.e., post-closure.
ACKNOWLEDGEMENTS
The authors would like to acknowledge the support of CRC ORE, established and supported by theAustralian Government’s Cooperative Research Centres Programme. The two western Tasmanianmines (sites 1 and 3) are thanked for access to drill core materials. Additionally, the QueenslandDepartment of Natural Resources and Mines are thanked for granting access to the abandonedlode-Au mine operations (site 2). Peter Harding and Dr. David Green of Minerals ResourcesTasmania (MRT) are thanked for allowing drill core testing on materials from site 3 to be performedat MRT. Finally from the University of Tasmania, Dr. Nathan Fox, Craig Winter and AngelaEscolme are acknowledged for analytical assistance.
REFERENCES
American Society for Testing and Materials ASTM D4972-01 (2007) Standard test method for pH of soils,ASTM D4972-01(2007). ASTM International, West Conshohocken.
Australian Government Department of Industry, Tourism and Resources (2007) Managing acid andmetalliferous drainage, Leading Practice Sustainable Development Program for the Mining Industry,Canberra, 96p.
Australian Laboratory Services (2014) Service Catalogue, pp. 42-43.
15
Bowell, RJ, Rees, SB, and Parshley, JV (2000) Geochemical predictions of metal leaching and acid generation:geologic controls and baseline assessment. Geology and Ore Deposits: The great Basin and BeyondProceedings 2, pp.799-823.
Dickinson, JAD (1966) Carbonate identification and genesis as revealed by staining, Journal of SedimentaryPetrology, vol.36, pp.491-505.
Freidman, GM (1959) Identification of carbonate minerals by staining methods, Journal of Sedimentary Petrology,vol.29, pp.87-97.
Gifkins, C, Herrman, W, and Large, R (2005) Altered Volcanic Rocks: a guide to description and interpretation,University of Tasmania, 275 pp.
Haffert, L, Craw, D, and Pope, J ( 2010) Climatic and compositional controls on secondary arsenic mineralformation in high-arsenic mine wastes, South Island, New Zealand, New Zealand Journal of Geology andGeophysics, vol.53, pp.91-101.
Hall, GEM, Bonham-Carter, GF, and Buchar, A (2014) Evaluation of portable X-ray fluorescence (pXRF) inexploration and mining: Phase 1, control reference materials. Geochemistry: Exploration, Environment,Analysis, 10.1144/geochem2013-241.
Higueras, P, Oyarzun, R, Iraizoz, JM, Lorenzo, S, Esbri, JM, and Martinez-Coronado, A (2012) Low-costgeochemical surveys for environmental studies in developing countries: Testing a field portable XRFinstrument under quasi-realistic conditions. Journal of Geochemical Exploration, vol.113, pp.3-12.
Hitzman, MW (1999) Routine staining of drill core to determine carbonate mineralogy and distinguishcarbonate alteration textures. Mineralium Deposita, vol.34, p.794-798.
Jambor, JL, Dutrizac, JE, Groat, L, and Raudsepp, M (2002) Static tests of neutralization potentials of silicateand aluminosilicate minerals. Environmental Geology, vol.43, pp. 1-17.
Keeney, L (2008) Equotip hardness testing: Aqqaluk (including a guide on how to use Equotip). AMIRA P843Technical Report 2, (ed: J Hunt), pp.17.1-17.20.
Kruse, F.A (1994) Identification and mapping of minerals in drill core using hyperspectral image analysis ofinfrared reflectance spectra. http://www.spectralcameras.com/fi les/Applications/Kruse_Core94.pdf
Landers, M, Usher, B, Faulkner, D, Marianelli, P, and Masterman, K (2014) Field and desktop waste rockclassification guide for a metalliferous mine in the northern territory, Australia. Proceedings of theEighth Australian Workshop on Acid and Metalliferous Drainage (Eds H Miller and L Preuss) pp.159-172.
Noble, TL, Lottermoser, BG, and Parbhakar-Fox, A (2012) Evaluating pH tests for mine water prediction, in 3rd
International Congress on Water Management in the Mining Industry, (eds: F Valenzuela, J Wiertz) pp.504-512.
Parbhakar-Fox, A, and Lottermoser, B (2014) Domaining acid rock drainage risks using geometallurgical data.In Proceedings of the Eighth Australian Workshop on Acid and Metalliferous (Eds H Miller and L Preuss)pp. 483-494.
Parbhakar‐Fox, A, Edraki, M, Hardie, K, Kadletz, O, and Hall, T (2014) Identification of acid rock drainagesources through mesotextural classification at abandoned mines of Croydon, Australia: Implicationsfor the rehabilitation of waste rock repositories, Journal of Geochemical Exploration, vol. 137 pp. 11‐28.
Parbhakar-Fox, AK, Edraki, M, Walters, S ,and Bradshaw, D (2011) Development of a textural index for theprediction of acid rock drainage, Minerals Engineering, vol. 24, pp.1277-1287.

16
Piercey, SJ and Devine, MC (2014) Analysis of powdered reference materials and known samples with abenchtop, field portable X-Ray fluorescence (pXRF) spectrometer: evalution of performance andpotential applications for exploration lithogeochemistry. Geochemistry: Exploration, Environment,Analysis. 10.1144/geochem2013-199
Plumlee, GS (1999) The environmental geology of mineral deposits, in The Environmental Geochemistry ofMineral Deposits Part A: Processes, Techniques and Health Issues, (eds: GS Plumlee, MJ Lodgson),Reviews in Economic Geology, Vol. 6B pp.71-116.
Reid, WP (1969) Mineral staining tests, Colorado School of Mines: Mineral Industry Bulletin, vol.12, pp.1-20.
Smart, R, Skinner, WM, Levay, G, Gerson, AR, Thomas, JE, Sobieraj, H, Schumann, R, Weisener, CG, Weber,PA, Miller, SD and Stewart, W.A (2002) ARD test handbook: Project P387A, A prediction and kineticcontrol of acid mine drainage, Melbourne, Australia: AMIRA, International Ltd, Ian Wark ResearchInstitute.
Thompson, AJB, Hauff , PL, and Robitaille, AJ (1999) Alteration mapping in exploration: application of short-wave infrared (SWIR) spectroscopy, Society of Economic Geology Newsletter, vol .39, 13 p.
Warne, S (1962) A quick field or laboratory staining scheme for the differentiation of the major carbonateminerals, Journal of Sedimentary Petrology, vol.32, pp.29-38.
Weber, PA, Hughes, JB, Conner, LB, Lindsay, P, and Smart, R (2006) Short-term acid rock drainagecharacteristics determined by paste pH and kinetic NAG testing: Cypress prospect, New Zealand,Paper presented at the 7th International Conference on Acid Rock Drainage (ICARD).
White, A, Robb, VM, Robb, LJ, and Waters, DJ (2010) Portable infrared spectroscopy as a tool for theexploration of gold deposits in tropical terrains: A case study at the Damang deposit, Ghana, Society ofEconomic Geologists Special Publication 15.