effective programs in middle and high school mathematics: a best
TRANSCRIPT
The Best Evidence Encyclopedia is a free web site created by the Johns Hopkins University School of Education’s Center for Data-Driven Reform in Education (CDDRE) under funding from the Institute of Education Sciences, U.S. Department of Education.
1
Effective Programs
in Middle and High School Mathematics: A
Best-Evidence Synthesis
Robert E. Slavin
Cynthia Lake
Johns Hopkins University
Cynthia Groff
University of Pennsylvania
Version 1.3
August, 2008
_______________ This paper was written under funding from the Institute of Education Sciences, U.S. Department
of Education (Grant No. R305A040082). However, any opinions expressed are those of the authors and
do not necessarily represent Department of Education positions or policies.
We thank Steve Ross, Carole Torgerson, and Bette Chambers for comments on an earlier draft,
and we thank Dewi Smith, Susan Davis, and Sharon Fox for their help.
Effective Programs in Middle and High School Mathematics
The Best Evidence Encyclopedia is a free web site created by the Johns Hopkins University School of Education’s Center for Data-Driven Reform in Education (CDDRE) under funding from the Institute of Education Sciences, U.S. Department of Education.
2
Abstract
This article reviews research on the achievement outcomes of mathematics programs for
middle and high schools. Study inclusion requirements included use of a randomized or matched
control group, a study duration of at least twelve weeks, and equality at pretest. There were 100
qualifying studies, 26 of which used random assignment to treatments. Effect sizes were very
small (weighted mean ES=+0.03 in 40 studies) for mathematics curricula, and for computer-
assisted instruction (ES=+0.10 in 38 studies). They were larger (weighted mean ES=+0.18 in 22
studies) for instructional process programs, especially cooperative learning (weighted mean
ES=+0.42 in 9 studies). Consistent with an earlier review of elementary programs, this article
concludes that programs that affect daily teaching practices and student interactions have larger
impacts on achievement measures than those emphasizing textbooks or technology alone.
Effective Programs in Middle and High School Mathematics
The Best Evidence Encyclopedia is a free web site created by the Johns Hopkins University School of Education’s Center for Data-Driven Reform in Education (CDDRE) under funding from the Institute of Education Sciences, U.S. Department of Education.
3
The mathematics achievement of America’s middle and high school students is an issue
of great concern to policymakers as well as educators. Many believe that secondary math
achievement is a key predictor of a nation’s long term economic potential (see, for example,
Friedman, 2006). In countries other than the U.S., results of international comparisons of
mathematics achievement, such as the PISA study (Thomson, Cresswell, & De Bortoli, 2003)
and the TIMSS study (IEA, 2003) are front-page news, because it is widely believed that their
students’ performance in math and science is of great importance to their nations’ competitive
strength for the future.
The performance of U.S. students is neither disastrous nor stellar, and it is improving. On
the PISA study (Thomson, Cresswell, & De Bortoli, 2003), American 15-year olds ranked 28th
out of 40, behind such similar nations as Canada, Australia, France, and Germany, and far behind
Hong Kong, Finland, Korea, and Japan. On TIMSS (IEA, 2003), U.S. eighth graders ranked 14th
out of 34 in 2003, but on a positive note, U.S. TIMSS scores and rank have gained significantly
since 1995. On the U.S. National Assessment of Educational Progress (NAEP, 2007), eighth
graders are also showing steady progress. From 52% of eighth graders scoring at “basic” or
better in 1990, 71% scored at that level in 2007, and the percent scoring “proficient” or better
doubled, from 15% in 1990 to 32% in 2005. This is much in contrast to the situation in reading,
where eighth graders in 2007 are scoring only slightly better than those in 1992.
The problem of mathematics performance in American middle and high schools is not
primarily a problem of comparisons to other countries, however, but more a problem within the
U.S. There are enormous differences between the performance of white and middle class
students and that of minority and disadvantaged students, and the gap is not diminishing. On the
2007 NAEP, 39% of white students scored proficient or better, compared to 9% of African-
American, 13% of Hispanic, and 14% of American Indian students. Similarly, 39% of non-poor
eighth graders achieved at proficient or better, in comparison to 13% of students who qualify for
free lunch. Improvements are needed for all students, of course, but the crisis is in schools serving
many poor and minority children.
Clearly, to continue to advance in mathematics achievement, we must improve the
quality of math instruction received by all students. What tools do we have available to intervene
in middle and high schools to significantly improve their mathematics outcomes? Which
textbooks, technology applications, and professional development approaches are known to be
effective? The purpose of this review is to apply consistent methodological standards to the
research on all types of mathematics programs for middle and high schools to find answers to
these questions.
Although there have been reviews of research on effective classroom teaching practices
in math (e.g., Anthony & Walshaw, 2007), a comprehensive review systematically comparing
the evidence base supporting alternative programs in middle and high school mathematics has
never been done. The What Works Clearinghouse (2007) did review research on middle school
textbooks and computer programs. As of this writing, it has posted “effectiveness ratings” for six
programs. It rated two programs, I Can Learn (a core computer curriculum) and Saxon Math (a
Effective Programs in Middle and High School Mathematics
The Best Evidence Encyclopedia is a free web site created by the Johns Hopkins University School of Education’s Center for Data-Driven Reform in Education (CDDRE) under funding from the Institute of Education Sciences, U.S. Department of Education.
4
back-to-the-basics textbook) as having “positive effects,” two (UCSMP Algebra and The Expert
Mathematican) as having “potentially positive effects,” and two (Connected Mathematics and
Transition Mathematics) as having “mixed effects.” Clewell et al. (2004) briefly reviewed
studies of math and science curricula and professional development models for middle and high
schools, but did not draw any conclusions. There have also been reviews of research on the use
of computer technology in mathematics, and these have included studies at the middle and high
school level (e.g., Becker, 1991; Chambers, 2003; Murphy, Penuel, Means, Korbak, Whaley, &
Allen, 2002). Project 2061 (AAAS, 2000) evaluated various middle school math programs to
determine the degree to which they correspond to current conceptions of curriculum, but did not
focus on student outcomes.
The National Research Council (2004; see also Confrey, 2006) commissioned a blue-
ribbon panel to review research on the outcomes of mathematics textbooks for grades K-12.
They identified 63 quasi-experimental studies that met their standards, but decided that they did
not warrant any conclusions. It said nothing about outcomes of particular programs or types of
programs, and took the position that studies showing differences in student outcomes are not
sufficient, regardless of the quality of the evaluation design, unless the content has been
reviewed by math educators and mathematicians to be sure that they correspond to current
conceptions of appropriate curriculum. Since none of the 63 studies did this, the NRC panelists
decided not to present the outcome evidence it had found.
The current review builds on a systematic review of research on the outcomes of
mathematics programs for elementary students, grades K-6, by Slavin & Lake (in press). That
review focused on three types of programs: mathematics curricula (e.g., Everyday Mathematics,
Saxon Math), computer-assisted instruction (e.g., SuccessMaker, Compass Learning), and
professional development programs (e.g., cooperative learning, classroom management,
tutoring). Studies were included if they compared experimental and well-matched control groups
over periods of at least 12 weeks on standardized measures of objectives pursued equally by all
groups. A total of 87 studies met these criteria, of which 36 used random assignment to
treatments. Combining effects across studies within categories, Slavin & Lake (in press) found
limited effects of the math curricula (median ES=+0.10 in 13 studies), better effects of computer-
assisted instruction (median ES=+0.19 in 38 studies), and the best effects and the highest-quality
studies for instructional process programs (median ES=+0.33 in 36 studies). Within categories,
effect sizes for randomized and matched studies were nearly identical.
Focus of the Current Review
The present review uses procedures identical to those used by Slavin & Lake (in press) to
review research on mathematics programs for middle and high schools, grades 6-12 (sixth
graders appeared in the earlier review if they were in elementary schools, in the current review if
they were in middle schools). As in Slavin & Lake (in press), the intention of the present review
is to place all types of programs intended to enhance the mathematics achievement of middle and
high school students on a common scale, to provide educators with meaningful, unbiased
information that they can use to select programs most likely to make a difference for their
Effective Programs in Middle and High School Mathematics
The Best Evidence Encyclopedia is a free web site created by the Johns Hopkins University School of Education’s Center for Data-Driven Reform in Education (CDDRE) under funding from the Institute of Education Sciences, U.S. Department of Education.
5
students’ standardized test scores. The review also seeks to identify common characteristics of
programs likely to make a difference in student math achievement. This synthesis includes all
kinds of approaches to math instruction, and groups them in three categories. Mathematics
curricula focus primarily on textbooks. These include the programs developed under funding
from the National Science Foundation beginning in the early 1990s, such as the University of
Chicago School Mathematics Project (UCSMP) and Connected Mathematics, as well as standard
textbooks produced by commercial publishers. Computer-assisted instruction (CAI) refers to
programs that use technology to enhance mathematics achievement. CAI programs can be
supplementary, as when students are sent to computer labs for additional practice (e.g.,
Jostens/Compass Learning), or they can be core, substantially replacing the teacher with self-
paced instruction on the computer (e.g., Cognitive Tutor, I Can Learn). CAI is the one category
of mathematics programs that has been extensively reviewed in the past, most recently by Kulik
(2003), Murphy et al. (2002), and Chambers (2003), and core CAI programs were included in the
What Works Clearinghouse (2007) review of middle school math programs. The third category,
instructional process programs, is the most diverse. All programs in this category rely primarily
on professional development to give teachers effective strategies for teaching mathematics.
These include programs focusing on cooperative learning, individualized instruction, mastery
learning, and comprehensive school reform, as well as on programs more explicitly focused on
mathematics content.
Review Methods
The review methods are essentially identical to those used by Slavin & Lake (in press),
who used a technique called best evidence synthesis (Slavin, 1986), which seeks to apply
consistent, well-justified standards to identify unbiased, meaningful information from
experimental studies, discussing each study in some detail, and pooling effect sizes across
studies in substantively justified categories. The method is very similar to meta-analysis (Cooper,
1998; Lipsey & Wilson, 2001), adding an emphasis on description of each study’s contribution.
It is also very similar to the methods used by the What Works Clearinghouse (2007), with a few
exceptions noted in the following section. (See Slavin, 2008, for an extended discussion and
rationale for the procedures used in both reviews.)
Literature Search Procedures
A broad literature search was carried out in an attempt to locate every study that could
possibly meet the inclusion requirements. This included obtaining all of the middle school
studies cited by the What Works Clearinghouse (2007), the middle and high school studies cited
by the National Research Council (2004), by Clewell et al., and by other reviews of mathematics
programs, including technology programs that teach math (e.g., Chambers, 2003; Kulik, 2003;
Murphy et al., 2002). Electronic searches were made of educational databases (JSTOR, ERIC,
EBSCO, PsychInfo, Dissertation Abstracts), web-based repositories, and education publishers’
websites. Besides searching by key terms, we conducted searches by program name and
attempted to contact producers and developers of reading programs to check whether they knew
of studies that we had missed. Citations of studies appearing in the first wave of studies were
Effective Programs in Middle and High School Mathematics
The Best Evidence Encyclopedia is a free web site created by the Johns Hopkins University School of Education’s Center for Data-Driven Reform in Education (CDDRE) under funding from the Institute of Education Sciences, U.S. Department of Education.
6
also followed up. Unlike the What Works Clearinghouse, which excludes studies more than 20
years old, studies meeting the selection criteria were included if they were published from 1970
to the present. Through these procedures we identified and reviewed more than 500 studies of
secondary math interventions.
Effect Sizes
In general, effect sizes were computed as the difference between experimental and
control individual student posttests after adjustment for pretests and other covariates, divided by
the unadjusted control group standard deviation (SD). If the control group SD was not available,
a pooled SD was used. Procedures described by Lipsey & Wilson (2001) and Sedlmeier &
Gigerenzor (1989) were used to estimate effect sizes when unadjusted standard deviations were
not available, as when the only standard deviation presented was already adjusted for covariates,
or when only gain score SD’s were available. School- or classroom-level SD’s were adjusted to
approximate individual-level SD’s, as aggregated SD’s tend to be much smaller than individual
SD’s. If pretest and posttest means and SD’s were presented but adjusted means were not, effect
sizes for pretests were subtracted from effect sizes for posttests. When effect sizes were
averaged, they were weighted by sample size, up to a cap weight of 2500 students.
Criteria for Inclusion
Criteria for inclusion of studies in this review were as follows:
1. The studies evaluated programs for middle and high school mathematics. Studies
of variables, such as ability grouping, block scheduling, and single-sex
classrooms, were not reviewed.
2. The studies involved middle and high school students in grades 7-12, plus sixth
graders if they were in middle schools.
3. The studies compared children taught in classes using a given mathematics
program to those in control classes using an alternative program or standard
methods.
4. Studies could have taken place in any country, but the report had to be available
in English. The report had to have been published in 1970 or later.
5. Random assignment or matching with appropriate adjustments for any pretest
differences (e.g., analyses of covariance) had to be used. Regression discontinuity
designs would have been included, but no such studies were located. Otherwise,
studies without control groups, such as pre-post comparisons, and comparisons to
“expected” gains, were excluded.

Effective Programs in Middle and High School Mathematics
The Best Evidence Encyclopedia is a free web site created by the Johns Hopkins University School of Education’s Center for Data-Driven Reform in Education (CDDRE) under funding from the Institute of Education Sciences, U.S. Department of Education.
7
6. Pretest data had to be provided, unless studies used random assignment of at least
30 units (individuals, classes, or schools) and there were no indications of initial
inequality. Studies with pretest differences of more than 50% of a standard
deviation were excluded, because even with analyses of covariance, large pretest
differences cannot be adequately controlled for, as underlying distributions may
be fundamentally different. Studies in which treatments had been in place before
pretesting were excluded.
7. The dependent measures included quantitative measures of mathematics
performance, such as standardized mathematics measures. Experimenter-made
measures were accepted if they were described as comprehensive measures of
mathematics, which would be fair to the control groups, but measures of math
objectives inherent to the program (but unlikely to be emphasized in control
groups) were excluded. The exclusion of measures inherent to the experimental
treatment is a key difference between the procedures used in the present review
and those used by the What Works Clearinghouse.
8. A minimum treatment duration of 12 weeks was required. This requirement is
intended to focus the review on practical programs intended for use for the whole
year, rather than brief investigations. Brief studies may not allow programs to
show their full effect. On the other hand, brief studies often advantage
experimental groups that focus on a particular set of objectives during a limited
time period while control groups spread that topic over a longer period.
9. Studies had to have at least two teachers and 15 students in each treatment group.
Appendix 1 lists studies that were considered but excluded according to these criteria, as well as
the reasons for exclusion. Appendix 2 lists abbreviations used throughout the review.
Categories of Research Design
Four categories of research designs were identified. Randomized experiments (RE) were
those in which students, classes, or schools were randomly assigned to treatments, and data
analyses were at the level of random assignment. When schools or classes were randomly
assigned but there were too few schools or classes to justify analysis at the level of random
assignment, the study was categorized as a randomized quasi-experiment (RQE) (Slavin, 2008).
Several studies claimed to use random assignment because students were assigned to classes by a
scheduling computer, but scheduling constraints (such as conflicts with advanced or remedial
courses taught during the same period) can greatly affect such assignments. Studies using
scheduling computers were categorized as matched, not random. Matched (M) studies were ones
in which experimental and control groups were matched on key variables at pretest, before
posttests were known, while matched post-hoc (MPH) studies were ones in which groups were
matched retrospectively, after posttests were known. For reasons described by Slavin (2008),
studies using fully randomized designs are less likely to overestimate statistical significance, but
all randomized experiments are preferable to matched studies, because randomization eliminates
Effective Programs in Middle and High School Mathematics
The Best Evidence Encyclopedia is a free web site created by the Johns Hopkins University School of Education’s Center for Data-Driven Reform in Education (CDDRE) under funding from the Institute of Education Sciences, U.S. Department of Education.
8
selection bias. Among matched designs, prospective designs are strongly preferred to post-hoc or
retrospective designs. In the text and in tables, studies of each type of program are listed in this
order: RE, RQE, M, MPH. Within these categories, studies with larger sample sizes are listed
first. Therefore, studies discussed earlier in each section should be given greater weight than
those listed later, all other things being equal.
Results
Mathematics Curricula
Much of the debate in mathematics instruction revolves around the use of innovative
textbooks or curricula. The curricula that have been evaluated fall into three distinct categories.
One is innovative strategies based on the NCTM Standards, which focus on problem-solving,
alternative solutions, and conceptual understanding. The most widely used programs of this type,
the University of Chicago School Mathematics Project (UCSMP), Connected Mathematics, and
Core-Plus Mathematics, were all created under NSF funding. Another category is traditional
commercial textbooks, such as McDougal-Littell and Prentice Hall, that are also based on
NCTM Standards but have a more traditional balance between algorithms, concepts, and
problem solving. Finally, there is Saxon Math, a back-to-the-basics textbook that emphasizes a
step-by-step approach to mathematics.
In the Slavin & Lake (in press) review of elementary mathematics programs and in What
Works Clearinghouse (2008 a, b) reviews of research on elementary and middle school
textbooks, effects of alternative curricula were found to be very small, and rarely statistically
significant.
Table 1 summarizes the qualifying studies of mathematics curricula, which are then
described in detail.
=============
TABLE 1 HERE
=============
NSF-Supported Programs
University of Chicago School Mathematics Project (UCSMP)
The University of Chicago School Mathematics Project (UCSMP) is the premier example
of research-based mathematics reform in the U.S. Under National Science Foundation and other
funding, the UCSMP created and evaluated programs for elementary and secondary schools.
(The elementary programs are disseminated under the name Everyday Mathematics.) UCSMP

Effective Programs in Middle and High School Mathematics
The Best Evidence Encyclopedia is a free web site created by the Johns Hopkins University School of Education’s Center for Data-Driven Reform in Education (CDDRE) under funding from the Institute of Education Sciences, U.S. Department of Education.
9
materials, published by SRA-McGraw Hill, are by far the most widely used of the NSF-funded
mathematics reform programs in schools throughout the U.S.
The focus of all of the UCSMP programs is on putting into daily practice the NCTM
(1989, 2000) Standards. These programs strongly emphasize problem-solving, multiple
solutions, conceptual understanding, and applications. Calculators and other technology are
extensively used.
UCSMP is also the most extensively evaluated of all mathematics curricula. Many of the
studies lack control groups, or only used measures inherent to the program, and therefore do not
meet the standards of the present review. However, there are also several studies that compare
UCSMP and control students on measures that assess the content studied in both groups, and
these are reviewed here.
UCSMP Transition Mathematics
Hedges, Stodolsky, Mathison, & Flores (1986) evaluated the UCSMP Transition
Mathematics program in grades 7-9 Pre-Algebra/General Math classes. Twenty matched pairs of
classes were compared on the Scott Foresman General Mathematics scale. Classes were well
matched at pretest. At posttest, 30% of students were allowed to use calculators. Because
calculators are a key part of UCSMP but were used (only occasionally) in only one-third of
control classes, analyses involving the students who used calculators are biased toward the
UCSMP students, as the study authors note. Among the students who did not use calculators,
there were no significant differences (ES=-0.08, n.s.).
Plude (1992) evaluated UCSMP-Transitional Mathematics in a Connecticut middle
school. Eighth graders in two classes using UCSMP were compared to those in six traditional
classes. Students were pre- and posttested on the HSST General Math assessment and the
Orleans-Hanna Pre-Algebra test. Students in the UCSMP classes gained more than controls on
the HSST (ES=+0.28) but not on the Orleans-Hanna (ES=+0.04), for a mean effect size of +0.16.
Thompson, Senk, Witonsky, Usiskin, & Kaeley (2005) evaluated the second edition of
the UCSMP Transition Mathematics program. In this study, four classes in three diverse middle
schools were matched with four control classes in the same schools, using a variety of standard
textbooks. Most students were in grades 7-8. The High School Subject Tests (HSST) General
Math assessment was used as a pre-and posttest. Adjusted posttests non-significantly favored the
control group (ES=- 0.14, n.s.).
Swann (1996) evaluated the UCSMP Transition Mathematics program in a post-hoc
matched evaluation in a suburban Lexington, South Carolina middle school. Seventh graders
who had performed above the 75th
percentile on the South Carolina Basic Skills Assessment
Program (BSAP) in fifth grade used Transition Mathematics in 1993-94. They were individually
matched with seventh graders from the previous year who also scored above the 75th
percentile
on BSAP and had used traditional texts. There were 260 students in each group. At the end of
Effective Programs in Middle and High School Mathematics
The Best Evidence Encyclopedia is a free web site created by the Johns Hopkins University School of Education’s Center for Data-Driven Reform in Education (CDDRE) under funding from the Institute of Education Sciences, U.S. Department of Education.
10
seventh grade, there were no differences on the Stanford Achievement Test (SAT-8) total
mathematics (ES=-0.07, n.s.). Looking at subtests, however, there were interesting patterns.
Students in the Transition Mathematics classes scored significantly higher on Mathematics
Applications (ES=+0.26, p<.001), but the control group scored significantly higher on
Mathematics Computation (ES=-0.42, p<.001). There were no differences on Concepts of
Number (ES=-0.10, n.s.). A subset of 72 high-achieving students who took the PSAT in eighth
grade were individually matched with a control group on fifth grade BSAP scores. On PSAT-
Mathematics the Transition Mathematics students scored significantly higher than controls
(ES=+0.32, p<.05). Averaging the SAT-8 Total Mathematics and the PSAT-Mathematics effect
sizes yields an average of ES=+0.12. The pattern of findings suggests that the effects of
Transition Mathematics for these high-achieving students were to increase applications skill (an
emphasis of the program) at the expense of skill in computations.
UCSMP Algebra
A large-scale cluster randomized experiment evaluating an early form of UCSMP
Algebra I was reported by Swafford & Kepner (1980). Teachers within 20 schools were
randomly assigned to experimental or control conditions in a year-long experiment. Of these, 17
teacher pairs were used in the final analyses. There were a total of 679 experimental and 611
control students with complete pre- and posttest data. On the ETS Cooperative Mathematics
Test: Algebra I, adjusted posttests favored the control group (ES= -0.15). Posttest scores were
not significantly different at the teacher level but were significantly different (p<.001) at the
student level. There were modest positive effects on a treatment-specific test, but this measure
did not meet the standards of the review.
Mathison, Hedges, Stodolsky, Flores, & Sarther (1989) evaluated UCSMP Algebra in
schools across the U.S. The study compared eighth and ninth grade classes in which students had
or had not experienced the UCSMP Transitional Mathematics program in the previous year and
then experienced UCSMP Algebra or alternative programs. Classes of each type were matched
on Iowa Algebra Aptitude Test (IAAT) scores and demographics. The posttest was the HSST:
Algebra. There were no significant differences between UCSMP and control classes, whether or
not students had previously experienced Transitional Mathematics. The effect size was estimated
at ES=-0.19.
Thompson, Senk, Witonsky, Usiskin, & Kaeley (2006) evaluated the Second Edition of
UCSMP Algebra. Six classes in three diverse schools were matched with control classes in the
same schools. Control classes used a variety of standard textbooks. Most students were ninth
graders. UCSMP and control classes were well matched at pretest. At posttest (HSST: Algebra),
UCSMP and control students were not significantly different, but the adjusted effect size was
positive (ES=+0.22, n.s.).
UCSMP Geometry

Effective Programs in Middle and High School Mathematics
The Best Evidence Encyclopedia is a free web site created by the Johns Hopkins University School of Education’s Center for Data-Driven Reform in Education (CDDRE) under funding from the Institute of Education Sciences, U.S. Department of Education.
11
Thompson, Witonsky, Senk, Usiskin, & Kaeley (2003) evaluated the second edition of
UCSMP Geometry in eight classes located in four diverse schools in various parts of the U.S.
Most students were in grades 9-11. In each school, two UCSMP and two control classes were
identified. (Control classes used a variety of standard textbooks.) The report notes that “where
possible, teachers were randomly assigned to UCSMP Second Edition or…the non-UCSMP
geometry textbook” (p. 18), but because random assignment was apparently not always possible,
this is treated as a matched study.
The main outcome of interest was the HSST: Geometry, Form B. Students were pre- and
posttested on this measure. They were well-matched at pretest. At posttest, adjusting for pretests,
there were no significant differences (ES=+0.08, n.s.).
Usiskin (1972) evaluated an early form of UCSMP Geometry. Eight teachers in six
schools served as the experimental group and nine teachers in seven different schools using
traditional texts served as controls. Students were pre- and posttested on alternate forms of the
ETS Cooperative Tests in geometry. On posttests adjusting for pretests, the control students
scored at a significantly higher level, with an effect size estimated at
-0.47 (p<.01).
UCSMP Algebra II
Hayman (1973; see also Usiskin & Bernhold, 1973) evaluated an early form of UCSMP
among eleventh graders taking Algebra II. Ten UCSMP classes were compared with twelve
control classes using standard textbooks. Students were pre- and posttested on the ETS Algebra
II exam. There were no significant differences in adjusted posttests (ES=+0.06, n.s.).
Across the ten high-quality matched evaluations of UCSMP, the weighted mean effect
size was only -0.10. It is important to note, however, that some of the studies also administered
assessments specific to the UCSMP content, and on these assessments, effects were positive. The
authors of the UCSMP evaluations describe the findings as indicating that UCSMP students
perform no worse than control students on traditional measures, and they learn additional content
not taught in the control classes. The importance of the additional content taught in UCSMP is a
matter of values and cannot be determined in research of the kind emphasized here. All that can
be said is that based on research to date, UCSMP secondary programs cannot be expected to
increase achievement on the types of measures that assess today’s national objectives in
mathematics.
Connected Mathematics
The Connected Mathematics Project (CMP) (Lappan, Fey, Fitzgerald, Friel, & Phillips,
1998) is a problem-centered mathematics curriculum for grades 6-8. One of the NSF-supported
curricula, it emphasizes connections between mathematical ideas and their real-life applications,
among different topics of mathematics, and between teaching-learning activities and student
characteristics. CMP lessons focus on complex problems, addressing the NCTM (1989)
Standards.
Effective Programs in Middle and High School Mathematics
The Best Evidence Encyclopedia is a free web site created by the Johns Hopkins University School of Education’s Center for Data-Driven Reform in Education (CDDRE) under funding from the Institute of Education Sciences, U.S. Department of Education.
12
Clarkson (2001) evaluated the Connected Mathematics Program (CMP) in urban, diverse
middle schools in Minnesota. Eighth graders in two schools using Connected Mathematics were
compared to those in a demographically matched school using traditional methods on a state
Basic Skills Test (BST), controlling for their fifth grade NALT scores. The schools had been
using Connected Mathematics for three years. At posttest, BST scores were not significantly
different overall (ES=+0.07, n.s.). Analyses by ethnic groups found significantly higher
achievement for White students in CMP and marginally higher achievement for African
American students, controlling for pretests, but Asian American students scored significantly
better in the control group, and there were no differences for Hispanic or American Indian
subgroups.
Riordan & Noyce (2001) evaluated Connected Mathematics in a post-hoc matched
experiment. Twenty-one Massachusetts middle schools that had used CMP for two to four years
were contrasted with a set of comparison schools matched on baseline state test scores, percent
of students receiving free- and reduced-price lunch, ethnic distribution, English language
proficiency, and special education rates. Schools were largely White (89%) and non-poor (10%
free/reduced lunch). A total of 34 comparison schools (5587 students) were identified for the 21
CMP schools (1952 students). The comparison schools used a variety of textbook programs.
The outcome measure was the Massachusetts Comprehensive Assessment System
(MCAS), given in eighth grade. Analyses of variance showed effects of CMP to be significantly
positive (p<.001). Combining one 4-year school with 20 2-3 year schools, the effect size was
+0.23. Effects were similar for free-lunch and non-free-lunch students, for students who were
high, average, and low in prior performance, for all subscales on the MCAS, and for each ethnic
group (except that Hispanic students had particularly large gains).
A follow-up of the Riordan & Noyce (2001) study was carried out by Riordan, Noyce, &
Perda (2003). Massachusetts schools that had used CMP were rematched with comparison
schools due to one district dropping the program. A comparison of eighth graders who had
experienced CMP for three years to those in matched comparison schools who had also been in
their schools for three years showed small but statistically significant differences on MCAS at
the student level (ES=+0.09). A follow-up comparison of tenth graders who had experienced
CMP through eighth grade and those who had not showed no differences (ES=+0.02).
Schneider (2000) carried out a post-hoc study of Connected Mathematics that was similar
in design to the Riordan & Noyce study. Twenty-three schools across Texas using Connected
Mathematics were matched with 23 comparison schools, using a regression formula to match
schools on predicted TAAS scores and demographic data. Then TAAS data were obtained and
analyzed as passing rates. Combining across schools that had used CMP for one, two, or three
years, there were no differences in passing rates between CMP and non-CMP schools. Student-
level differences were computed on the Texas Learning Index (TLI), a score derived from TAAS
that enables comparisons across grades. The student-level effect on TLI was not significant, and
the effect size was estimated at essentially 0.00. This was true as well for a high-implementing
subgroup.
Another one-year matched post-hoc study of Connected Mathematics was carried out by
Ridgway, Zawojewski, Hoover, & Lambdin (2002; see also Hoover, Zawojewski, & Ridgway,
Effective Programs in Middle and High School Mathematics
The Best Evidence Encyclopedia is a free web site created by the Johns Hopkins University School of Education’s Center for Data-Driven Reform in Education (CDDRE) under funding from the Institute of Education Sciences, U.S. Department of Education.
13
1997). It compared sixth, seventh, and eighth graders in nine schools in various parts of the U.S.
to matched schools, usually in the same districts. Matching was done based on “ability grouping,
urban-suburban-rural designation, and diversity in student population,” but no data comparing
demographic or other variables between CMP and control schools were presented. Further, the
matches were poor, with control schools scoring significantly higher than CMP schools in sixth
grade and CMP schools scoring higher at pretest in eighth grade. Analyses of covariance were
used to attempt to control for the initial differences.
On the Iowa Tests of Basic Skills (ITBS) there were significant differences favoring the
control group in sixth grade, possibly due to insufficient controls for the substantial pretest
differences. There were no significant differences among seventh and eighth graders. Effect sizes
across the three grades averaged near zero (ES=+0.02). On average, differences were near zero
for all subtests of the ITBS (computations, problem solving, data, concepts, and estimation).
A large matched post-hoc evaluation of Connected Mathematics was reported by Kramer
Cai, and Merlino (2008). They identified 10 middle schools in 5 Pennsylvania and New Jersey
districts that used Connected Mathematics from 1998 to 2005, and identified an average of 6
comparison schools for each (control N=60 schools). The schools were well matched based on
1998 state test scores and demographics. At posttest, in 2005, the Connected Mathematics
scored less well than controls, in gains per year on state math tests (ES=-0.46). Schools in which
principals and teachers strongly supported the program had better performance gains than those
lacking such support.
In a matched post-hoc comparison, Reys, Reys, Lapan, Holliday, & Wasman (2003)
evaluated Connected Mathematics in a middle class suburban middle school in Missouri. Eighth
graders who had used Connected Mathematics for three years were compared on the Missouri
Assessment of Performance (MAP) and Terra Nova. Eighth grade scores on the same tests in the
same schools were used for matching purposes, and very close matches were found. At posttest,
students who had experienced Connected Mathematics scored non-significantly higher than
controls on Terra Nova (ES=+0.10, n.s.) but non-significantly lower on percent scoring
proficient or advanced on MAP (ES=-0.09), for a mean of +0.01.
Across the six qualifying studies of Connected Mathematics, the median effect size was -
0.05, indicating an insignificant effect for standardized tests. On the ITBS, effects of Connected
Mathematics were near zero not just on computations but also on the kinds of outcomes more
emphasized by NCTM Standards: estimation, concepts, problem-solving, and data (Hoover et al.,
1997). Similarly, scores on subtests of the MAP (Reys et al., 2003) did not show positive effects
on subscales more closely aligned with NCTM standards.
Core-Plus Mathematics
Core-Plus Mathematics is a high school four-year integrated mathematics curriculum
funded by NSF that is based on the NCTM (1989) Standards. It emphasizes applications and
mathematical modeling, use of graphing calculators, and small-group collaborative learning
through problem-based investigations (Schoen & Hirsch, 2003).

Effective Programs in Middle and High School Mathematics
The Best Evidence Encyclopedia is a free web site created by the Johns Hopkins University School of Education’s Center for Data-Driven Reform in Education (CDDRE) under funding from the Institute of Education Sciences, U.S. Department of Education.
14
A randomized evaluation of Core-Plus Mathematics was carried out by Tauer (2002) in a
middle-class suburb of Wichita, Kansas. Parents and students signed up to participate in a two-
year pilot study in grades 9 and 10. Students were randomly assigned to experience either Core-
Plus Mathematics or the traditional Heath McDougal Littell Algebra I and Geometry textbooks.
Sixty students in the experimental group were individually matched with sixty students in the
control group. Two years later, 43 matched pairs remained. Pretest scores on the Kansas State
Mathematics Assessment (KSA-Math) were essentially identical for the experimental and control
groups. At posttest, Core-Plus Mathematics students scored slightly higher than control on KSA-
Math (ES=+0.05). There were no differences on a Knowledge subscale (ES=0.00), but there
were slightly larger differences in Applications (ES=+0.07). Core-Plus Mathematics students
had a higher likelihood of performing at “proficient” or better on the KSA-Math, 58.2% vs. 46.5%.
Schoen & Hirsch (2003) reported several evaluations of Core-Plus Mathematics, three of
which met the standards of this review. In Study 1, ninth graders in a middle-class suburban
school in the South who qualified for Pre-algebra or non-honors Algebra were randomly
assigned to Core-Plus Mathematics (N=54) or to a traditional control group (N=44). The two
groups were well-matched on ITBS. After three years in the Core-Plus Mathematics Course 1,
Course 2, and (in most cases) Course 3 programs, SAT Math scores non-significantly favored the
Core-Plus Mathematics group (ES=+0.28, n.s.).
In a similar Study 2, ninth graders in a Midwestern city with a mixed socioeconomic
population who qualified for remedial mathematics through algebra were randomly assigned to
Core-Plus Mathematics or control conditions. Those in the Core-Plus Mathematics group took
Course 1 in ninth grade and Course 2 in tenth, and some took Course 3 in eleventh grade. The
groups were well matched on CAT in sixth grade, and on ACTs taken in the 11th
or 12th
grades,
there were no significant differences (ES=+0.05, n.s.).
Study 3 evaluated Core-Plus Mathematics within 11 schools in various parts of the U.S.
Each school using Core-Plus Mathematics in some but not all classes was asked to designate a
control group, and ninth grades within each school (N=525 in each group) were individually
matched on fall ITED Ability to Do Quantitative Thinking (ITED-ADQT) scores. At the end of
Course 1 in ninth grade, the Core-Plus Mathematics students scored significantly higher on
spring ITED-ADQT scores (ES=+0.19, p<.001). A subset of these students (N=195 in each
group) at the end of Course 2 (tenth grade) showed no differences in scores on spring ITED-
ADQT, adjusting for pretest differences (ES=+0.04, n.s.).
Nelson (2005) carried out a post-hoc evaluation of Core-Plus Mathematics in 22
Washington State high schools that had used the program for at least two years. These schools
were matched with 22 control schools on ninth-grade ITED-Quantitative scores, percent free
lunch, percent minority, and school enrollment. The two groups were very well matched. At
posttest, tenth graders in the Core-Plus Mathematics schools passed the Washington Assessment
of Student Learning (WASL) Mathematics scale at a significantly higher rate (61.2% vs. 55.7%
passing), with an effect size of +0.11. This difference was statistically significant (p=.025) in
school-level analyses. Effects were similar for low-income and other students.
Across five studies, the weighted mean effect size was +0.11, indicating modest effects
on mostly standardized tests of mathematics.
Effective Programs in Middle and High School Mathematics
The Best Evidence Encyclopedia is a free web site created by the Johns Hopkins University School of Education’s Center for Data-Driven Reform in Education (CDDRE) under funding from the Institute of Education Sciences, U.S. Department of Education.
15
Mathematics in Context
Mathematics in Context is a NSF-funded program that, like other such programs, has a
strong emphasis on problem solving, multiple solutions, and NCTM (1989) standards. The only
qualifying study of Mathematics in Context was a seven-year matched post-hoc evaluation by
Kramer Cai, & Merlino (2008). In it, middle schools in Pennsylvania and New Jersey that had
used Mathematics in Context from 1998 to 2005 were carefully matched based on 1998 scores
and demographics with schools not using innovative curricula. Each of 8 schools in 4 mostly
White, middle class districts was matched with an average of 6 similar schools in other districts
for a total of 48 control schools. The schools were compared in terms of gains per year on state
tests. There were no differences overall (ES=-0.02), but schools with principals and teachers
who strongly supported the programs had positive effects while schools with poor support for the
program performed less well than controls.
Math Thematics
Math Thematics (Billstein & Williamson, 1999) is another NSF-funded program based on
the NCTM (1989) Standards. It was evaluated in a matched post-hoc study by Reys, Reys,
Lapan, Holliday, & Wasman (2003). Middle schools in two middle-class districts using Math
Thematics were compared to matched middle schools in two different districts. Eighth graders
were compared on the MAP and the Terra Nova. The schools were well matched on those
measures two years earlier, before Math Thematics was in use. At posttest, District 1 students
using Math Thematics scored significantly higher than controls on Terra Nova (ES=+0.25,
p<.005) and on percent of student scoring proficient or advanced on MAP (ES=+0.18, p<.02). In
District 2, Terra Nova differences were significant (ES=+0.24, p<.01) but MAP differences were
not (ES=+0.03, n.s.). The overall effect size across both districts and both measures was +0.18.
SIMMS Integrated Mathematics
The Systemic Initiative for Montana Mathematics and Science Integrated Mathematics
(SIMMS-IM) program is an NSF-funded curriculum developed as part of a State Systemic
Initiative. It uses an integrated approach to mathematics across grades 9-12 that emphasizes
problem-solving, applications, technology, and accommodations to individual learning styles.
Lott et al. (2003) reported several evaluations of SIMMS-IM, but only one had pretest
information and therefore met the inclusion criteria. That study took place in El Paso, Texas, in
majority-Hispanic high schools. Ninth graders within eight schools who experienced SIMMS-IM
(N=60) were matched on eighth grade TAAS scores with others who studied Algebra I using
either UCSMP Algebra or a Houghton-Mifflin text (N=65). After one year, there was no
Effective Programs in Middle and High School Mathematics
The Best Evidence Encyclopedia is a free web site created by the Johns Hopkins University School of Education’s Center for Data-Driven Reform in Education (CDDRE) under funding from the Institute of Education Sciences, U.S. Department of Education.
16
significant difference on PSAT-M, although adjusted differences favored the control group
(ES=-0.42, n.s.).
Integrated Mathematics
McCaffrey, Hamilton, Stecher, Klein, Bugliari, & Robyn (2001) studied the effects of
integrated mathematics in a large urban district that was the recipient of an Urban Systemic
Initiative grant from NSF. Tenth graders across 26 high schools were the subjects. Students in
the integrated mathematics courses used one of two curricula, the Interactive Mathematics
Program (IMP) or College Preparatory Mathematics (CPM), both of which are inquiry-oriented,
problem based curricula that emphasize conceptual understanding, routine and non-routine
problem solving and cooperative learning. Both integrate topics in mathematics instead of
teaching the traditional sequence of Algebra I, Geometry, and Algebra II. The study authors
considered IMP and CPM so similar that they analyzed them together.
Students selected themselves into traditional or integrated courses in this matched post-
hoc design. In the final analyses there were 733 students in integrated math classes in
comparison to 3976 in the traditional sequence, of which 2703 (68%) were in Geometry, 604
(15%) in Algebra I, and 669 (17%) in Algebra II. On end-of-ninth grade SAT-9 open-ended
tests, integrated math and traditional students were fairly well matched (ES=-0.17), but at
posttest, there were no differences, adjusting for pretests, on the SAT-9 multiple choice scale
(ES=+0.03, n.s.) or the open-ended scale (ES=+0.02, n.s.), for a mean effect size of +0.03.
Interactive Mathematics Program
The Interactive Mathematics Program (IMP) is an NSF-funded curriculum that
emphasizes problem-solving, experimentation, and the teaching of non-traditional topics such as
statistics and probability. Webb (2003) described three studies evaluating IMP, but only part of
one of these met the inclusion criteria of this review. In that study, a post-hoc matched
comparison was used to contrast data obtained from the transcripts of students in a suburban,
ethnically diverse high school in California. Students who scored in the 76th
percentile or higher
on the Comprehensive Test of Basic Skills (CTBS) in 7th
grade were the subjects. Those who had
spent three years in IMP (grades 10-12) (N=48) were compared to students matched on Grade 7
CTBS who did not experience IMP (N=43). SAT scores at posttest, adjusted for pretest
differences, were not significant (ES=-0.09, n.s.). Two additional studies found that students who
participated in IMP scored better on measures of the content studied in IMP but not in traditional
high school courses (e.g., statistics, probability), but as such these measures did not qualify for
inclusion in this review.
Traditional Textbooks
McDougal Littell Middle School Math and Algebra I
Effective Programs in Middle and High School Mathematics
The Best Evidence Encyclopedia is a free web site created by the Johns Hopkins University School of Education’s Center for Data-Driven Reform in Education (CDDRE) under funding from the Institute of Education Sciences, U.S. Department of Education.
17
McDougal Littell is a traditional textbook that is one of the most widely used programs in
middle schools. The publisher contracted with an evaluation company to carry out an evaluation
of their middle school mathematics program (Callow-Heusser, Allred, Robertson, & Sanborn,
2005). Classrooms were non-randomly assigned to use either McDougal Littell or alternative
textbooks in a prospective matched design. Teachers were selected to use the McDougal Littell
program, and then comparison classes in different schools were chosen to match experimental
classes on demographic factors. In the final sample there were nine treatment and eight control
teachers. Experimental and control samples were well matched on demographic factors. On a test
composed of publically-released items from the National Assessment of Educational Progress,
there were no differences in outcomes, controlling for pretests (ES=-0.04).
Prentice Hall Algebra I and Course 2
Prentice Hall Algebra I is a traditional, commercial textbook. The publisher contracted
with a third-party evaluator to do an evaluation of the program (Resendez & Sridharan, 2005). In
the evaluation, 24 teachers within two middle and two high schools in various parts of the U.S.
were randomly assigned to use Prentice Hall Algebra I or any alternative Algebra I program.
Schools were mostly middle class and students were mostly white or Asian. Most students were
in grades 8 or 9. Although teacher-level analyses were carried out, there were too few teachers
for adequate statistical power, so student-level analyses are emphasized here and the study is
considered a randomized quasi-experiment.
Three measures were administered at pretest and posttest: ETS Algebra, Terra Nova
Algebra, and a four-item unstructured-response test based on items from the College Board’s
SAT Practice Test. At posttest, there were no significant differences at the student level on any
of the outcome measures. Effect sizes were +0.05 on Terra Nova Algebra, +0.05 on ETS
Algebra, and -0.22 on the constructed-response test, for a mean ES=-0.04. Patterns were similar
for all subtests and ethnic groups, except that Asian students gained more in the Prentice-Hall
Algebra I classes than in control classes.
A study by the same company evaluated Prentice Hall Course 2, a traditional seventh
grade curriculum that emphasizes proportional reasoning. In this study (Resendez & Azin,
2005b), seven teachers of 18 classes (9T, 9C) in three middle schools in Virginia and Ohio were
randomly assigned to use Prentice-Hall Course 2 or control curricula, also traditional textbooks.
Because the number of teachers was not sufficient for teacher-level analysis, this was considered
a randomized quasi-experiment. The students were seventh graders in high-poverty, urban
schools; 83.4% qualified for free- or reduced-price lunches, and about two thirds were African
American. Experimental and control students were comparable on demographic variables.
Students were pre- and posttested on Terra Nova Math. Some of the pretest differences
favored the treatment group, but these were controlled for in the analyses. At posttest, Prentice
Hall Course 2 students scored substantially higher than control students, controlling for pretests.
Effect sizes were +0.52 for Math Total and +0.57 for Computations, after adjustment for
pretests. In light of the great similarity between the experimental and control curricula in two of
the three schools, these results are difficult to explain. A class-level HLM analysis with only nine
Effective Programs in Middle and High School Mathematics
The Best Evidence Encyclopedia is a free web site created by the Johns Hopkins University School of Education’s Center for Data-Driven Reform in Education (CDDRE) under funding from the Institute of Education Sciences, U.S. Department of Education.
18
experimental and nine control classes showed statistically significant effects on Math Total, but
there were no differences on Math Computations.
Back-to-Basics Textbooks
Saxon Math
Saxon Math is a program that emphasizes teaching in small, incremental steps, ensuring
mastery of each concept before the next is introduced. Previously learned material is practiced
throughout the year. The program emphasizes active teacher instruction followed by individual
student practice.
A prospective matched study in a dissertation by Lafferty (1994) compared two middle
schools in a suburb of Philadelphia. One school (five teachers) used Saxon Math and one (three
teachers) used an Addison-Wesley text. Students were pre-tested in sixth grade on the
Metropolitan Achievement Test (MAT-6) and posttested on the MAT-7. At pretest, the Saxon
students scored somewhat higher, but at posttest they scored significantly higher, with an
adjusted ES of +0.19. Differences were similar for Mathematics Procedures and Mathematics
Concepts and Problem Solving subtests.
In a 1989 dissertation, Denson (1989) compared Saxon Algebra to a traditional text
among Southern California ninth graders, in a prospective matched design. Thirteen ninth-grade
classes (7 Saxon, 6 control) within three high schools were non-randomly assigned to the two
groups. The Comprehensive Assessment Program General Mathematics and Algebra scales were
used as pre- and posttests. Students in the two groups were nearly identical at pretest. At posttest,
the control group scored marginally significantly higher than the Saxon Algebra group (ES=-
0.25, p=.08), controlling for pretests. Patterns of differences were similar for seven subtests and
for high, average, and low achievers, with two exceptions. Control high achievers scored higher
than Saxon high achievers on polynomials and radicals and quadratics subtests, causing the
overall mean (across all three student subgroups) to be significantly higher in the control group
on both subtests.
A prospective matched evaluation of Saxon Math was carried out in a dissertation by
Rentschler (1994) in two rural West Virginia schools. Seventh graders in one school using Saxon
Math were compared to those in a similar school in a different county using Silver Burdett.
Students were pre- and posttested on CTBS. The experimental group scored non-significantly
higher at pretest. At posttest, ANCOVAs found that students who had experienced Saxon Math
scored significantly higher than controls on Mathematics Computations (ES=+0.60, p<.001), but
non-significantly higher on Concepts and Applications (ES=+0.18), for an overall mean effect
size of +0.39.
Under contract to Harcourt, the publisher of Saxon Math, Resendez, Fahmy, & Azin
(2005) carried out a post-hoc evaluation of Saxon Math in Texas middle schools, grades 6-8.
Fifteen middle schools that used Saxon Math were matched with 15 schools randomly selected
from among 40 matched schools provided to the researchers by the Texas Education Agency.
The schools were well matched on prior state test scores, free lunch, ethnicity, and other
Effective Programs in Middle and High School Mathematics
The Best Evidence Encyclopedia is a free web site created by the Johns Hopkins University School of Education’s Center for Data-Driven Reform in Education (CDDRE) under funding from the Institute of Education Sciences, U.S. Department of Education.
19
demographic factors, and were similar to Texas middle schools overall on these factors, with
43% of Saxon and 48% of control schools qualifying for free lunch. Control schools used a
variety of traditional curricula.
Among students who had three years of exposure to Saxon Math in grades 6-8, Texas
Learning Index (TLI) scores were significantly higher than for control students (ES=+0.26,
p<.001), using ANCOVAs controlling for pretests and percent disadvantaged. Differences were
very similar at the end of sixth, seventh, and eighth grades, and two-year and one-year effect
sizes were +0.25 and +0.17, respectively, indicating that there was little incremental gain for
Saxon Math students after the first year, beyond what was seen in the control group. Separate
analyses of the three-year gains found significantly greater performance among Saxon Math
students who were economically disadvantaged, minorities, at-risk, and in special education.
Effects by TAKS subscales were assessed separately for each grade, and differences consistently
favored Saxon Math on each of six subscales in seventh and eighth grades and on four of the six
subscales in sixth grade.
Another post-hoc study also done under contract to Harcourt evaluated Saxon Math in
Georgia middle schools (Resendez & Azin, 2005c). That study included an evaluation of Saxon
Math in elementary schools, which found no difference between students in Saxon Math and
control students at that level (see Slavin & Lake, 2006). The middle school part of the evaluation
compared 17 schools that used Saxon Math in sixth grade to 15 control schools, and 16 Saxon
and 12 control schools in seventh and eighth grades. State CRCT data analyzed at the school
level showed no statistically significant differences, but means tended to favor the Saxon Math
middle school students. Individual-level effect sizes, estimated from the aggregate statistics
given in the paper, were +0.07 for the total CRCT.
A smaller post-hoc evaluation of Saxon Math was carried out in a dissertation by Roberts
(1994). A total of 185 eighth graders in six schools in two rural Mississippi districts were
compared. Students in one district had experienced Saxon Math for three years, and those in the
other, in a different county, had used a traditional text. The two groups were well matched on
sixth grade scores, although the Saxon Math schools were somewhat higher in percent African
American (33% vs. 29%). The SAT-8 was used as a pre- and posttest, and Otis-Lennon School
Ability Tests were also used as covariates. Results indicated higher gains on the SAT for
students in the control group than for those in the Saxon Math group (ES=-0.13). These
differences were statistically significant on a Math Computation subtest, but not on Concepts,
Applications, or Total Math, although differences favored the control group on all subtests.
Saxon Algebra
A small year-long evaluation by Peters (1992) randomly assigned 36 eighth graders to
experience Saxon Algebra or the University of Chicago School Mathematics Project (UCSMP) in
a year-long study in a Nebraska junior high school. The subjects were mathematically talented
students. The Orleans-Hanna Prognosis Test was used as a pre- and post measure. The two
groups were very similar at pretest. At posttest, scores were not significantly different, with an
effect size of +0.15.

Effective Programs in Middle and High School Mathematics
The Best Evidence Encyclopedia is a free web site created by the Johns Hopkins University School of Education’s Center for Data-Driven Reform in Education (CDDRE) under funding from the Institute of Education Sciences, U.S. Department of Education.
20
Pierce (1984) evaluated Saxon Algebra in a suburban middle-class high school near Tulsa,
Oklahoma. Ninth graders in Algebra I were non-randomly assigned by scheduling computer to
sections and then sections were randomly assigned to Saxon Algebra or control conditions within
teachers. Teachers taught either two or four sections in the study, so each taught an equal number
of experimental and control classes. Then six classes were randomly selected from among the set
of 18 for measurement. Because there were too few sections for HLM analyses, this is considered a
randomized quasi-experiment.
The groups were compared on the end-of-year Lankton First-Year Algebra Test, in
analyses of covariance controlling for SRA math scores given before the experiment. Pretest
scores were very similar. There were no significant differences in posttests, controlling for
pretests. Adjusted posttest effect sizes slightly favored the Saxon Algebra classes (ES=+0.12).
Effects were non-significant and near zero in each of ten subjects, but the exception was graphic
representation, on which the Saxon students significantly outperformed controls. Graphing is a
particular focus of the Saxon method.
A dissertation by Abrams (1989) compared Saxon Algebra to control textbooks in two
middle-class Colorado districts, in a prospective matched design. Nine teachers in three high
schools participated, each teaching either Saxon or control classes (only one taught both).
Collectively, they taught 18 classes, of which nine were in each condition. Most students were
ninth graders. Students were pre- and posttested on the Cooperative Mathematics Test-
Arithmetic scale and Mathematics Problem Solving Part I—Understanding the Problem. The two
groups were very similar at pretest.
The data were analyzed using teachers as both fixed and random factors. The fixed
effects model (similar to student-level analysis) found that the control group scored significantly
higher than those in the Saxon group (ES=-0.44). The differences were not significant in the
random-effects (teacher-level) analysis, due to the small number of teachers. Outcomes varied
somewhat on different subtests, but adjusted posttests always favored the control group, though
to different degrees.
Johnson & Smith (1987) evaluated Saxon Algebra in a one-year prospective matched
study in an Oklahoma high school. Twelve classes were non-randomly assigned such that each
of six teachers taught one class using Saxon Algebra and one using a traditional textbook.
Students in grades 8-10 were pretested on the SRA Mathematics Composite test in spring, 1984,
and posttested on the Comprehensive Assessment Program Algebra I test in spring, 1985. At
pretest, the students were reasonably well matched, and averaged above the 73rd
percentile. At
posttest, in MANCOVAs adjusting for pretests, there were no significant differences (ES=-.02).
Across seven subtests there were no significant differences on six, but the control group scored
significantly higher on Definitions and Theory.
A follow-up of the Johnson & Smith (1987) sample in a dissertation supervised by
Johnson was carried out by Lawrence (1992), examining routine tests taken by the participants as
they moved through high school. Seventeen months after the end of the original one-year study
there were no differences, controlling for pretests, on Preliminary Scholastic Aptitude Test math
scores. Twenty-two months later there were no differences on MAT-6 or SRA-Math scores.
Thirty-four months later there were still no differences on MAT-6 or the American College Testing
Effective Programs in Middle and High School Mathematics
The Best Evidence Encyclopedia is a free web site created by the Johns Hopkins University School of Education’s Center for Data-Driven Reform in Education (CDDRE) under funding from the Institute of Education Sciences, U.S. Department of Education.
21
(ACT) Mathematics test, but there were significant differences on the algebra subtest of ACT-
Mathematics, favoring the control group.
McBee (1982) compared Saxon Math to a traditional textbook in seven Oklahoma City
high schools. In each school, one Algebra I teacher was asked to teach one section of Saxon
Math and one of the traditional text. Assignment was nonrandom, but the groups were well
matched on the California Achievement Test (CAT). On CAT posttests, Saxon Math students
performed significantly higher than control students (ES=+0.17). Saxon Math students also
scored substantially better than control students on a local test, but effect sizes could not be
determined.
Across 11 qualifying evaluations of Saxon Math and Saxon Algebra, the weighted mean
effect size was +0.14, a modest effect. The What Works Clearinghouse gave Saxon Math its
highest rating, “positive effects,” based on six studies involving grades 6-9. However, this rating
depended substantially on a study by White (1986), which did not qualify for the present review
because it used a teacher-made test that may have been slanted toward the objectives emphasized
in Saxon Math. Also, the White study did not qualify for the present review because it involved
only 46 students assigned by a scheduling computer to two sections taught by the study’s author.
Conclusions: Mathematics Curricula
Taken together, there were 46 qualifying studies evaluating various mathematics
curricula, with a median effect size of only +0.03. This is less than the effect size of +0.10 for
elementary mathematics curricula reported by Slavin & Lake (in press). There were eight
randomized and randomized quasi-experimental studies, also with a weighted mean effect size of
+0.03. Effect sizes were somewhat higher for the Saxon textbooks (weighted mean ES=+0.14 in
11 studies) than for the NSF-supported textbooks (median ES=0.00 in 24 studies). However, the
NSF programs add objectives not covered in traditional texts, so to the degree those objectives
are seen as valuable, these programs are adding impacts not registered on the assessments of
content covered in all treatments (see Confrey, 2006; Schoenfeld, 2006). Among three studies of
traditional math curricula, one (of Prentice Hall Course 2) found substantial positive effects, but two
found no differences.
Computer Assisted Instruction
Computer assisted instruction (CAI) is one of the most common approaches intended to
enhance the achievement of students in middle and high schools. In their review of research on
elementary math programs, Slavin & Lake (2006) found 38 qualifying evaluations of CAI
programs, which had an overall median effect size of +0.19. However, the studies that used
randomized or randomized quasi-experimental designs (e.g., Becker, 1994; Dynarski et al.,
2007), as well as the studies involving 250 students or more, tended to find few effects of CAI.
At the middle and high school levels there are three quite different applications of CAI.
One involves supplemental CAI programs, such as Jostens/Compass Learning, in which students
work on computers perhaps 10-15 minutes per day, primarily to fill in gaps in their prior

Effective Programs in Middle and High School Mathematics
The Best Evidence Encyclopedia is a free web site created by the Johns Hopkins University School of Education’s Center for Data-Driven Reform in Education (CDDRE) under funding from the Institute of Education Sciences, U.S. Department of Education.
22
knowledge. These approaches are similar to those evaluated at the elementary level. A second
approach, more common in middle and high schools, involves core CAI approaches in which the
computer largely replaces the teacher, providing core instruction, opportunities for practice,
assessment, and prescription, all tailored to the needs of each student. Examples are I Can Learn,
Cognitive Tutor, and Plato. The teacher’s role in those programs is to circulate among students,
provide encouragement, and answer questions, but not to provide extensive direct instruction.
The third approach, computer-managed learning systems, uses a computer to assess students,
print out individualized assignments, score the assignments, and provide feedback to teachers on
students’ progress for use in their class lessons. This category consists of one program,
Accelerated Math.
Qualifying studies evaluating CAI programs are summarized in Table 2.
==============
TABLE 2 HERE
==============
Core CAI
Cognitive Tutor
Cognitive Tutor, also known as Carnegie Algebra Tutor and as the Pittsburgh Urban
Mathematics Project (PUMP), is an intelligent tutoring system that emphasizes algebra problem
solving. Working on computers, students carry out investigations of real-world problems using
spreadsheets, graphers, and symbolic calculators. For example, students are given the harvest
rate of old growth forests in the U.S. and use algebraic notation to predict when they would be
gone. Other problems involve choosing between long-distance providers, estimating the cost of a
rental car, and checking the amount of a paycheck. The computer gives students hints and
provides scaffolding if students make errors. The computerized lessons occupy only about 40%
of their class time during the school year. Between these lessons, students work in cooperative
teams to solve problems similar to those presented by the computer, and teachers teach other
Algebra I content.
In a large randomized quasi-experiment in Maui, Hawaii, Cabalo & Vu (2007) evaluated
Cognitive Tutor among students in grades 8-13. Seven teachers in 6 schools each had their
classes randomly assigned to Cognitive Tutor or control conditions by coin flip, so each teacher
taught both experimental and control classes. There were a total of 11 classes and 281 students
assigned to the Cognitive Tutor group and 11 classes and 260 students to control. About 55% of
the students were Asian, 26% multi-racial, 14% White, and 4% Hispanic, evenly distributed
across conditions. Students were pretested on the NWEA Math Goals Survey 6+, a standardized
test. On adjusted NWEA end-of-course algebra tests, there were no differences in overall scores
(ES=+0.03, n.s.). Effects varied somewhat by subtest. On Quadratic Equations, the control group
scored significantly higher than the Cognitive Tutor group (ES= -0.33, p<.01), and similar
Effective Programs in Middle and High School Mathematics
The Best Evidence Encyclopedia is a free web site created by the Johns Hopkins University School of Education’s Center for Data-Driven Reform in Education (CDDRE) under funding from the Institute of Education Sciences, U.S. Department of Education.
23
outcomes were seen on Algebraic Operations (ES= -0.25, p<.01). There were no differences on
Linear Equations (ES= -0.04, n.s.) or on Problem Solving (ES= +0.02, n.s.).
An evaluation of Cognitive Tutor by Morgan & Ritter (2002) took place in four junior
high schools in Moore, Oklahoma. Ninth grade students were non-randomly assigned to sections,
and then sections were randomly assigned to learn Algebra I either with Cognitive Tutor or with
a McDougal Littell Heath Algebra I text. The outcome measure was the ETS Algebra I end-of-
course test. The evaluation was described by its authors as a random assignment experiment, but
this is only partially true. First, students were non-randomly assigned to classes. Then sections
were intended to be randomly assigned within teacher, but for a variety of reasons the sample for
which achievement comparisons were made contained five (of 12) non-randomly assigned
control classes. No pretests were given, so any deviations from true random assignment were
particularly problematic, as they leave open the possibility that there were pretest differences that
may have affected the final results.
A subanalysis presented in the paper offers the only interpretable data. This analysis
compares the scores of the twelve classes (6E, 6C) that were randomly assigned within teacher.
Because the classes were randomly assigned, it can be assumed that the classes were not too far
apart, on average, at pretest. However, this is a randomized quasi-experiment, with analysis
necessarily at the student level due to the limited number of classes. For this subsample, effect
sizes were estimated at +0.32, similar to the estimate of +0.29 reported by the study authors for
the full sample of 15 Cognitive Tutor and 12 control classes.
Shneyderman (2001) evaluated Cognitive Tutor-Algebra I in six Miami high schools.
Students were in grades 9 and 10. Two classes using Cognitive Tutor and two matched classes in
the same schools using traditional textbook programs were compared. The groups were
essentially equivalent on FCAT pretests. On ETS Algebra I End-of-Course assessments, used at
posttest, students in the Cognitive Tutor classes scored significantly higher (ES=+0.22, p<.01).
Effects were more positive for boys than for girls. However, on FCAT-NRT posttests, there were
no significant differences (ES=+0.02), for a mean effect size of +0.12.
A matched study by Koedinger, Anderson, Hadley, & Mark (1997) evaluated Cognitive
Tutor in three Pittsburgh high schools, in which 50% of students were African American. Twelve
ninth grade Algebra I classes using Cognitive Tutor were compared to five comparison classes.
Students were well matched on prior year grades. At posttest, students in the Cognitive Tutor
classes scored significantly higher than controls on the Iowa Algebra Aptitude Test (ES=+0.35,
p<.05).
In a 2001 dissertation, Smith (2001) evaluated Cognitive Tutor in seven high schools in
urban Virginia. Students were those who had completed pre-algebra the previous year, and were
generally low achievers who took a three-semester course (higher achievers took the course in
two semesters). Students’ scores on the Virginia Standards of Learning (SOL) Algebra I test
were used as outcome variables, with SAT-9 pretest scores serving as covariates. Classes using
Cognitive Tutor were compared to those using a traditional textbook program. Students were
assigned to classes by a computerized scheduling program, which does not ensure equivalence,
but experimental and control classes were well matched on the SAT-9. One problem with the
study is that there was substantial attrition from pre- to posttest, but the attrition was similar in
Effective Programs in Middle and High School Mathematics
The Best Evidence Encyclopedia is a free web site created by the Johns Hopkins University School of Education’s Center for Data-Driven Reform in Education (CDDRE) under funding from the Institute of Education Sciences, U.S. Department of Education.
24
experimental and control groups. At posttest, an analysis of covariance found no difference between
experimental and control groups. Students in the control group scored slightly better than those
taught with Cognitive Tutor, after adjustment for pretests (ES=-0.07).
Corbett (2001) evaluated Cognitive Tutor with seventh graders in two suburban middle
schools near Pittsburgh. Students were non-randomly assigned within schools to Cognitive Tutor
or traditional control conditions. Students were pre- and posttested on a multiple-choice test
comprised of released questions from the Pennsylvania PSSA, TIMSS, and NAEP. There were
no significant differences in analyses of covariance in either school (ES=+0.01, n.s.).
In a similar study in the same schools the following year, Corbett (2002) compared eighth
and ninth graders in Cognitive Tutor to those in traditional classes. On a multiple-choice test
using items from PSSA, TIMSS, and NAEP, there were once again no significant differences
(ES=+0.19, n.s.)
Across seven studies of Cognitive Tutor, the weighted mean effect size was +0.12. The
two randomized quasi-experiments by Cabalo & Vu (2007) and Morgan & Ritter (2002) had a
weighted mean effect size of +0.17.
I Can Learn
I Can Learn (ICL) is a program for middle school mathematics that delivers core lessons
through interactive, multimedia software. Students work at their own pace through a series of
lessons that include text, video, graphics, and audio. Students are assessed and placed initially in
a sequence of lessons, and are then assessed as they complete units. The classroom teacher’s role
in the program is to circulate among the students and answer questions, re-teach difficult
material, and otherwise support the computerized lessons, not to provide class lessons.
Kirby (2004a) evaluated I Can Learn in a small randomized study. Eighth graders in a
school in Hayward, California were randomly assigned to ICL or traditionally-taught general
mathematics classes. On California Standards Tests (CST), controlling for CST pretests, there
were no significant differences (ES=+0.04, n.s.).
Kerstyn (2002) evaluated I Can Learn in Tampa, Florida, following up on an earlier
study, Kerstyn (2001), reported below. In this study, a larger number of eighth grade classes
(N=129) using I Can Learn were compared to the rest of the students in the district within each
of the four math levels (Algebra I, Algebra I Honors, MJ-3, and MJ-3 Advanced). FCAT scores
were used as pre- and posttests. Hierarchical linear modeling (HLM) was used, but fixed rather
than random effects were reported, making the analysis essentially equivalent to an individual-
level ANCOVA. In any case, differences were small and non-significant for Algebra I
(ES=+0.05), Algebra I Honors (ES=-0.05), and MJ-3 Advanced (ES=+0.03). In all three
analyses, there were pretest differences favoring the control group. The weighted mean effect
size across the four groups was +0.04.
Brooks (1999) evaluated ICL in Algebra I classes for grades 7-10 in Jefferson Parish,
Louisiana. A total of 102 ICL classes were compared to 67 traditional classes on a textbook
Effective Programs in Middle and High School Mathematics
The Best Evidence Encyclopedia is a free web site created by the Johns Hopkins University School of Education’s Center for Data-Driven Reform in Education (CDDRE) under funding from the Institute of Education Sciences, U.S. Department of Education.
25
Algebra I achievement test. Adjusting for pretests, there were no differences in scores at posttest
(ES=-0.04, n.s.).
Kerstyn (2001) carried out an evaluation of I Can Learn among eighth graders in Tampa,
Florida middle schools. Intact classes (N=59 pairs) using I Can Learn were matched with
traditionally-taught classes on instructional time, prior achievement, class size, and proportion of
minority students. Four levels of math were studied: Algebra I (8 matched pairs), Algebra I
Honors (8 pairs), MJ-3 (pre-algebra) (33 pairs), and MJ-3 Advanced (10 pairs).
Although district tests were also used, the main outcome of interest that was consistent
across all levels was the Florida Comprehensive Assessment Test (FCAT), given in February.
FCAT scores from the previous year were used as covariates in analyses of covariance. I Can
Learn and control students were well-matched at pretest in all four levels. At posttest, the I Can
Learn classes consistently scored higher, but none of the differences were statistically
significant, analyzed at the classroom level. Student-level effect sizes were +0.27 for Algebra I,
+0.01 for Algebra I Honors, +0.06 for MJ-3, and +0.07 for MJ-3 Advanced, for a weighted
average of +0.08. District end-of-semester scores were similar, with I Can Learn classes scoring
non-significantly higher than controls.
In a study in Collier County, Florida, Kirby (2004c) compared students in Algebra I
classes using ICL to those in matched control groups on the FCAT. Controlling for pretests, the
ICL students scored higher (ES=+0.18, p<.02).
A post-hoc matched evaluation of ICL took place in the New Orleans Public Schools
(Kirby, 2006a). Within 13 schools, students in ICL were matched with students in traditional
classes in a semester-long experiment. The author described the study as randomized, because
students were assigned to classes by scheduling computer, and the What Works Clearinghouse
(2007) accepted it as such. However, use of a scheduling computer does not ensure
randomization or initial equality. In this case, pretest differences were +0.11 on ITBS (p<.05) on
Math Total, a difference that would be unlikely if such a large number of students (N=1360)
were truly assigned at random. After accounting for pretest differences, the ICL students scored
modestly but significantly higher than controls (ES=+0.19, p<.001).
Kirby (2006b) evaluated I Can Learn in a post-hoc matched study involving low-
achieving tenth graders in high-poverty high schools in New Orleans. Students using I Can
Learn (N=166) were compared to students in matched classes in the same schools using
traditional methods (N=978). I Can Learn students scored significantly lower than controls on
ITBS pretests but one semester later, LEAP posttests showed no difference, yielding an adjusted
posttest of ES=+0.23, p<.001.
A small post-hoc evaluation by Oescher & Kirby (2004) compared ninth graders taught
using ICL or control methods in a Dallas high school. On the TAKS, adjusting for pretests, ICL
students scored significantly higher (ES=+0.40, p<.001).
Across eight studies, the weighted mean effect size for I Can Learn was +0.09.
Learning Logic Lab

Effective Programs in Middle and High School Mathematics
The Best Evidence Encyclopedia is a free web site created by the Johns Hopkins University School of Education’s Center for Data-Driven Reform in Education (CDDRE) under funding from the Institute of Education Sciences, U.S. Department of Education.
26
Learning Logic Lab is a self-paced mastery learning computerized program used as a
core approach to mathematics. McKenzie (1999) evaluated the program in a southern Georgia
high school. The school used a block schedule in which students studied Algebra I 100 minutes
per day for 3 ½ months, the equivalent of a year’s instruction. Students in two Learning Logic
Lab classes were compared to those in two classes using traditional methods. The final test from
the Merrill Algebra I: Applications and Connections test was used as a pre- and posttest. Pretest
means favored the control group, but controlling for these differences with analyses of covariance,
the control group gained substantially more than the treatment group (ES=-0.78, p<.001). Effects
were similar for male and female students.
The Expert Mathematician
The Expert Mathematician is a program in which middle school students are taught to use
the LOGO programming language and proceed through a constructivist, integrated series of
computer and workbook activities emphasizing problem solving and creativity. A small study
evaluating The Expert Mathematician was carried out in a dissertation by Baker (1997) in a
suburban St. Louis middle school. Initially, 90 eighth graders were assigned to use The Expert
Mathematician (2 classes) or the UCSMP Transitions program, designated as the control group
(2 classes). Although the assignment was described as random, the study is treated as matched
because of its use of a scheduling computer, not true random assignment. Also, there were
substantial pretest differences (ES=-0.46, p<.05) on the Math Concepts and Applications scale of
a test called Objectives by Strands, described as a “practice test developed by a large urban
district.” At posttest, adjusting for pretests, there were non-significant differences favoring the
experimental students (ES=+0.38, n.s.).
Supplemental CAI
Jostens/Compass Learning
One of the most widely used and evaluated supplementary CAI programs was originally
called Jostens, and is now called Compass Learning. Like all integrated learning system (ILS)
programs, Jostens/Compass Learning provides an extensive set of assessments, which place
students according to their current levels of performance and then give students exercises
designed primarily to fill in gaps in their skills. ILS models also provide teachers with regular
information on students’ levels of performance. They are typically used for 15-30 minutes per
day, often 2-3 days per week.
Hunter (1994) evaluated Jostens in grades 2-8 in rural Jefferson County, Georgia. The
part of the evaluation involving grades 6-8 is described here. Chapter 1 students who received
30-minute daily sessions with Jostens for 28 weeks were compared to those who did not receive
CAI, in a prospective matched design. Three experimental and three control schools were
compared. Fifteen students at each grade level were randomly selected for measurement. Effect
sizes were estimated at +0.37 for sixth grade, -0.04 for seventh grade, and +0.34 for eighth
grade, for a mean of +0.22.
Effective Programs in Middle and High School Mathematics
The Best Evidence Encyclopedia is a free web site created by the Johns Hopkins University School of Education’s Center for Data-Driven Reform in Education (CDDRE) under funding from the Institute of Education Sciences, U.S. Department of Education.
27
New Century Integrated Instructional System
The New Century Integrated Instructional System is an integrated learning system that
uses individualized instruction along with animation and graphics. A study commissioned by the
publisher (Boster, Yun, Strom, & Boster, 2005) evaluated the program among seventh graders
performing one to two years below grade level in a suburban Sacramento County school district.
Thirty-nine percent of students qualified for free or reduced-price lunches, and 18% of students
came from homes in which Spanish was the primary language. Students were randomly assigned
to conditions within six junior high schools. However, significant numbers of experimental
students were excluded from the analysis because they did not complete enough computer
activities. Due to this systematic removal of students from one group, the design was considered
matched rather than randomized. Students in the New Century group (n=139) were expected to
use the computers 90 minutes per week, while those in the control group (n=167) did not use
computers. On CST posttests, adjusted for pretests, the New Century students scored
significantly higher (ES=+0.28, p<.004).
Plato Web Learning Network
The Plato Web Learning Network is an integrated learning system that has been
evaluated as a remedial program. In an 18-week study of African-American students in inner-city
Miami high schools, Thayer (1992) evaluated use of Plato and another program called CSR.
Students were those who had scored in the first or second stanines on the SAT, and were in a
remedial math course. Those in the experimental group were given one hour per week of Plato,
CSR, or both. Each of seven teachers in two schools taught at least one CAI and at least one
control class. On the State Student Assessment Test, there were no significant differences at
posttest controlling for pretests (ES=+0.21, n.s.).
In a small, matched comparison, Baker (2005) evaluated use of the Plato Web Learning
Network in remedial algebra classes in Aldine, Texas. Students (N=59) using Plato were
compared to matched students (N=63) in a traditional teacher-centered classroom. Adjusting for
pretests, the Plato students scored non-significantly higher on a district benchmark assessment
(ES=+0.29, n.s.).
SRA Drill & Instruction
Dellario (1987) studied the use of SRA drill and instruction software among low-
achieving ninth graders in high schools in Southwestern Michigan. Students with stanine scores
of 1-3 in one school using CAI in reading and math were compared to those in two other schools.
The samples were well matched in demographics. Growth scores on the Stanford Diagnostic
Effective Programs in Middle and High School Mathematics
The Best Evidence Encyclopedia is a free web site created by the Johns Hopkins University School of Education’s Center for Data-Driven Reform in Education (CDDRE) under funding from the Institute of Education Sciences, U.S. Department of Education.
28
Mathematics Test (SDMT) were significantly higher for the CAI students than for controls
(ES=+0.36).
Other Supplemental CAI
Several studies evaluated earlier forms of CAI that no longer exist, or the use of multiple
programs or of CAI in general rather than any particular program. These studies are nevertheless
useful in understanding overall impacts of CAI, even if they do not relate to today’s
commercially available applications.
Becker (1990) carried out a large evaluation of the use of CAI in middle schools, grades
5-8. Fifty schools around the U.S. were recruited. In each, teachers were asked to designate
similar classes, one of which would use any of a variety of CAI software (mostly Milliken Math)
and one of which would serve as a control group. Schools agreed to use CAI at least 30 hours
over the course of the school year, although not all schools did so. In 24 of these schools, the
researcher was able to randomly assign students to CAI or control classes. Students were pre-
and posttested on the Stanford Achievement Test, which was adjusted for whatever pretests were
available and transformed into z-scores. For the 24 researcher-randomized schools, there were no
significant differences (adjusted ES=+0.06 for Computations, +0.08 for Applications, +0.07
overall). These outcomes were similar to those for all 50 pairs in the study (ES=+0.04 overall)
and for 20 “most faithful implementations” (ES=+0.05).
Moore (1988) evaluated Milliken Mathematics in grade 7-8 classes for very low
achieving students, half of whom were in special education. Students (N=117) were randomly
assigned to four classes, two of which used CAI plus a non-CAI individualized approach and two
of which used a textbook program. Students were well matched at pretest. At posttest, CAI
students scored marginally significantly higher (p=.063) on a district math placement test,
controlling for pretests (ES=+0.24).
Bailey (1991) carried out a small randomized evaluation in a Hampton, Virginia high
school. Low-achieving Math 9 students (N=46) were randomly assigned to receive a variety of
supplemental computer lessons or to continue without CAI. Students were randomly assigned to
two CAI or two control teachers. At posttest, controlling for pretests, the CAI group scored
substantially higher on ITBS (ES=+0.69).
Hoffman (1971) studied the effects of giving second-year algebra students opportunities
to learn and apply BASIC computer programming. Students in two Denver-area high schools
were non-randomly assigned to experimental and control classes within schools, and two classes
at each school were randomly assigned to conditions, making this a randomized quasi-
experiment. Scores on the Cooperative Mathematics Test, Algebra II, were not different at
posttest, controlling for pretest scores (ES=+0.11, n.s.).
In a 13-week experimental in a Knoxville, Tennessee high school, Davidson (1985)
studied the use of CAI with low-achieving Chapter 1 students. Five classes serving grades 9-12
were randomly assigned to CAI or control conditions, which were identical except for the use of
the computers. A variety of software chosen by the teachers was used in the CAI groups.

Effective Programs in Middle and High School Mathematics
The Best Evidence Encyclopedia is a free web site created by the Johns Hopkins University School of Education’s Center for Data-Driven Reform in Education (CDDRE) under funding from the Institute of Education Sciences, U.S. Department of Education.
29
Students were pre- and posttested on the Metropolitan Mathematics Instructional Test. On
analyses of covariance, there were no significant differences (ES=+0.16, n.s.).
Portis (1991) evaluated an application of CAI in an integrated, low to middle SES junior
high school in Charlotte, North Carolina. Eighth and ninth graders took Algebra I in classes in
which there were 30 computers and Wasatch software. Teachers had the option of assigning all
students to work on the computers, to work with small groups and assign the remainder to work
on the computers, or to teach the whole class without computers. The comparison classes were
students who had taken Algebra I the previous year in the same school. On a state end-of-course
Algebra I test, controlling for CAT pretests, CAI students scored significantly higher (ES=+0.91,
p<.001). There was an interaction with grade level, such that the differences favoring CAI were
greater in the ninth grade than in the eighth, but there were no interactions with gender or race.
Chiang (1978) evaluated the outcomes of an authoring system designed to help teachers
create their own CAI lessons. Special education students in matched CAI and control classes in
four junior high schools were compared in terms of gains on the Key Math Diagnostic
Arithmetic test. The mean effect size was +0.19.
Saunders (1978) evaluated the provision of 25 minutes per week of computer resource
materials (called the Computer Resource Book) to students in second-year Algebra. Students in
grades 10-12 in a suburb of Pittsburgh were assigned to CAI (2 classes) or control (2 classes). On
the Cooperative Mathematics Tests-Algebra II, controlling for pretests, there were no significant
differences (ES=+0.14, n.s.).
An early CAI study by Jhin (1971) compared Algebra II students in an Auburn, Alabama
high school taught traditionally or with supplemental CAI. Two matched classes were compared
at pre- and posttest on the Cooperative Mathematics Tests-Algebra II. Controlling for pretests,
there were no differences at posttest (ES=+0.16, n.s.). However, results differed by pretest levels.
High achievers gained significantly more in the CAI treatment (ES=+0.48, p<.05), but there were
no differences for middle achievers (ES=+0.17, n.s.) or low achievers (ES=-0.20, n.s.).
A semester-long study by Clarke (1993) evaluated two forms of CAI. One used an
ordinary CAI approach designed in collaboration with IBM consultants, and the other used an
audio-interactive touch screen. Students were assigned to the groups by choosing every fifth
name from a list of low-achieving students, tenth graders who scored between the 10th
and 45th
percentiles on CTBS. At posttest, controlling for pretests, there were no significant differences.
Effect sizes were +0.15 for the touch screen and +0.10 for ordinary CAI, for a mean of
ES=+0.13.
In a large matched post-hoc comparison, Watkins (1991) evaluated a supplemental CAI
program called Project IMPAC in 180 Arkansas schools. Ninety schools using Project IMPAC
were matched with 90 non-IMPAC schools on the MAT-6 in 1981, before the program began.
The study included schools that began IMPAC in years from 1983 to 1987, and the posttest was
1989 scores, so schools could have used the program for from 2 to 6 years. Tenth grade scores
were used as posttests. Comparing gains from 1981 to 1989, there were no differences between
Project IMPAC and control schools (ES=.01).
Effective Programs in Middle and High School Mathematics
The Best Evidence Encyclopedia is a free web site created by the Johns Hopkins University School of Education’s Center for Data-Driven Reform in Education (CDDRE) under funding from the Institute of Education Sciences, U.S. Department of Education.
30
A post-hoc matched study by Ngaiyaye & VanderPloge (1986) evaluated various CAI
models in two inner-city Chicago schools. CAI and control students, mostly in grades 6-8, were
identified within the schools. Differences favored the CAI group in one school but not the other,
for a mean of ES=+0.10.
McCart (1996) evaluated the use of the WICAT ILS with at-risk eighth graders in rural
New Jersey. The CAI students used WICAT for 30 minutes twice a week for six months. Control
students did not have access to CAI. On a state Early Warning Test, students in the CAI group
scored substantially better than those in the control group, adjusting for pretests (ES=+1.20,
p<.001).
Computer-Managed Learning Systems
Accelerated Math
Accelerated Math (AM) is a technology-enhanced progress monitoring and instructional
management system. In it, students take a computer-adaptive test, and based on this the computer
generates appropriate practice exercises. After completing these exercises, students feed a score
sheet into a scanner, and the computer gives feedback to the student and his or her teacher.
Teachers may use information from the computer to guide their classroom instruction, but the
main focus is on providing supplemental individualized practice to help students fill in gaps in
their mathematics understanding. Accelerated Math is not a typical CAI program, in that the
computer is used only for assessment, prescription, and scoring. Students do their actual
exercises on computer-generated paper. However, the program is very similar to a CAI program
in that it provides supplemental, individualized practice and feedback to students and teachers.
Ysseldyke & Bolt (2006) carried out a year-long randomized quasi-experiment to
evaluate Accelerated Math in classrooms located in three middle schools in Mississippi,
Michigan, and North Carolina. Classrooms were randomly assigned within teachers, so that each
teacher taught at least one AM and at least one control class. Control classes used a variety of
traditional textbooks. Experimental and control groups were similar in demographic
compositions. Students were pre- and posttested on the Terra Nova. The groups were similar at
pretest. At posttest, there were no differences (ES=-0.07, n.s.). Outcomes were somewhat more
positive on a STAR Math assessment, but this test, developed by the same company and used in
the program, was more closely aligned with AM than with the control treatments, and did not
qualify for this review.
Gaeddert (2001) evaluated Accelerated Math in Pre-Algebra, Algebra I, and Geometry
classes in a Kansas high school. One teacher of each subject taught one AM and one control
class. This prospective matched study took place over one semester. Students were pre- and
posttested on the SAT-9. Classes were adequately matched at pretest. Posttest differences
favored the AM classes to different degrees in each subject. After adjustments for pretests, effect
sizes were +0.09 for Pre-Algebra, +0.62 for Algebra I, and +0.35 for Geometry, for a mean of
+0.35.
Effective Programs in Middle and High School Mathematics
The Best Evidence Encyclopedia is a free web site created by the Johns Hopkins University School of Education’s Center for Data-Driven Reform in Education (CDDRE) under funding from the Institute of Education Sciences, U.S. Department of Education.
31
Atkins (2005) evaluated Accelerated Math in grades 6-8 in a school in rural East
Tennessee. Terra Nova posttests were compared for students who participated in AM and those
who did not, controlling for Terra Nova pretests. The adjusted posttests significantly favored the
control group (ES=-0.26, p<.001).
Across three studies, the weighted mean effect size for Accelerated Math was -0.02.
Conclusions: Computer-Assisted Instruction
A total of 38 qualifying studies evaluated various forms of computer-assisted instruction.
Overall, the median effect size was +0.10, a modest impact less than the median of +0.19
reported by Slavin & Lake (in press) for elementary applications of CAI. No program stood out
as having notably large and replicated effects. There were some differences among programs
categorized as core (weighted mean ES=+0.18 in 17 studies), and supplemental programs
(weighted mean ES=+0.09 in 17 studies). Computer-managed learning systems (ES=-0.02 in 3
studies) had lower effect sizes.
Instructional Process Programs
Instructional process programs are approaches to mathematics reform that emphasize
extensive professional development to help teachers use effective teaching strategies. Studies in
this category typically hold constant the textbooks, content, and objectives used in experimental
and control groups. What is changed are the teaching methods, not the content.
Instructional process programs used in secondary schools were further divided into six
subcategories:
1. Cooperative learning
2. Metacognitive strategy instruction
3. Individualized instruction
4. Mastery learning
5. Comprehensive school reform
Table 3 summarizes qualifying studies of instructional process approaches.
============
TABLE 3 HERE
=============
Cooperative Learning
Student Teams-Achievement Divisions
Effective Programs in Middle and High School Mathematics
The Best Evidence Encyclopedia is a free web site created by the Johns Hopkins University School of Education’s Center for Data-Driven Reform in Education (CDDRE) under funding from the Institute of Education Sciences, U.S. Department of Education.
32
Student Teams-Achievement Divisions (STAD) is a cooperative learning program in
which students work in 4-member heterogeneous teams to help each other master academic
content. Teachers follow a schedule of teaching, team work, and individual assessment. The
teams receive certificates and other recognition based on the average scores of all team members
on weekly quizzes. This team recognition and individual accountability are held by Slavin (1995)
and others to be essential for positive effects of cooperative learning.
Slavin & Karweit (1984) carried out a large, year-long randomized evaluation of STAD in
Math 9 classes in Philadelphia. These were classes for students not felt to be ready for Algebra I,
and were therefore the lowest-achieving students. Overall, 76% of students were African
American, 19% were White, and 6% were Hispanic. Forty-four classes in 26 junior and senior
high schools were randomly assigned within schools to one of four conditions: STAD, STAD plus
Mastery Learning, Mastery Learning, or control. All classes, including the control group, used
the same books, materials, and schedule of instruction, but the control group did not use teams or
mastery learning. In the Mastery Learning conditions, students took formative tests each week,
students who did not achieve at least an 80% score received corrective instruction, and then
students took summative tests. Results relating to the Mastery Learning condition are described
in more detail under Mastery Learning, later in this paper.
Shortened versions of the CTBS in mathematics served as a pre- and posttest. The tests were
shortened by removing every third item, to make it possible to give them within one class period.
The four groups were very similar at pretest. On 2 x 2 nested analyses of covariance
(similar to HLM random effects analyses), there was a significant effect of a “teams” factor
(ES=+0.21, p<.03). The effect size comparing STAD + Mastery Learning to control was
ES=+0.24, and that for STAD without Mastery Learning was ES=+0.18. There was no
significant Mastery Learning main effect or teams by mastery interaction either in the random
effects analysis or in a student-level fixed effects analysis. Effects were similar for students with
high, average, and low pretest scores.
Nichols (1996) evaluated STAD in a randomized experiment in high school geometry
classes. Students were randomly assigned to experience STAD for the first 9 weeks of the 18-
week experiment, for the second 9 weeks, or neither (control). The control group used a lecture
approach for the entire 18-week period. At the end of 18 weeks, both STAD groups scored higher
than controls on a measure of the content studied in all classes, controlling for ITBS scores
(ES=+0.20, p<.05).
In a randomized quasi-experiment, Barbato (2000) evaluated a cooperative learning
method similar to STAD in tenth grade classes taking the New York State integrated mathematics
course, Sequential Math Course II. The same two teachers taught eight sections. Four sections
were randomly assigned to experience cooperative learning and four continued in traditional
methods. All classes used the same textbooks and content, and differed only in teaching method.
On the New York Integrated Math Test for Course II, controlling for Course I scores, students
taught using cooperative learning scored substantially higher (ES=+1.09, p<.001). Female
students gained more than males from cooperative learning, but the gender by treatment
interaction was not statistically significant.

Effective Programs in Middle and High School Mathematics
The Best Evidence Encyclopedia is a free web site created by the Johns Hopkins University School of Education’s Center for Data-Driven Reform in Education (CDDRE) under funding from the Institute of Education Sciences, U.S. Department of Education.
33
Reid (1992) evaluated a cooperative learning model similar to STAD, in which there was
competition among heterogeneous learning teams, in an entirely African-American school in
inner-city Chicago. Seventh graders who participated in cooperative learning were compared to
matched control students. On posttests adjusted for pretests, the cooperative learning groups
scored significantly higher on the ITBS (ES=+0.38, p<.05).
Across four studies, three of which used random assignment to conditions, the weighted
mean effect size for STAD was +0.42.
Peer-Assisted Learning Strategies (PALS) and Curriculum-Based Measurement (CBM)
Peer-Assisted Learning Strategies, or PALS (Fuchs, Fuchs, Hamlett, Phillips, & Bentz,
1994) is a cooperative learning strategy in which students work in pairs to help one another
master academic content. Curriculum-Based Measurement or CBM (Fuchs & Fuchs, 1991) is a
method in which students are assessed once a week on progress toward success on course
objectives and are given help if they indicate problems. The experimental treatment combined
PALS and CBM. Ten classes with 92 students with learning disabilities in grades 9-12
participated in a 15-week study by Calhoon & Fuchs (2003). Three teachers each taught both
PALS/CBM and control classes, which were randomly assigned within teacher. Despite random
assignment of classes, there were substantially more African-American students in the
PALS/CBM group (64% vs. 38%) and the PALS/CBM group scored higher at pretest
(ES=+0.37). However, the pretest differences were controlled for in the analyses.
Only 56 students were pre- and posttested on the Tennessee Comprehensive
Achievement Test (TCAP). Adjusting for pretests, TCAP posttests favored the control group
(ES= -0.30, n.s.). Differences favored the experimental group on experimenter-made tests of
computations, and there were no differences on experimenter-made tests of applications, but
these were considered aligned with the treatment and therefore did not meet inclusion criteria.
IMPROVE
IMPROVE is an approach to mathematics that combines cooperative learning,
metacognitive instruction, and mastery learning, developed in Israel by Mevarech & Kramarski
(1997). The name stands for the seven main elements of the approach:
Introducing new concepts
Metacognitive questioning
Practicing
Reviewing and reducing difficulties
Obtaining mastery
Verification
Enrichment
Effective Programs in Middle and High School Mathematics
The Best Evidence Encyclopedia is a free web site created by the Johns Hopkins University School of Education’s Center for Data-Driven Reform in Education (CDDRE) under funding from the Institute of Education Sciences, U.S. Department of Education.
34
IMPROVE was designed as an alternative to ability grouping, to accommodate student
diversity in heterogeneous classes. In the program, students work in small, heterogeneous
groups. After the teacher introduces the concepts, students work in their groups to ask and
answer metacognitive questions in which students ask each other to articulate the main problem,
categorize it, choose an appropriate solution strategy, and identify similarities and differences
with other problems they have had. After about 10 lessons, students take a formative test on the
unit content. Those who do not achieve a score of at least 80% are given corrective instruction,
while others do enrichment activities. Finally, students who received corrective instruction take a
parallel test.
Kramarski, Mevarech, & Lieberman (2001) evaluated IMPROVE in three Israeli junior
high schools. The schools were randomly assigned to one of three treatments: IMPROVE in both
math and English as a foreign language, IMPROVE in math only, and control. However, since
there was only one school (and two classes) per treatment, this was a randomized quasi-
experiment. Seventh graders were pretested on a test of elementary math and posttested at the
end of the year on a comprehensive test of the content studied in all three schools. Combining the
two IMPROVE groups, pretests were similar, but IMPROVE students scored substantially higher
than control students at posttest, controlling for pretests (ES=+0.79).
Mevarech & Kramarski (1997, Study 1) evaluated IMPROVE in four Israeli junior high
schools over one semester. Three seventh grade classes used IMPROVE and five served as
matched controls, using the same books and objectives. The experimental classes were randomly
selected (not randomly assigned) from among those taught by teachers with experience teaching
IMPROVE, and matched control classes were randomly selected as well. Students were pre- and
posttested on tests certified by the Israeli superintendent of mathematics as fair to all groups.
Pretest scores were similar across groups. On analyses of covariance with classes nested within
treatments, treatment effects significantly favored the IMPROVE classes on scales assessing
introduction to algebra (ES=+0.54) as well as mathematical reasoning (ES=+0.68), for an
average effect size of +0.61. Effects were similar for low, average, and high achievers.
In a second study (Mevarech & Kramarski, 1997, Study 2), IMPROVE was once again
evaluated in four Israeli junior high schools, this time over a full school year. In this study, six
IMPROVE and three matched control classes were randomly selected as in Study 1. On an
algebra test, a nested analysis of covariance found significant differences favoring IMPROVE
(ES=+0.25). As in Study 1, effects were very similar for low, middle, and high achievers, and on
four of five subtests. Averaging the three studies, the weighted mean effect size for IMPROVE
was +0.52.
Metacognitive Strategy Instruction
A key component of IMPROVE, described above, is the use of metacognitive strategy
instruction, or self-regulated learning. In these methods, students working in small groups are
taught to ask themselves aloud questions of comprehension, connections and
similarities/differences with previous problems, appropriate strategies, and reflection.
Effective Programs in Middle and High School Mathematics
The Best Evidence Encyclopedia is a free web site created by the Johns Hopkins University School of Education’s Center for Data-Driven Reform in Education (CDDRE) under funding from the Institute of Education Sciences, U.S. Department of Education.
35
Component analyses by the creators of IMPROVE have evaluated metacognitive strategy
instruction independently of the full model.
Mevarech, Tabuk, & Sinai (2006) evaluated the metacognitive strategy instruction
aspects of IMPROVE in a randomized quasi-experiment among eighth graders in an Israeli
junior high school. Four classes were randomly assigned either to a cooperative learning program
with metacognitive strategy instruction or cooperative learning without metacognitive instruction.
Students were pre- and posttested on experimenter-made measures not aligned with the
treatments. Students in the metacognitive strategy instruction and cooperative learning group
(N=43) scored significantly higher than cooperative learning only students (N=57) (ES=+0.21, p<.05).
In a five-month study in four Israeli junior high schools, Kramarski & Hirsch (2003)
compared eighth graders who received metacognitive strategy training to those who did not. Four
classes in four different schools were randomly assigned to treatments, making this a randomized
quasi-experiment. Students were pre- and posttested on experimenter-made algebra tests
unrelated to the metacognitive treatments. On adjusted posttests, students who received the
metacognitive strategy instruction (N=20) scored substantially better than control students
(N=20) (ES=+0.56, p<.05). In addition, students who received the metacognitive treatment and
computer-assisted instruction (N=20) scored better than those who received computer-assisted
instruction alone (N=23) (ES=+0.78, p<.05). Averaging these comparisons, the overall effect
size was +0.67.
Individualized Instruction
Bull (1971) carried out a randomized evaluation of individualized instruction in an upper-
middle class suburban high school near Phoenix, Arizona. The individualized treatment involved
allowing students to choose their own learning experiences to meet teacher-established
objectives, with the teacher providing a great deal of assistance to individuals and small groups.
Students were also encouraged to help each other. Students in two geometry classes were
randomly assigned to individualized instruction (N=68) or traditional instruction (N=68), using a
table of random numbers. Two teachers were randomly assigned to teach either individualized or
traditional classes in the morning, and they switched treatments in the afternoon.
There was no pretest, but there were adequate numbers of students randomly assigned to
assume that pretest differences were negligible. On a standardized Mid-Year Geometry Test,
given at the beginning of the second semester, the individualized instruction group scored at a
significantly higher level (ES=+0.55, p<.01).
Morton (1979) evaluated an approach to algebra in which students worked through a
series of teacher-made instructional activities at their own pace. Two teachers worked together in
a team with 76 ninth graders. The students in this program in a suburban mid-south high school
were compared with conventionally-taught students in two similar high schools. Students were
pre- and posttested on the Lankton First-Year Algebra Test. At posttest, controlling for pretest,
the students in the individualized instruction group scored marginally higher than those in the
control group (ES=+0.19, p<.10). Outcomes were very positive among students who had scored
Effective Programs in Middle and High School Mathematics
The Best Evidence Encyclopedia is a free web site created by the Johns Hopkins University School of Education’s Center for Data-Driven Reform in Education (CDDRE) under funding from the Institute of Education Sciences, U.S. Department of Education.
36
lowest on the pretest (ES=+0.54), but there were no differences for average achievers
(ES=+0.17) or high achievers (ES=-0.13).
Mastery Learning
Mastery learning (Block & Anderson, 1976) is an approach to instruction intended to
bring all students to a pre-established level of mastery (such as 80% correct) on a set of
instructional objectives. Students are taught to well-defined standards, formatively assessed,
given corrective instruction if needed, and then summatively assessed.
Slavin & Karweit (1984), in a study reported earlier, carried out a randomized evaluation
using a 2 x 2 factorial design, in which low-achieving Math 9 students in Philadelphia junior and
senior high schools received STAD (a cooperative learning approach), mastery learning, STAD +
mastery learning, or control. The mastery learning vs. control comparison involved 21 randomly
assigned classes, and 298 students. Control students used the same texts and basic schedule of
instruction as mastery students, but did not experience formative assessment or corrective
instruction, the core elements of mastery learning. Nested analyses of covariance (similar to
HLM) compared treatments. There were no significant differences on the math test, a shortened
form of the CTBS, controlling for CTBS pretests. The student-level effect size comparing
mastery learning and control classes was +0.01.
A study in northern Montana by Olson (1988) evaluated mastery learning in grades 7 and
8. Each of nine teachers in nine schools taught two or more classes of seventh or eighth grade
mathematics. Each teacher taught at least one class with a “wait time” component and one
without, but the mastery learning comparison involved matched classes across teachers. The
study’s duration was one semester, from September to January. Students were pre- and
posttested on the SAT. The mastery learning group scored higher at pretest (ES=+0.30).
Analyses of covariance found no differences on posttests adjusted for pretests (ES=+0.02).
A form of mastery learning called the Achievement Goals Program was evaluated by
Sullivan (1987) in a San Diego junior high school among low-performing eighth graders. Sixty
students were assigned by computer scheduling to two classes, which were similar at pretest.
Students were pre- and posttested on the CTBS. On Math Total, the mastery learning class
scored significantly higher (ES=+0.22). Differences were non-significant on Computations
(ES=+0.13) and on Concepts and Applications (ES=+0.10).
Anderson (1988) evaluated mastery learning in two middle class, mostly White, Ohio
junior high schools. Mastery learning was used in Algebra I classes in one school, and the second
served as a control group. There were two classes in each school. Both schools used the same
textbook. Students were pretested on the Orleans-Hannah Algebra Prognosis test and posttested
on the STEP III Algebra End-of-Course test. Pretests favored the Mastery Learning classes, but
posttests adjusted for pretests showed no differences (ES=-0.05).
Monger (1989) compared mastery learning and control students in two middle schools.
Thirty-five seventh graders were selected within each school by choosing every third or fourth
student. Students were pre- and posttested on the MAT-6. In analyses of covariance, the control
Effective Programs in Middle and High School Mathematics
The Best Evidence Encyclopedia is a free web site created by the Johns Hopkins University School of Education’s Center for Data-Driven Reform in Education (CDDRE) under funding from the Institute of Education Sciences, U.S. Department of Education.
37
group scored significantly better on Mathematics Total (ES=-0.34) and Concepts (ES=-0.42),
and non-significantly better on Computations (ES=-0.18) and Problem Solving (ES=-0.07), for a
mean effect size of -0.25.
Aitken (1984) evaluated mastery learning in an Arizona junior high school. One class
(N=30) of eighth graders using mastery learning was compared to a traditional class (N=30).
Students were pre- and posted on CTBS. The adjusted effect size was +0.22.
Across six studies of mastery learning, the weighted mean effect size was -0.05.
Mathematics-Focused Professional Development
Comprehensive School Reform
Comprehensive school reform (CSR) programs are whole-school models that include
extensive professional development in instructional methods, curriculum, school organization,
classroom management, parent involvement, and other issues. Only CSR models with specific
approaches to mathematics are included here, but for broader reviews of middle and high school
CSR, see CSRQ, 2007; Borman et al., 2003.
Talent Development Middle School Mathematics Program
The Talent Development Middle School Mathematics Program is the mathematics
component of the Talent Development Middle School (TDMS), a comprehensive school reform
model (Mac Iver, Ruby, Balfanz, & Byrnes, 2003). It builds onto the curriculum provided by the
University of Chicago School Mathematics Project extensive professional development, on-site
coaching, and follow-up. Teachers receive three days of inservice each summer, and then
participate in monthly 3-hour Saturday sessions, focusing primarily on mathematics concepts and
means of presenting them to students. On-site coaches visit TDMS schools 1-2 days per week to
visit teachers in their classrooms. The larger Talent Development Middle School model uses
looping, so that teachers stay with the same classes for multiple years, and it uses semi-
departmentalization, so that each teacher sees the same students for at least two subjects.
Balfanz, Mac Iver, & Byrnes (2006) carried out an evaluation of TDMS Mathematics in
three inner-city Philadelphia middle schools. Two were majority African American and one majority
Hispanic. The schools were matched on demographics and test scores with three control schools,
which also used UCSMP curriculum materials but without the extensive professional development.
Data from school records were used in a longitudinal evaluation. After three years of
implementation, eighth graders were compared on district-administered SAT-9 scores,
controlling for their fourth grade SAT-9 scores. Only 36 TDMS and 26 control students were
found at both points in time. Among this group, there were no differences in Math Procedures
(ES=+0.06, n.s.), but there were significant differences in Math Problem Solving (ES=+0.30,
p<.001). The average SAT-9 effect size was +0.18.
Effective Programs in Middle and High School Mathematics
The Best Evidence Encyclopedia is a free web site created by the Johns Hopkins University School of Education’s Center for Data-Driven Reform in Education (CDDRE) under funding from the Institute of Education Sciences, U.S. Department of Education.
38
On Pennsylvania assessments (PSSA), the analysis followed students from fifth to eighth
grade. A much larger proportion of students were included in these analyses, 887 TDMS and
1181 control. Controlling for pretests, PSSA differences were statistically significant (ES=+0.17,
p<.05). Averaging PSSA and SAT-9 outcomes yields an effect size of +0.18.
Talent Development High School Mathematics
The Talent Development High School (TDHS) is a comprehensive school reform program
that provides extensive professional development to high-poverty high schools (Legters, Balfanz,
Jordan, & McPartland, 2002). A key part of the approach is a Ninth Grade Success Academy,
located in a separate part of the school building, in which students receive intensive instruction in
reading and math to help them overcome any deficits in these areas likely to inhibit success
throughout high school. Reading and math are each taught 90 minutes each day. In mathematics,
TDHS students experience a program called Transition to Advanced Mathematics, which emphasizes
manipulatives, student discussion, connections with the real world, and hands-on experiences.
A third-party evaluation of TDHS was carried out in high-poverty Philadelphia high
schools by MDRC (Kemple, Herlihy, & Smith, 2005). Five TDHS schools were compared to six
similar Philadelphia high schools matched on prior PSSA scores and demographic factors. A
comparative interrupted time series design compared the schools for three years before TDHS
began and then followed entering ninth graders for three years in TDHS and control schools.
Data from up to three baseline cohorts and up to five post-baseline cohorts were obtained and
averaged from each of the schools.
Math outcomes were estimated by obtaining eleventh grade PSSA scores for the students
who took PSSA on time. Due to high mobility and retention rates, this represented only 39% of
the original sample, and greatly underrepresented the lowest achievers (but to the same degree in
experimental and control groups). Among this group, there were no significant differences in
PSSA Mathematics (ES= -0.07, n.s.). However, there were significantly positive impacts of
TDHS on several other important outcomes, including the percent of students promoted to tenth
grade, total credits earned, and attendance rates.
Balfanz, Legters, & Jordan (2004) evaluated the TDHS Ninth Grade Success Academy in
three inner-city Baltimore high schools. Control schools also provided 90-minute periods in
ninth grade reading and math, but did not use the TDHS instructional strategies.
Students in TDHS and control schools were tested at the end of the ninth grade on the
Terra Nova. CTBS scores from the end of eighth grade were used as covariates. The TDHS
students scored higher than controls, controlling for pretests (ES=+0.18, p<.05).
Partnership for Access to Higher Mathematics (PATH)
The Partnership for Access to Higher Mathematics (PATH) was a program for at-risk
eighth graders, designed to help them prepare for advanced classes. It focused on improving

Effective Programs in Middle and High School Mathematics
The Best Evidence Encyclopedia is a free web site created by the Johns Hopkins University School of Education’s Center for Data-Driven Reform in Education (CDDRE) under funding from the Institute of Education Sciences, U.S. Department of Education.
39
curriculum and instruction with use of constructivist approaches, manipulatives, and technology,
and provided social work interventions to deal with issues such as attendance, parent support,
and behavior. An evaluation of PATH by Kennedy, Chavkin, & Raffeld (1995) compared 61
PATH students in 3 classes to 39 comparison students in 2 classes receiving traditional
instruction. Students in both groups were about 2/3 Hispanic and 1/3 White. The groups were
well matched on demographics and prior year state tests (Norm-Referenced Assessment Program
for Texas, or NAPT). On a final algebra test, controlling for NAPT, PATH students scored
substantially higher than controls (ES=+0.47, p<.001). Significant differences were apparent on
TAAS Math (p<.05), but there was insufficient information to compute effect sizes.
Conclusions: Instructional Process Programs
As was true in the Slavin & Lake (in press) review of elementary math programs, the
middle and high school approaches with the strongest evidence of effectiveness are instructional
process programs. Across 22 qualifying studies, the median effect size was +0.18. However,
outcomes varied considerably by type of approach. Two forms of cooperative learning, STAD
and IMPROVE, had a weighted mean effect size of +0.46 across 7 studies, and 4 of these, with a
weighted mean effect size of +0.48, used random assignment to conditions. The findings for
these cooperative learning programs are in line with those of the elementary review, which found
a median effect size of +0.29 for cooperative learning (Slavin & Lake, in press). However, a
negative effect was found for a small study of a form of Peer Assisted Learning Strategies
(PALS), which contrasts with positive findings at the elementary level. In contrast, six studies of
mastery learning found no effects (weighted mean ES= -0.05).
Overall Patterns of Outcomes
Across all categories of programs, there were 100 studies of middle and high school math
programs that met the inclusion criteria, of which 26 used random assignment to treatments. The
weighted mean effect size was +0.07 overall, and +0.13 for the randomized and randomized
quasi-experimental studies.
Outcomes were quite different according to types of programs. The weighted mean effect
size for math curricula was only +0.03, CAI studies average a weighted mean effect size of
+0.10. Among the instructional process programs, however, there was great variation. Two
cooperative learning programs, STAD and IMPROVE, had very positive outcomes (weighted
mean ES=+0.46), and several other types of approaches had positive effects in one or two
studies. In contrast, six studies of mastery learning found no differences (ES=-0.05).
Across programs, effects were similar for students of different social classes and different
ethnic backgrounds. There were few consistent differences on different subscales of the math tests.
Outcomes by Socioeconomic Status and Minority Status
Effective Programs in Middle and High School Mathematics
The Best Evidence Encyclopedia is a free web site created by the Johns Hopkins University School of Education’s Center for Data-Driven Reform in Education (CDDRE) under funding from the Institute of Education Sciences, U.S. Department of Education.
40
A question of considerable policy importance is whether various secondary mathematics
programs are particularly effective for disadvantaged and minority students. These students lag
behind middle class students in mathematics achievement, so finding programs with substantial
effects for these students would be of particular value.
In order to examine this issue, studies’ samples were categorized as low in
socioeconomic status if students averaged 50% free/reduced price lunch or more. In some cases,
free lunch data were not available, but other indicators of poverty were presented. Across the 100
studies, 23 served low-SES populations. The proportions varied by category. Only 5 of 40
studies of curricula (13%) involved low-SES populations, but 29% of CAI and 32% of
instructional process studies involved low-SES groups.
Looking across studies, effect sizes for low-SES studies were somewhat higher than
those for other studies. Among all 23 low-SES studies, the weighted mean effect size was +0.12,
in comparison to +0.05 for studies of non-disadvantaged students.
Many studies compared outcomes by socioeconomic status or race. A total of 17 studies
across all categories reported race by treatment interactions, SES by treatment interactions, or
both. A few found trends showing larger effects for one or another group, but none reported clear
results showing differential gains.
Although the numbers of studies that investigated interactions with ethnicity and SES are
small, the patterns within and across studies suggest that the best way to use the information in
this article to benefit disadvantaged and minority students is to apply the most effective programs
in school serving many such students.
Is Random Assignment Essential?
As an important methodological note, it was interesting to find that there were no
differences in median effect sizes between studies that used random assignment to conditions
and studies that used matched designs. The overall weighted mean effect sizes were very similar:
+0.13 for randomized or randomized quasi-experiments and +0.06 for matched studies. The
review of elementary math programs by Slavin & Lake (in press) also found minimal differences
in outcomes between randomized and matched studies. It is important to recall that the current
review and Slavin & Lake (in press) used stringent inclusion criteria for matched studies, so
these findings may not apply to all matched studies. This finding reinforces conclusions made by
Cook, Shadish, & Wong (2008), Slavin & Smith (2008), by Glazerman, Levy, & Myers (2002)
that high-quality studies with well-matched control groups produce outcomes similar to those of
randomized experiments. Randomization is still valuable in reducing the possibility of selection
bias, but these findings suggest that reviewers of research on educational programs can include
well-matched evaluations. The exception to this is where self-selection or other forms of
selection of individual students creates a characteristic bias in poorly-controlled studies, as in
studies of voluntary after school programs (where more motivated students might attend) or
studies of gifted programs (where selected students are likely to be superior to rejected
Effective Programs in Middle and High School Mathematics
The Best Evidence Encyclopedia is a free web site created by the Johns Hopkins University School of Education’s Center for Data-Driven Reform in Education (CDDRE) under funding from the Institute of Education Sciences, U.S. Department of Education.
41
applicants, even controlling for test scores). However, when there are fewer obvious reasons to
expect strong selection bias, randomized and well-matched studies may produce similar results.
See Cook et al. (2008) and Slavin (2008) for more on this.
Sample Size Matters
Another important methodological observation is the profound impact of sample size.
Large studies (sample size ≥ 250 students or 10 classes) had smaller median effect sizes in every
category: Math curricula (+0.06 large, +0.12 small), CAI (+0.07 large, +0.21 small), and
instructional process (+0.18 large, +0.22 small). In fact, focusing on the larger studies, only
instructional process programs have robust achievement effects. See Slavin & Smith (2008) for
Summarizing Evidence of Effectiveness for Current Programs
One of the most difficult issues in the review of “what works” research is in summarizing
outcomes of many studies, balancing factors such as methodological quality, effect sizes, sample
sizes, and other factors. For example, simply computing average effect sizes (as in meta-
analyses) risks over-emphasizing small and biased experiments, while restricting the review to
randomized experiments would result in a small number of studies, many of which might have
small samples, brief durations, or other features that greatly limit generalizability. Slavin (2007)
discussed these issues and proposed a rating system similar to that used by the What Works
Clearinghouse for the strength of evidence for educational programs. It balances methodological
quality (favoring randomized experiments), effect size, and larger samples (at least 250
students). This system was used previously by Slavin & Lake (in press) and Slavin et al. (2008).
Programs were categorized as follows.
Strong Evidence of Effectiveness
At least two studies, one of which is a large randomized or randomized quasi-
experimental study, or multiple smaller studies, with a median effect size of at least +0.20. A
large study is defined as one in which at least ten classes or schools, or 250 students, were
assigned to treatments. Smaller studies are counted as equivalent to a large study if their
collective sample sizes is at least 250 students.
Moderate Evidence of Effectiveness
At least two qualifying studies or multiple smaller studies with a collective sample size of
500 students, with a median effect size of at least +0.20.

Effective Programs in Middle and High School Mathematics
The Best Evidence Encyclopedia is a free web site created by the Johns Hopkins University School of Education’s Center for Data-Driven Reform in Education (CDDRE) under funding from the Institute of Education Sciences, U.S. Department of Education.
42
Limited Evidence of Effectiveness
At least one qualifying study of any design with an effect size of at least +0.10.
Insufficient Evidence of Effectiveness
One or more qualifying study of any design with a median effect size less than +0.10.
N No Qualifying Studies
===================
TABLE 4 HERE
===================
Table 4 summarizes currently available programs falling into each of these categories
(within categories, programs are listed in alphabetical order). Note that programs that are not
currently available, primarily the older CAI programs, do not appear in the table, as it is intended
to represent the range of options from which today’s educators might choose.
In line with the previous discussions, the programs represented in each category are
strikingly different. In the “Strong Evidence” category appear just two programs, both forms of
cooperative learning: Student Teams-Achievement Divisions and IMPROVE. No programs met
the standards for “Moderate Evidence.”
The “Limited Evidence” category includes a greater variety of programs, including three
math curricula (Core Plus Mathematics, Math Thematics, Prentice-Hall Course 2, and Saxon
Math), five CAI programs (Jostens, Plato, I Can Learn, New Century, and Expert
Mathematician), and Talent Development Mathematics and PATH, which are comprehensive
school reform programs. The twelve programs listed under “insufficient evidence of
effectiveness” had at least one qualifying study but failed to find educationally or statistically
significant differences.
Discussion
The research reviewed in this article evaluates a broad range of strategies for improving
mathematics achievement in middle and high schools. Perhaps the most important conclusion is
that there are fewer large, high-quality studies than one would wish for. Although a total of 100
studies across all programs qualified for inclusion, there were small numbers of studies on each
particular program. There were 26 studies that randomly assigned schools, teachers, or students
to treatments, but many of these were quite small. Clearly, more large randomized evaluations of
programs used on a significant scale over a year or more are needed.
Effective Programs in Middle and High School Mathematics
The Best Evidence Encyclopedia is a free web site created by the Johns Hopkins University School of Education’s Center for Data-Driven Reform in Education (CDDRE) under funding from the Institute of Education Sciences, U.S. Department of Education.
43
This being said, there were several interesting patterns in the research on middle and high
school mathematics programs. One surprising observation is the lack of evidence that it matters
very much which textbook schools choose (weighted mean ES=+0.03 across 40 studies). NSF-
funded curricula such as UCSMP, Connected Mathematics, and Core-Plus might have been
expected to at least show significant evidence of effectiveness for outcomes such as problem-
solving or concepts and applications, but the quasi-experimental studies that qualified for this
review find little evidence of strong effects even in these areas. The weighted mean effect size
for 24 studies of NSF-funded programs was 0.00, even lower than the median of +0.12 reported
for elementary NSF-funded programs by Slavin & Lake (in press).
It is possible that the standardized tests and state assessments used in the qualifying
studies may have failed to detect some of the more sophisticated skills taught in NSF-funded
programs but not other programs, a concern expressed by Confrey (2006) and Schoenfeld (2006)
in their criticisms of the What Works Clearinghouse. However, in light of the small effects seen
on outcomes such as problem solving, probability and statistics, geometry, and algebra, it seems
unlikely that misalignment between the NSF-sponsored curricula and the standardized tests
account for the modest outcomes.
Studies of computer-assisted instruction found a weighted mean effect size (ES=+0.10)
higher than that found for mathematics curricula, and less than to the median for CAI studies
(ES=+0.19) reported by Slavin & Lake (in press) for elementary CAI studies.
The most striking conclusion from the review, however, is the evidence supporting
instructional process strategies, especially cooperative learning. Eight studies, five of which
were randomized experiments or randomized quasi-experiments, found strong impacts (weighted
mean ES=+0.42) of cooperative learning programs.
The debate about mathematics reform has focused primarily on curriculum, not on
professional development or instruction (see, for example, AAAS, 2000; Confrey, 2006; NCTM,
1989, 2000, 2006; NRC, 2004). Yet this review, in agreement with the review of elementary
math programs by Slavin & Lake (in press), suggests that in terms of outcomes on traditional
measures, such as standardized tests and state accountability assessments, curriculum differences
appear to be less consequential than instructional differences. This is not to say that curriculum is
unimportant. There is no point in teaching the wrong mathematics. The research on the NSF-
supported curricula is at least comforting in showing that reform-oriented curricula are no less
effective than traditional curricula on traditional measures, so their contribution to non-
traditional outcomes does not detract from traditional ones (Schoenfeld, 2006). The movement
led by NCTM to focus math instruction more on problem solving and concepts may account for
the gains over time on NAEP, which itself focuses substantially on these domains.
Also, it is important to note that the three types of approaches to mathematics instruction
reviewed here do not conflict with each other, and may have additive effects if used together. For
example, schools might use an NSF-supported curriculum such as UCSMP or Connected
Mathematics with well-structured cooperative learning and supplemental computer-assisted

Effective Programs in Middle and High School Mathematics
The Best Evidence Encyclopedia is a free web site created by the Johns Hopkins University School of Education’s Center for Data-Driven Reform in Education (CDDRE) under funding from the Institute of Education Sciences, U.S. Department of Education.
44
instruction, and the effects may be greater than those of any of these programs by themselves.
However, the findings of this review suggest that educators as well as researchers might do well
to focus more on how the classroom is organized to maximize student engagement and
motivation, rather than expecting that choosing one or another textbook by itself will move
students forward. In particular, both the elementary review (Slavin & Lake, in press) and the
current review find that the programs that produce consistently positive effects on achievement
are those that fundamentally change what students do every day in their core math classes.
As noted earlier, the most important problem in mathematics education in the U.S. is the
gap in performance between middle and lower class students and between White and Asian-
American students and African American, Hispanic, and Native American students. The studies
summarized in this review took place in widely diverse settings, and several of them reported
outcomes separately for various subgroups. Overall, there is no clear pattern of differential
effects for students of different social class or ethnic backgrounds. Programs found to be
effective with any subgroup tend to be effective with all groups. This suggests that educational
leaders could reduce achievement gaps by providing research-proven programs to schools
serving many disadvantaged and minority students. Special funding to help high-poverty, low-
achieving schools adopt proven programs could help schools with many students struggling in
math to implement innovative programs with strong evidence of effectiveness, as long as the
schools agree to participate in the full professional development process used in successful
studies and to implement all aspects of the program with quality and integrity.
The mathematics performance of America’s students does not justify complacency. In
particular, schools serving many students at risk need more effective programs. This article
points to math programs for middle and high school students that have the strongest evidence
bases today. Hopefully, higher quality evaluations of a broader range of programs will appear in
the coming years. We must use what we know now at the same time as we work to improve our
knowledge base in the future, so that all students receive the most effective mathematics
instruction we can give them.
Effective Programs in Middle and High School Mathematics
The Best Evidence Encyclopedia is a free web site created by the Johns Hopkins University School of Education’s Center for Data-Driven Reform in Education (CDDRE) under funding from the Institute of Education Sciences, U.S. Department of Education.
45
References
AAAS (2000). Middle school mathematics textbooks: A benchmark-based evaluation.
Washington, DC: Author.
Abegglen, S.R. (1984). The efficacy of computer-assisted instruction with educationally
handicapped high school students. Unpublished doctoral dissertation, Memphis State
University.
Abeille, A., & Hurley, N. (2001). Final Evaluation Report. Mathematics: Modeling Our World
(MMOW), a product of COMAP, Lexington, MA. Stoneham, MA: Learning Innovations
at WestEd.
Abrams, B.J. (1989). A comparison study of the Saxon Algebra 1 text. Unpublished doctoral
dissertation, University of Colorado at Boulder.
Aitken, E.J. (1984). Effects of an experimental achievement goals pilot program on
mathematical achievement. Unpublished doctoral dissertation, Northern Arizona
University.
Allsopp, D. H. (1997). Using classwide peer tutoring to teach beginning algebra problem-solving
skills in heterogeneous classrooms. Remedial and Special Education, 18(6), 367-379.
Alsup, J. K., & Sprigler, M. J. (2003). A comparison of traditional and reform mathematics
curricula in an eighth-grade classroom. Education, 123(4), 689-694.
Analysis of state math test scores of Pender County (NC) middle school students. (2001). San
Francisco, CA: Riverdeep, Inc.
Anderson, R.W. (1988). The effects of group-based mastery learning and enhanced cognitive
entry behavior on algebra achievement. Unpublished doctoral dissertation, Miami
University.
Anthony, G., & Walshaw, M. (2007). Best evidence synthesis: Effective pedagogy in
Pangarau/Mathematics. Wellington, NZ: Ministry of Education. Retrieved from
http://educationcounts.edcentre.govt.nz/publications/downloads/BES_Maths07_Complet
e.pdf
Aquino, A., & Zoet, C. (1985). Reinforcement in Algebra I: A study in the use of the Saxon
Algebra I textbook. Mathematics in Michigan, Spring, 23-28.
Arbuckle, W.J. (2005). Conceptual understanding in a computer assisted Algebra I classroom.
Unpublished doctoral dissertation, University of Oklahoma.

Effective Programs in Middle and High School Mathematics
The Best Evidence Encyclopedia is a free web site created by the Johns Hopkins University School of Education’s Center for Data-Driven Reform in Education (CDDRE) under funding from the Institute of Education Sciences, U.S. Department of Education.
46
Ash, J.E. (2004). The effects of computer-assisted instruction on middle school mathematics
achievement. Research report. Orchard Targeted Educational Software.
Atkins, J. (2005). The association between the use of Accelerated Math and students'
mathematics achievement. Unpublished doctoral dissertation, East Tennessee State
University.
Austin Independent School District. (2001). Austin collaborative for mathematics education,
1999-2000 evaluation. Unpublished manuscript.
Austin, J., Hirstein, J., & Walen, S. (1997). Integrated mathematics interfaced with science.
School Science and Mathematics, 97(1), 45-49.
Bach, S. (2001). Accelerated Math in a seventh grade classroom. Unpublished doctoral
dissertation, University of Alaska Anchorage.
Bailey, T.E. (1991). The effect of computer-assisted instruction in improving mathematics
performance of low-achieving ninth-grade students. Unpublished doctoral dissertation,
College of William and Mary.
Baker, J.A. (2005). The impact of computer enhanced learning environments on student
achievement in remedial algebra: a comparison of teaching models. Unpublished
doctoral dissertation, Capella University.
Baker, J. J. (1997). Effects of a generative instructional design strategy on learning mathematics
and on attitudes towards achievement. Dissertation Abstracts International, 58 (07),
2573A.
Balfanz, R., Legters, N., & Jordan, W. (2004). Impact of the Talent Development ninth grade
instructional interventions in reading and mathematics in high-poverty high schools.
Baltimore, MD: CRESPAR/Johns Hopkins University.
Balfanz, R., Mac Iver, D.J., & Byrnes, V. (2006). The implementation and impact of evidence-
based mathematics reforms in high-poverty middle schools: A multi-site, multi-year
study. Journal for Research in Mathematics Education, 37 (1), 33-64.
Barbato, R. (2000). Policy implications of cooperative learning on the achievement and attitudes
of secondary school mathematics students. Unpublished doctoral dissertation, Fordham
University.
Barnett, T. L. (1986). A comparative analysis of the PLATO computer-assisted instructional
delivery system and the traditional individualized instructional program in two juvenile
Effective Programs in Middle and High School Mathematics
The Best Evidence Encyclopedia is a free web site created by the Johns Hopkins University School of Education’s Center for Data-Driven Reform in Education (CDDRE) under funding from the Institute of Education Sciences, U.S. Department of Education.
47
correctional facilities owned by the Commonwealth of Pennsylvania. Dissertation
Abstracts International, 46(09), 2668A.
Baynes, J.F. (1998) The development of a Van Hiele based summer geometry program and its
impact on student Van Hiele level and achievement in high school geometry.
Unpublished doctoral dissertation, Columbia University.
Beal, C. R., Walles, R., Arroyo, I., & Woolf, B. P. (2007). On-line tutoring for math achievement
testing: A controlled evaluation. Journal of Interactive Online Learning, 6 (1), 43-55.
Becker, H. (1990). Effects of computer use on mathematics achievement. Findings from a
nationwide field experiment on grades five to eight classes: Rationale, study design, and
aggregate effect sizes. Baltimore, MD: Center for Research on Elementary and Middle
Schools.
Becker, H.J. (1991). Computer-based integrated learning systems in the elementary and middle
grades: A critical review and synthesis of evaluation reports. Journal of Educational
Computing Research, 8 (1), 1-41.
Becker, H.J. (1994). Mindless or mindful use of integrating learning systems. International
Journal of Educational Research, 21 (1), 65-79.
Bell, A. (1993). Some experiments in diagnostic teaching. Educational Studies in Mathematics,
24(1), 115-137.
Ben-Chaim, D., Fey, J. T., Fitzgerald, W. M., Benedetto, C., & Miller, J. (1997, April).
Development of proportional reasoning in a problem-based middle school curriculum.
Paper presented at the annual meeting of the American Educational Research
Association, Chicago, IL.
Ben-Chaim, D., Fey, J. T., Fitzgerald, W. M., Benedetto, C., & Miller, J. (1998). Proportional
reasoning among 7th grade students with different curricular experiences. Educational
Studies in Mathematics, 36(3), 247-273.
Berg, K.F. (1993, April). Structured cooperative learning and achievement in a high school
mathematics class. Paper presented at the annual meeting of the American Educational
Research Association, Atlanta, GA.
Billstein, R., & Williamson, J. (1999). Middle grades Math Thematics (Books 1-3). Evanston,
IL: McDougal Littell.
Billstein, R., & Williamson, J. (2002). Middle Grades MATH Thematics: The STEM project. In
S. L. Senk & D. R. Thompson (Eds.), Standards-based school mathematics curricula:
What are they? What do students learn? (pp. 251-284). Mahwah, NJ: Lawrence Erlbaum
Associates, Inc.
Effective Programs in Middle and High School Mathematics
The Best Evidence Encyclopedia is a free web site created by the Johns Hopkins University School of Education’s Center for Data-Driven Reform in Education (CDDRE) under funding from the Institute of Education Sciences, U.S. Department of Education.
48
Block, J., & Anderson, L. (1976). Mastery learning in classroom instruction. New York:
MacMillan.
Boaler, J. (2002). Stanford University mathematics teaching and learning study: Initial report: A
comparison of IMP 1 and Algebra 1 at Greendale School. Unpublished manuscript.
Borman, G.D., Hewes, G.M., Overman, L.T., & Brown, S. (2003) Comprehensive school reform
and achievement: A meta-analysis. Review of Educational Research, 73 (2), 125-230.
Bottge, B. A., Rueda, E., LaRoque, P., & Kwon, J. (2007, April). Integrating reform-oriented
math instruction in special education settings. Paper presented at the Annual Meeting of
the American Educational Research Association, Chicago, IL.
Bradfield, P. (1992). An evaluation of Lamar CISD Algebra programs. Rosenberg, TX: Lamar
Consolidated Independent School District. Internal Report of June, 1992.
Bray, M.S. (2005). Achievement of eighth grade students in mathematics after completing three
years of the Connected Mathematics Program. Unpublished doctoral dissertation,
University of Tennessee, Knoxville.
Brendefur, J.L. (1993). A study of the comparison of mastery learning versus conventional
learning with junior high mathematics students. Unpublished doctoral dissertation,
Pacific Lutheran University.
Brooks, C. (1999). Evaluation of Jefferson Parish technology grant: I CAN Learn Algebra I.
Unpublished manuscript, Jefferson Parish Public Schools.
Brush, T. (2002, May). PLATO evaluation series: Terry High School, Lamar Consolidated ISD,
Rosenberg, TX. Bloomington, MN: PLATO Learning Inc. (ERIC Document
Reproduction Service No. ED 469 375).
Buck, D. S. (1994). The effects of a summer enrichment program on mathematically bright
students. Unpublished doctoral dissertation, South Carolina State University,
Orangeburg.
Bull, S. (1971). A comparison of the achievement of geometry students taught by individualized
instruction and traditional instruction. Unpublished doctoral dissertation.
Cabalo, J.V. & Vu, M-T. (2007). Comparative effectiveness of Carnegie Learning's Cognitive
Tutor Algebra I curriculum: A report of a randomized experiment in the Maui School
District. Palo Alto, CA: Empirical Education Inc.
Effective Programs in Middle and High School Mathematics
The Best Evidence Encyclopedia is a free web site created by the Johns Hopkins University School of Education’s Center for Data-Driven Reform in Education (CDDRE) under funding from the Institute of Education Sciences, U.S. Department of Education.
49
Cain, J. S. (2002). An evaluation of the Connected Mathematics Project. Journal of Educational
Research, 32(4), 224-233.
Calhoon, M. B. & Fuchs, L. S. (2003). "The Effects of Peer-Assisted Learning Strategies and
Curriculum-Based Measurement on the Mathematics Performance of Secondary Students
with Disabilities," Remedial and Special Education, 24(4), 235-245.
Callow-Huesser, C., Allred, D., & Robertson, D., Sanborn, W. (2005). Evidence-Based Small-
Scale Study Final Report: McDougal Littell Middle School Math. Logan, UT: EndVision
Research & Evaluation.
Callow-Huesser, C., Allred, D., Sanborn, W., & Robertson, D. (2005). Evidence-based small-
scale study final report: McDougal Littell Algebra I, 2nd Edition. Logan, UT: EndVision
Research & Evaluation.
Camara, W.J. (1998, April). Constraints and limitations in evaluating math curricular reform
efforts Pacesetter Math case study. Paper presented at the annual meeting of the
American Educational Research Association, San Diego, CA.
Carnegie Learning, Inc. (2001, September). Report of results from Canton, Ohio (Cognitive
Tutor Research Report OH-01-01). Pittsburgh, PA: Author.
Carroll, B.P. (1995). An experimental study of the effect of cross-age tutoring on the
mathematical achievement of 9th grade students enrolled in Algebra I. Unpublished
doctoral dissertation, South Carolina State University.
Carter, T.S. (2004). A new approach to mastery learning in the Foundational Algebra course at
a Virginia high school. Unpublished doctoral dissertation, University of Virginia.
Chambers, E. A. (2003). Efficacy of educational technology in elementary and secondary
classrooms: A meta-analysis of the research literature from 1992-2002. Unpublished
doctoral dissertation, Southern Illinois University at Carbondale.
Chiang, A. et al. (1978). Demonstration of the use of computer-assisted instruction with handicapped
children: Final report. (ERIC Document Reproduction Service No. ED 166 913).
Chung, G. K. W. K., Delacruz, G. C., Dionne, G. B., Baker, E. L., Lee, J., & Osmundson, E.
(2007, April). Towards individualized instruction with technology-enabled tools and
methods. Paper presented at the Annual Meeting of the American Educational Research
Association, Chicago, IL.
Chukwu, J. (1986). A study of heuristic strategies and their uses in solving mathematics
problems. Unpublished doctoral dissertation, Southern Illinois University at Carbondale.

Effective Programs in Middle and High School Mathematics
The Best Evidence Encyclopedia is a free web site created by the Johns Hopkins University School of Education’s Center for Data-Driven Reform in Education (CDDRE) under funding from the Institute of Education Sciences, U.S. Department of Education.
50
Chung, S. M-K. (2005). Effects on algebra scores of students with mild/moderate disabilities
after the implementation of traditional instruction followed by CAP mnemonic
instruction. Unpublished master’s thesis, California State University.
Cicchetti, G., Sandagata, A., Suntag, M., & Tarnuzzer, J. (2003). The effects of web-based
instruction in digital classrooms on math and reading performance on the CT Academic
Performance test (CAPT) and related outcomes for a 10th grade cohort of CT urban
vocational-technical school students.
Cichon, D. & Ellis, J. (2003). The effects of MATH Connections on student achievement,
confidence, and perception. In S. Senk & D. Thompson (Eds.), Standards-Based School
Mathematics Curricula: What Are They? What Do Students Learn? (pp.345-374).
Mahwah, NJ: Lawrence Erlbaum Associates.
Clarke, W.R. (1993). The effects of computerized instruction on the improvement and transfer of
math skills for low-skilled and below-average-skilled sophomore students, considering
student gender, ethnicity, and learning style preference. Unpublished doctoral
dissertation, University of la Verne.
Clarke, D., Breed, M., & Fraser, S. (2004). The consequences of a problem-based mathematics
curriculum. The Mathematics Educator, 14(2), 7-16.
Clarkson, L. M. C. (2001). The effects of the Connected Mathematics Project on middle school
mathematics achievement. Unpublished doctoral dissertation, University of Minnesota.
Dissertation Abstracts International, 61 (12), 4709A.
Clay, D. W. (1998). A study to determine the effects of a non-traditional approach to algebra
instruction on student achievement. Unpublished master's thesis, Salem-Teikyo
University, Salem, WV.
Clewell B.C. et al. (2004). Review of evaluation studies of mathematics and science curricula
and professional development models. Washington D.C.: The Urban Institute.
Collins, A. M. (2002). What happens to student learning in mathematics when a multi-faceted,
long-term professional development model to support standards-based curricula is
implemented in an environment of high stakes testing? Unpublished doctoral dissertation,
Boston College.
Compass Learning, (2001-2002). (2003). An independent study done by the Odyssey Charter
Middle School. Compass Learning, 9920 Pacific Heights Blvd., San Diego, CA 92121.
Confrey, J. (2006). Comparing and contrasting the National Research Council report On
Evaluating Curricular Effectiveness with the What Works Clearinghouse approach.
Educational Evaluation and Policy Analysis, 28 (3), 195-213.
Effective Programs in Middle and High School Mathematics
The Best Evidence Encyclopedia is a free web site created by the Johns Hopkins University School of Education’s Center for Data-Driven Reform in Education (CDDRE) under funding from the Institute of Education Sciences, U.S. Department of Education.
51
Conlon, S.C. (1991). Using heuristics to teach problem-solving in Algebra 1: A metacognitively
controlled approach. Unpublished doctoral dissertation, University of Connecticut.
Cook, T., Shadish, W.R., & Wong, V.C. (2008). Three conditions which experiments and
observational studies produce comparable causal estimates: New findings from within
study comparisons. Paper presented at the annual meetings of the Society for Research on
Effective Education, Crystal City, VA.
Cooper, H. (1998). Synthesizing research (3rd ed.). Thousand Oaks, CA: Sage.
Corbett, A.T. (2001). Cognitive Tutor results report: 7th grade. Pittsburgh, PA: Carnegie
Learning, Inc.
Corbett, A.T. (2002). Cognitive Tutor results report: 8th & 9th grade. Pittsburgh, PA: Carnegie
Learning, Inc.
Crawford, J., & Raia, F. (1986). Analyses of eighth grade math texts and achievement. Oklahoma
City, OK: Oklahoma City Public Schools, Planning, Research, and Evaluation
Department.
Creswell, J.L., & Hudson, C. (1979). A study of the effects of individualized programmed
mathematics experiments on achievement and attitudes of seventh grade students. (ERIC
Document Reproduction Service No. ED177153)
CSRQ (2007). CSRQ Center report on middle and high school models. Washington, DC: US
Department of Education.
Davidson, R.L. (1985). The effectiveness of computer assisted instruction of Chapter 1 students
in secondary schools. Unpublished doctoral dissertation, University of Tennessee.
Dellario, T.E. (1987). The effects of computer assisted instruction in basic skills courses on high-
risk ninth grade students. Unpublished doctoral dissertation, Western Michigan
University.
Denson, P.S. (1989). A comparison of the effectiveness of the Saxon and Dolciani texts and
theories about the teaching of high school algebra. Unpublished doctoral dissertation,
Claremont Graduate University.
Donovan, J., Sousa, D., & Walberg, H.J. (1987). The impact of staff development on
implementation and student achievement. Journal of Educational Research, 80(6), 348-
351.
Effective Programs in Middle and High School Mathematics
The Best Evidence Encyclopedia is a free web site created by the Johns Hopkins University School of Education’s Center for Data-Driven Reform in Education (CDDRE) under funding from the Institute of Education Sciences, U.S. Department of Education.
52
Dowling, M., & Webb, N. L. (1997a). Comparison on statistics items of grade 9 Interactive
Mathematics Program (IMP) students with algebra students at one high school (Project
Report 97-2). University of Wisconsin–Madison, Wisconsin Center for Education
Research.
Dowling, M., & Webb, N. L. (1997b). Comparison on problem solving and reasoning of grade
10 Interactive Mathematics Program (IMP) students with geometry students at one high
school (Project Report 97-3). University of Wisconsin–Madison, Wisconsin Center for
Education Research.
Dowling, M., & Webb, N. L. (1997c). Comparison on a quantitative reasoning test of grade 11
Interactive Mathematics Program (IMP) students with Algebra II students at one high
school (Project Report 97-4). University of Wisconsin–Madison, Wisconsin Center for
Education Research.
Doyle, D. (1997). The effects of alignment, mastery learning, time on task, peer-tutoring, and
cooperative norms on academic success within cooperative learning groups.
Unpublished doctoral dissertation, State University of New York.
Dreyfus, T., & Eisenberg, T. (1987). On the deep structure of functions. In J. C. Bergeron, N.
Herscovics, & C. Kieran (Eds.). Proceedings of the 11th International Conference for the
PME (Vol. I, pp. 190-196). Montreal, Canada.
Dubois, D.J. (1990). The relationship between selected student team learning strategies and
student achievement and attitude in middle school mathematics. Unpublished doctoral
dissertation, University of Houston.
Duren, P.E., & Cherrington, A. (1992). The effects of cooperative group work versus
independent practice on the learning of some problem-solving strategies. School Science
and Mathematics, 92, 80-83.
Dynarski, M., Agodini, R., Heaviside, S., Novak, T., Carey, N., Campuzano, L., Means, B.,
Murphy, R., Penuel, W., Javitz, H., Emery, D., & Sussex, W. (2007). Effectiveness of
reading and mathematics software products: Findings from the first student cohort.
Washington, DC: Institute of Education Sciences.
Edwards, K.J., & DeVries, D.L. (1972). Learning games and student teams: Their effects on
student attitudes and achievement (Rep. No. 147). Baltimore: Johns Hopkins University,
Center for Social Organization of Schools.
Edwards, K.J. & DeVries, D.L. (1974). The effects of Teams-Games-Tournaments and two
structural variations on classroom process, student attitudes and student achievement.
Effective Programs in Middle and High School Mathematics
The Best Evidence Encyclopedia is a free web site created by the Johns Hopkins University School of Education’s Center for Data-Driven Reform in Education (CDDRE) under funding from the Institute of Education Sciences, U.S. Department of Education.
53
(Report No. 172). Baltimore: Johns Hopkins University, Center for Social Organization
of Schools.
Edwards, K.J., DeVries, D.L., & Snyder, J.P. (1972). Games and teams: A winning combination.
Simulation and Game, 3, 247-269.
Edwards, T., Kahn, S., & Brenton, L. (2001). Math Corps summer camp: An inner city
intervention program. Journal of Education for Students Placed at Risk, 6(4), 411-426.
Elliott, E. L. (1986). The effects of computer-assisted instruction upon the basic skill
proficiencies of secondary vocational education students. Dissertation Abstracts
International, 46 (11), 3329A. (UMI No. 8600439).
Elliot, J., Adams, L., & Bruckman, A. (2002, October). No magic bullet: 3D video games in
education. Proceedings of ICLS 2002, International Conference of the Learning Sciences,
Seattle, Washington.
Elshafei, D. (1998). A comparison of problem-based and traditional learning in Algebra II.
Unpublished doctoral dissertation, Indiana University.
Fan, M. (1990). The effects of cooperative learning and tutoring on academic achievement and
self-concept of Native American students. Unpublished doctoral dissertation, Northern
Arizona University.
Fenigsohn, G.I. (1982). Examining the effects of three methods of study skill group intervention
with middle school underachievers (Doctoral dissertation, College of William and Mary,
1982). DAI-A 43(09), 2892.
Ferrell, B.G. (1986). Evaluating the impact of CAI on mathematics learning: Computer
immersion project. Journal of Educational Computing Research, 2(3), 327-336.
Fields, M.A. (2002). The effect of a three-week TAAS Blitz on overall student performance on the
exit level of the Texas Assessment of Academic Skills test. Unpublished doctoral
dissertation, Texas Southern University.
Franke, R. J. (1987). An evaluation of a computer-assisted instruction program in seventh grade
mathematics: Implications for curriculum planning. Unpublished doctoral dissertation,
State University of New York.
Friedman, T. (2006). The world is flat (2nd
ed.). New York, NY: Farrar, Straus, and Giroux.
Fuchs, L. S., & Fuchs, D. (1991). Curriculum-based measurements current applications and
future directions. Preventing School Failure, 35(3), 6-11.
Effective Programs in Middle and High School Mathematics
The Best Evidence Encyclopedia is a free web site created by the Johns Hopkins University School of Education’s Center for Data-Driven Reform in Education (CDDRE) under funding from the Institute of Education Sciences, U.S. Department of Education.
54
Fuchs, L. S., Fuchs, D., Hamlett, C. L., Phillips, N. B., & Bentz, J. (1994). Classwide
curriculum-based measurement: Helping general educators meet the challenge of student
diversity. Exceptional Children, 60, 518-537.
Funkhouser, C. (2003). The effects of computer-augmented geometry instruction on student
performance and attitudes. Journal of Research on Technology in Education, 35(2), 163-175.
Gaeddert, T. (2001). Using Accelerated Math to enhance student achievement in high school
mathematics courses. Unpublished master's thesis, Friends University.
Gatto, G.G., Hsu, T., Schraw, G., Lehman, S., Cohen, M., & Goodman, T. (2005). Prentice Hall
Algebra 1: Online Intervention System Pilot Study. Project Report. Pittsburgh, PA: Gatti
Evaluation, Inc.
Geiser, W.F. (1998). Effects of learning-style awareness and responsive study strategies on
achievement in, incidence of, study of, and attitude toward mathematics of suburban
eighth-grade students. Unpublished doctoral dissertation, St. John's University.
Gickling, E.E., Shane, R.L., & Croskery, K.M. (1989). Developing mathematics skills in low-
achieving high school students through curriculum-based assessment. School Psychology
Review, 18(3), 344-355
Glazerman, S., Levy, D.M., & Myers, D. (2002). Nonexperimental replications of social
experiments: A systematic review. Washington, DC: Mathematica.
Glencoe Mathematics. (n.d. a). Program-efficacy research for MathScape: The results of a
quasi-experimental study. Columbus, OH: Educational Publishing Research Center.
Glencoe Mathematics. (n.d. b). Research summary for Mathematics: Applications and Concepts,
Courses 1-3. Glencoe/McGraw Hill. Retrieved 4/23/07 from
http://www.glencoe.com/glencoe_research/Math/mac_research_lvrs.pdf
Glencoe Mathematics. (n.d. c). Research summary for Pre-Algebra. Glencoe/McGraw Hill.
Retrieved 4/23/07 from
http://www.glencoe.com/glencoe_research/Math/prealg_research_lvrs.pdf
Gonzales, P., Guzmán, J.C., Partelow, L., Pahlke, E., Jocelyn, L., Kastberg, D., & Williams, T.
(2004). Highlights From the Trends in International Mathematics and Science Study
(TIMSS) 2003 (NCES 2005–005). U.S. Department of Education, National Center for
Education Statistics. Washington, DC: U.S. Government Printing Office.
Effective Programs in Middle and High School Mathematics
The Best Evidence Encyclopedia is a free web site created by the Johns Hopkins University School of Education’s Center for Data-Driven Reform in Education (CDDRE) under funding from the Institute of Education Sciences, U.S. Department of Education.
55
Gordon, A.B. (1985). Cooperative learning: A comparative study of attitude and achievement of
two groups of grade seven mathematics classes. Unpublished doctoral dissertation,
Brigham Young University.
Grossen, B.J. (2002) The BIG accommodation model: The direct instruction model for
secondary schools. Journal of Education for Students Placed at Risk, 7(2), 241-263.
Hakes, A.M. (1986). A comparison between two methods of individualized mathematics
instruction with potential high school dropouts in continuation programs. Unpublished
doctoral dissertation, Northern Arizona University.
Hall, K.A., & Mitzel, H.E. (1974). A pilot program of high school computer assisted instruction
mathematics courses. Educational Technology Systems, 2(3), 157-174.
Hamilton, L. S., McCaffrey, D., Klein, S. P., Stecher, B. M., Eisenshtat Robyn, A., & Bugliari,
D. (2001). Teaching practices and student achievement: Evaluating classroom-based
education reforms. (DRU-2603-EDU). Santa Monica, CA: RAND.
Hamilton, L.S., McCaffrey, D.F., Stecher, B.M., Klein, S.P., Robyn, A., & Bugliari, D. (2003).
Studying large-scale reforms of instructional practice: An example from mathematics and
science. Educational Evaluation and Policy Analysis, (25)1, 1-29.
Hannafin, B. (2002). Evaluation Series, Mashpee High School, Mashpee, MA. Edina, MN:
PLATO Learning, Inc.
Harwell, M. R., Post, T. R., Maeda, Y., Davis, J. D., Cutler, A. L., Adnersen, E., Kahan, J. A.
(2007). Standards-based mathematics curricula and secondary students' performance on
standardized achievement tests. Journal for Research in Mathematics Education, 38(1),
71-101.
Harwood, D.E. (1998). An Evaluation of the Mastery Learning Math Program at Ephraim
Middle School. Unpublished doctoral dissertation, Brigham Young University.
Hasselbring, T., Sherwood, R., Bransford, J., Fleenor, K., Griffith, D., & Goin, L. (1987). An
evaluation of level-one instructional videodisc program. Journal of Educational
Technology Systems, 16(2), 151-169.
Haswell, R.W. (1995). Effectiveness of CPM vs. traditional math. Retrieved November 7, 2006
from http://www.mathematicallycorrect.com/study1.htm
Hatfield, L.L., & Kieren, T.E. (1972). Computer-assisted problem solving in school
mathematics. Journal for Research in Mathematics Education, 3(2), 99-112.
Effective Programs in Middle and High School Mathematics
The Best Evidence Encyclopedia is a free web site created by the Johns Hopkins University School of Education’s Center for Data-Driven Reform in Education (CDDRE) under funding from the Institute of Education Sciences, U.S. Department of Education.
56
Hayman, J.B. (1973). Comparison of attitudes of eleventh-grade students in math classes using
traditional ad experimental textbooks. Unpublished master’s thesis, University of
Chicago.
Hecht, L.W. (1980). Stalking mastery learning in its natural habitat. Paper presented at the
annual meeting of the American Educational Research Association, Boston, MA.
Hedges L., Stodolsky, S., Flores, P.V., Mathison, D., Mathison, S., Sarther, C. & Zhang, J.
(1988). Formative Evaluation of UCSMP Advanced Algebra. Chicago, IL: University of
Chicago School Mathematics Project. Summarized in Advanced Algebra Teacher's
Edition, Scott Foresman (1990), pp. T46-T48.
Hedges, L. V., Stodolsky, S. S., Mathison, S., & Flores, P. V. (1986). Transition Mathematics
Field Study. Chicago, IL: University of Chicago School Mathematics Project.
Hefner, S.W. (1985). The effects of mastery learning/competency-based education instructional
approach on facilitating students' retention of achievement in language arts and
mathematics. Unpublished doctoral dissertation, University of South Carolina.
Henderson, B.K. (1996). An evaluation of the use of UCSMP materials in a mathematics
program. Unpublished doctoral dissertation, Kansas State University.
Heuer, C.M. (2005). Comparison of performance on the Connecticut Academic Performance
Test by students enrolled in a standards-based mathematics program with students
enrolled in a traditional mathematics program. Unpublished master's thesis, Central
Connecticut State University.
Hindley, L.M. (2003). Reactions of LEP (Spanish) students to four methodological approaches
in 9th grade mathematics classes. Unpublished doctoral dissertation, Columbia
University Teachers College.
Hirsch, C. R., & Schoen, H. L. (2002). Developing Mathematical Literacy: A Core-Plus
Mathematics Project Longitudinal Study Progress Report. Core-Plus Mathematics
Project Evaluation Site.
Hirschhorn, D.B. (1991). Implementation of the first four years of the University of Chicago
School Mathematics Project secondary curriculum. (Doctoral dissertation, University of
Chicago, 1991). Dissertation Abstracts International, 53/01, 92.
Hirschhorn, D.B. (1993). A longitudinal study of students completing four years of UCSMP
mathematics. Journal for Research in Mathematics Education, 24(2), 136-158.
Effective Programs in Middle and High School Mathematics
The Best Evidence Encyclopedia is a free web site created by the Johns Hopkins University School of Education’s Center for Data-Driven Reform in Education (CDDRE) under funding from the Institute of Education Sciences, U.S. Department of Education.
57
Hoffman, J.R. (1971). Effects of computer application on generalization skills and achievement
in a second year algebra course. Unpublished doctoral dissertation, University of
Denver.
Holdan, E. G. (1985). A comparison of the effects of traditional, exploratory, distributed, and a
combination of distributed and exploratory practice on initial learning, transfer, and
retention of verbal problem types in first-year algebra. Doctoral dissertation,
Pennsylvania State University.
Hollstein, K. (1998). The relationship between a contextually-based mathematics curriculum and
the mathematics achievement of high school students. Unpublished doctoral dissertation,
Wilmington College.
Holt, Rinehart and Winston Department of Research and Curriculum. (2005). A longitudinal
study of the instructional effectiveness of Mathematics on Context. Research Report.
Austin, TX: Harcourt Education Company.
Hoover, M., Zawojewski, J. S., & Ridgway, J. E. (1997, April). Effects of the Connected
Mathematics Project on student attainment. Paper presented at the meeting of the
American Educational Research Association, Chicago, IL.
Hopkins, B.L. (1978). The effect of a hand-held calculator curriculum in selected fundamentals
of mathematics classes. Unpublished doctoral dissertation, University of Texas at Austin.
Hopmeier, G.H. (1984). The effectiveness of computerized coaching for scholastic aptitude test
in individual and group modes. Unpublished doctoral dissertation, Florida State University.
Howard, M.N. (2003). Preliminary analysis of Project MERIT impact on student performance in
mathematics at grades 6-8. External evaluator research report, Project MERIT.
Hunter, C.T.L. (1994). A study of the effect of instructional method on the reading and
mathematics achievement of Chapter One students in rural Georgia. Unpublished
Doctoral Dissertation, South Carolina State University.
Huntley, M.A., Rasmussen, C.L., Villarubi, R.S., Sangtong, J., & Fey, J.T. (2000). Effects of
standards-based mathematics education: A study of the Core-Plus Mathematics Project
algebra and function strand. Journal for Research in Mathematics Education, 31(3), 328-361.
Instructional Programming Associates. (1990). Project AutoMath: The design, development and
dissemination of an empirically based drill and practice software package for facilitating
mildly handicapped pupil's acquisition of basic math skills: Final report. Washington,
DC: US Department of Office of Special Education and Rehabilitative Services.
Effective Programs in Middle and High School Mathematics
The Best Evidence Encyclopedia is a free web site created by the Johns Hopkins University School of Education’s Center for Data-Driven Reform in Education (CDDRE) under funding from the Institute of Education Sciences, U.S. Department of Education.
58
International Association for the Evaluation of Educational Achievement (IEA) (2003). Trends
in International Mathematics and Science Study (TIMSS), 1995, 1999, and 2003. Boston,
MA: Author.
Jeffrey, J.H. (1980). An experience oriented mastery learning strategy in grade nine algebra: An
experimental study. Unpublished doctoral dissertation, University of Alberta, Edmonton,
Alberta, Canada.
Jhin, K.R. (1971). A statistical comparison of the effectiveness of non-tutorial computer-aided
instruction and conventional teaching of algebra. Unpublished doctoral dissertation,
University of Michigan.
Johnson, D.M., & Smith, B. (1987). An evaluation of Saxon's Algebra Text. Journal of
Educational Research, 81(2), 97-102.
Kemple, J.J., Herlihy, C.M., & Smith, T.J. (2005). Making progress toward graduation: Evidence
from the Talent Development High School model. New York: MDRC.
Kennedy, P. A., Chavkin, N. F., & Raffled, P. (1995). Analysis of the effects of a
mathematics/social work intervention in the middle school. Research in Middle Level
Education, 18, 59-72
Kerstyn, C. (2001). Evaluation of the I CAN Learn® mathematics classroom: First year of
implementation (2000-2001 school year). Tampa, FL: Division of Instruction,
Hillsborough County Public Schools.
Karnasih, I. (1995). Small-group cooperative learning and field-dependence /independence
effects on achievement and affective behaviours in mathematics of secondary school
students in Medan, Indonesia. Unpublished doctoral dissertation, Florida State
University.
Kerstyn, C. (2002). Evaluation of the I CAN Learn® mathematics classroom: Second year of
implementation (2001-2002 school year). Tampa, FL: Division of Instruction,
Hillsborough County Public Schools.
King, B.J. (2003). The effect of integrated teaching styles on the mathematics performance of
eighth grade students in a prealgebra class. Unpublished doctoral dissertation, Walden
University.
Kinney, J.H. (1979). A quasi-experimental study of the effects of a student-tutor and parent
interaction program on the achievement scores of ninth and tenth grade algebra 1 and
general biology classes. Unpublished doctoral dissertation, Peabody College for Teachers
of Vanderbilt University.
Effective Programs in Middle and High School Mathematics
The Best Evidence Encyclopedia is a free web site created by the Johns Hopkins University School of Education’s Center for Data-Driven Reform in Education (CDDRE) under funding from the Institute of Education Sciences, U.S. Department of Education.
59
Kirby, P.C. (2004a). Comparison of I Can Learn and traditionally-taught 8th grade general
math student performance on the California standards test. New Orleans, LA: Ed-cet, inc.
Kirby, P. C. (2004b). Comparison of I CAN Learn® and traditionally-taught 8th grade student
performance on the Georgia Criterion-Referenced Competency Test. Unpublished
manuscript.
Kirby, P.C. (2004c). I CAN Learn in Collier County, FL. New Orleans, LA: Ed-cet, inc.
Kirby, P. C. (2005, January). I CAN Learn® Algebra I in Catoosa County, Georgia. New
Orleans, LA: Ed-cet, inc.
Kirby, P.C. (2005a). Comparison of I CAN Learn® and traditionally-taught 7th and 9th grade
student performance on the Texas Criterion-Referenced Tests, 2000-2004. New Orleans,
LA: Ed-cet, inc.
Kirby, P.C. (2005b). I CAN Learn® results in Milwaukee, Wisconsin. New Orleans, LA: Ed-cet, inc.
Kirby, P. C. (2006a). I CAN Learn® in Orleans Parish Public Schools: Effects on LEAP 8th
Grade Math Achievement, 2003-2004. New Orleans, LA: Ed-cet, Inc.
Kirby, P. C. (2006b). I CAN Learn® in Orleans Parish Public Schools: Effects on LEAP 10th
Grade Math Achievement, 2003-2004. New Orleans, LA: Ed-cet, Inc.
Kirby, P.C. (n.d., New Orleans). I CAN Learn® results in Mississippi. New Orleans, LA: Ed-cet, inc.
Kirby, P.C. (n.d., Ft. Worth). Texas District Performance on TAAS and TAKS, 1999-2003. I CAN
Learn® in Fort Worth Independent School District. Unpublished manuscript.
Kissoon-Singh, S.B. (1996). Cooperative groupings and computer based instruction: The effects
of grouping by ability. Unpublished doctoral dissertation, University of Toronto.
Klein, K., Hamilton, L., McCaffrey, D., Stecher, B., Robyn, A., & Burroughts, D. (2000).
Teaching practices and student achievement: Report of first-year findings from the
"Mosaic" study of Systemic Initiatives in mathematics and science (MR-1233-EDU).
Santa Monica, CA: RAND.
Koedinger, K.R. (2002). Cognitive Tutor results report PA-01-02: Cognitive Tutor 6th grade
math. Pittsburgh, PA: Carnegie Learning, Inc.
Koedinger, K.R., Anderson, J.R., Hadley, W.H., & Mark, M.A. (1997). Intelligent tutoring goes
to school in the big city. International Journal of Artificial Intelligence in Education, 8,
30-43.
Effective Programs in Middle and High School Mathematics
The Best Evidence Encyclopedia is a free web site created by the Johns Hopkins University School of Education’s Center for Data-Driven Reform in Education (CDDRE) under funding from the Institute of Education Sciences, U.S. Department of Education.
60
Konold, K.B. (2004). Using the concrete-representational-abstract teaching sequence to
increase algebra problem-solving skills. Unpublished doctoral dissertation, University of
Nevada, Las Vegas.
Koza, J.L. (1989). Comparison of the achievement of mathematics and reading levels and
attitude toward learning of high-risk secondary students through the use of computer-
aided instruction. Unpublished doctoral dissertation, University of Minnesota.
Kramarski, B. & Hirsch, C. (2003a). Effects of Computer Algebra System (CAS) with
metacognitive training on mathematical reasoning. London: Educational Media
International, Routledge.
Kramarski, B. & Hirsch, C. (2003b). Using Computer Algebra Systems in mathematical
classrooms. Journal of Computer Assisted Learning, 19, 35-45.
Kramarski, B., & Mevarech, Z.R. (2003). Enhancing Mathematical Reasoning in the Classroom:
The Effects of Cooperative Learning and Metacognitive Training. American Educational
Research Journal, 40(1), 281-310.
Kramarski, B. and Mevarech, Z. R. (2004). Ways for new models in mathematics education:
Effects of meta-cognitive training and cooperative learning on mathematics
communication. In J. Wang and B. Xu (Eds.). Trends and challenges in mathematics
education. Shanghai: East China Normal University Press. pp. 15-25.
Kramarski, B., Mevarech, Z.R., & Arami, M. (2002). The effects of metacognitive instruction on
solving mathematical authentic tasks. Educational Studies in Mathematics, 49, 225-250.
Kramarski, B., Mevarech, Z.R., & Lieberman, A. (2001). Effects of multilevel versus unilevel
metacognitive training on mathematical reasoning. Journal of Educational Research, 54
(5), 292-300.
Kramer, S. (2002). The joint impact of block scheduling and a standards-based curriculum on
high school algebra achievement and mathematics course taking. Unpublished doctoral
dissertation, University of Maryland.
Kulik, J. A. (2003). Effects of using instructional technology in elementary and secondary
schools: What controlled evaluation studies say. SRI Project Number P10446.001.
Arlington, VA: SRI International.
Lafferty, J.F. (1994). The links among mathematics text, students' achievement, and students'
mathematics anxiety: A comparison of the incremental development and traditional texts.
Unpublished doctoral dissertation, Widener University.
Effective Programs in Middle and High School Mathematics
The Best Evidence Encyclopedia is a free web site created by the Johns Hopkins University School of Education’s Center for Data-Driven Reform in Education (CDDRE) under funding from the Institute of Education Sciences, U.S. Department of Education.
61
Lake, S., Silver, E.A., & Wang, N. (1995, April) An examination of the performance gains of
culturally and linguistically diverse students on a mathematics performance assessment
within the QUASAR project. Paper presented at the annual meeting of the American
Educational Research Association, San Francisco, CA.
Lambert, M.A. (1996). Teaching students with learning disabilities to solve word-problems: A
comparison of a cognitive strategy and a traditional textbook method. Unpublished
doctoral dissertation, Florida Atlantic University.
Lapan, R. T., Reys, B. J., Barnes, D. E., & Reys, R. E. (1998, April). Standards-based middle
grade mathematics curricula: Impact on student achievement. Paper presented at the
meeting of the American Educational Research Association, San Diego, CA.
(Unpublished manuscript, University of Missouri at Columbia).
Lappan, G., Fey, J.T., Fitzgerald, W.M., Friel, S.N., & Phillips, E.D. (1998). Connected
Mathematics. White Plains, NY: Dale Seymour Publications.
Lawrence, L.K. (1992). The long-term effects of an Incremental Development Model of
instruction upon student achievement and student attitude toward mathematics.
Unpublished doctoral dissertation, University of Tulsa.
Lawson, L.A. (1987). Effects of computer assisted instruction on low achieving students.
Unpublished doctoral dissertation, United States International University.
Le, V., Stecher, B., Lockwood, J. R., Hamilton, L. S., Robyn, A., Williams, V. L., Ryan, G.,
Kerr, K. A., Martinez, J. F., Klein, S. P. (2006). Improving mathematics and science
education: A longitudinal investigation of the relationship between reform-oriented
instruction and student achievement. Santa Monica, CA: RAND Corporation.
Leali, S.A. (1992). Cooperative and individualized learning with computer-assisted instruction
in mathematics for at-risk high school students. Unpublished doctoral dissertation,
University of Denver.
Lee, D.W. (1991). A comparison of the effectiveness between the cooperative and individual
learning on students' achievement and attitudes on a computer-assisted mathematics
problem-solving task. Unpublished doctoral dissertation, University of Iowa.
Legters, N.E., Balfanz, R., Jordan, W.J., & McPartland, J.M. (2002). Comprehensive reform for
urban high schools: A Talent Development approach. New York: Teachers College.
Leinwand, S. (1996). Capturing and sharing success stories. NCSM Newsletter, 25, 1-2.
Effective Programs in Middle and High School Mathematics
The Best Evidence Encyclopedia is a free web site created by the Johns Hopkins University School of Education’s Center for Data-Driven Reform in Education (CDDRE) under funding from the Institute of Education Sciences, U.S. Department of Education.
62
Lesmeister, L.M. (1996). The effect of graphing calculators on secondary mathematics
achievement. Unpublished master’s thesis, University of Houston-Clear Lake.
Lipsey, M. W., & Wilson, D. B. (2001). Practical meta-analysis. Thousand Oaks, CA: Sage.
Liu, X., Macmillan, R., & Timmons, V. (1998). Assessing the impact of computer integration on
students. Journal of Research on Computing in Education, 31(2), 189-203.
Lopez, G.J. (1987). The Comprehensive Math and Science Program (CSMP): A model project to
increase achievement in a first course in high school algebra (1979-1983).
Lott, J., Hirstein, J., Allinger, G., Walen, S., Burke, M., Lundin, M., et al. (2003). Curriculum
and assessment in SIMMS Integrated Mathematics. In S. Senk & D. Thompson (Eds.),
Standards-Based School Mathematics Curricula: What Are They? What Do Students
Learn? (pp.345-374). Mahwah, NJ: Lawrence Erlbaum Associates.
Lugo, A.A., Jr. (2004). The effects of multimedia-based instructional technology on Algebra I
problem-solving skills of ninth through twelfth grade students with learning disabilities.
Unpublished doctoral dissertation, Howard University.
Lynch, S.J., & Mills, C.J. (1993). Identifying and preparing disadvantaged and minority youth
for high-level academic achievement. Contemporary Educational Psychology, 18, 66-76.
Mac Iver, M. A. & Mac Iver, D. J. (2007, April). The impact of Comprehensive School Reform
with NSF-supported mathematics curricula on urban middle grades student mathematics
achievement. Paper presented at the Annual Meeting of the American Educational
Research Association, Chicago, IL.
Mac Iver, D.J., Ruby, A., Balfanz, R., & Byrnes, V. (2003). Removed from the list: A
comparative longitudinal case study of a reconstruction-eligible school. Journal of
Curriculum and Supervision, 18, 259-289.
Mariano, T. (n.d.). A randomized control group study of student achievement on the New York
State Mathematics A Regents High School Examination. Research Report.
Martin, R.L. (2005). Effects of cooperative and individual integrated learning system on
attitudes and achievement in mathematics. Unpublished doctoral dissertation, Florida
International University.
Marty, J.F. (1985). Selected effects of a computer game on achievement, attitude, and graphing
ability in secondary school algebra. Unpublished doctoral dissertation, Oregon State
University.

Effective Programs in Middle and High School Mathematics
The Best Evidence Encyclopedia is a free web site created by the Johns Hopkins University School of Education’s Center for Data-Driven Reform in Education (CDDRE) under funding from the Institute of Education Sciences, U.S. Department of Education.
63
Math Teachers Press, Inc. (1996). Analysis of Dallas ISD summer school session 1996.
Unpublished report.
Math Teachers Press, Inc. (1998). Grand Prairie Independent School District, summer school
1998, grades 6-8 analysis of results. Unpublished report.
Math Teachers Press, Inc. (1999a). Results of Broward summer school 1999, grades 5-8.
Unpublished report.
Math Teachers Press, Inc. (1999b). Results of Minnesota migrant summer school 1999, grades 2-
6. Unpublished report.
Math Teachers Press, Inc. (2000a). Journey to Success summer school 2000, New Orleans Public
Schools: Analysis of results. Unpublished report.
Math Teachers Press, Inc. (2000b). New York School District 7 summer school 2000, grades 1-8
summary of results. Unpublished report.
Math Teachers Press, Inc. (2001). Saturday S.T.A.R.S. 2000-2001 District of Columbia Schools,
grades 1-8 analysis of math results using math by topic. Unpublished report
Math Teachers Press, Inc. (2002a). Analysis of results using the Moving with Math® extensions
program, Arlington County School District, special education, summer school 2002 -
grades 1-6. Unpublished report.
Math Teachers Press, Inc. (2002b). Summer school 2002, District of Columbia Public Schools,
grades 1-6 analysis of math results using Moving with Math® extensions. Unpublished
report.
Math Teachers Press, Inc. (2002c). Summer school 2002, grades 5-8, analysis of math results
using Moving with Math® extensions. Unpublished report.
Mathison, S., Hedges, L.V., Stodolsky, S., Flores, P., & Sarther, C. (1989). Teaching and
learning algebra: An evaluation of UCSMP Algebra. Chicago, IL: University of Chicago
School Mathematics Project.
Mayers, K. (1995). The effects of using Saxon Algebra 1 textbook on the achievement of ninth-
grade Algebra 1 students from 1989-1993. Unpublished doctoral dissertation, Delta State
University.
Mayes, R.L. (1992). The effects of using software tools on mathematical problem solving in
secondary schools. School Science and Mathematics, 92(5), 243-248.

Effective Programs in Middle and High School Mathematics
The Best Evidence Encyclopedia is a free web site created by the Johns Hopkins University School of Education’s Center for Data-Driven Reform in Education (CDDRE) under funding from the Institute of Education Sciences, U.S. Department of Education.
64
McBee, M. (1982). Dolciani versus Saxon: A comparison of two algebra 1 textbooks with high
school students. Oklahoma City, OK: Oklahoma City Public Schools.
McCaffrey, D. F., Hamilton, L. S., Stecher, B. M., Klein, S. P., Bugliari, D., & Robyn, A.
(2001). Interactions among instructional practices, curriculum, and student achievement:
The case of standards-based high school mathematics. Journal for Research in
Mathematics Education, 32(5), 493-517.
McCart, C.L. (1996). Use of an integrated learning system in improving achievement for at-risk
students on the New Jersey Early Warning Test. Unpublished doctoral dissertation,
Temple University.
McCollum, M.A.B. (1988). Achievement and retention in probability and statistics: A
comparison of two teaching strategies. Unpublished doctoral dissertation, University of
Alabama.
McConnell, J. (1990). Performance of UCSMP sophomores on the PSAT. Glenview, IL:
Glenbrook South High School. Internal Report of February 20, 1990.
McCoy, L. P. (1991). The effect of geometry tool software on high school geometry
achievement. Journal of Computers in Mathematics and Science Teaching, 10(3), 51-57.
McDonald, N., Trautman, T., & Blick, L. (2005). Computer-assisted middle school mathematics
remediation intervention: An outcome study. Research Report.
McKenzie, S. (1999). Achievement and affective domains of Algebra I students in traditional or
self-paced computer programs. Unpublished doctoral dissertation, University of Southern
Mississippi.
Merlino, F.J., & Wolff, E. (2001). Assessing the costs/benefits of an NSF "standards-based"
secondary mathematics curriculum on student achievement. The Philadelphia
Experience: Implementing the Interactive Mathematics Program (IMP), Part 1.
Philadelphia, PA: The Greater Philadelphia Secondary Mathematics Project.
Mertens, S.B., Flowers, N., & Mulhall, P.F. (1998). The Middle Start Initiative, Phase I: A
longitudinal analysis of Michigan middle-level schools. Champaign: Center for
Prevention Research and Development, University of Illinois.
Mevarech, Z.R. (1980). The role of teaching-learning strategies and feedback-corrective
procedures in developing higher cognitive achievement. Unpublished doctoral
dissertation, University of Chicago.
Mevarech, Z.R. (1988). Intrinsic Orientation Profiles and Learning Mathematics in CAI Settings.
Journal of Educational Research, 81(4), 228-232.

Effective Programs in Middle and High School Mathematics
The Best Evidence Encyclopedia is a free web site created by the Johns Hopkins University School of Education’s Center for Data-Driven Reform in Education (CDDRE) under funding from the Institute of Education Sciences, U.S. Department of Education.
65
Mevarech, Z.R. (1999). Effects of metacognitive training embedded in cooperative settings on
mathematical problem solving. Journal of Educational Research, 92(4), 195-205.
Mevarech, Z.R., & Kramarski, B. (1994). Cognition, metacognition, and mathematical thinking:
Teaching mathematics in heterogenous classrooms. Paper presented at the annual
meeting of the American Educational Research Association, New Orleans, LA.
Mevarech, Z.R., & Kramarski, B. (1997). IMPROVE: A multidimensional method for teaching
mathematics in heterogeneous classrooms. American Educational Research Journal, 34
(2), 365-394.
Mevarech, Z.R., & Kramarski, B. (2003). The effects of metacognitive training versus worked-
out examples on students' mathematical reasoning. British Journal of Educational
Psychology, 73, 449-471.
Mevarech, Z. R., Tabuk, A., and Sinai, O. (2006). Meta-cognitive Instruction in Mathematics
Classrooms: Effects on the Solution of Different Kinds of Problems. In A Desoete & M.
Veenman (Eds.). Meta-cognition in mathematics. Hauppauge: Nova Science Publishers,
pp. 70-78.
Meyer, T.N., Steuck, K., Miller, T.M., & Kretschmer, M. (2000, April). Multi-year large-scale
field studies of the fundamental skills training project's intelligent tutoring systems. Paper
presented at the annual meeting of the American Educational Research Association, New
Orleans, LA.
Mickens, M. (1991). Effects of supplementary computer-assisted instruction on basic Algebra 1
and basic Algebra 2 achievement levels of mathematics at-risk minority students.
Unpublished doctoral dissertation, Wayne State University.
Miller, R., & Mills, C. (1995). The Appalachia Model Mathematics Program for gifted students.
Roeper Review, 18(2), 138-142.
Mitzel, H.E., Hall, K., Suydam, M., Jansson, L.C., & Igo, R.V. (1971). A commonwealth
consortium to develop, implement and evaluate a pilot program of computer-assisted
instruction for urban high schools: Final report. University Park, PA: Pennsylvania State
University. (ERIC Document Reproduction Service No. ED059604)
Monger, C.T. (1989). Effects of Mastery Learning Strategy on elementary and middle school
mathematics students' achievement and subject related affect. Unpublished doctoral
dissertation, University of Tulsa.
Moore, B.M. (1988). Achievement in basic math skills for low performing students: A study of
teachers' affect and CAI. Journal of Experimental Education, 57 (1), 38-44.
Effective Programs in Middle and High School Mathematics
The Best Evidence Encyclopedia is a free web site created by the Johns Hopkins University School of Education’s Center for Data-Driven Reform in Education (CDDRE) under funding from the Institute of Education Sciences, U.S. Department of Education.
66
Moore, R.C. (1992). Effects of computer assisted instruction and perceptual preference(s) of
eighth-grade students on the mastery of language arts and mathematics (Doctoral
dissertation, South Carolina State University, 1992). DAI-A 53/06, 1876.
Morgan, P., & Ritter, S. (2002). An experimental study of the effects of Cognitive Tutor®
Algebra I on student knowledge and attitude. Pittsburgh, PA: Carnegie Learning, Inc.
Morton, J.R. (1979). An evaluation of the learning effectiveness of a team-taught, individually-
paced instruction program in high school algebra. Unpublished doctoral dissertation,
Memphis State University.
Mosley, J.D. (2006). How does the implementation of self-regulated learning strategies affect the
academic achievement of eighth-grade algebra students. Unpublished doctoral
dissertation, Capella University.
Mosley-Jenkins, P.S. (1995). A comparative study of Applied Math II and Algebra I on
mathematical achievement of high schools in South Carolina. Unpublished doctoral
dissertation, South Carolina State University.
Mueller, M.J. (2000). Middle-level summer school effectiveness as measured by student gains in
achievement and attitude. Unpublished doctoral dissertation, University of Nebraska at
Omaha.
Murphy, R., Penuel, W., Means, B., Korbak, C., Whaley, A., & Allen, J. (2002). E-DESK: A
review of recent evidence on discrete educational software. Menlo Park, CA: SRI
International.
Nathan, M.J., Stephens, A.C., Masarik, K., Alibali, M.W., & Koedinger, K.R. (2002).
Representatial fluency in middle school: A classroom study. In Mewborn, D.S., Sztajn,
D.Y., White, H.G., Wiegel, R.L., Bryant & Nooney K. (Eds.), Proceedings of the annual
meeting of the North American chapter of the International Group for the Psychology of
Mathematics Education. (pp. 463-472). Columbus, OH.
National Assessment of Educational Progress (2005). The nation’s report card. Washington, DC:
National Center for Education Statistics.
National Council of Teachers of Mathematics (1989). Curriculum and evaluation standards for
school mathematics. Reston, VA: NCTM.
National Council of Teachers of Mathematics (2000). Curriculum and evaluation standards for
school mathematics. Reston, VA: NCTM.
Effective Programs in Middle and High School Mathematics
The Best Evidence Encyclopedia is a free web site created by the Johns Hopkins University School of Education’s Center for Data-Driven Reform in Education (CDDRE) under funding from the Institute of Education Sciences, U.S. Department of Education.
67
National Research Council (2004). On evaluating curricular effectiveness. Washington, DC:
National Academies Press.
Nelson, R. (2005). A matched study of Washington State 10th grade assessment scores of
students in schools using Core-Plus Mathematics Program. Obtained March 30, 2007:
http://www.wmich.edu/cpmp/pdfs/04-05WASLReport.pdf
Ngaiyaye, M. S. W., & VanderPloge, A. (1986). Differential effectiveness of three kinds of
computer-assisted instruction. (ERIC Document Reproduction Service No. ED 277335).
Nichols, J.D. (1996). The effects of cooperative learning on student achievement and motivation
in a high school geometry class. Brief research report. Contemporary Educational
Psychology, 21, 467-476.
Norrie, A.L. (1989). Communication of geometrical structure and its relationship to student
mathematical achievement. Unpublished doctoral dissertation, University of Toronto.
Nunnery, J.A, Ross, S.M., & Goldfeder, E. (2003). The effect of School Renaissance on TAAS
scores in the McKinney Independent School District. Memphis, TN: Center for Research
in Educational Policy, University of Memphis.
Northeastern Illinois University, Department of Teacher Education (2000). Use of Interactive
video technology to teach middle school mathematics in Chicago schools. September -
November, 2000. Chicago: Author.
Oescher, J., & Kirby, P. C. (2004, December). I CAN Learn® Results in Dallas, Texas: 9th
grade 2003-2004. New Orleans, LA: JRL Enterprises.
Oladunni, M.O. (1998). An experimental study on the effectiveness of metacognitive and
heuristic problem solving techniques on computational performance of students in
mathematics. International Journal of Mathematics, Science, and Technology, 29(6),
867-874.
Olson, D.A. (1988). The effect of mastery learning and wait time on student achievement and
attitude in seventh and eighth-grade mathematics. Unpublished doctoral dissertation,
Montana State University.
Olson, J.M. (2004). The effect of algebra support on students’ achievement of mathematically at-
risk high school students. Unpublished doctoral dissertation, Arizona State University.
Osmundson, E., & Herman, J. (2005). Math and Science Academy: Year 4 Evaluation Report.
Los Angeles: CRESST, University of California.
Effective Programs in Middle and High School Mathematics
The Best Evidence Encyclopedia is a free web site created by the Johns Hopkins University School of Education’s Center for Data-Driven Reform in Education (CDDRE) under funding from the Institute of Education Sciences, U.S. Department of Education.
68
Parker, J.K. (1990). Effects of an incremental continuous review homework format on seventh
grade mathematics achievement. Unpublished doctoral dissertation, University of the
Pacific.
Pattison Moore, J.L. (2003). The effect of classroom implementation of prescriptive staff
development on the mathematics achievement of secondary school students. Unpublished
doctoral dissertation, University of Houston.
Perkins, S.A. (1987). The effect of computer-assisted instruction on MEAP mathematics
achievement and attitudes toward mathematics and computers in grades four and seven
(Doctoral dissertation, University of Michigan, 1987). Dissertation Abstracts
International, 49, 197A.
Peters, K. G. (1992). Skill performance comparability of two algebra programs on an eighth-
grade population. Dissertation Abstracts International, 54(01), 77A. (UMI No. 9314428).
Pierce, R.D. (1984). A quasi-experimental study of Saxon's Incremental Development Model and
its effects on student achievement in first-year algebra. Unpublished doctoral dissertation,
University of Tulsa.
Plano, G.S. (2004). The effects of the Cognitive Tutor Algebra on student attitudes and
achievement in a 9th grade algebra course. Unpublished doctoral dissertation, Seton Hall
University.
Plano, G.S., Ramey, M., & Achilles, C.M. (2007, January). Implications for student learning
using a technology-based algebra program in a ninth-grade algebra course. Paper
presented at the 13th Annual Office of Superintendent of Public Instruction January
Conference and High School Summit, Seattle, WA.
Plude, M. (1992). Middlebrook Math recommendation (1992-1994) and Transition Math testing
results. Internal Report of March 25, 1992. Wilton, CT: Middlebrook School.
Plude, M. (1993). Transition Math report and Middlebrook Math recommendation (1993-1994).
Internal Report of May, 1993. Wilton, CT: Middlebrook School.
Poore, J. H., & Hamblen, J. W. (1983). Improvement of basic mathematical skills with PLATO:
An experiment. Association for Educational Data Systems Journal, Summer 1983, 224-259.
Portis, L.B. (1991). The effect of computer-managed instruction on Algebra 1 achievement.
Unpublished doctoral dissertation, University of North Carolina at Chapel Hill.
Post, T. R., Davis, J. D., Maeda, Y., Cutler, A., Anderson, E., Kahan, J. A., & Harwell, M. R.
(2004). Standards-based mathematics curricula and middle grade students’ performance
on standardized achievement tests. Report submitted to the Division of Elementary,
Effective Programs in Middle and High School Mathematics
The Best Evidence Encyclopedia is a free web site created by the Johns Hopkins University School of Education’s Center for Data-Driven Reform in Education (CDDRE) under funding from the Institute of Education Sciences, U.S. Department of Education.
69
Secondary, and Informal Education, within the Directorate for Education and Human
Resources, a division of the National Science Foundation.
Portal, J., & Sampson, L. (2001). Improving high school students' mathematics achievement
through the use of motivational strategies. Masters of Arts Action Research Project, St.
Xavier University.
Rehagg, D.M., & Szabo, M. (1995). An experiment on effects of redundant audio in computer
based instruction on achievement, attitude, and learning time in 10th grade math. Paper
presented at the annual meeting of the Association for Educational Communications and
Technology. (ERIC Document Reproduction Service No. ED380123)
Reid, J. (1992). The effects of cooperative learning with intergroup competition on the math
achievement of seventh grade students. (ERIC Document Reproduction Service No. ED
355106.)
Rentschler, R. V. (1994). The effects of Saxon's incremental review on computational skills and
problem-solving achievement of sixth-grade students. Doctoral dissertation, Walden
University. Dissertation Abstracts International, 56(02), 484A.
Resendez, M., & Azin, M. (2005). A study on the effectiveness of the 2004 Prentice Hall Course
2 Middle School Math Program. Research report. Jackson, WY: Pres Associates.
Resendez, M., & Azin, M. (2006). Saxon Math Randomized Control Trial: Final report.
Jackson, WY: PRES Associates, Inc.
Resendez, M., & Azin, M. (2007). The relationship between using Saxon elementary and middle
school math and student performance on California statewide assessments: Final report.
Jackson, WY: PRES Associates, Inc.
Resendez, M., Fahmy, A., & Azin, M. (2005). The relationship between using Saxon Middle
School Math and Student Performance on Texas Statewide Assessments. Jackson, WY:
Pres Associates.
Resendez, M., & Azin, M. (2005b). A Study on the Effectiveness of the 2004 Prentice Hall
Course 2 Middle School Math Program. Research Report. Jackson, WY: Pres Associates.
Resendez, M., & Azin, M. (2005c). The relationship between using Saxon elementary and
middle school math and student performance on Georgia statewide assessments.
Research Report. Jackson, WY: Pres Associates.
Resendez, M., & Manley, M. (2004). Prentice Hall Algebra 1 program pilot study: Final report.
Jackson, WY: PRES Associates, Inc.

Effective Programs in Middle and High School Mathematics
The Best Evidence Encyclopedia is a free web site created by the Johns Hopkins University School of Education’s Center for Data-Driven Reform in Education (CDDRE) under funding from the Institute of Education Sciences, U.S. Department of Education.
70
Resendez, M., & Sridharan, S. (2005). A study on the effectiveness of the 2004 Prentice Hall
Algebra 1 program: Technical report. Jackson, WY: PRES Associates, Inc.
Reys, R., Reys, B., Lapan, R., Holliday, G., & Wasman, D. (2003). Assessing the impact of
standards-based middle grades mathematics curriculum materials on student
achievement. Journal for Research in Mathematics Education, 34(1), 74-95.
Reys, R., Reys, B., Tarr, J., & Chavez, O. (2006). Assessing the impact of standards-based
middle school mathematics curricula on student achievement and classroom learning
environment. Final report. Retrieved from
http://mathcurriculumcenter.org/MS2_report.pdf.
Ridgway, J. E., Zawojewski, J. S., Hoover, M. N., & Lambdin, D. V. (2002). Student attainment
in the Connected Mathematics curriculum. In S. L. Senk & D. R. Thompson (Eds.),
Standards-based school mathematics curricula: What are they? What do students learn?
(pp. 193-224). Mahwah, NJ: Lawrence Erlbaum Associates, Inc
Riley, A. H. J. (1997). Student achievement and attitudes in mathematics: An evaluation of the
Twenty-First Century Mathematics Center for Urban High Schools. Unpublished
doctoral dissertation, Temple University, Philadelphia, PA.
Riley, E. (2000). The effect of metacognition and strategic training embedded in cooperative
settings on mathematics performance of at-risk students. Unpublished doctoral
dissertation, Walden University.
Rinaldi, I.L. (1997). A study of the effects of computer-assisted instruction and teacher
instruction on achievement in mathematics. Unpublished master's thesis, Eastern
Michigan University.
Riordan, J. E., & Noyce, P. E. (2001). The impact of two standards-based mathematics curricula
on student achievement in Massachusetts. Journal for Research in Mathematics
Education, 32 (4), 368-398.
Riordan, J. E., Noyce, P. E., & Perda, D. (2003). The impact of two standards-based mathematics
curricula on student achievement in Massachusetts: A follow-up study of Connected
Mathematics. Journal for Research in Mathematics Education, 32 (4), 368-398.
Roberts, F.H. (1994). The impact of the Saxon Mathematics program on group achievement test
scores. Unpublished doctoral dissertation, University of Southern Mississippi.
Robitaille, D.F., Sherrill, J.M., & Kaufman, D.M. (1977). The effect of computer utilization on
the achievement and attitudes of grade nine mathematics students. Journal for Research
in Mathematics Education, 1, 26-32.
Effective Programs in Middle and High School Mathematics
The Best Evidence Encyclopedia is a free web site created by the Johns Hopkins University School of Education’s Center for Data-Driven Reform in Education (CDDRE) under funding from the Institute of Education Sciences, U.S. Department of Education.
71
Rockwell, B. (2004). How well does an Algebra I intervention program help students learn the
algebra content and pass the required course? Unpublished master’s thesis, California
State University, Dominguez Hills.
Rodgers, K.V. (1995). The effects on achievement, retention of mathematical knowledge, and
attitudes toward mathematics as a result of supplementing the traditional Algebra II
curriculum with graphing calculator activities. Unpublished doctoral dissertation,
Southern Illinois University at Carbondale.
Romberg, T. A., & Shafer, M. C. (2003). Mathematics in Context (MiC) Preliminary evidence
about student outcomes. In S.L. Senk & D.R. Thompson. Standards-based School
Mathematics Curricula: What are They? What Do Students Learn? Mahway, NJ:
Lawrence Erlbaum, pp. 225-250.
Romberg, T. A., & Shafer, M. C. (in press). The Impact of Reform Instruction on Student
Mathematics Achievement: An Example of a Summative Evaluation of a Standards-Based
Curriculum. Technical reports retrieved from http://micimpact.wceruw.org/.
Rose, L.L. (2001). The use of software with low-achieving students: Effects on mathematics
attitude and achievement. Unpublished doctoral dissertation, Columbia University.
Rosenberg, J.P. (1989). A constructivist approach to computer-assisted mathematics instruction.
Unpublished doctoral dissertation, Stanford University.
Ross, J.A. & Bruce, C. (2006, April). The impact of a professional development program on
student achievement in grade 6 mathematics. Paper presented at the annual meeting of
the American Education Research Association, San Francisco, CA.
Ross, S.M., & Nunnery, J.A. (2005). The effect of School Renaissance on student achievement in
two Mississippi school districts. Memphis, TN: Center for Research in Educational
Policy, University of Memphis.
Ross, S., Nunnery, J., Avis, A., & Borek, T. (2005). The effects of School Renaissance on student
achievement in two Mississippi school districts: A longitudinal quasi-experimental study.
Memphis: TN: CREP.
Roulier, L.R. (1999). Effects of goal setting procedures on students' mathematical achievement
and self-efficacy. Unpublished doctoral dissertation, University of Connecticut.
Sample, C.R. (1998). Urban Algebra 1 students' perceptions of journal writing and its effects on
achievement with integers and students' attitudes toward mathematics. Unpublished
doctoral dissertation, University of Mississippi.
Effective Programs in Middle and High School Mathematics
The Best Evidence Encyclopedia is a free web site created by the Johns Hopkins University School of Education’s Center for Data-Driven Reform in Education (CDDRE) under funding from the Institute of Education Sciences, U.S. Department of Education.
72
Sanders, B.B. (1997). The effects of using the Saxon mathematics method of instruction vs. a
traditional method of mathematical instruction on the achievement of high school juniors.
Americus, Georgia: Georgia Southwestern State University.
San Juan Unified School District, Accountability and Organizational Evaluation Department
(2001). Connecting Math Concepts: An evaluation of first implementation year.
Retrieved from http://www.sanjuan.edu/accountability/program-evaluations/connecting-
math-2001.pdf
San Juan Unified School District, Accountability and Organizational Evaluation Department
(2003). Evaluation of Connecting Math Concepts year 2. Retrieved from
http://www.sanjuan.edu/accountability/program-evaluations/connecting-math-2002.pdf
Sarkis, H. (2004). Cognitive Tutor Algebra 1 program evaluation. Miami-Dade County public
schools. research report. Lighthouse Point, FL: The Reliability Group.
Saunders, J. (1978). The effects of using computer-enhanced resource materials on achievement
and attitudes in second year algebra. Unpublished doctoral dissertation, University of
Pittsburgh.
Saxon, J. (1982). Incremental development: A breakthrough in mathematics. Phi Delta Kappan,
63(7), 482-484.
Schneider, C. (2000). Connected Mathematics and the Texas Assessment of Academic Skills.
Unpublished doctoral dissertation, University of Texas at Austin.
Shneyderman, A. (2001). Evaluation of the Cognitive Tutor Algebra I Program. Miami, FL:
Miami-Dade County Public Schools Office of Evaluation and Research.
Schoen, H.L. (1993). Report to the National Science Foundation on the impact of the Interactive
Mathematics Project (IMP). In N.L. Webb, H. Schoen, & S.D. Whitehurst (Eds.),
Dissemination of nine precollege mathematics instructional materials projects funded by
the National Science Foundation, 1981-1991. Madison, WI: Wisconsin Center for
Education Research.
Schoen, H.L., Hirsch, C.R., & Ziebarth, S.W. (1998, April). An emerging profile of the
mathematical achievement of students in the Core-Plus Mathematics Project. Paper
presented at the Annual Meeting of the American Research Association, San Diego, CA.
Schoen, H.L., & Hirsch, C.R. (2002). Developing mathematical literacy: A preliminary report.
Unpublished manuscript.
Effective Programs in Middle and High School Mathematics
The Best Evidence Encyclopedia is a free web site created by the Johns Hopkins University School of Education’s Center for Data-Driven Reform in Education (CDDRE) under funding from the Institute of Education Sciences, U.S. Department of Education.
73
Schoen, H.L., & Hirsch, C.R. (2003a). Responding to calls for change in high school
mathematics: Implications for collegiate mathematics. The American Mathematical
Monthly, 110(2), 109-123.
Schoen, H.L., & Hirsch, C.R. (2003b). The Core-Plus Mathematics Project: perspectives and
student achievement. In S.L. Senk and D.R. Thompson (Eds.), Standards-oriented school
mathematics curricula: What are they? What do students learn? (pp. 311-343). Manwah,
NJ. Lawrence Erlbaum Associates.
Schoen, H.L., & Pritchett, J. (1998, April). Students' perceptions and attitudes in a standards-
based high school mathematics curriculum. Paper presented at the annual meeting of the
American Educational Research Association, San Diego, CA.
Schoenfeld, A.H. (2006). What doesn’t work: The challenge and failure of the What Works
Clearinghouse to conduct meaningful reviews of studies of mathematics curricula.
Educational Researcher, 35 (2), 13-21.
Sedlmeier, P., & Gigerenzer, G. (1989). Do studies of statistical power have an effect on the
power of studies? Psychological Bulletin, 105, 309-316.
Segars. J.E. (1994). Selected factors associated with eighth-grade mathematics achievement.
Unpublished doctoral dissertation, Mississippi State University.
Semones, M., & Springer, R.M. (2005). Struggling high school students using Accelerated Math
pass AIMS test. Wisconsin Rapids, WI: Renaissance Learning.
Senk, S. (1991, April). Functions, statistics, and trigonometry with computers at the high school
level. Paper presented at the annual meeting of the American Educational Research
Association., Chicago, IL.
Shadish, W.R., Cook, T.D., & Campbell, D.T. (2002). Experimental and quasi-experimental
designs for generalized causal inference. Boston: Houghton-Mifflin.
Shafer, M. C. (2003, April). The impact of Mathematics in Context on student achievement:
Preliminary findings. Paper presented at the meeting of the National Council of Teachers
of Mathematics, San Antonio, TX
Sherman, L.W., & Thomas, M. (1986). Mathematics achievement in cooperative versus
individualistic goal-structured high school classrooms. Journal of Educational Research,
79(3), 169-172.
Shiloh, R.K. (1987). Effects of teaching problem-solving with a problem-solving method of
teaching algebra on achievement of selected high school average minority students.
Unpublished doctoral dissertation, Temple University.
Effective Programs in Middle and High School Mathematics
The Best Evidence Encyclopedia is a free web site created by the Johns Hopkins University School of Education’s Center for Data-Driven Reform in Education (CDDRE) under funding from the Institute of Education Sciences, U.S. Department of Education.
74
Shipe, R. et al. (1986). An evaluation of the Mastering Fractions Level-One Instructional
Videodisc Program. Knoxville, TN: Tennessee Valley Authority & George Peabody
College for Teachers, Learning Technology Center.
Signer, B.R. (1982). A formative and summative evaluation study of a project integrating the
microcomputer with second year high school algebra instruction. Unpublished doctoral
dissertation, University of South Florida.
Simon, C., & Tingey, B. (2003a). Reading, PA School District efficacy analysis for 2001-2002
PSSA and SuccessMaker. Scottsdale, AZ: Pearson Education Technologies.
Simon, C., & Tingey, B. (2003b). Aiken County Schools: On target analysis for 2001-2002
PACT and SuccessMaker. Scottsdale, AZ: Pearson Education Technologies.
Slavin, R. E. (1986) Best-evidence synthesis: An alternative to meta-analytic and traditional
reviews. Educational Researcher, 15, (9), 5-11.
Slavin, R. E. (1995). Cooperative learning: Theory, research, and practice. Boston: Allyn &
Bacon.
Slavin, R.E. (2007). What works? Issues in synthesizing educational program evaluations.
Educational Research, 37(1), 5-14.
Slavin, R.E., & Karweit, N.L. (1984). Mastery learning and student teams: A factorial
experiment in urban general mathematics classes. American Educational Research
Journal, 21(4), 725-736,
Slavin, R.E., & Lake, C. (in press). Effective programs for elementary school mathematics: A
best evidence synthesis. Review of Educational Research.
Slavin, R.E., Cheung, A., Groff, C., & Lake, C. (2008). Effective programs in middle and high
school reading: A best-evidence synthesis. Reading Research Quarterly, 43 (3), 290-322.
Smith, B. (2002). The impact of the utilization of advantage learning systems' technology on
students' academic achievement. Unpublished doctoral dissertation, Tennessee State
University.
Smith, D.K.P. (1992). The effect of a computer-based Integrated Learning System on the
academic achievement of high school students by race and learning style. Unpublished
doctoral dissertation, Oklahoma State University.
Smith, J.E. (2001). The effect of the Carnegie Algebra Tutor on student achievement and attitude
in introductory high school algebra. Unpublished doctoral dissertation, Virginia
Polytechnic Institute and State University.
Effective Programs in Middle and High School Mathematics
The Best Evidence Encyclopedia is a free web site created by the Johns Hopkins University School of Education’s Center for Data-Driven Reform in Education (CDDRE) under funding from the Institute of Education Sciences, U.S. Department of Education.
75
Sobol, A.J. (1998). A formative and summative evaluation study of classroom interactions and
student/teacher effects when implementing Algebra Tile manipulatives with junior high
school students. Unpublished doctoral dissertation, St. John’s University.
Souhrada, T.A. (2001). Secondary school mathematics in transition: A comparison study of
mathematics curricula and student results. Unpublished doctoral dissertation, University
of Alabama.
Spicuzza, R., & Ysseldyke, J. (1999). Using Accelerated Math to enhance instruction in a
mandated summer school program. University of Minnesota, Minneapolis, MN: National
Center on Educational Outcomes.
Stucki, J. (2005). Wayzata High School, Plymouth, MN: Mathematics program evaluation.
Retrieved from http://www.wmich.edu/cpmp/pdfs/wayzata.pdf
Sugar, W. (2001). Evaluation Series, Forest Grove High School, Forest Grove, OR.
Bloomington, MN: PLATO Learning, Inc.
Sullivan, V.W. (1987). A comparison of student achievment using mastery math and traditional
teaching methods. Unpublished doctoral dissertation, University of Utah.
Suppes, P., Zanotti, M., & Smith, N. (1991). Effectiveness of the CCC CAI Program - Fort
Worth Parochial Schools: Global evaluation for 1990-91. Palo Alto, CA: Computer
Curriculum Corporation.
Swafford, J.O., & Kepner, H.S. (1980). The evaluation of an application-oriented first-year
algebra program. Journal for Research in Mathematics Education, 11, 190-201
Swann, J. M. (1996, April). An investigation into the effectiveness of Transition Mathematics.
Paper presented at the American Educational Research Association Annual Conference,
New York, NY.
Swoope, R.B. (1983). The development and evaluation of an instructional program in problem-
solving strategies for second year algebra students. Unpublished doctoral dissertation,
Clark University.
Tauer, S. (2002). How does the use of two different mathematics curricula affect student
achievement? A comparison study in Derby, Kansas. Obtained March 30, 2007:
http://www.wmich.edu/cpmp/pdfs/derby.pdf
Thayer, J. (1992). The effect of the use of computer assisted instruction (CAI) on attitudes and
computational scores of developmental mathematics students at two inner-city school
with predominantly Black enrollment. Unpublished doctoral dissertation, Florida
International University.
Effective Programs in Middle and High School Mathematics
The Best Evidence Encyclopedia is a free web site created by the Johns Hopkins University School of Education’s Center for Data-Driven Reform in Education (CDDRE) under funding from the Institute of Education Sciences, U.S. Department of Education.
76
Thomson, S., Cresswell, J., & De Bortoli, L. (2003). Facing the future: A focus on mathematical
literacy among Australian 15-year-old students in PISA 2003. Camberwell, Victoria
(Australia): OECD.
Thompson, D. R. (1992). An evaluation of a new course in pre-calculus and discrete
mathematics. Unpublished doctoral dissertation, University of Chicago.
Thompson, D.R., & Senk, S.L. (2001). The effects of curriculum on achievement in second-year
algebra: The example of the University of Chicago School Mathematics Project. Journal
for Research in Mathematics Education, 32(1), 58-84.
Thompson, D.R., Senk, S.L., Witonsky, D., Usiskin, Z., Kaeley, G. (2001). An evaluation of the
second edition of UCSMP Advanced Algebra. Chicago, IL: University of Chicago School
Mathematics Project.
Thompson, D.R., Senk, S.L., Witonsky, D., Usiskin, Z., Kaeley, G. (2005). An evaluation of the
second edition of UCSMP Transition Mathematics. Chicago, IL: University of Chicago
School Mathematics Project.
Thompson, D.R., Senk, S.L., Witonsky, D., Usiskin, Z., Kaeley, G. (2006). An evaluation of the
second edition of UCSMP Algebra. Chicago, IL: University of Chicago School
Mathematics Project.
Thompson, D.R., Witonsky, D., Senk, S.L., Usiskin, Z., Kaeley, G. (2003). An evaluation of the
second edition of UCSMP Geometry. Chicago, IL: University of Chicago School
Mathematics Project.
Torgerson, C. (2006). The quality of systematic reviews of effectiveness in literacy learning in
English: A ‘tertiary’ review. Journal of Research in Reading, 29 (2), 1-29.
Torres, M. (1999). Effects of extending mathematics instruction through a Saturday Academy to
Limited English Proficient Latino students in low performing schools. Unpublished
doctoral dissertation, University of California.
Ubario, R.C. (1987). The effectiveness of two methods employed in teaching Algebra 1.
Unpublished doctoral dissertation, California State University, Long Beach.
Underwood, J., Cavendish, S., Dowling, S., Fogelman, K., & Lawson, T. (1996). Are integrated
learning systems effective learning support tools? Computers and Education, 26(1-3), 33-
40.
Urion, D., & Davidson, N.A. (1992). Student achievement in small-group instruction versus
teacher-centered instruction in mathematics. PRIMUS, 2(3), 257-264.
Effective Programs in Middle and High School Mathematics
The Best Evidence Encyclopedia is a free web site created by the Johns Hopkins University School of Education’s Center for Data-Driven Reform in Education (CDDRE) under funding from the Institute of Education Sciences, U.S. Department of Education.
77
Usiskin, S.P. (1972). The effects of teaching Euclidean Geometry via transformations on student
achievement and attitudes in tenth-grade geometry. Journal for Research in Mathematics
Education, 3: 249-259.
Usiskin, S.P. & Bernhold, J. (1973). Three reports on a study of intermediate mathematics.
(ERIC Document Reproduction Service No. ED 085255.)
Verkaik, M. (2001). CPMP student performance at Holland Christian High School. Retrieved
from http://www.umich.edu/cpmp/pdfs/Holland_Chrtn_Stud_Achieve.pdf
Walker, R.K. (1999). Students' conceptions of mathematics and the transition from a standards-
based reform curriculum to college mathematics. Unpublished doctoral dissertation,
Western Michigan University.
Wang, C., & Owens, T.R. (1995). The Boeing Company applied academics project evaluation:
Year four. Evaluation report. Portland, OR: Northwest Regional Educational Laboratory.
(ERIC Document Reproduction Service No. ED381892)
Wasman, D. (2000). An investigation of algebraic reasoning of seventh- and eighth-grade
students who have studied from the Connected Mathematics Project curriculum.
(Doctoral dissertation, Western Michigan University, 2000). Dissertation Abstracts
International, 61(09), 3498A. (UMI No. 9988711)
Watkins, J.P. (1991) Long-term effects of an integrated microcomputer project on subsequent
science and mathematics achievement in Arkansas schools. Unpublished doctoral
dissertation, University of Arkansas.
Watson, M. (1996). The Impact of a New Program for Teaching Algebra to Increase
Achievement and Persistence in Mathematics. Unpublished doctoral dissertation,
Claremont Graduate School.
Webb, D. C., Burrill, J., Romberg, T. A., Ford, M., Kwako, J., & Reif, J. (2001). NCISLA middle
school design collaborative second year student achievement technical report. Madison,
WI: University of Wisconsin, National Center for Improving Student Learning and
Achievement in Mathematics and Science.
Webb, N. L. (2003). The impact of the Interactive Mathematics Program on student learning. In
S. Senk and D. Thompson (Eds.) Standards-oriented school mathematics curricula: What
does the research say about student outcomes? Mahwah, NJ: Erlbaum
Webb, N. L., & Dowling, M. (1995a). Impact of the Interactive Mathematics Program on the
retention of underrepresented students: Class of 1993 transcript report for school 1,
“Brooks High School” (Project Report 95-3). University of Wisconsin–Madison,
Wisconsin Center for Education Research.
Effective Programs in Middle and High School Mathematics
The Best Evidence Encyclopedia is a free web site created by the Johns Hopkins University School of Education’s Center for Data-Driven Reform in Education (CDDRE) under funding from the Institute of Education Sciences, U.S. Department of Education.
78
Webb, N. L., & Dowling, M. (1995b). Impact of the Interactive Mathematics Program on the
retention of underrepresented students: Class of 1993 transcript report for school 2,
“Hill High School” (Project Report 95-4). University of Wisconsin–Madison, Wisconsin
Center for Education Research.
Webb, N. L., & Dowling, M. (1995c). Impact of the Interactive Mathematics Program on the
retention of underrepresented students: Class of 1993 transcript report for school 3,
“Valley High School.” (Project Report 95-5). University of Wisconsin–Madison,
Wisconsin Center for Education Research.
Webb, N. L., & Dowling, M. (1996). Impact of the Interactive Mathematics Program on the
retention of underrepresented students: Cross-school analysis of transcripts for the class
of 1993 for three high schools (Project Report 96-2). University of Wisconsin–Madison,
Wisconsin Center for Education Research.
Webb, N. L., & Dowling, M. (1997a). Comparison of IMP students with students enrolled in
traditional courses on probability, statistics, problem solving, and reasoning (Project
Report 97-1). University of Wisconsin–Madison, Wisconsin Center for Education
Research.
Webb, N. L., & Dowling, M. (1997b). Replication study of the comparison of IMP students with
students enrolled in traditional courses on probability, statistics, problem solving, and
reasoning (Project Report 97-5). University of Wisconsin–Madison, Wisconsin Center
for Education Research.
Whalten (1988). A comparison of CAI and traditional classroom instruction on seventh graders'
computational estimation skills.
What Works Clearinghouse (2007a). Middle school math curricula. Washington, DC: U.S.
Department of Education. Retrieved May 1, 2007, from
http://www.whatworks.ed.gov/Topic.asp?tid=03&ReturnPage=default.asp
What Works Clearinghouse (2007b). Elementary school math curricula. Washington, DC: U.S.
Department of Education. Retrieved May 1, 2007, from
http://www.whatworks.ed.gov/Topic.asp?tid=04&ReturnPage=default.asp
Wheeler, J.L., & Regian, J.W. (1999). The use of a cognitive tutoring system in the
improvement of the abstract reasoning component of word problem solving. Computers
in Human Behavior, 15, 243-254.
Whicker, K.M., Bol, L., & Nunnery, J.A. (1997). Cooperative learning in the secondary
mathematics classroom. Journal of Educational Research, 91(1), 42-48.

Effective Programs in Middle and High School Mathematics
The Best Evidence Encyclopedia is a free web site created by the Johns Hopkins University School of Education’s Center for Data-Driven Reform in Education (CDDRE) under funding from the Institute of Education Sciences, U.S. Department of Education.
79
White, A.M. (2000). Relationships among three organizational methods of teaching mathematics
in selected middle school classes. Unpublished doctoral dissertation, Southern Illinois
University at Edwardsville.
White, M.E. (1996). Effects of homework prescriptions based upon individual learning-style
preferences on the achievement and attitude toward mathematics of sixth-grade students.
Unpublished doctoral dissertation, University of Alabama.
White, P., Gamoran, A., Smithson, J., & Porter. A.C. (1996). Upgrading the high school math
curriculum: Math course-taking patterns in seven high schools in California and New
York. Educational Evaluation and Policy Analysis, 18(4), 285-307.
Wilkins, C.W. (1993). Effects of using a problem solving approach to Algebra I instruction.
(ERIC Document Reproduction Service No. ED372934)
Williams, D.D. (1986). The incremental method of teaching Algebra 1. Research report,
University of Missouri-Kansas City.
Williams, E. (1994). A comparative study of Applied Mathematics I and II versus traditional
Algebra I. Unpublished doctoral dissertation, University of Arkansas.
Williams, M.S. (1988). The effects of cooperative team learning on student achievement and
student attitude in the algebra classroom. Unpublished doctoral dissertation, University
of Alabama.
Winking, D. (1998). The Minneapolis Connected Mathematics Project: Year two evaluation.
Retrieved from Minneapolis Public Schools, Teacher and Instructional Services. Website:
http://tis.mpls.k12.mn.us/sites/5df1b159-7ce3-4aa3-8e71-
8e60a7b98e6c/uploads/connected_mathematics_2.pdf
Wood, F.R. (2006). The relationship between the measured changes in mathematics scores of
eighth grade New Jersey students and the implementation of a standards-based
mathematics program. Unpublished doctoral dissertation, Widener University.
Woodward, J., & Brown, C. (2006). Meeting the curricular needs of academically low-achieving
students in middle grade mathematics. The Journal of Special Education, 40(3), 151-159.
Wu, M. (2003). The effects of a Generalizable Mathematics Skills Instructional Intervention on
the mathematics achievement of learners in secondary CTE programs. Journal of
Industrial Teacher Education, 40(2), 23-50.
Yen, F.B. (1986). An intervention study in mathematical problem solving among selected junior
high school students. Unpublished doctoral dissertation, University of California at Los
Angeles.
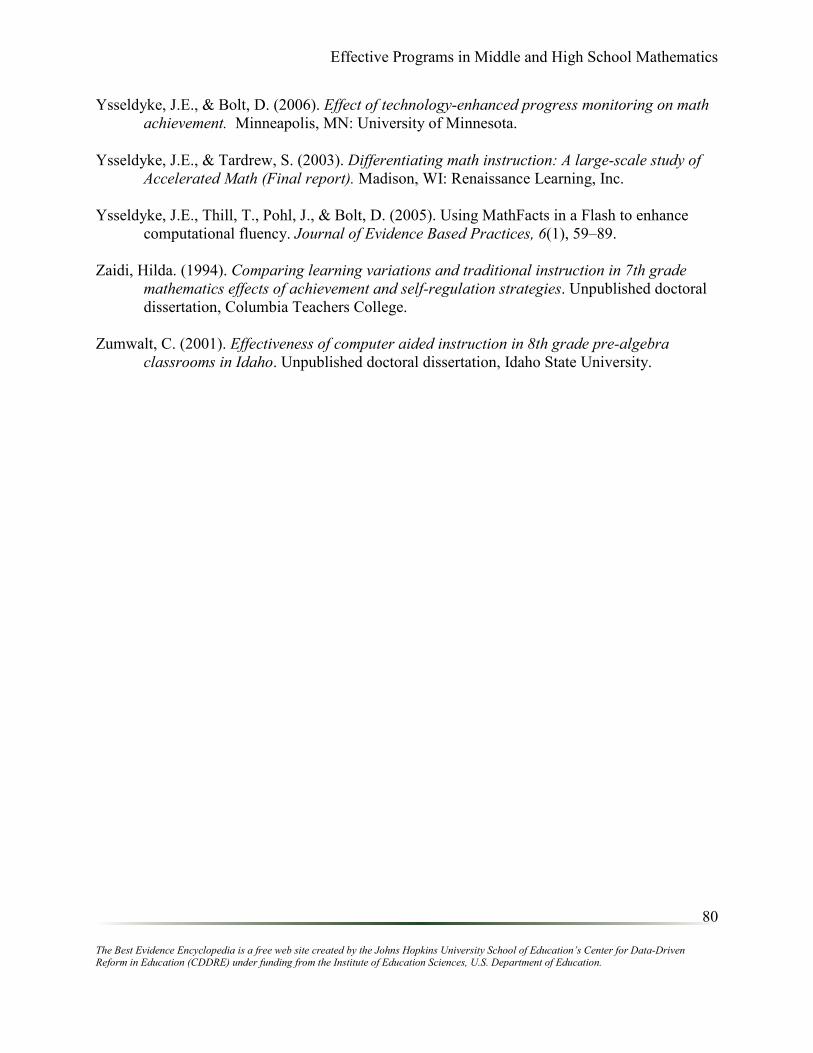
Effective Programs in Middle and High School Mathematics
The Best Evidence Encyclopedia is a free web site created by the Johns Hopkins University School of Education’s Center for Data-Driven Reform in Education (CDDRE) under funding from the Institute of Education Sciences, U.S. Department of Education.
80
Ysseldyke, J.E., & Bolt, D. (2006). Effect of technology-enhanced progress monitoring on math
achievement. Minneapolis, MN: University of Minnesota.
Ysseldyke, J.E., & Tardrew, S. (2003). Differentiating math instruction: A large-scale study of
Accelerated Math (Final report). Madison, WI: Renaissance Learning, Inc.
Ysseldyke, J.E., Thill, T., Pohl, J., & Bolt, D. (2005). Using MathFacts in a Flash to enhance
computational fluency. Journal of Evidence Based Practices, 6(1), 59–89.
Zaidi, Hilda. (1994). Comparing learning variations and traditional instruction in 7th grade
mathematics effects of achievement and self-regulation strategies. Unpublished doctoral
dissertation, Columbia Teachers College.
Zumwalt, C. (2001). Effectiveness of computer aided instruction in 8th grade pre-algebra
classrooms in Idaho. Unpublished doctoral dissertation, Idaho State University.

The Best Evidence Encyclopedia is a free web site created by the Johns Hopkins University School of Education’s Center for Data-Driven Reform in Education (CDDRE) under funding from the Institute of Education Sciences, U.S. Department of Education.
81
Table 1
Mathematics Curricula: Descriptive Information and Effect Sizes for Qualifying Studies
Study Design Duration N Grade
Sample
Characteristics
Evidence of
Initial Equality Posttest
Effect Sizes by
Measure/Sub-
group
Overall
Effect
Size
NSF-Supported Programs
University of Chicago School Mathematics Project (UCSMP)
UCSMP Transition Mathematics
Hedges,
Stodolsky,
Mathison, &
Flores (1986)
Matched (L) 1 year
867
students
(7th: 322;
8th: 445;
9th: 100)
in 40
classes
(20 pairs)
7th,
8th, 9th
Schools
throughout the
US
Matched on
pretests
Scott Foresman
General
Mathematics
scale (without
calculators)
-0.08
Plude (1992) Matched (S) 1 year 140
students 8th
Connecticut
middle school
Matched on
pretests
HSST-General
Mathematics +0.28 +0.16
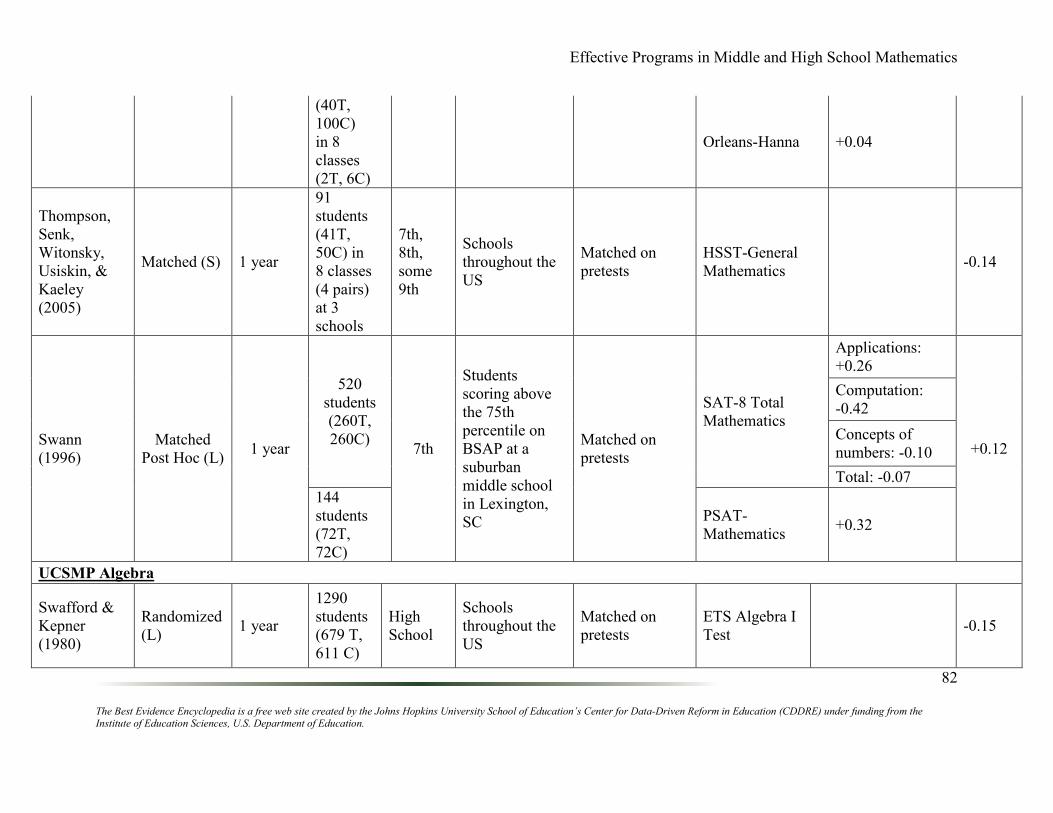
Effective Programs in Middle and High School Mathematics
The Best Evidence Encyclopedia is a free web site created by the Johns Hopkins University School of Education’s Center for Data-Driven Reform in Education (CDDRE) under funding from the Institute of Education Sciences, U.S. Department of Education.
82
(40T,
100C)
in 8
classes
(2T, 6C)
Orleans-Hanna +0.04
Thompson,
Senk,
Witonsky,
Usiskin, &
Kaeley
(2005)
Matched (S) 1 year
91
students
(41T,
50C) in
8 classes
(4 pairs)
at 3
schools
7th,
8th,
some
9th
Schools
throughout the
US
Matched on
pretests
HSST-General
Mathematics -0.14
Swann
(1996)
Matched
Post Hoc (L) 1 year
520
students
(260T,
260C) 7th
Students
scoring above
the 75th
percentile on
BSAP at a
suburban
middle school
in Lexington,
SC
Matched on
pretests
SAT-8 Total
Mathematics
Applications:
+0.26
+0.12
Computation:
-0.42
Concepts of
numbers: -0.10
Total: -0.07
144
students
(72T,
72C)
PSAT-
Mathematics +0.32
UCSMP Algebra
Swafford &
Kepner
(1980)
Randomized
(L) 1 year
1290
students
(679 T,
611 C)
High
School
Schools
throughout the
US
Matched on
pretests
ETS Algebra I
Test
-0.15
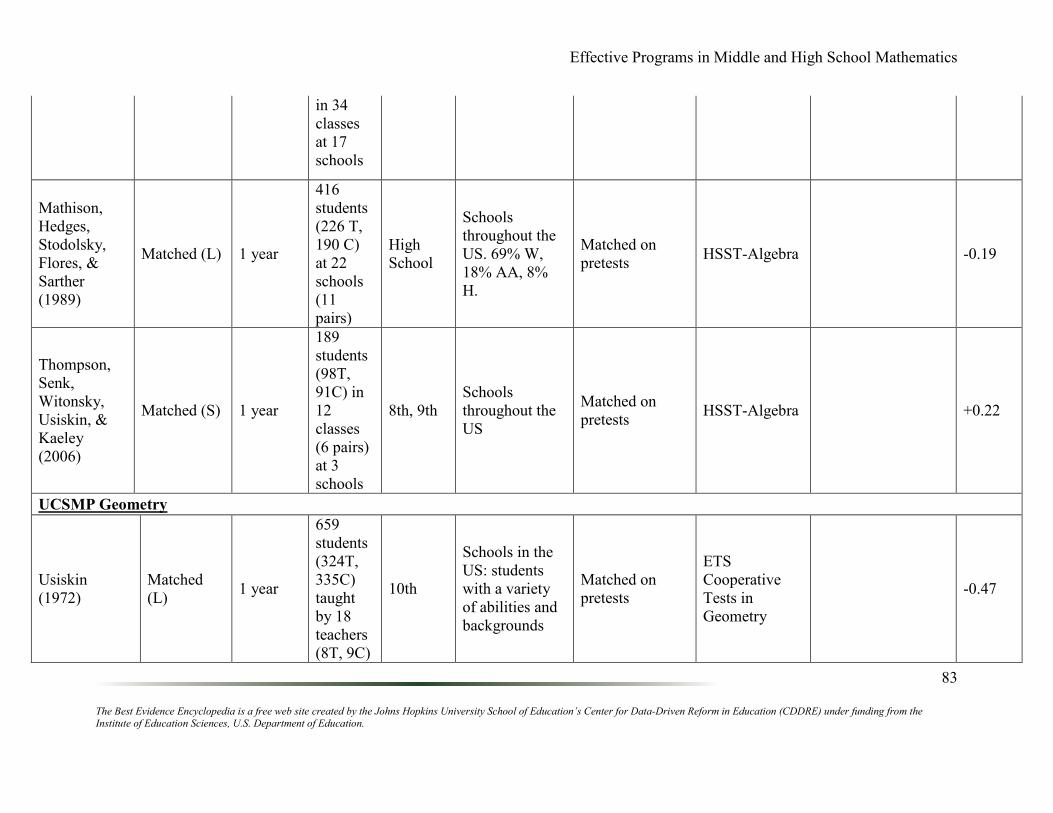
Effective Programs in Middle and High School Mathematics
The Best Evidence Encyclopedia is a free web site created by the Johns Hopkins University School of Education’s Center for Data-Driven Reform in Education (CDDRE) under funding from the Institute of Education Sciences, U.S. Department of Education.
83
in 34
classes
at 17
schools
Mathison,
Hedges,
Stodolsky,
Flores, &
Sarther
(1989)
Matched (L) 1 year
416
students
(226 T,
190 C)
at 22
schools
(11
pairs)
High
School
Schools
throughout the
US. 69% W,
18% AA, 8%
H.
Matched on
pretests HSST-Algebra -0.19
Thompson,
Senk,
Witonsky,
Usiskin, &
Kaeley
(2006)
Matched (S) 1 year
189
students
(98T,
91C) in
12
classes
(6 pairs)
at 3
schools
8th, 9th
Schools
throughout the
US
Matched on
pretests HSST-Algebra +0.22
UCSMP Geometry
Usiskin
(1972)
Matched
(L) 1 year
659
students
(324T,
335C)
taught
by 18
teachers
(8T, 9C)
10th
Schools in the
US: students
with a variety
of abilities and
backgrounds
Matched on
pretests
ETS
Cooperative
Tests in
Geometry
-0.47
Effective Programs in Middle and High School Mathematics
The Best Evidence Encyclopedia is a free web site created by the Johns Hopkins University School of Education’s Center for Data-Driven Reform in Education (CDDRE) under funding from the Institute of Education Sciences, U.S. Department of Education.
84
at 13
schools
(6T, 7C)
Thompson,
Witonsky,
Senk, Usiskin,
& Kaeley
(2003)
Matched
(L) 1 year
254
students
(139 T,
115 C)
in 12
classes
(6 well-
matched
pairs)
mostly
9th-11th
Diverse schools
in Indiana,
Oregon, and
South Carolina
Matched on
pretests
HSST-
Geometry +0.08
UCSMP Algebra II (Intermediate Mathematics)
Hayman
(1973);
Usiskin &
Bernhold
(1973)
Matched
(S) 1 year
345
students
(170 T,
175 C)
in 22
classes
(10 T,
12 C)
taught
by 13
teachers
(7 T, 6
11th 11th grade
students
Matched on
pretests and
demographics
ETS Algebra II +0.06
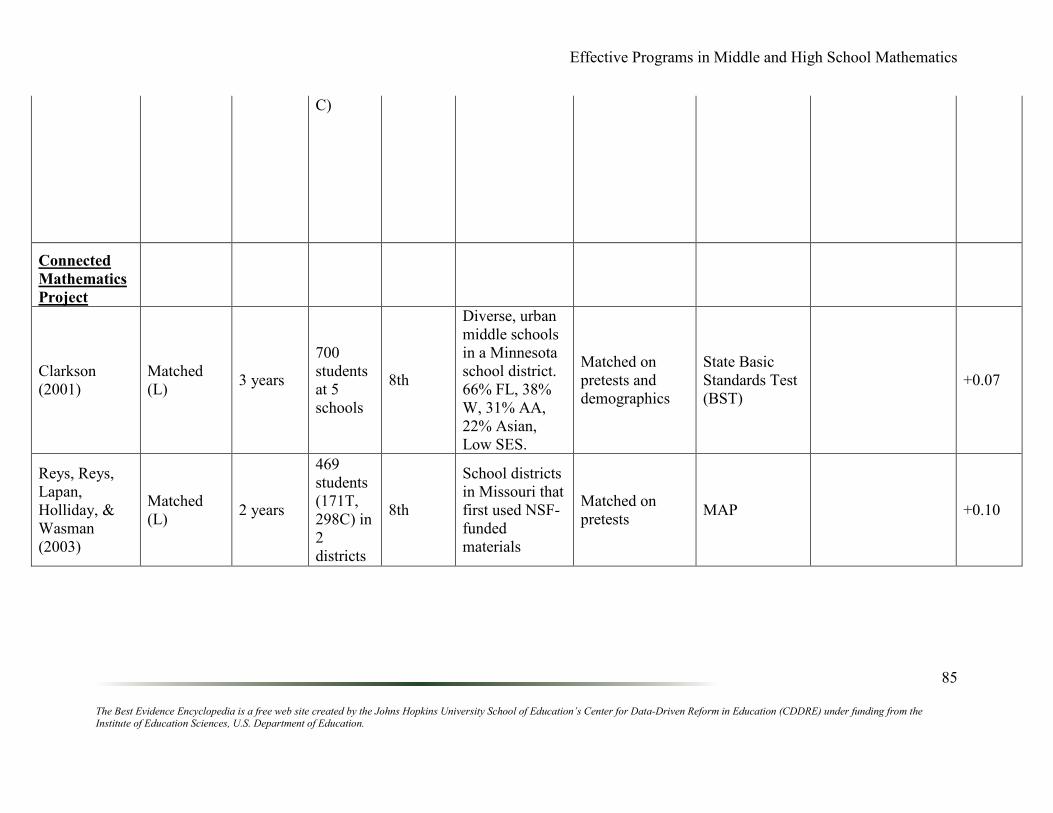
Effective Programs in Middle and High School Mathematics
The Best Evidence Encyclopedia is a free web site created by the Johns Hopkins University School of Education’s Center for Data-Driven Reform in Education (CDDRE) under funding from the Institute of Education Sciences, U.S. Department of Education.
85
C)
Connected
Mathematics
Project
Clarkson
(2001)
Matched
(L) 3 years
700
students
at 5
schools
8th
Diverse, urban
middle schools
in a Minnesota
school district.
66% FL, 38%
W, 31% AA,
22% Asian,
Low SES.
Matched on
pretests and
demographics
State Basic
Standards Test
(BST)
+0.07
Reys, Reys,
Lapan,
Holliday, &
Wasman
(2003)
Matched
(L) 2 years
469
students
(171T,
298C) in
2
districts
8th
School districts
in Missouri that
first used NSF-
funded
materials
Matched on
pretests MAP +0.10

Effective Programs in Middle and High School Mathematics
The Best Evidence Encyclopedia is a free web site created by the Johns Hopkins University School of Education’s Center for Data-Driven Reform in Education (CDDRE) under funding from the Institute of Education Sciences, U.S. Department of Education.
86
Schneider
(2000)
Matched
Post Hoc
(L)
1-3 years
19,501
students
at 46
schools
6th - 8th
Schools across
Texas: high &
low SES;
urban, suburban
& rural
Matched on
pretests and
demographics
TAAS 0.00
Riordan &
Noyce (2001);
Riordan,
Noyce, &
Perda (2003)
Matched
Post Hoc
(L)
2 - 4
years
7539
students
(1952 T,
5587 C)
in 55
schools
(21 T,
34 C)
8th
Massachusetts
middle schools.
12% FL.
Matched on
pretests and
demographics
Massachusetts
Comprehensive
Assessment
System
(MCAS)
+0.23
Kramer, Cai,
& Merlino
(2008)
Matched
Post Hoc
(L)
7 years
70
schools
(10E,
60C)
6th
-8th
Schools in
Pennsylvania
and New
Jersey, mostly
White, non-
poor
Matched on
pretests and
demographics
Pennsylvania
or New Jersey
state test (gain
per year)
+0.46
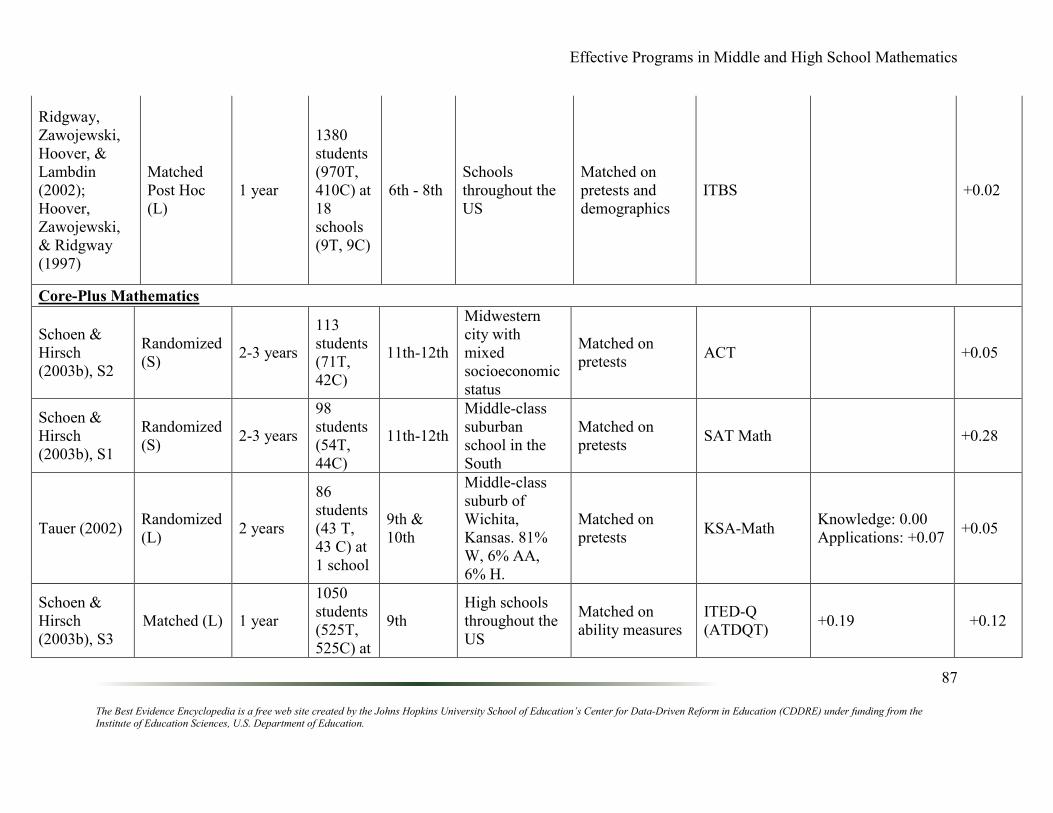
Effective Programs in Middle and High School Mathematics
The Best Evidence Encyclopedia is a free web site created by the Johns Hopkins University School of Education’s Center for Data-Driven Reform in Education (CDDRE) under funding from the Institute of Education Sciences, U.S. Department of Education.
87
Ridgway,
Zawojewski,
Hoover, &
Lambdin
(2002);
Hoover,
Zawojewski,
& Ridgway
(1997)
Matched
Post Hoc
(L)
1 year
1380
students
(970T,
410C) at
18
schools
(9T, 9C)
6th - 8th
Schools
throughout the
US
Matched on
pretests and
demographics
ITBS +0.02
Core-Plus Mathematics
Schoen &
Hirsch
(2003b), S2
Randomized
(S) 2-3 years
113
students
(71T,
42C)
11th-12th
Midwestern
city with
mixed
socioeconomic
status
Matched on
pretests ACT +0.05
Schoen &
Hirsch
(2003b), S1
Randomized
(S) 2-3 years
98
students
(54T,
44C)
11th-12th
Middle-class
suburban
school in the
South
Matched on
pretests SAT Math +0.28
Tauer (2002) Randomized
(L) 2 years
86
students
(43 T,
43 C) at
1 school
9th &
10th
Middle-class
suburb of
Wichita,
Kansas. 81%
W, 6% AA,
6% H.
Matched on
pretests KSA-Math
Knowledge: 0.00
Applications: +0.07 +0.05
Schoen &
Hirsch
(2003b), S3
Matched (L) 1 year
1050
students
(525T,
525C) at
9th
High schools
throughout the
US
Matched on
ability measures
ITED-Q
(ATDQT) +0.19 +0.12

Effective Programs in Middle and High School Mathematics
The Best Evidence Encyclopedia is a free web site created by the Johns Hopkins University School of Education’s Center for Data-Driven Reform in Education (CDDRE) under funding from the Institute of Education Sciences, U.S. Department of Education.
88
11
schools
2 years
390
students
(195T,
195C)
10th
High schools
throught the
US
Matched on
ability measures
ITED-Q
(ATDQT) +0.04
Nelson
(2005)
Matched
Post Hoc (L) 2 years +
14,463
students
at 44
schools
(22 T,
22 C)
10th
Washington
State high
schools
Matched on
pretests and
demographics
Washington
Assessment of
Student
Learning
(WASL)
Mathematics
scale
+0.11
Mathematics in Context
Kramer, Cai,
& Merlino,
(2008)
Matched
Post Hoc (L) 7 years
56
schools
(8E,
48C)
6th
-8th
Schools in
Pennsylvania
and New
Jersey, mostly
White, non-
poor
Matched on
pretests and
demographics
Pennsylvania
or New Jersey
state tests (gain
per year)
-0.02
MATH Thematics
Reys, Reys,
Lapan,
Holliday, &
Wasman
(2003)
Matched (L) 2 years
1792
students
(1098T,
694C) in
4
districts
8th
School districts
in Missouri
that first used
NSF-funded
materials
Matched on
pretests MAP +0.25
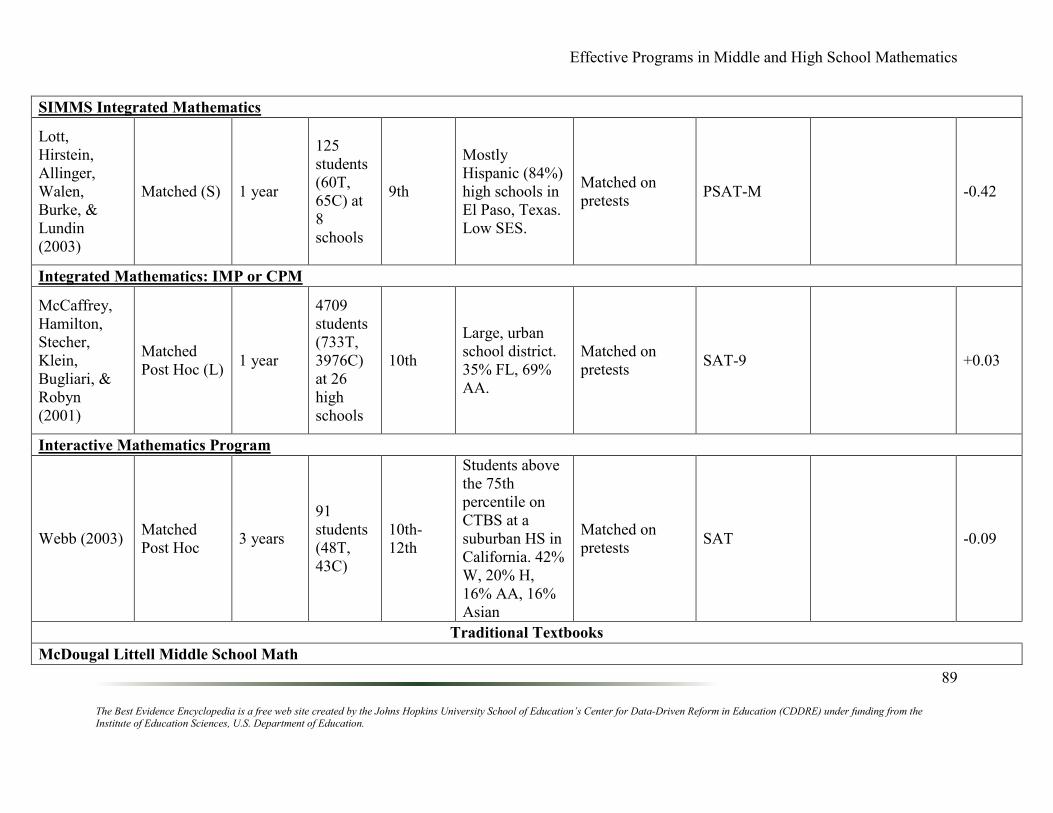
Effective Programs in Middle and High School Mathematics
The Best Evidence Encyclopedia is a free web site created by the Johns Hopkins University School of Education’s Center for Data-Driven Reform in Education (CDDRE) under funding from the Institute of Education Sciences, U.S. Department of Education.
89
SIMMS Integrated Mathematics
Lott,
Hirstein,
Allinger,
Walen,
Burke, &
Lundin
(2003)
Matched (S) 1 year
125
students
(60T,
65C) at
8
schools
9th
Mostly
Hispanic (84%)
high schools in
El Paso, Texas.
Low SES.
Matched on
pretests PSAT-M -0.42
Integrated Mathematics: IMP or CPM
McCaffrey,
Hamilton,
Stecher,
Klein,
Bugliari, &
Robyn
(2001)
Matched
Post Hoc (L) 1 year
4709
students
(733T,
3976C)
at 26
high
schools
10th
Large, urban
school district.
35% FL, 69%
AA.
Matched on
pretests SAT-9 +0.03
Interactive Mathematics Program
Webb (2003) Matched
Post Hoc 3 years
91
students
(48T,
43C)
10th-
12th
Students above
the 75th
percentile on
CTBS at a
suburban HS in
California. 42%
W, 20% H,
16% AA, 16%
Asian
Matched on
pretests SAT -0.09
Traditional Textbooks
McDougal Littell Middle School Math
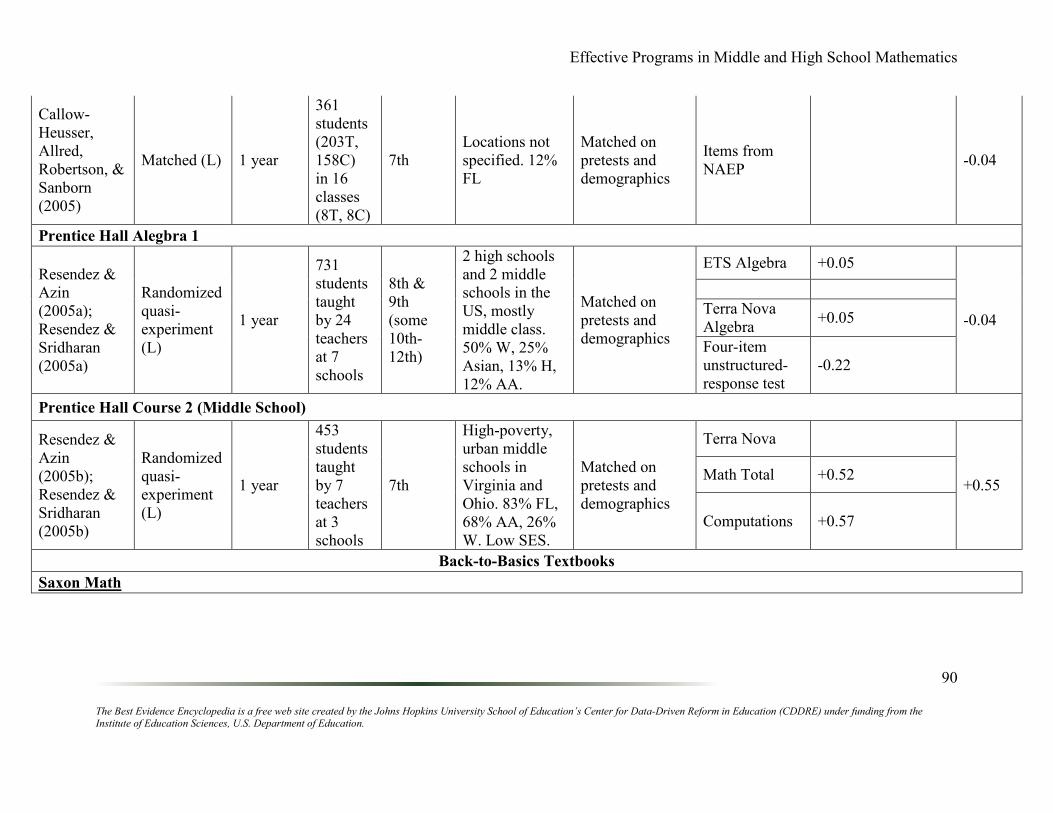
Effective Programs in Middle and High School Mathematics
The Best Evidence Encyclopedia is a free web site created by the Johns Hopkins University School of Education’s Center for Data-Driven Reform in Education (CDDRE) under funding from the Institute of Education Sciences, U.S. Department of Education.
90
Callow-
Heusser,
Allred,
Robertson, &
Sanborn
(2005)
Matched (L) 1 year
361
students
(203T,
158C)
in 16
classes
(8T, 8C)
7th
Locations not
specified. 12%
FL
Matched on
pretests and
demographics
Items from
NAEP -0.04
Prentice Hall Alegbra 1
Resendez &
Azin
(2005a);
Resendez &
Sridharan
(2005a)
Randomized
quasi-
experiment
(L)
1 year
731
students
taught
by 24
teachers
at 7
schools
8th &
9th
(some
10th-
12th)
2 high schools
and 2 middle
schools in the
US, mostly
middle class.
50% W, 25%
Asian, 13% H,
12% AA.
Matched on
pretests and
demographics
ETS Algebra +0.05
-0.04
Terra Nova
Algebra +0.05
Four-item
unstructured-
response test
-0.22
Prentice Hall Course 2 (Middle School)
Resendez &
Azin
(2005b);
Resendez &
Sridharan
(2005b)
Randomized
quasi-
experiment
(L)
1 year
453
students
taught
by 7
teachers
at 3
schools
7th
High-poverty,
urban middle
schools in
Virginia and
Ohio. 83% FL,
68% AA, 26%
W. Low SES.
Matched on
pretests and
demographics
Terra Nova
+0.55 Math Total +0.52
Computations +0.57
Back-to-Basics Textbooks
Saxon Math

Effective Programs in Middle and High School Mathematics
The Best Evidence Encyclopedia is a free web site created by the Johns Hopkins University School of Education’s Center for Data-Driven Reform in Education (CDDRE) under funding from the Institute of Education Sciences, U.S. Department of Education.
91
Lafferty
(1994) Matched (L) 1 year
454
students
(324 T,
130 C)
at 2
schools
6th
Suburban
Philadelphia
middle schools
Matched on
pretests
MAT 7
subtests +0.19
Denson
(1989) Matched (S) 1 year
212
students
in 13
classes
(7T, 6C)
at 3
schools
9th,
primarily
Inner-city
schools in
southern
California
Matched on
pretests
CAP General
Mathematics
and Algebra
Control high
achievers scored
higher than Saxon
high achievers on
polynomials and
radicals and
quadratics subtests.
-0.25
Rentschler
(1994) Matched (S)
6-7
months
211
students
(65 T,
146 C)
at 2
schools
6th
Rural West
Virginia
schools
Matched on
pretests
CTBS
+0.39 Computations +0.60
Concepts and
Applications +0.18
Resendez &
Azin (2005c)
Matched
Post Hoc (L) 5 years
6th: 32
schools
(17T,
15C);
7th: 28
schools
8th: 28
schools
6th - 8th
Georgia middle
schools. 54%
FL, 62% W,
29% AA, 6%
H. Low SES.
Matched on
pretests
Georgia's
Criterion-
Referenced
Competency
Test (CRCT)
+0.07
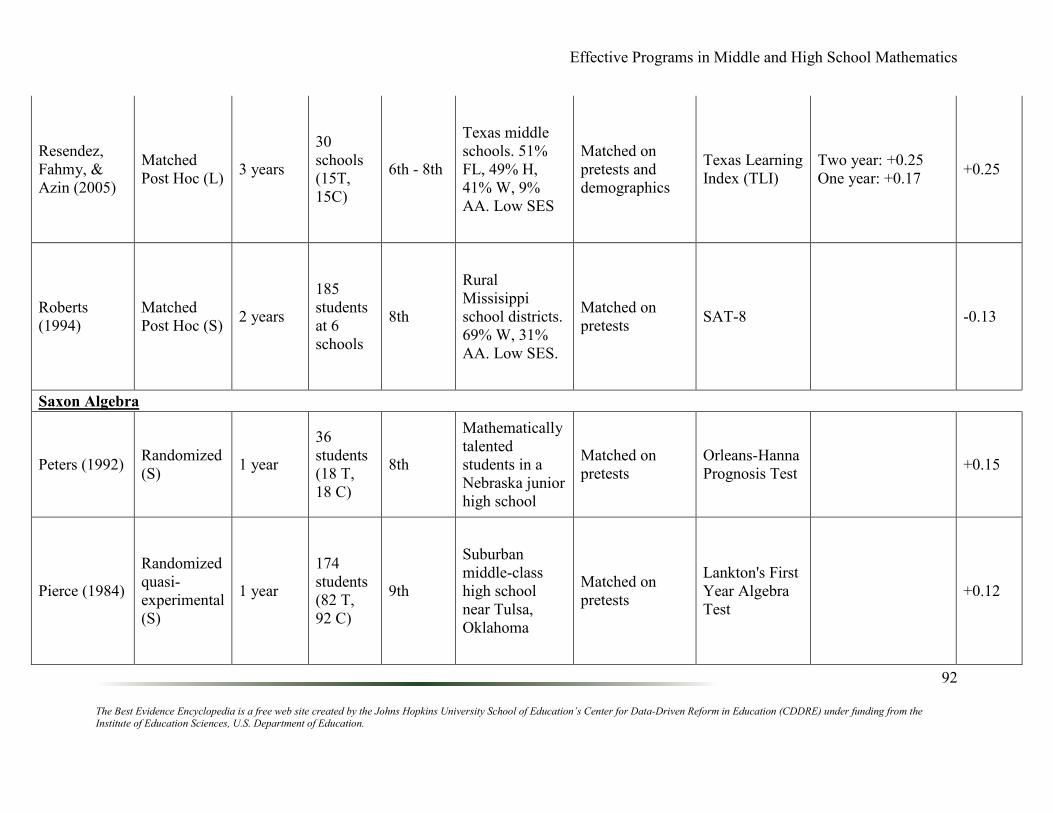
Effective Programs in Middle and High School Mathematics
The Best Evidence Encyclopedia is a free web site created by the Johns Hopkins University School of Education’s Center for Data-Driven Reform in Education (CDDRE) under funding from the Institute of Education Sciences, U.S. Department of Education.
92
Resendez,
Fahmy, &
Azin (2005)
Matched
Post Hoc (L) 3 years
30
schools
(15T,
15C)
6th - 8th
Texas middle
schools. 51%
FL, 49% H,
41% W, 9%
AA. Low SES
Matched on
pretests and
demographics
Texas Learning
Index (TLI)
Two year: +0.25
One year: +0.17 +0.25
Roberts
(1994)
Matched
Post Hoc (S) 2 years
185
students
at 6
schools
8th
Rural
Missisippi
school districts.
69% W, 31%
AA. Low SES.
Matched on
pretests SAT-8 -0.13
Saxon Algebra
Peters (1992) Randomized
(S) 1 year
36
students
(18 T,
18 C)
8th
Mathematically
talented
students in a
Nebraska junior
high school
Matched on
pretests
Orleans-Hanna
Prognosis Test +0.15
Pierce (1984)
Randomized
quasi-
experimental
(S)
1 year
174
students
(82 T,
92 C)
9th
Suburban
middle-class
high school
near Tulsa,
Oklahoma
Matched on
pretests
Lankton's First
Year Algebra
Test
+0.12
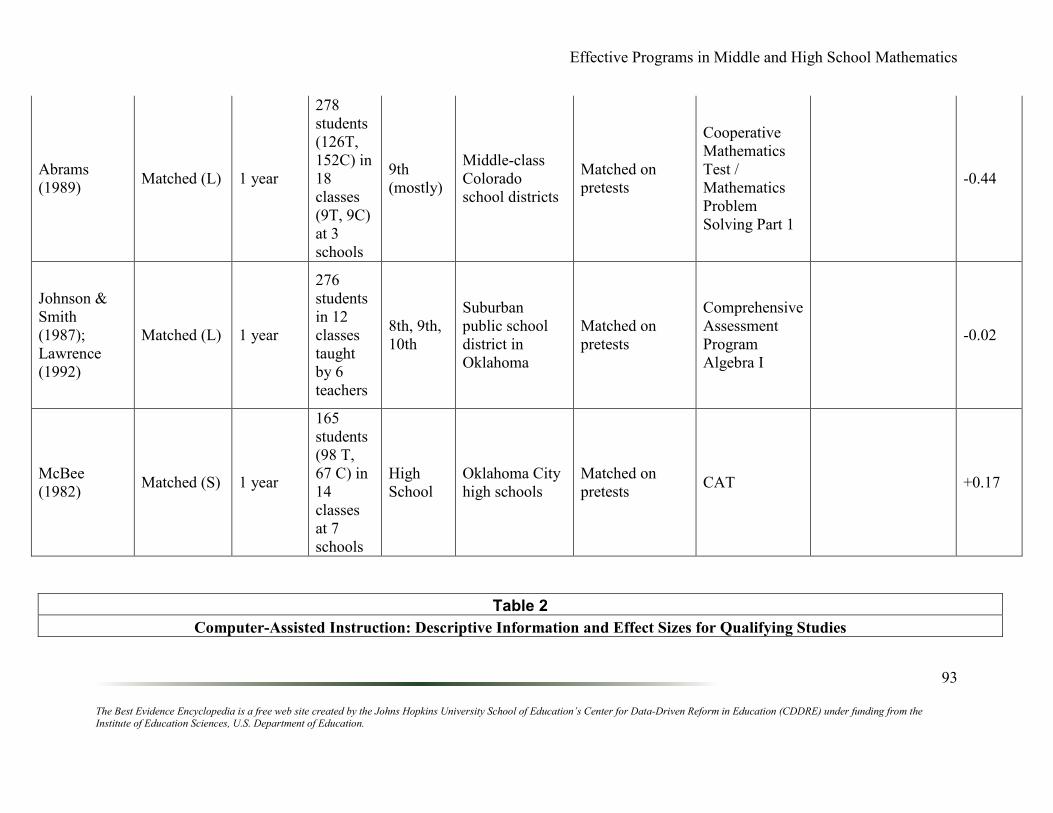
Effective Programs in Middle and High School Mathematics
The Best Evidence Encyclopedia is a free web site created by the Johns Hopkins University School of Education’s Center for Data-Driven Reform in Education (CDDRE) under funding from the Institute of Education Sciences, U.S. Department of Education.
93
Table 2
Computer-Assisted Instruction: Descriptive Information and Effect Sizes for Qualifying Studies
Abrams
(1989) Matched (L) 1 year
278
students
(126T,
152C) in
18
classes
(9T, 9C)
at 3
schools
9th
(mostly)
Middle-class
Colorado
school districts
Matched on
pretests
Cooperative
Mathematics
Test /
Mathematics
Problem
Solving Part 1
-0.44
Johnson &
Smith
(1987);
Lawrence
(1992)
Matched (L) 1 year
276
students
in 12
classes
taught
by 6
teachers
8th, 9th,
10th
Suburban
public school
district in
Oklahoma
Matched on
pretests
Comprehensive
Assessment
Program
Algebra I
-0.02
McBee
(1982) Matched (S) 1 year
165
students
(98 T,
67 C) in
14
classes
at 7
schools
High
School
Oklahoma City
high schools
Matched on
pretests CAT +0.17
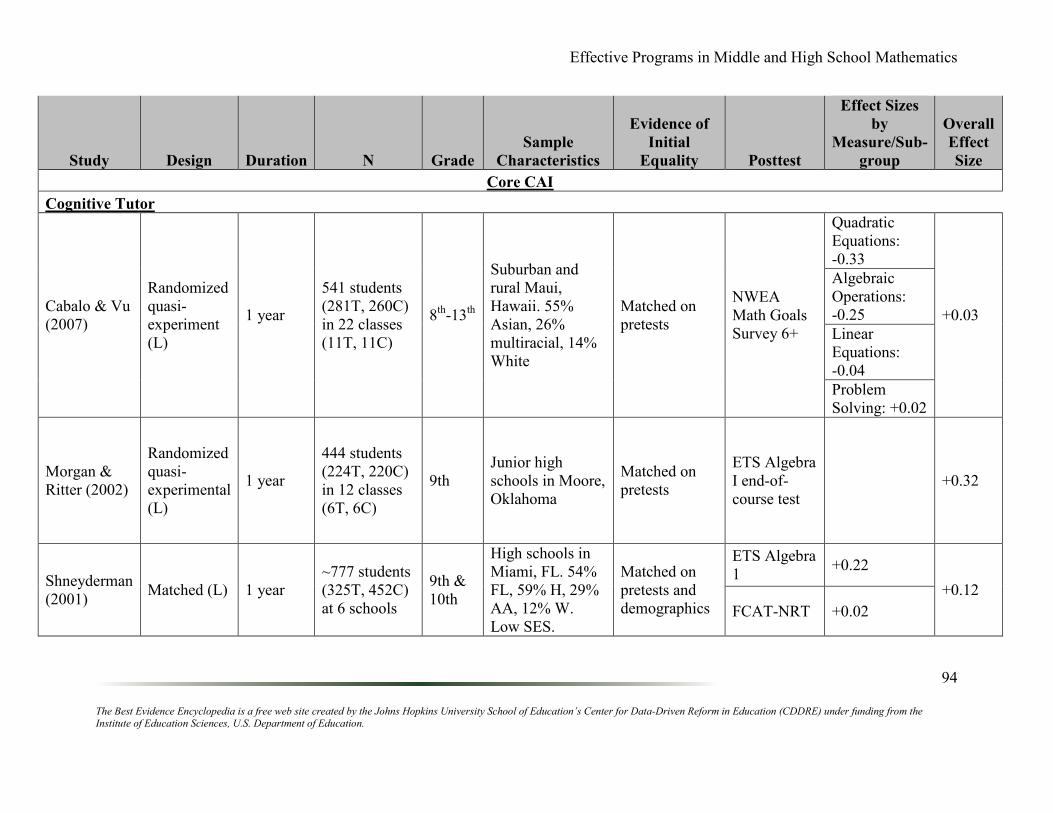
Effective Programs in Middle and High School Mathematics
The Best Evidence Encyclopedia is a free web site created by the Johns Hopkins University School of Education’s Center for Data-Driven Reform in Education (CDDRE) under funding from the Institute of Education Sciences, U.S. Department of Education.
94
Study Design Duration N Grade
Sample
Characteristics
Evidence of
Initial
Equality Posttest
Effect Sizes
by
Measure/Sub-
group
Overall
Effect
Size
Core CAI
Cognitive Tutor
Cabalo & Vu
(2007)
Randomized
quasi-
experiment
(L)
1 year
541 students
(281T, 260C)
in 22 classes
(11T, 11C)
8th
-13th
Suburban and
rural Maui,
Hawaii. 55%
Asian, 26%
multiracial, 14%
White
Matched on
pretests
NWEA
Math Goals
Survey 6+
Quadratic
Equations:
-0.33
+0.03
Algebraic
Operations:
-0.25
Linear
Equations:
-0.04
Problem
Solving: +0.02
Morgan &
Ritter (2002)
Randomized
quasi-
experimental
(L)
1 year
444 students
(224T, 220C)
in 12 classes
(6T, 6C)
9th
Junior high
schools in Moore,
Oklahoma
Matched on
pretests
ETS Algebra
I end-of-
course test
+0.32
Shneyderman
(2001) Matched (L) 1 year
~777 students
(325T, 452C)
at 6 schools
9th &
10th
High schools in
Miami, FL. 54%
FL, 59% H, 29%
AA, 12% W.
Low SES.
Matched on
pretests and
demographics
ETS Algebra
1 +0.22
+0.12
FCAT-NRT +0.02
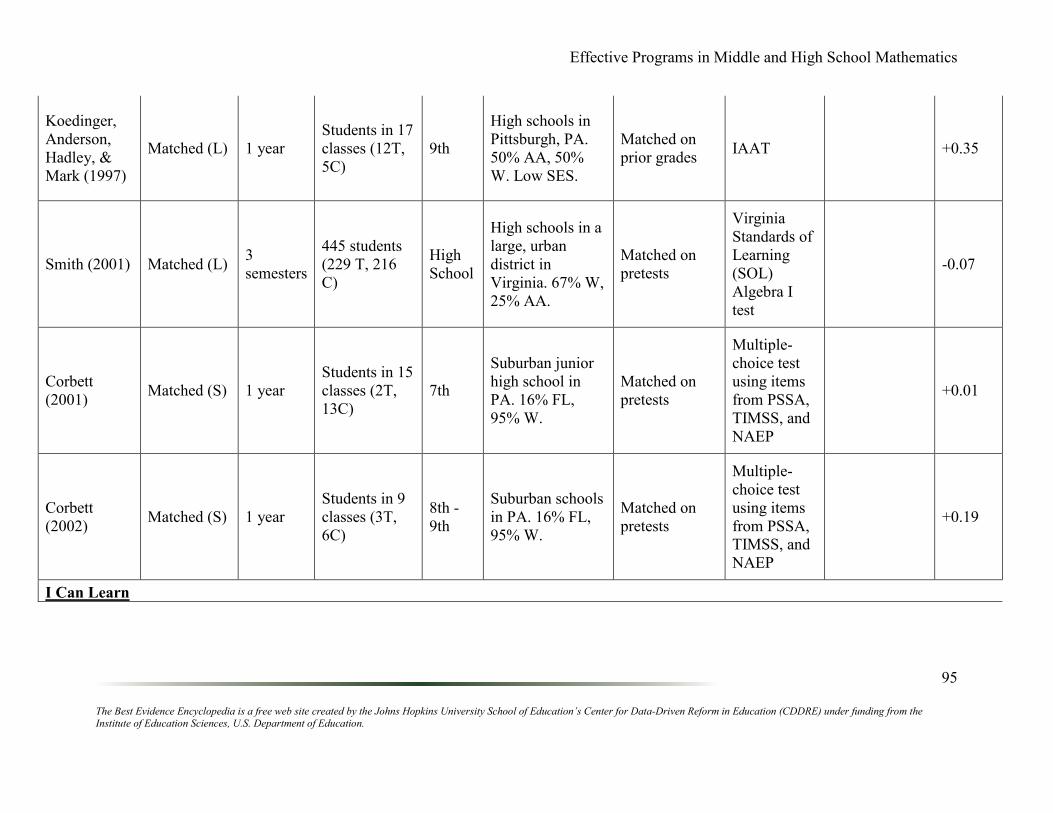
Effective Programs in Middle and High School Mathematics
The Best Evidence Encyclopedia is a free web site created by the Johns Hopkins University School of Education’s Center for Data-Driven Reform in Education (CDDRE) under funding from the Institute of Education Sciences, U.S. Department of Education.
95
Koedinger,
Anderson,
Hadley, &
Mark (1997)
Matched (L) 1 year
Students in 17
classes (12T,
5C)
9th
High schools in
Pittsburgh, PA.
50% AA, 50%
W. Low SES.
Matched on
prior grades IAAT +0.35
Smith (2001) Matched (L) 3
semesters
445 students
(229 T, 216
C)
High
School
High schools in a
large, urban
district in
Virginia. 67% W,
25% AA.
Matched on
pretests
Virginia
Standards of
Learning
(SOL)
Algebra I
test
-0.07
Corbett
(2001) Matched (S) 1 year
Students in 15
classes (2T,
13C)
7th
Suburban junior
high school in
PA. 16% FL,
95% W.
Matched on
pretests
Multiple-
choice test
using items
from PSSA,
TIMSS, and
NAEP
+0.01
Corbett
(2002) Matched (S) 1 year
Students in 9
classes (3T,
6C)
8th -
9th
Suburban schools
in PA. 16% FL,
95% W.
Matched on
pretests
Multiple-
choice test
using items
from PSSA,
TIMSS, and
NAEP
+0.19
I Can Learn

Effective Programs in Middle and High School Mathematics
The Best Evidence Encyclopedia is a free web site created by the Johns Hopkins University School of Education’s Center for Data-Driven Reform in Education (CDDRE) under funding from the Institute of Education Sciences, U.S. Department of Education.
96
Kirby
(2004a)
Randomized
(S) 1 year
204 students
(91T, 113C)
at 1 school
8th
School in
Alameda County,
CA
Matched on
pretests
California
Standards
Tests (CST)
+0.04
Kerstyn
(2002) Matched (L) 1 year
6213 students
(1791T,
4422C) in 527
classes (129T,
398C)
8th
Students in four
levels of math at
schools in
Florida. 43% FL,
50% W, 24% H,
20% AA.
Matched on
pretests
+0.04
FCAT
Alg 1 +0.05
Alg 1
Honors -0.05
Pre-Algebra +0.06
Pre-Alg Adv +0.03
Brooks
(1999) Matched (L) 1 year
4,644 students
(3012T,
1632C) in 169
classes (102T,
67C) at 21
schools
7th -
10th
Schools in
Jefferson Parish,
Louisiana. Low
SES.
Matched on
pretests
Textbook
Algebra I
achievement
test
-0.04
Kerstyn
(2001) Matched (L) 1 year
2536 students
(1222T,
1314C) in 118
classes (59
pairs)
8th
Students in four
different math
levels at Tampa,
FL middle
schools. 37% FL,
47% W, 25% H,
24% AA.
Matched on
pretests
FCAT
+0.08
Alg I +0.05
Alg I Honors -0.05
Pre-Algebra +0.06
Pre-Alg Adv +0.03
Kirby
(2004b) Matched (L) 1 year
797 students
(97T, 700C)
High
School
High school in
Collier County,
Florida. 36% AA,
Matched on
pretests Florida CAT +0.18
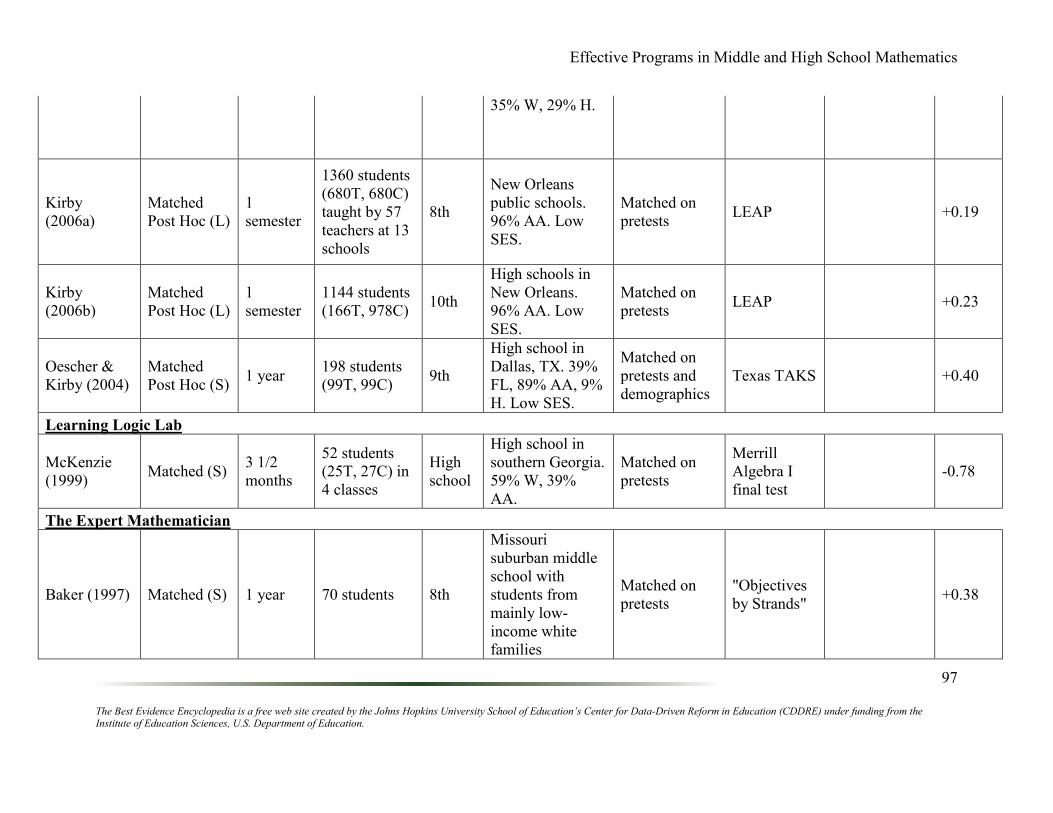
Effective Programs in Middle and High School Mathematics
The Best Evidence Encyclopedia is a free web site created by the Johns Hopkins University School of Education’s Center for Data-Driven Reform in Education (CDDRE) under funding from the Institute of Education Sciences, U.S. Department of Education.
97
35% W, 29% H.
Kirby
(2006a)
Matched
Post Hoc (L)
1
semester
1360 students
(680T, 680C)
taught by 57
teachers at 13
schools
8th
New Orleans
public schools.
96% AA. Low
SES.
Matched on
pretests LEAP +0.19
Kirby
(2006b)
Matched
Post Hoc (L)
1
semester
1144 students
(166T, 978C) 10th
High schools in
New Orleans.
96% AA. Low
SES.
Matched on
pretests LEAP +0.23
Oescher &
Kirby (2004)
Matched
Post Hoc (S) 1 year
198 students
(99T, 99C) 9th
High school in
Dallas, TX. 39%
FL, 89% AA, 9%
H. Low SES.
Matched on
pretests and
demographics
Texas TAKS +0.40
Learning Logic Lab
McKenzie
(1999) Matched (S)
3 1/2
months
52 students
(25T, 27C) in
4 classes
High
school
High school in
southern Georgia.
59% W, 39%
AA.
Matched on
pretests
Merrill
Algebra I
final test
-0.78
The Expert Mathematician
Baker (1997) Matched (S) 1 year 70 students 8th
Missouri
suburban middle
school with
students from
mainly low-
income white
families
Matched on
pretests
"Objectives
by Strands" +0.38
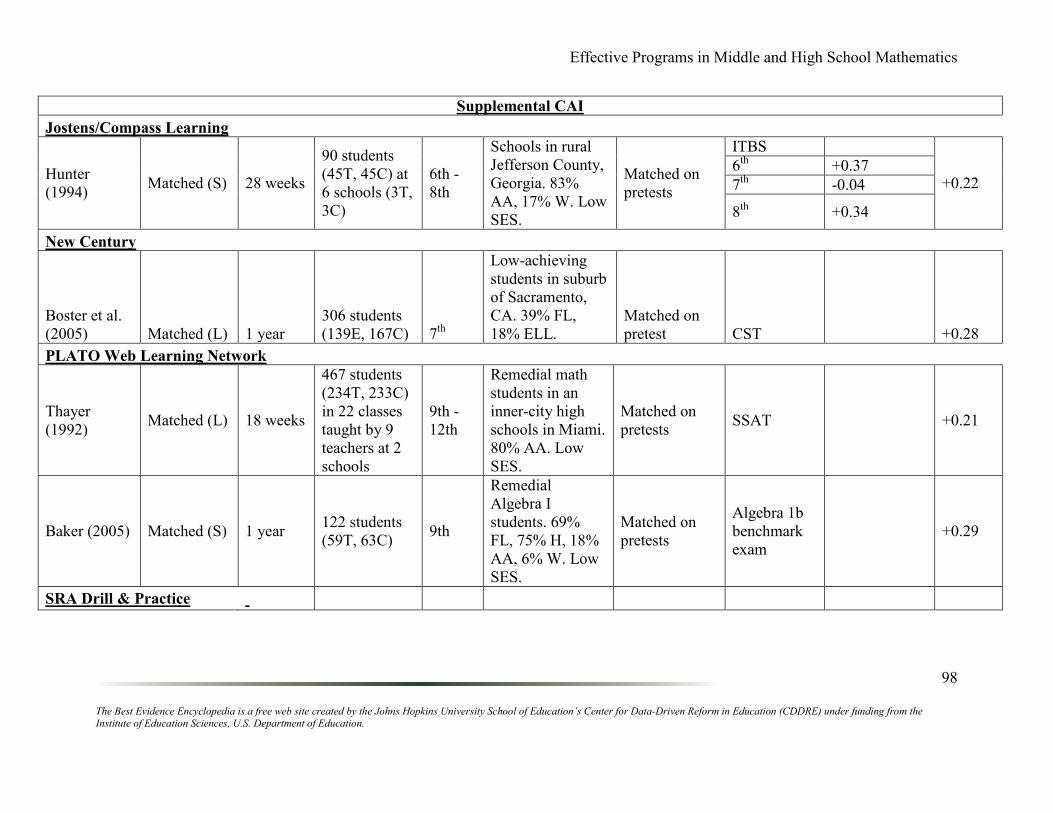
Effective Programs in Middle and High School Mathematics
The Best Evidence Encyclopedia is a free web site created by the Johns Hopkins University School of Education’s Center for Data-Driven Reform in Education (CDDRE) under funding from the Institute of Education Sciences, U.S. Department of Education.
98
Supplemental CAI
Jostens/Compass Learning
Hunter
(1994) Matched (S) 28 weeks
90 students
(45T, 45C) at
6 schools (3T,
3C)
6th -
8th
Schools in rural
Jefferson County,
Georgia. 83%
AA, 17% W. Low
SES.
Matched on
pretests
ITBS
+0.22 6
th +0.37
7th
-0.04
8th
+0.34
New Century
Boster et al.
(2005) Matched (L) 1 year
306 students
(139E, 167C) 7th
Low-achieving
students in suburb
of Sacramento,
CA. 39% FL,
18% ELL.
Matched on
pretest CST +0.28
PLATO Web Learning Network
Thayer
(1992) Matched (L) 18 weeks
467 students
(234T, 233C)
in 22 classes
taught by 9
teachers at 2
schools
9th -
12th
Remedial math
students in an
inner-city high
schools in Miami.
80% AA. Low
SES.
Matched on
pretests SSAT +0.21
Baker (2005) Matched (S) 1 year 122 students
(59T, 63C) 9th
Remedial
Algebra I
students. 69%
FL, 75% H, 18%
AA, 6% W. Low
SES.
Matched on
pretests
Algebra 1b
benchmark
exam
+0.29
SRA Drill & Practice
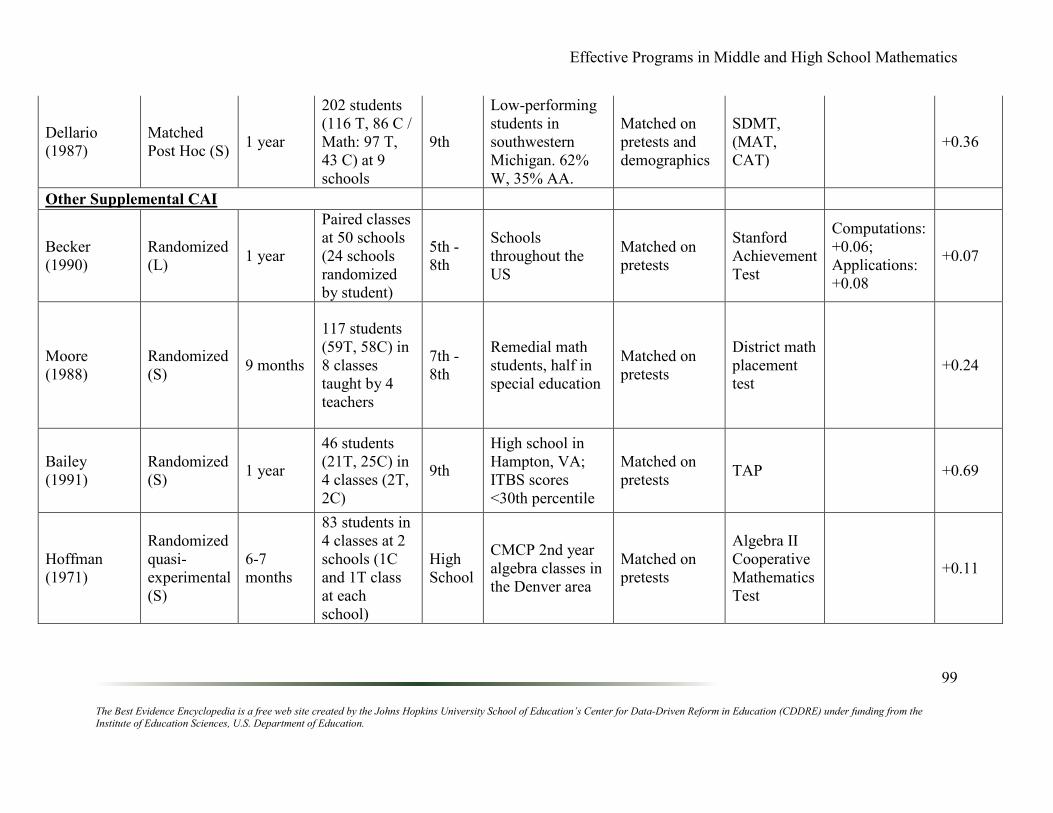
Effective Programs in Middle and High School Mathematics
The Best Evidence Encyclopedia is a free web site created by the Johns Hopkins University School of Education’s Center for Data-Driven Reform in Education (CDDRE) under funding from the Institute of Education Sciences, U.S. Department of Education.
99
Dellario
(1987)
Matched
Post Hoc (S) 1 year
202 students
(116 T, 86 C /
Math: 97 T,
43 C) at 9
schools
9th
Low-performing
students in
southwestern
Michigan. 62%
W, 35% AA.
Matched on
pretests and
demographics
SDMT,
(MAT,
CAT)
+0.36
Other Supplemental CAI
Becker
(1990)
Randomized
(L) 1 year
Paired classes
at 50 schools
(24 schools
randomized
by student)
5th -
8th
Schools
throughout the
US
Matched on
pretests
Stanford
Achievement
Test
Computations:
+0.06;
Applications:
+0.08
+0.07
Moore
(1988)
Randomized
(S) 9 months
117 students
(59T, 58C) in
8 classes
taught by 4
teachers
7th -
8th
Remedial math
students, half in
special education
Matched on
pretests
District math
placement
test
+0.24
Bailey
(1991)
Randomized
(S) 1 year
46 students
(21T, 25C) in
4 classes (2T,
2C)
9th
High school in
Hampton, VA;
ITBS scores
<30th percentile
Matched on
pretests TAP +0.69
Hoffman
(1971)
Randomized
quasi-
experimental
(S)
6-7
months
83 students in
4 classes at 2
schools (1C
and 1T class
at each
school)
High
School
CMCP 2nd year
algebra classes in
the Denver area
Matched on
pretests
Algebra II
Cooperative
Mathematics
Test
+0.11
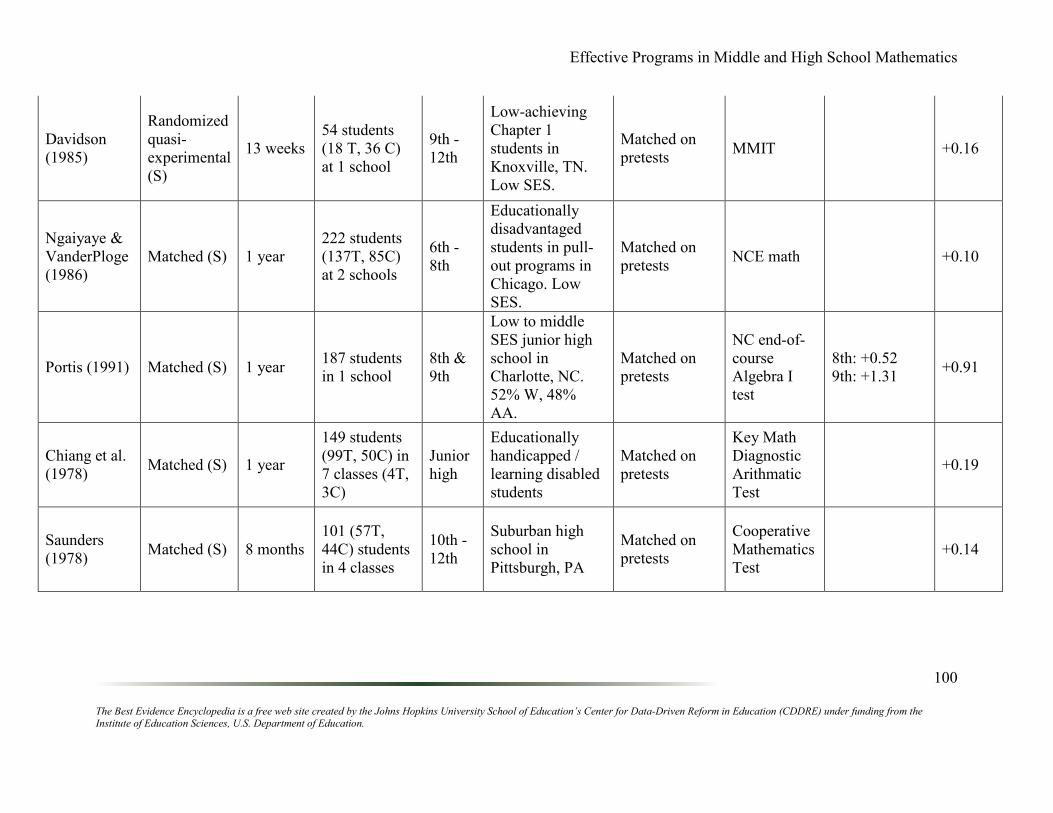
Effective Programs in Middle and High School Mathematics
The Best Evidence Encyclopedia is a free web site created by the Johns Hopkins University School of Education’s Center for Data-Driven Reform in Education (CDDRE) under funding from the Institute of Education Sciences, U.S. Department of Education.
100
Davidson
(1985)
Randomized
quasi-
experimental
(S)
13 weeks
54 students
(18 T, 36 C)
at 1 school
9th -
12th
Low-achieving
Chapter 1
students in
Knoxville, TN.
Low SES.
Matched on
pretests MMIT +0.16
Ngaiyaye &
VanderPloge
(1986)
Matched (S) 1 year
222 students
(137T, 85C)
at 2 schools
6th -
8th
Educationally
disadvantaged
students in pull-
out programs in
Chicago. Low
SES.
Matched on
pretests NCE math +0.10
Portis (1991) Matched (S) 1 year 187 students
in 1 school
8th &
9th
Low to middle
SES junior high
school in
Charlotte, NC.
52% W, 48%
AA.
Matched on
pretests
NC end-of-
course
Algebra I
test
8th: +0.52
9th: +1.31 +0.91
Chiang et al.
(1978) Matched (S) 1 year
149 students
(99T, 50C) in
7 classes (4T,
3C)
Junior
high
Educationally
handicapped /
learning disabled
students
Matched on
pretests
Key Math
Diagnostic
Arithmatic
Test
+0.19
Saunders
(1978) Matched (S) 8 months
101 (57T,
44C) students
in 4 classes
10th -
12th
Suburban high
school in
Pittsburgh, PA
Matched on
pretests
Cooperative
Mathematics
Test
+0.14

Effective Programs in Middle and High School Mathematics
The Best Evidence Encyclopedia is a free web site created by the Johns Hopkins University School of Education’s Center for Data-Driven Reform in Education (CDDRE) under funding from the Institute of Education Sciences, U.S. Department of Education.
101
Jhin (1971) Matched (S) 1 year
94 students
(56T, 38C) in
4 classes
High
School
Algebra II
students in a
middle class
Auburn, Alabama
high school.
Matched on
pretests
Cooperative
Mathematics
Tests -
Algebra II
HI: +0.48
MID: +0.17
LO: +0.20
+0.16
Clarke
(1993) Matched (S)
1
semester
92 students
(62T, 30C) 10th
Low-achieving
students (between
10th - 45th
percentile at
pretest)
Matched on
pretests CTBS
With audio-
interactive
touch screen:
+0.15Without
touch screen:
+0.10
+0.13
Watkins
(1991)
Matched
Post Hoc (L) 2-6 years
180 schools
(90T, 90C)
7th &
10th
Schools
throughout
Arkansas
Matched on
pretests
MAT 6,
SRA-78 +0.01
McCart
(1996)
Matched
Post Hoc (S) 6 months
52 students at
2 schools 8th
Semi-rural
suburban school
district in NJ.
75% W, 15%
AA, 5%H, 5%
Asian.
Matched on
pretests
NJ Early
Warning
Test
+1.20
Computer-Managed Learning Systems
Accelerated Math

Effective Programs in Middle and High School Mathematics
The Best Evidence Encyclopedia is a free web site created by the Johns Hopkins University School of Education’s Center for Data-Driven Reform in Education (CDDRE) under funding from the Institute of Education Sciences, U.S. Department of Education.
102
Ysseldyke &
Bolt (2006)
Randomized
quasi-
experimental
(L)
1 year 1000 students
at 3 schools
Middle
school
Middle schools in
MS, MI, NC.
37% AA, 34%
W, 26% H. Low
SES
Matched on
pretests TerraNova +0.07
Gaeddert
(2001) Matched (S)
1
semester
(3 1/2
months)
100 students
in 6 classes
taught by 3
teachers
High
School
High school in
Kansas
Matched on
pretest
SAT 9
+0.35 Pre-Algebra +0.09
Algebra +0.62
Geometry +0.35
Atkins
(2005)
Matched
Post Hoc (L) 3 years
542 students
(354T, 188C)
6th -
8th
Rural schools in
eastern
Tennessee. 53%
FL, 99% W. Low
SES.
Matched on
pretests Terra Nova -0.26
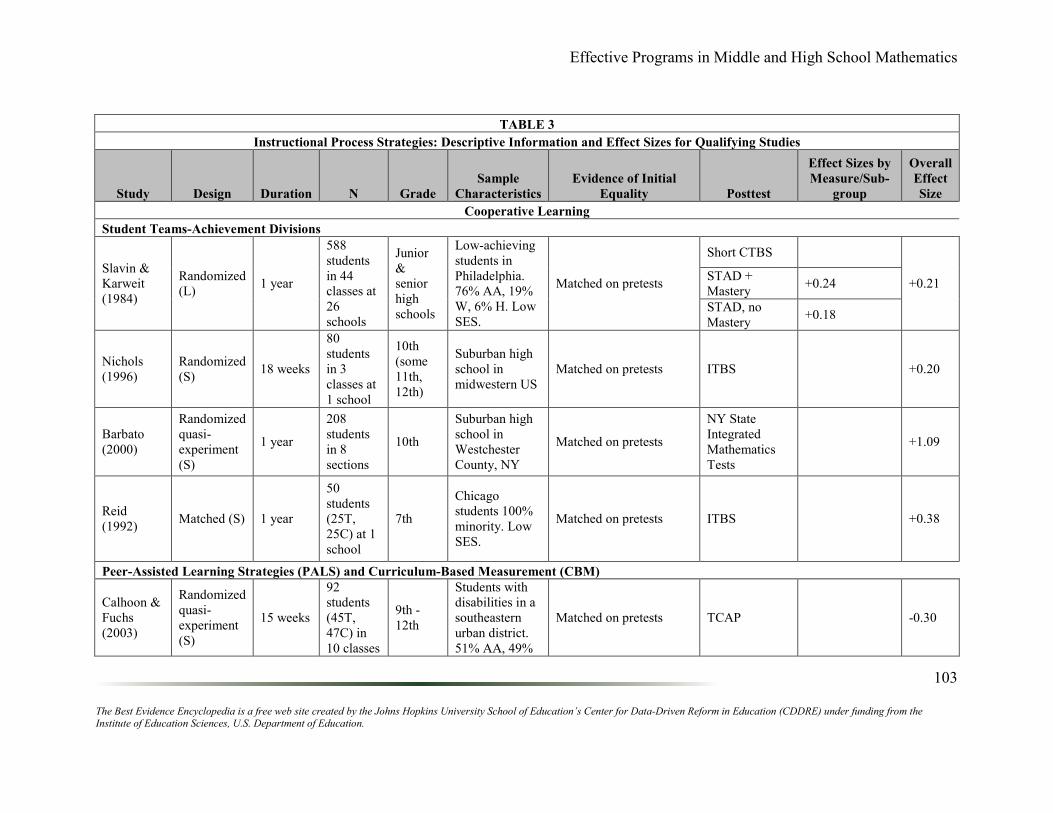
Effective Programs in Middle and High School Mathematics
The Best Evidence Encyclopedia is a free web site created by the Johns Hopkins University School of Education’s Center for Data-Driven Reform in Education (CDDRE) under funding from the Institute of Education Sciences, U.S. Department of Education.
103
TABLE 3
Instructional Process Strategies: Descriptive Information and Effect Sizes for Qualifying Studies
Study Design Duration N Grade
Sample
Characteristics
Evidence of Initial
Equality Posttest
Effect Sizes by
Measure/Sub-
group
Overall
Effect
Size
Cooperative Learning
Student Teams-Achievement Divisions
Slavin &
Karweit
(1984)
Randomized
(L) 1 year
588
students
in 44
classes at
26
schools
Junior
&
senior
high
schools
Low-achieving
students in
Philadelphia.
76% AA, 19%
W, 6% H. Low
SES.
Matched on pretests
Short CTBS
+0.21 STAD +
Mastery +0.24
STAD, no
Mastery +0.18
Nichols
(1996)
Randomized
(S) 18 weeks
80
students
in 3
classes at
1 school
10th
(some
11th,
12th)
Suburban high
school in
midwestern US
Matched on pretests ITBS +0.20
Barbato
(2000)
Randomized
quasi-
experiment
(S)
1 year
208
students
in 8
sections
10th
Suburban high
school in
Westchester
County, NY
Matched on pretests
NY State
Integrated
Mathematics
Tests
+1.09
Reid
(1992) Matched (S) 1 year
50
students
(25T,
25C) at 1
school
7th
Chicago
students 100%
minority. Low
SES.
Matched on pretests ITBS +0.38
Peer-Assisted Learning Strategies (PALS) and Curriculum-Based Measurement (CBM)
Calhoon &
Fuchs
(2003)
Randomized
quasi-
experiment
(S)
15 weeks
92
students
(45T,
47C) in
10 classes
9th -
12th
Students with
disabilities in a
southeastern
urban district.
51% AA, 49%
Matched on pretests TCAP -0.30
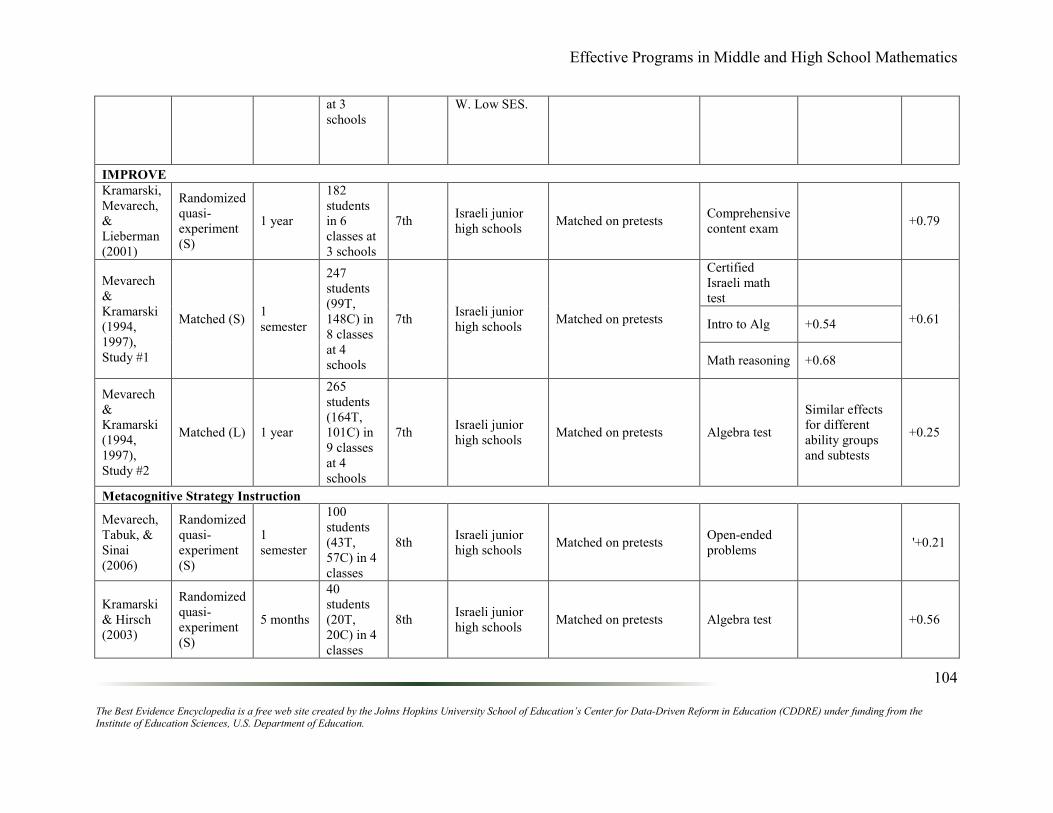
Effective Programs in Middle and High School Mathematics
The Best Evidence Encyclopedia is a free web site created by the Johns Hopkins University School of Education’s Center for Data-Driven Reform in Education (CDDRE) under funding from the Institute of Education Sciences, U.S. Department of Education.
104
at 3
schools
W. Low SES.
IMPROVE
Kramarski,
Mevarech,
&
Lieberman
(2001)
Randomized
quasi-
experiment
(S)
1 year
182
students
in 6
classes at
3 schools
7th Israeli junior
high schools Matched on pretests
Comprehensive
content exam +0.79
Mevarech
&
Kramarski
(1994,
1997),
Study #1
Matched (S) 1
semester
247
students
(99T,
148C) in
8 classes
at 4
schools
7th Israeli junior
high schools Matched on pretests
Certified
Israeli math
test
+0.61 Intro to Alg +0.54
Math reasoning +0.68
Mevarech
&
Kramarski
(1994,
1997),
Study #2
Matched (L) 1 year
265
students
(164T,
101C) in
9 classes
at 4
schools
7th Israeli junior
high schools Matched on pretests Algebra test
Similar effects
for different
ability groups
and subtests
+0.25
Metacognitive Strategy Instruction
Mevarech,
Tabuk, &
Sinai
(2006)
Randomized
quasi-
experiment
(S)
1
semester
100
students
(43T,
57C) in 4
classes
8th Israeli junior
high schools Matched on pretests
Open-ended
problems '+0.21
Kramarski
& Hirsch
(2003)
Randomized
quasi-
experiment
(S)
5 months
40
students
(20T,
20C) in 4
classes
8th Israeli junior
high schools Matched on pretests Algebra test +0.56
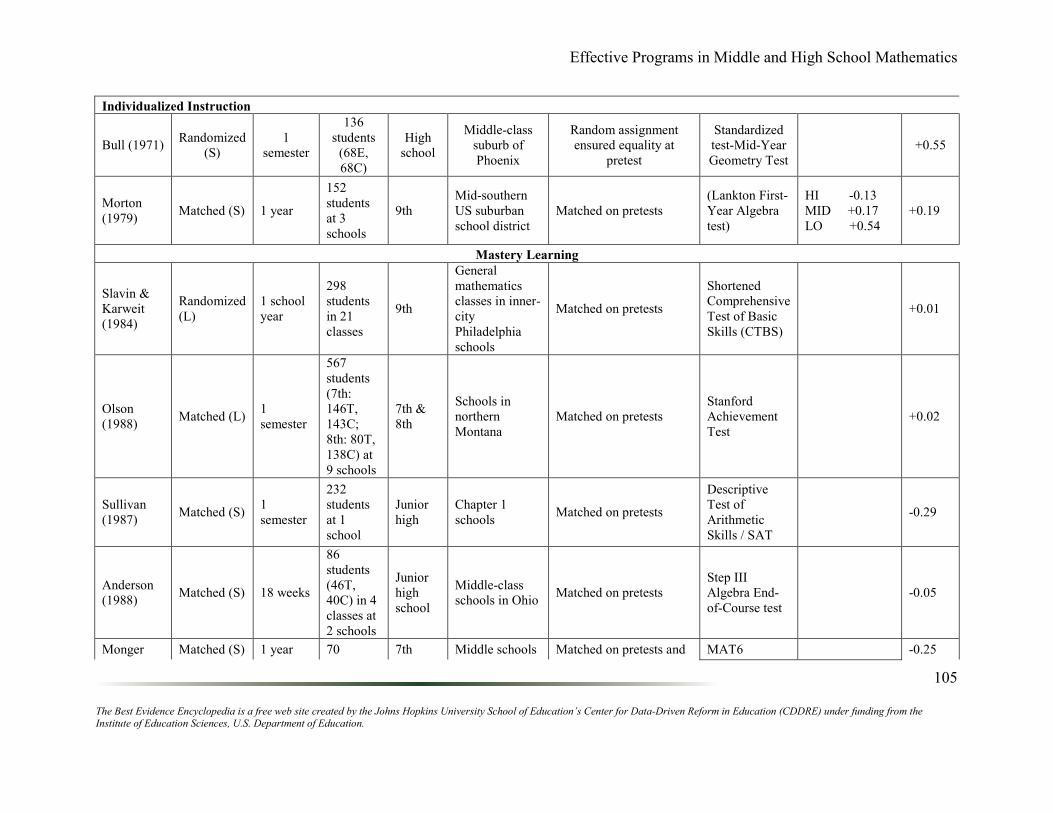
Effective Programs in Middle and High School Mathematics
The Best Evidence Encyclopedia is a free web site created by the Johns Hopkins University School of Education’s Center for Data-Driven Reform in Education (CDDRE) under funding from the Institute of Education Sciences, U.S. Department of Education.
105
Individualized Instruction
Bull (1971) Randomized
(S)
1
semester
136
students
(68E,
68C)
High
school
Middle-class
suburb of
Phoenix
Random assignment
ensured equality at
pretest
Standardized
test-Mid-Year
Geometry Test
+0.55
Morton
(1979) Matched (S) 1 year
152
students
at 3
schools
9th
Mid-southern
US suburban
school district
Matched on pretests
(Lankton First-
Year Algebra
test)
HI -0.13
MID +0.17
LO +0.54
+0.19
Mastery Learning
Slavin &
Karweit
(1984)
Randomized
(L)
1 school
year
298
students
in 21
classes
9th
General
mathematics
classes in inner-
city
Philadelphia
schools
Matched on pretests
Shortened
Comprehensive
Test of Basic
Skills (CTBS)
+0.01
Olson
(1988) Matched (L)
1
semester
567
students
(7th:
146T,
143C;
8th: 80T,
138C) at
9 schools
7th &
8th
Schools in
northern
Montana
Matched on pretests
Stanford
Achievement
Test
+0.02
Sullivan
(1987) Matched (S)
1
semester
232
students
at 1
school
Junior
high
Chapter 1
schools Matched on pretests
Descriptive
Test of
Arithmetic
Skills / SAT
-0.29
Anderson
(1988) Matched (S) 18 weeks
86
students
(46T,
40C) in 4
classes at
2 schools
Junior
high
school
Middle-class
schools in Ohio Matched on pretests
Step III
Algebra End-
of-Course test
-0.05
Monger Matched (S) 1 year 70 7th Middle schools Matched on pretests and MAT6 -0.25
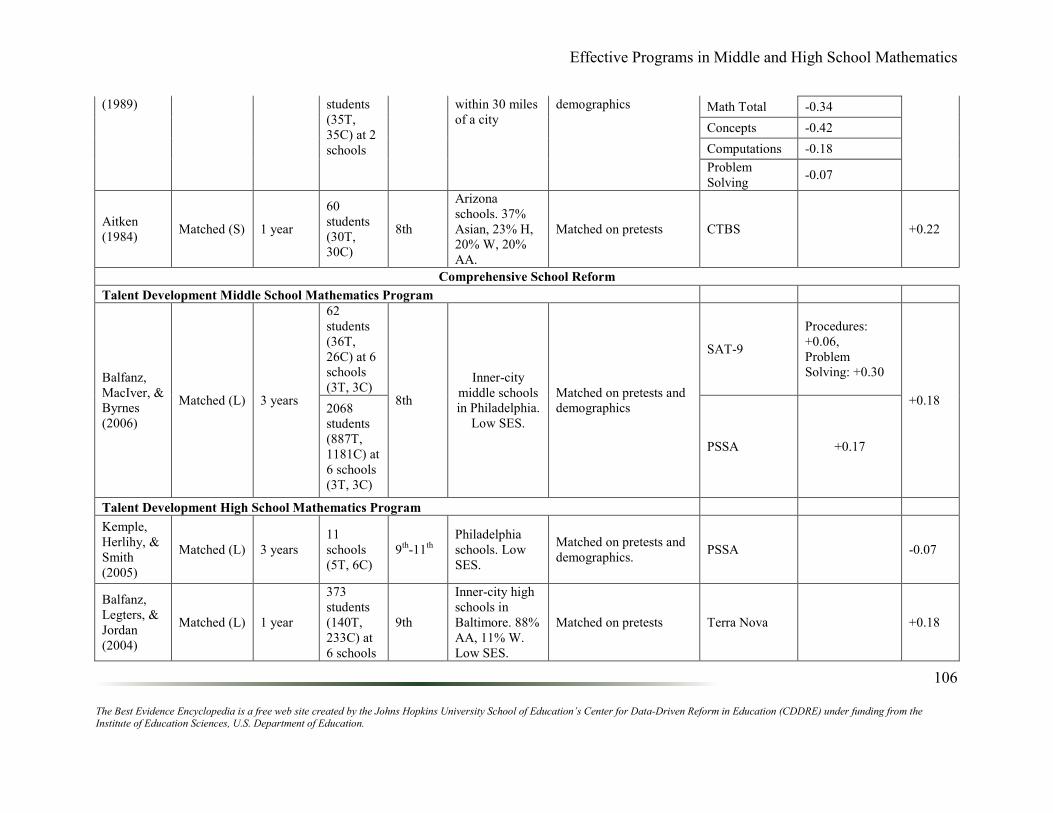
Effective Programs in Middle and High School Mathematics
The Best Evidence Encyclopedia is a free web site created by the Johns Hopkins University School of Education’s Center for Data-Driven Reform in Education (CDDRE) under funding from the Institute of Education Sciences, U.S. Department of Education.
106
(1989) students
(35T,
35C) at 2
schools
within 30 miles
of a city
demographics Math Total -0.34
Concepts -0.42
Computations -0.18
Problem
Solving -0.07
Aitken
(1984) Matched (S) 1 year
60
students
(30T,
30C)
8th
Arizona
schools. 37%
Asian, 23% H,
20% W, 20%
AA.
Matched on pretests CTBS +0.22
Comprehensive School Reform
Talent Development Middle School Mathematics Program
Balfanz,
MacIver, &
Byrnes
(2006)
Matched (L) 3 years
62
students
(36T,
26C) at 6
schools
(3T, 3C) 8th
Inner-city
middle schools
in Philadelphia.
Low SES.
Matched on pretests and
demographics
SAT-9
Procedures:
+0.06,
Problem
Solving: +0.30
+0.18 2068
students
(887T,
1181C) at
6 schools
(3T, 3C)
PSSA +0.17
Talent Development High School Mathematics Program
Kemple,
Herlihy, &
Smith
(2005)
Matched (L) 3 years
11
schools
(5T, 6C)
9th
-11th
Philadelphia
schools. Low
SES.
Matched on pretests and
demographics. PSSA -0.07
Balfanz,
Legters, &
Jordan
(2004)
Matched (L) 1 year
373
students
(140T,
233C) at
6 schools
9th
Inner-city high
schools in
Baltimore. 88%
AA, 11% W.
Low SES.
Matched on pretests Terra Nova +0.18
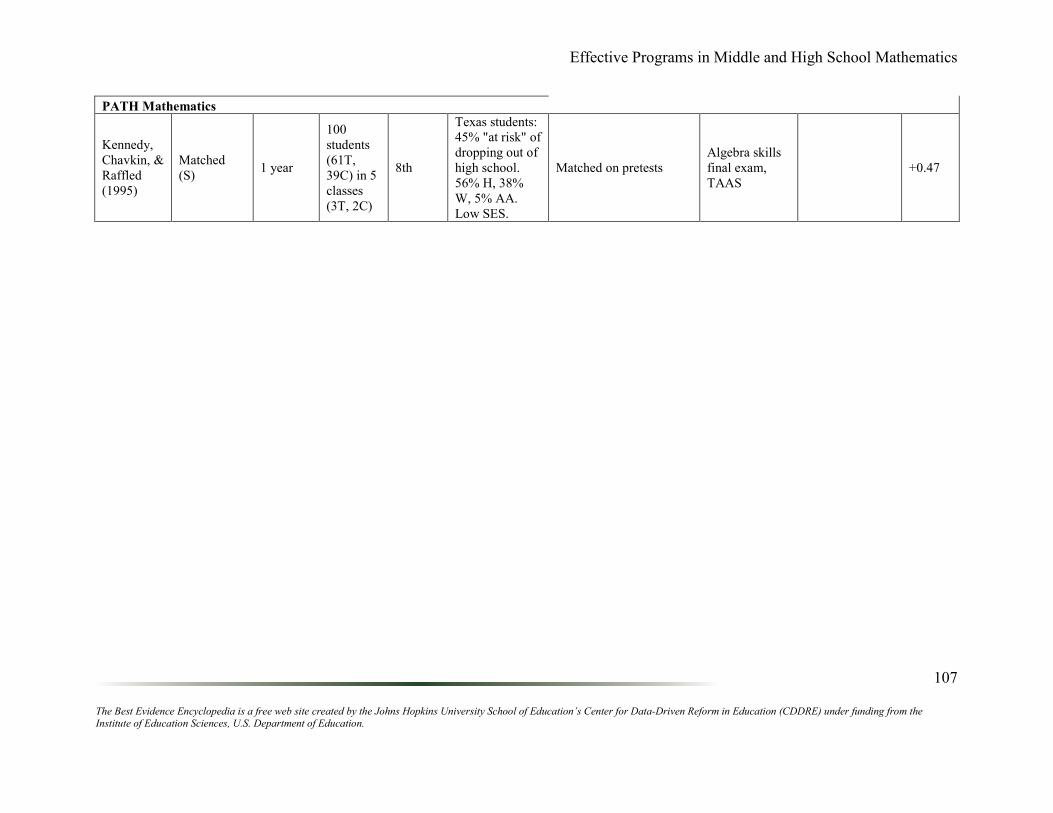
Effective Programs in Middle and High School Mathematics
The Best Evidence Encyclopedia is a free web site created by the Johns Hopkins University School of Education’s Center for Data-Driven Reform in Education (CDDRE) under funding from the Institute of Education Sciences, U.S. Department of Education.
107
PATH Mathematics
Kennedy,
Chavkin, &
Raffled
(1995)
Matched
(S) 1 year
100
students
(61T,
39C) in 5
classes
(3T, 2C)
8th
Texas students:
45% "at risk" of
dropping out of
high school.
56% H, 38%
W, 5% AA.
Low SES.
Matched on pretests
Algebra skills
final exam,
TAAS
+0.47
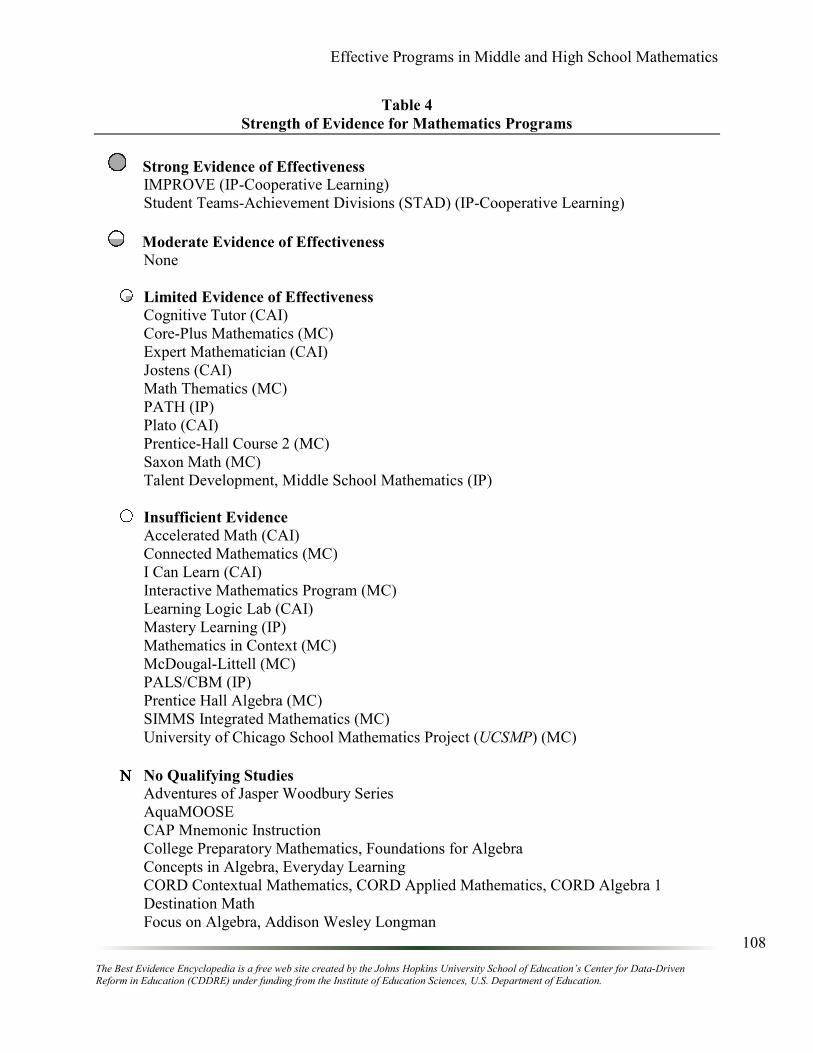
Effective Programs in Middle and High School Mathematics
The Best Evidence Encyclopedia is a free web site created by the Johns Hopkins University School of Education’s Center for Data-Driven Reform in Education (CDDRE) under funding from the Institute of Education Sciences, U.S. Department of Education.
108
Table 4
Strength of Evidence for Mathematics Programs
Strong Evidence of Effectiveness IMPROVE (IP-Cooperative Learning)
Student Teams-Achievement Divisions (STAD) (IP-Cooperative Learning)
Moderate Evidence of Effectiveness None
Limited Evidence of Effectiveness
Cognitive Tutor (CAI)
Core-Plus Mathematics (MC)
Expert Mathematician (CAI)
Jostens (CAI)
Math Thematics (MC)
PATH (IP)
Plato (CAI)
Prentice-Hall Course 2 (MC)
Saxon Math (MC)
Talent Development, Middle School Mathematics (IP)
Insufficient Evidence
Accelerated Math (CAI)
Connected Mathematics (MC)
I Can Learn (CAI)
Interactive Mathematics Program (MC)
Learning Logic Lab (CAI)
Mastery Learning (IP)
Mathematics in Context (MC)
McDougal-Littell (MC)
PALS/CBM (IP)
Prentice Hall Algebra (MC)
SIMMS Integrated Mathematics (MC)
University of Chicago School Mathematics Project (UCSMP) (MC)
ΝΝΝΝ No Qualifying Studies
Adventures of Jasper Woodbury Series
AquaMOOSE
CAP Mnemonic Instruction
College Preparatory Mathematics, Foundations for Algebra
Concepts in Algebra, Everyday Learning
CORD Contextual Mathematics, CORD Applied Mathematics, CORD Algebra 1
Destination Math
Focus on Algebra, Addison Wesley Longman
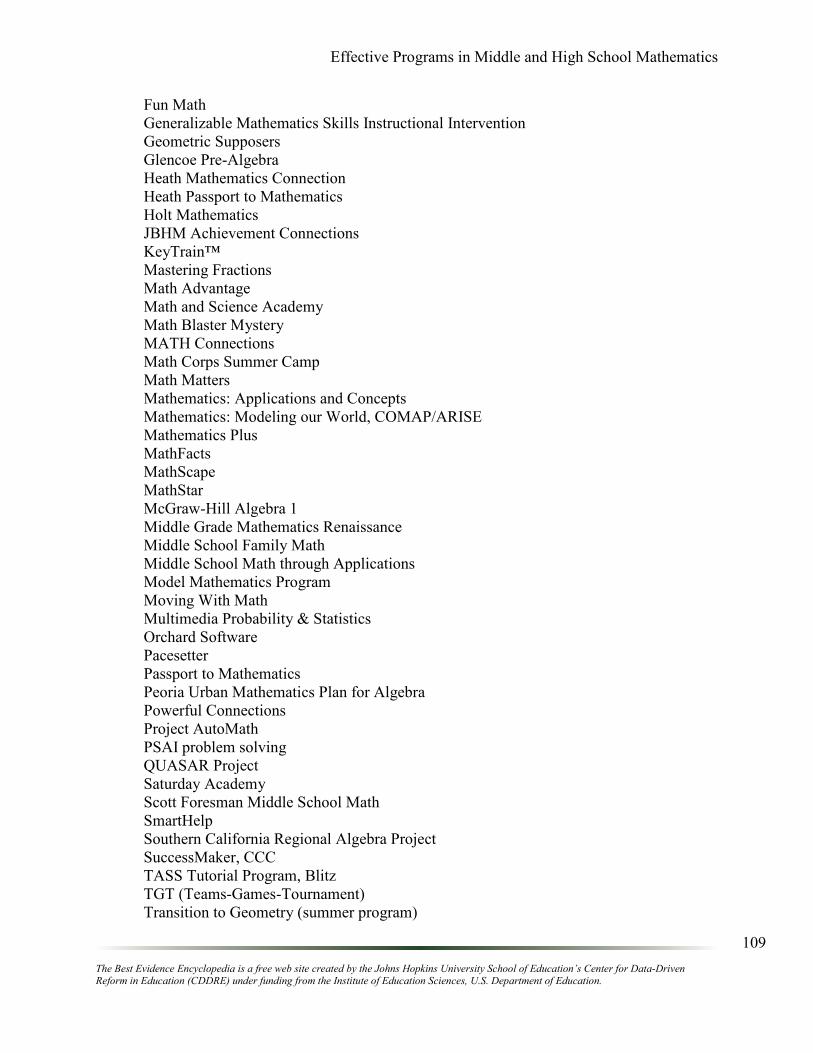
Effective Programs in Middle and High School Mathematics
The Best Evidence Encyclopedia is a free web site created by the Johns Hopkins University School of Education’s Center for Data-Driven Reform in Education (CDDRE) under funding from the Institute of Education Sciences, U.S. Department of Education.
109
Fun Math
Generalizable Mathematics Skills Instructional Intervention
Geometric Supposers
Glencoe Pre-Algebra
Heath Mathematics Connection
Heath Passport to Mathematics
Holt Mathematics
JBHM Achievement Connections
KeyTrain™
Mastering Fractions
Math Advantage
Math and Science Academy
Math Blaster Mystery
MATH Connections
Math Corps Summer Camp
Math Matters
Mathematics: Applications and Concepts
Mathematics: Modeling our World, COMAP/ARISE
Mathematics Plus
MathFacts
MathScape
MathStar
McGraw-Hill Algebra 1
Middle Grade Mathematics Renaissance
Middle School Family Math
Middle School Math through Applications
Model Mathematics Program
Moving With Math
Multimedia Probability & Statistics
Orchard Software
Pacesetter
Passport to Mathematics
Peoria Urban Mathematics Plan for Algebra
Powerful Connections
Project AutoMath
PSAI problem solving
QUASAR Project
Saturday Academy
Scott Foresman Middle School Math
SmartHelp
Southern California Regional Algebra Project
SuccessMaker, CCC
TASS Tutorial Program, Blitz
TGT (Teams-Games-Tournament)
Transition to Geometry (summer program)
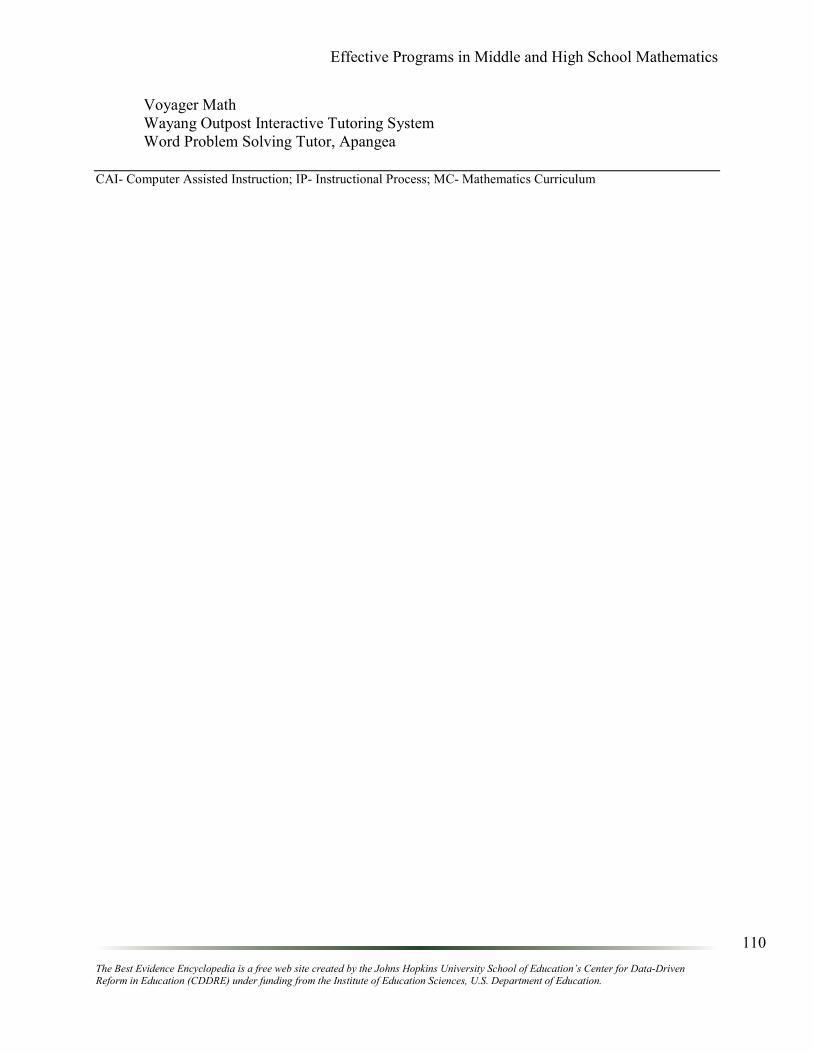
Effective Programs in Middle and High School Mathematics
The Best Evidence Encyclopedia is a free web site created by the Johns Hopkins University School of Education’s Center for Data-Driven Reform in Education (CDDRE) under funding from the Institute of Education Sciences, U.S. Department of Education.
110
Voyager Math
Wayang Outpost Interactive Tutoring System
Word Problem Solving Tutor, Apangea
CAI- Computer Assisted Instruction; IP- Instructional Process; MC- Mathematics Curriculum
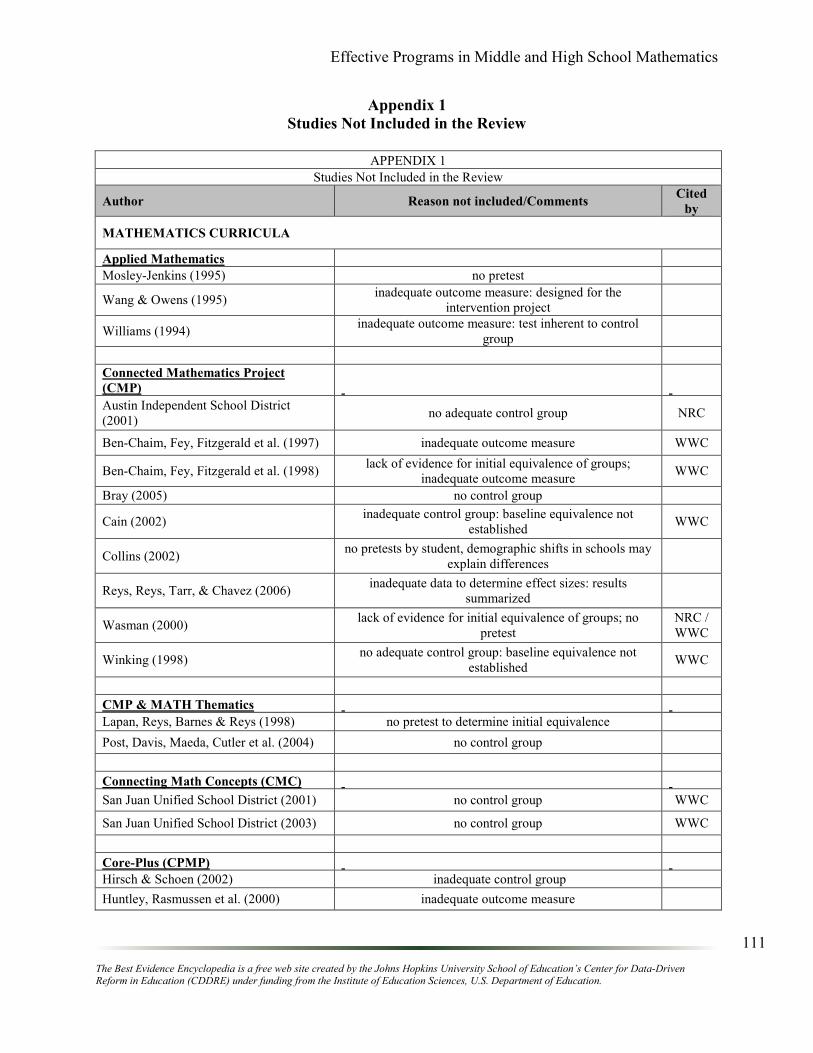
Effective Programs in Middle and High School Mathematics
The Best Evidence Encyclopedia is a free web site created by the Johns Hopkins University School of Education’s Center for Data-Driven Reform in Education (CDDRE) under funding from the Institute of Education Sciences, U.S. Department of Education.
111
Appendix 1
Studies Not Included in the Review
APPENDIX 1
Studies Not Included in the Review
Author Reason not included/Comments Cited
by
MATHEMATICS CURRICULA
Applied Mathematics
Mosley-Jenkins (1995) no pretest
Wang & Owens (1995) inadequate outcome measure: designed for the
intervention project
Williams (1994) inadequate outcome measure: test inherent to control
group
Connected Mathematics Project
(CMP)
Austin Independent School District
(2001) no adequate control group NRC
Ben-Chaim, Fey, Fitzgerald et al. (1997) inadequate outcome measure WWC
Ben-Chaim, Fey, Fitzgerald et al. (1998) lack of evidence for initial equivalence of groups;
inadequate outcome measure WWC
Bray (2005) no control group
Cain (2002) inadequate control group: baseline equivalence not
established WWC
Collins (2002) no pretests by student, demographic shifts in schools may
explain differences
Reys, Reys, Tarr, & Chavez (2006) inadequate data to determine effect sizes: results
summarized
Wasman (2000) lack of evidence for initial equivalence of groups; no
pretest
NRC /
WWC
Winking (1998) no adequate control group: baseline equivalence not
established WWC
CMP & MATH Thematics
Lapan, Reys, Barnes & Reys (1998) no pretest to determine initial equivalence
Post, Davis, Maeda, Cutler et al. (2004) no control group
Connecting Math Concepts (CMC)
San Juan Unified School District (2001) no control group WWC
San Juan Unified School District (2003) no control group WWC
Core-Plus (CPMP)
Hirsch & Schoen (2002) inadequate control group
Huntley, Rasmussen et al. (2000) inadequate outcome measure

Effective Programs in Middle and High School Mathematics
The Best Evidence Encyclopedia is a free web site created by the Johns Hopkins University School of Education’s Center for Data-Driven Reform in Education (CDDRE) under funding from the Institute of Education Sciences, U.S. Department of Education.
112
Mariano (n.d.) no pretest data to establish equivalence; likelihood of
attrition after 2 years; insufficient information
Schoen & Pritchett (1998) outcome measure is not achievement NRC
Schoen & Hirsch (2002) inadequate control group: pretest equivalence not
established
Schoen & Hirsch (2003a) pretest equivalence is not certain NRC
Schoen, Hirsch & Ziebarth (1998) same data better analyzed in Schoen & Hirsch (2003b)
Stucki (2005) no adequate control group
Verkaik (2001) no adequate control group
Walker (1999) outcome measure is not achievement NRC
Interactive Mathematics Program
Boaler (2002) Achievement measure may be inherent to control group;
One-year evaluation of IMP NRC
Clarke, Breed, & Fraser (2004) pretest equivalence not established
Dowling & Webb (1997a) inadequate outcome measure (inherent to the treatment)
Dowling & Webb (1997b) inadequate outcome measure (inherent to the treatment)
Dowling & Webb (1997c) inadequate outcome measure (inherent to the treatment)
Kramer (2002) block and IMP effects can not be seperated
Merlino, F.J., & Wolff, E. (2001). insufficient information on pre and post test data
Schoen (1993) no adequate control group: insufficient match, pretest
equivalence not established
Webb & Dowling (1995a) inadequate control group (one portion used grades as
pretest measure)
Webb & Dowling (1995b) inadequate control group, pretest differences too large
Webb & Dowling (1995c) inadequate control group (pretests were grades in 9th
grade math)
Webb & Dowling (1996) no adequate control group
Webb & Dowling (1997a) inadequate outcome measure (inherent to the treatment)
Webb & Dowling (1997b) inadequate outcome measure (inherent to the treatment)
Mathematics in Context
Holt, Reinhart, & Winston Department of
Research and Curriculum (2005) inadequate control group
Romberg & Shafer (2003) no pretest for control group
Romberg & Shafer (in press) no pretests
Shafer (2003) no adequate equating measures WWC
Webb, Burrill, Romberg et al. (2001) no control group WWC
Moving with Math
Math Teachers Press, Inc. (1996) no control group WWC
Math Teachers Press, Inc. (1998) no control group WWC
Math Teachers Press, Inc. (1999a) no control group WWC
Math Teachers Press, Inc. (1999b) no control group WWC
Math Teachers Press, Inc. (2000a) no control group WWC
Math Teachers Press, Inc. (2000b) no control group WWC
Math Teachers Press, Inc. (2001) no control group WWC
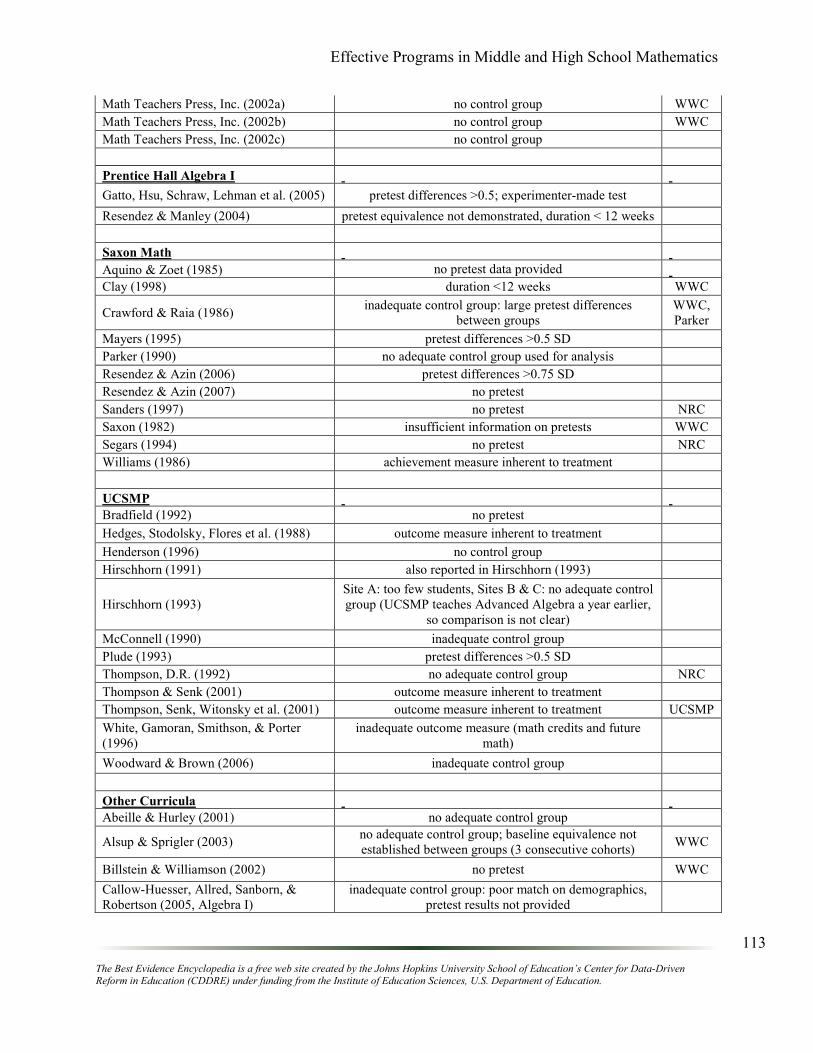
Effective Programs in Middle and High School Mathematics
The Best Evidence Encyclopedia is a free web site created by the Johns Hopkins University School of Education’s Center for Data-Driven Reform in Education (CDDRE) under funding from the Institute of Education Sciences, U.S. Department of Education.
113
Math Teachers Press, Inc. (2002a) no control group WWC
Math Teachers Press, Inc. (2002b) no control group WWC
Math Teachers Press, Inc. (2002c) no control group
Prentice Hall Algebra I
Gatto, Hsu, Schraw, Lehman et al. (2005) pretest differences >0.5; experimenter-made test
Resendez & Manley (2004) pretest equivalence not demonstrated, duration < 12 weeks
Saxon Math
Aquino & Zoet (1985) no pretest data provided
Clay (1998) duration <12 weeks WWC
Crawford & Raia (1986) inadequate control group: large pretest differences
between groups
WWC,
Parker
Mayers (1995) pretest differences >0.5 SD
Parker (1990) no adequate control group used for analysis
Resendez & Azin (2006) pretest differences >0.75 SD
Resendez & Azin (2007) no pretest
Sanders (1997) no pretest NRC
Saxon (1982) insufficient information on pretests WWC
Segars (1994) no pretest NRC
Williams (1986) achievement measure inherent to treatment
UCSMP
Bradfield (1992) no pretest
Hedges, Stodolsky, Flores et al. (1988) outcome measure inherent to treatment
Henderson (1996) no control group
Hirschhorn (1991) also reported in Hirschhorn (1993)
Hirschhorn (1993)
Site A: too few students, Sites B & C: no adequate control
group (UCSMP teaches Advanced Algebra a year earlier,
so comparison is not clear)
McConnell (1990) inadequate control group
Plude (1993) pretest differences >0.5 SD
Thompson, D.R. (1992) no adequate control group NRC
Thompson & Senk (2001) outcome measure inherent to treatment
Thompson, Senk, Witonsky et al. (2001) outcome measure inherent to treatment UCSMP
White, Gamoran, Smithson, & Porter
(1996)
inadequate outcome measure (math credits and future
math)
Woodward & Brown (2006) inadequate control group
Other Curricula
Abeille & Hurley (2001) no adequate control group
Alsup & Sprigler (2003) no adequate control group; baseline equivalence not
established between groups (3 consecutive cohorts) WWC
Billstein & Williamson (2002) no pretest WWC
Callow-Huesser, Allred, Sanborn, &
Robertson (2005, Algebra I)
inadequate control group: poor match on demographics,
pretest results not provided
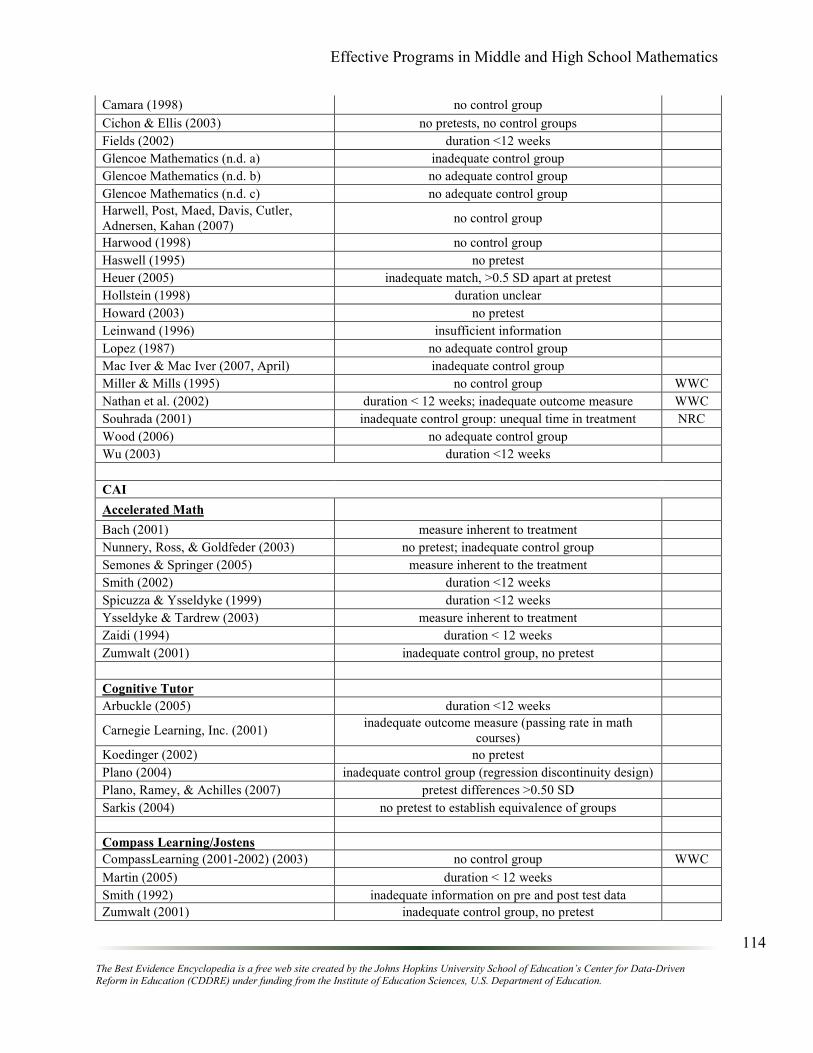
Effective Programs in Middle and High School Mathematics
The Best Evidence Encyclopedia is a free web site created by the Johns Hopkins University School of Education’s Center for Data-Driven Reform in Education (CDDRE) under funding from the Institute of Education Sciences, U.S. Department of Education.
114
Camara (1998) no control group
Cichon & Ellis (2003) no pretests, no control groups
Fields (2002) duration <12 weeks
Glencoe Mathematics (n.d. a) inadequate control group
Glencoe Mathematics (n.d. b) no adequate control group
Glencoe Mathematics (n.d. c) no adequate control group
Harwell, Post, Maed, Davis, Cutler,
Adnersen, Kahan (2007) no control group
Harwood (1998) no control group
Haswell (1995) no pretest
Heuer (2005) inadequate match, >0.5 SD apart at pretest
Hollstein (1998) duration unclear
Howard (2003) no pretest
Leinwand (1996) insufficient information
Lopez (1987) no adequate control group
Mac Iver & Mac Iver (2007, April) inadequate control group
Miller & Mills (1995) no control group WWC
Nathan et al. (2002) duration < 12 weeks; inadequate outcome measure WWC
Souhrada (2001) inadequate control group: unequal time in treatment NRC
Wood (2006) no adequate control group
Wu (2003) duration <12 weeks
CAI
Accelerated Math
Bach (2001) measure inherent to treatment
Nunnery, Ross, & Goldfeder (2003) no pretest; inadequate control group
Semones & Springer (2005) measure inherent to the treatment
Smith (2002) duration <12 weeks
Spicuzza & Ysseldyke (1999) duration <12 weeks
Ysseldyke & Tardrew (2003) measure inherent to treatment
Zaidi (1994) duration < 12 weeks
Zumwalt (2001) inadequate control group, no pretest
Cognitive Tutor
Arbuckle (2005) duration <12 weeks
Carnegie Learning, Inc. (2001) inadequate outcome measure (passing rate in math
courses)
Koedinger (2002) no pretest
Plano (2004) inadequate control group (regression discontinuity design)
Plano, Ramey, & Achilles (2007) pretest differences >0.50 SD
Sarkis (2004) no pretest to establish equivalence of groups
Compass Learning/Jostens
CompassLearning (2001-2002) (2003) no control group WWC
Martin (2005) duration < 12 weeks
Smith (1992) inadequate information on pre and post test data
Zumwalt (2001) inadequate control group, no pretest
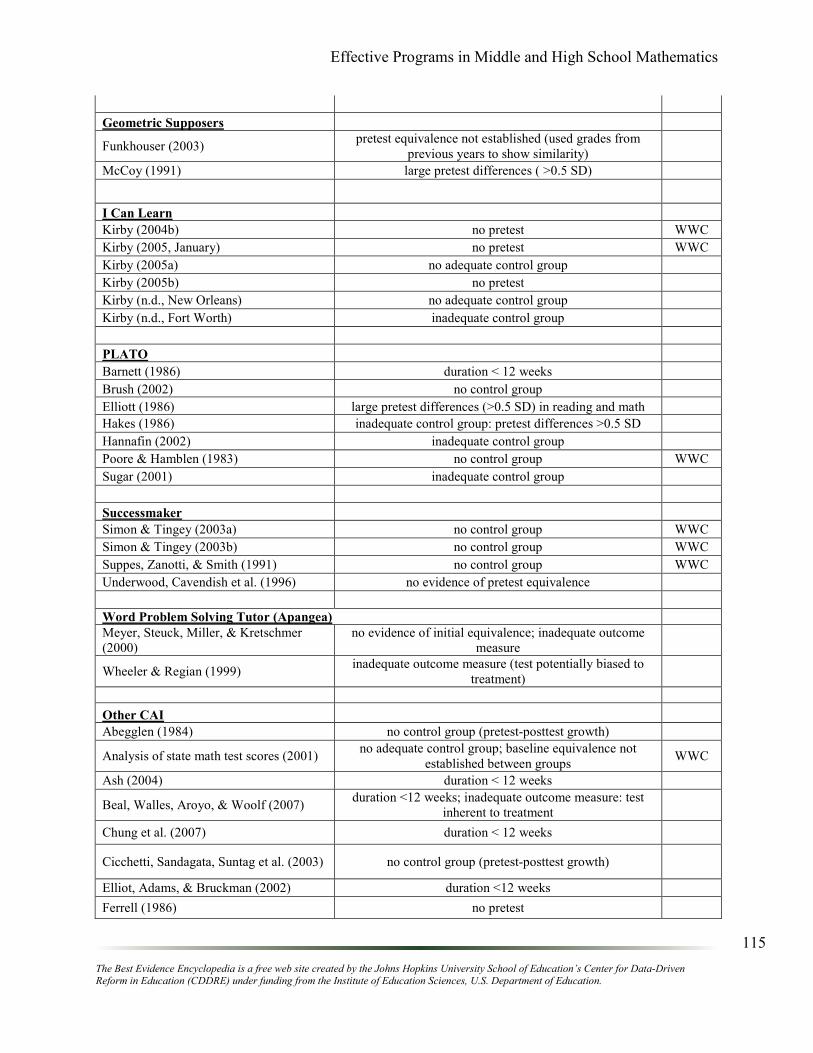
Effective Programs in Middle and High School Mathematics
The Best Evidence Encyclopedia is a free web site created by the Johns Hopkins University School of Education’s Center for Data-Driven Reform in Education (CDDRE) under funding from the Institute of Education Sciences, U.S. Department of Education.
115
Geometric Supposers
Funkhouser (2003) pretest equivalence not established (used grades from
previous years to show similarity)
McCoy (1991) large pretest differences ( >0.5 SD)
I Can Learn
Kirby (2004b) no pretest WWC
Kirby (2005, January) no pretest WWC
Kirby (2005a) no adequate control group
Kirby (2005b) no pretest
Kirby (n.d., New Orleans) no adequate control group
Kirby (n.d., Fort Worth) inadequate control group
PLATO
Barnett (1986) duration < 12 weeks
Brush (2002) no control group
Elliott (1986) large pretest differences (>0.5 SD) in reading and math
Hakes (1986) inadequate control group: pretest differences >0.5 SD
Hannafin (2002) inadequate control group
Poore & Hamblen (1983) no control group WWC
Sugar (2001) inadequate control group
Successmaker
Simon & Tingey (2003a) no control group WWC
Simon & Tingey (2003b) no control group WWC
Suppes, Zanotti, & Smith (1991) no control group WWC
Underwood, Cavendish et al. (1996) no evidence of pretest equivalence
Word Problem Solving Tutor (Apangea)
Meyer, Steuck, Miller, & Kretschmer
(2000)
no evidence of initial equivalence; inadequate outcome
measure
Wheeler & Regian (1999) inadequate outcome measure (test potentially biased to
treatment)
Other CAI
Abegglen (1984) no control group (pretest-posttest growth)
Analysis of state math test scores (2001) no adequate control group; baseline equivalence not
established between groups WWC
Ash (2004) duration < 12 weeks
Beal, Walles, Aroyo, & Woolf (2007) duration <12 weeks; inadequate outcome measure: test
inherent to treatment
Chung et al. (2007) duration < 12 weeks
Cicchetti, Sandagata, Suntag et al. (2003) no control group (pretest-posttest growth)
Elliot, Adams, & Bruckman (2002) duration <12 weeks
Ferrell (1986) no pretest
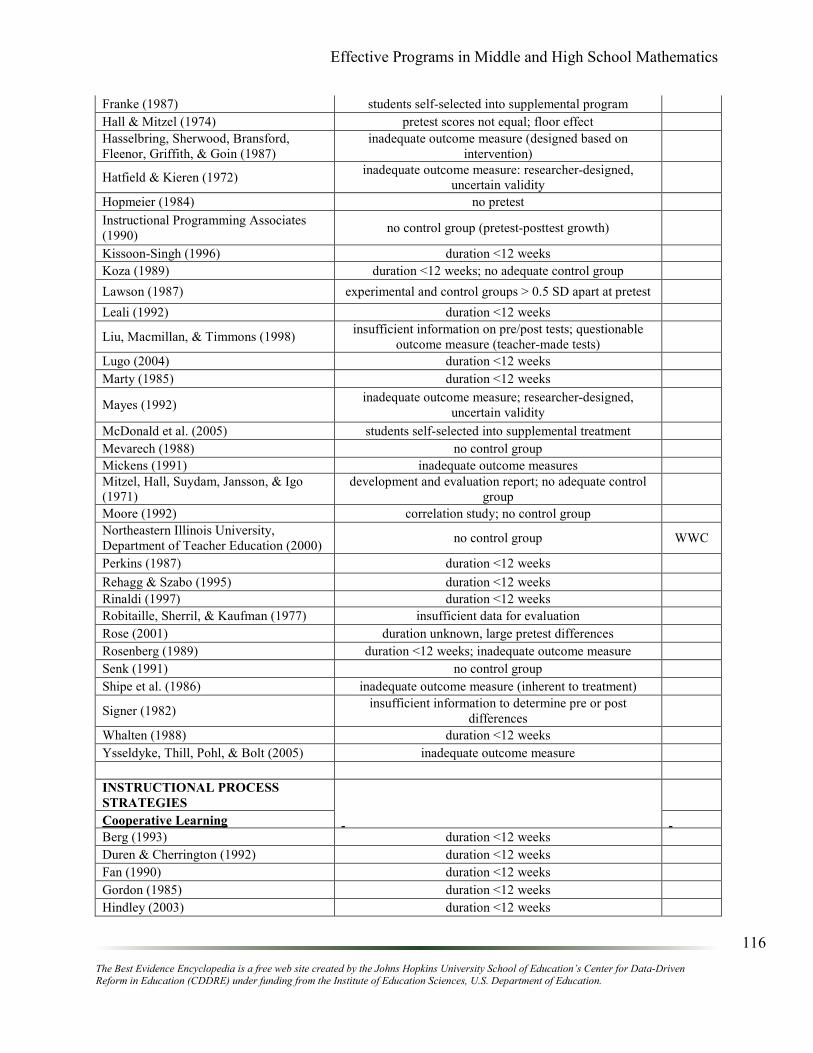
Effective Programs in Middle and High School Mathematics
The Best Evidence Encyclopedia is a free web site created by the Johns Hopkins University School of Education’s Center for Data-Driven Reform in Education (CDDRE) under funding from the Institute of Education Sciences, U.S. Department of Education.
116
Franke (1987) students self-selected into supplemental program
Hall & Mitzel (1974) pretest scores not equal; floor effect
Hasselbring, Sherwood, Bransford,
Fleenor, Griffith, & Goin (1987)
inadequate outcome measure (designed based on
intervention)
Hatfield & Kieren (1972) inadequate outcome measure: researcher-designed,
uncertain validity
Hopmeier (1984) no pretest
Instructional Programming Associates
(1990) no control group (pretest-posttest growth)
Kissoon-Singh (1996) duration <12 weeks
Koza (1989) duration <12 weeks; no adequate control group
Lawson (1987) experimental and control groups > 0.5 SD apart at pretest
Leali (1992) duration <12 weeks
Liu, Macmillan, & Timmons (1998) insufficient information on pre/post tests; questionable
outcome measure (teacher-made tests)
Lugo (2004) duration <12 weeks
Marty (1985) duration <12 weeks
Mayes (1992) inadequate outcome measure; researcher-designed,
uncertain validity
McDonald et al. (2005) students self-selected into supplemental treatment
Mevarech (1988) no control group
Mickens (1991) inadequate outcome measures
Mitzel, Hall, Suydam, Jansson, & Igo
(1971)
development and evaluation report; no adequate control
group
Moore (1992) correlation study; no control group
Northeastern Illinois University,
Department of Teacher Education (2000) no control group WWC
Perkins (1987) duration <12 weeks
Rehagg & Szabo (1995) duration <12 weeks
Rinaldi (1997) duration <12 weeks
Robitaille, Sherril, & Kaufman (1977) insufficient data for evaluation
Rose (2001) duration unknown, large pretest differences
Rosenberg (1989) duration <12 weeks; inadequate outcome measure
Senk (1991) no control group
Shipe et al. (1986) inadequate outcome measure (inherent to treatment)
Signer (1982) insufficient information to determine pre or post
differences
Whalten (1988) duration <12 weeks
Ysseldyke, Thill, Pohl, & Bolt (2005) inadequate outcome measure
INSTRUCTIONAL PROCESS
STRATEGIES
Cooperative Learning
Berg (1993) duration <12 weeks
Duren & Cherrington (1992) duration <12 weeks
Fan (1990) duration <12 weeks
Gordon (1985) duration <12 weeks
Hindley (2003) duration <12 weeks
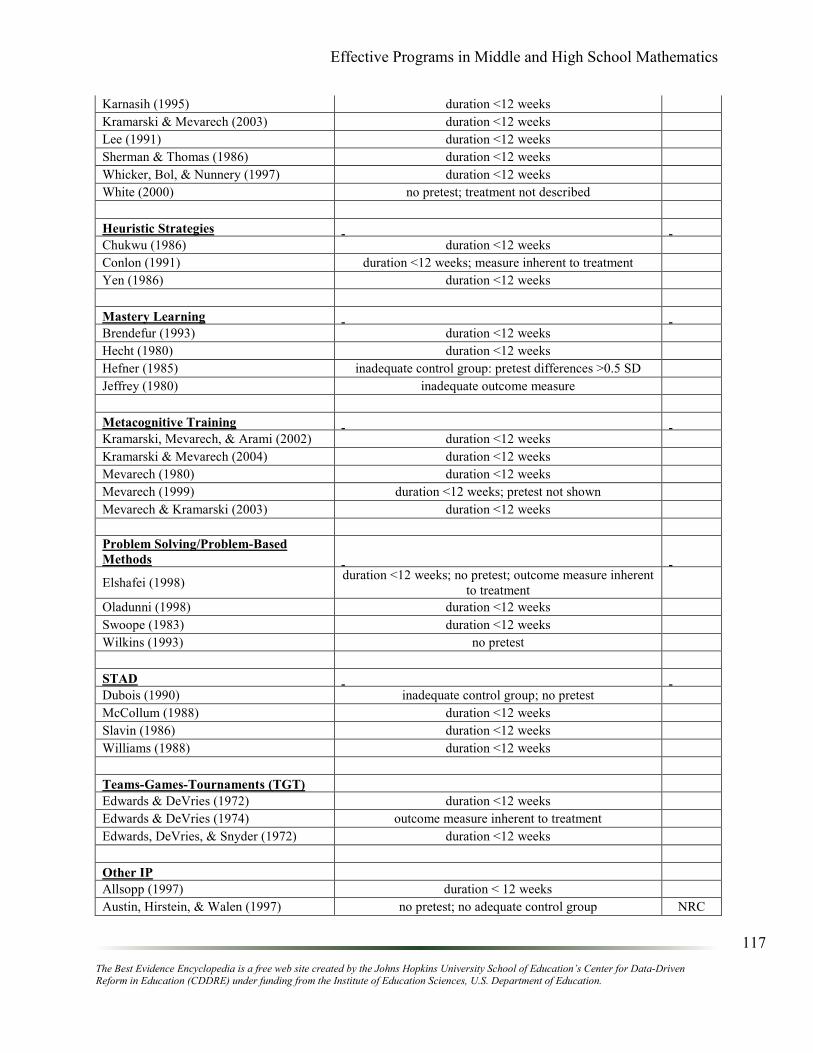
Effective Programs in Middle and High School Mathematics
The Best Evidence Encyclopedia is a free web site created by the Johns Hopkins University School of Education’s Center for Data-Driven Reform in Education (CDDRE) under funding from the Institute of Education Sciences, U.S. Department of Education.
117
Karnasih (1995) duration <12 weeks
Kramarski & Mevarech (2003) duration <12 weeks
Lee (1991) duration <12 weeks
Sherman & Thomas (1986) duration <12 weeks
Whicker, Bol, & Nunnery (1997) duration <12 weeks
White (2000) no pretest; treatment not described
Heuristic Strategies
Chukwu (1986) duration <12 weeks
Conlon (1991) duration <12 weeks; measure inherent to treatment
Yen (1986) duration <12 weeks
Mastery Learning
Brendefur (1993) duration <12 weeks
Hecht (1980) duration <12 weeks
Hefner (1985) inadequate control group: pretest differences >0.5 SD
Jeffrey (1980) inadequate outcome measure
Metacognitive Training
Kramarski, Mevarech, & Arami (2002) duration <12 weeks
Kramarski & Mevarech (2004) duration <12 weeks
Mevarech (1980) duration <12 weeks
Mevarech (1999) duration <12 weeks; pretest not shown
Mevarech & Kramarski (2003) duration <12 weeks
Problem Solving/Problem-Based
Methods
Elshafei (1998) duration <12 weeks; no pretest; outcome measure inherent
to treatment
Oladunni (1998) duration <12 weeks
Swoope (1983) duration <12 weeks
Wilkins (1993) no pretest
STAD
Dubois (1990) inadequate control group; no pretest
McCollum (1988) duration <12 weeks
Slavin (1986) duration <12 weeks
Williams (1988) duration <12 weeks
Teams-Games-Tournaments (TGT)
Edwards & DeVries (1972) duration <12 weeks
Edwards & DeVries (1974) outcome measure inherent to treatment
Edwards, DeVries, & Snyder (1972) duration <12 weeks
Other IP
Allsopp (1997) duration < 12 weeks
Austin, Hirstein, & Walen (1997) no pretest; no adequate control group NRC
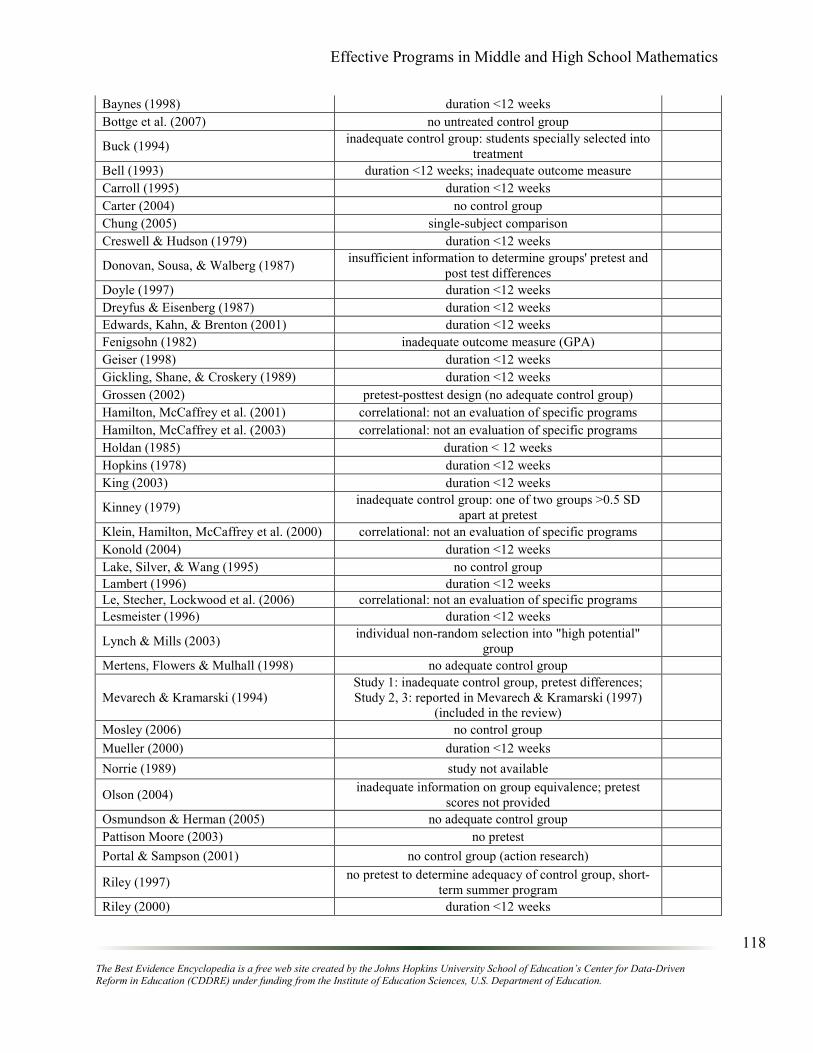
Effective Programs in Middle and High School Mathematics
The Best Evidence Encyclopedia is a free web site created by the Johns Hopkins University School of Education’s Center for Data-Driven Reform in Education (CDDRE) under funding from the Institute of Education Sciences, U.S. Department of Education.
118
Baynes (1998) duration <12 weeks
Bottge et al. (2007) no untreated control group
Buck (1994) inadequate control group: students specially selected into
treatment
Bell (1993) duration <12 weeks; inadequate outcome measure
Carroll (1995) duration <12 weeks
Carter (2004) no control group
Chung (2005) single-subject comparison
Creswell & Hudson (1979) duration <12 weeks
Donovan, Sousa, & Walberg (1987) insufficient information to determine groups' pretest and
post test differences
Doyle (1997) duration <12 weeks
Dreyfus & Eisenberg (1987) duration <12 weeks
Edwards, Kahn, & Brenton (2001) duration <12 weeks
Fenigsohn (1982) inadequate outcome measure (GPA)
Geiser (1998) duration <12 weeks
Gickling, Shane, & Croskery (1989) duration <12 weeks
Grossen (2002) pretest-posttest design (no adequate control group)
Hamilton, McCaffrey et al. (2001) correlational: not an evaluation of specific programs
Hamilton, McCaffrey et al. (2003) correlational: not an evaluation of specific programs
Holdan (1985) duration < 12 weeks
Hopkins (1978) duration <12 weeks
King (2003) duration <12 weeks
Kinney (1979) inadequate control group: one of two groups >0.5 SD
apart at pretest
Klein, Hamilton, McCaffrey et al. (2000) correlational: not an evaluation of specific programs
Konold (2004) duration <12 weeks
Lake, Silver, & Wang (1995) no control group
Lambert (1996) duration <12 weeks
Le, Stecher, Lockwood et al. (2006) correlational: not an evaluation of specific programs
Lesmeister (1996) duration <12 weeks
Lynch & Mills (2003) individual non-random selection into "high potential"
group
Mertens, Flowers & Mulhall (1998) no adequate control group
Mevarech & Kramarski (1994)
Study 1: inadequate control group, pretest differences;
Study 2, 3: reported in Mevarech & Kramarski (1997)
(included in the review)
Mosley (2006) no control group
Mueller (2000) duration <12 weeks
Norrie (1989) study not available
Olson (2004) inadequate information on group equivalence; pretest
scores not provided
Osmundson & Herman (2005) no adequate control group
Pattison Moore (2003) no pretest
Portal & Sampson (2001) no control group (action research)
Riley (1997) no pretest to determine adequacy of control group, short-
term summer program
Riley (2000) duration <12 weeks
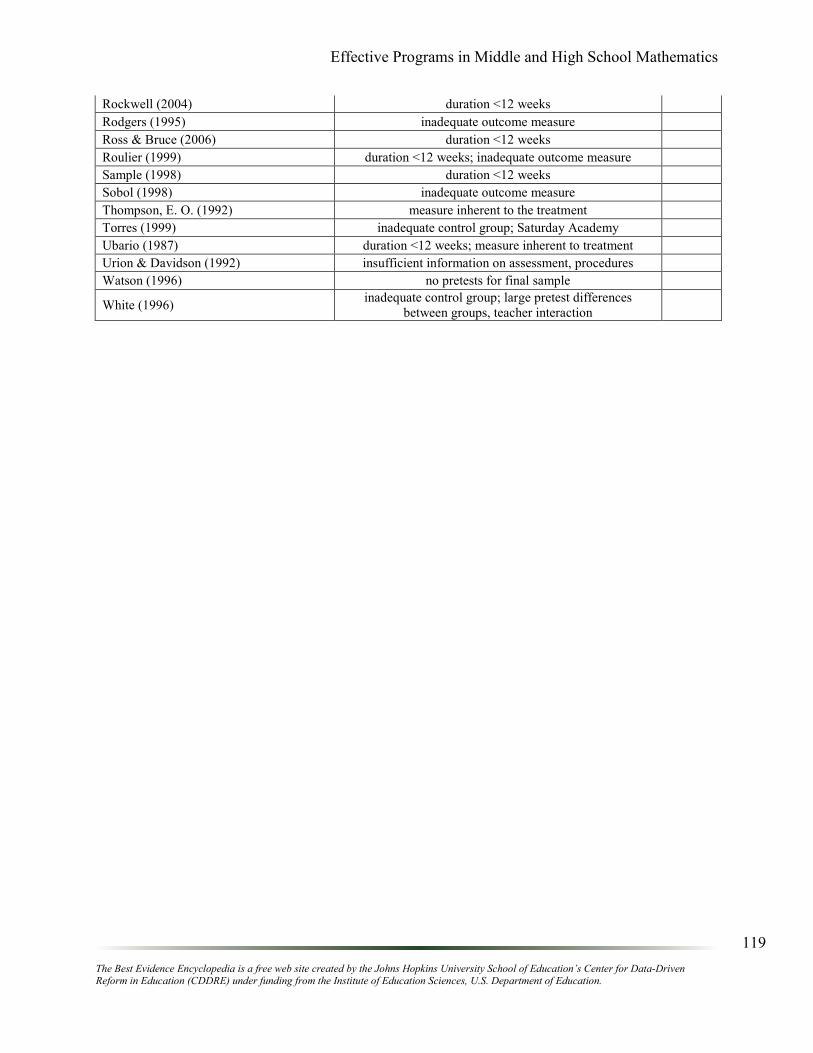
Effective Programs in Middle and High School Mathematics
The Best Evidence Encyclopedia is a free web site created by the Johns Hopkins University School of Education’s Center for Data-Driven Reform in Education (CDDRE) under funding from the Institute of Education Sciences, U.S. Department of Education.
119
Rockwell (2004) duration <12 weeks
Rodgers (1995) inadequate outcome measure
Ross & Bruce (2006) duration <12 weeks
Roulier (1999) duration <12 weeks; inadequate outcome measure
Sample (1998) duration <12 weeks
Sobol (1998) inadequate outcome measure
Thompson, E. O. (1992) measure inherent to the treatment
Torres (1999) inadequate control group; Saturday Academy
Ubario (1987) duration <12 weeks; measure inherent to treatment
Urion & Davidson (1992) insufficient information on assessment, procedures
Watson (1996) no pretests for final sample
White (1996) inadequate control group; large pretest differences
between groups, teacher interaction
Effective Programs in Middle and High School Mathematics
The Best Evidence Encyclopedia is a free web site created by the Johns Hopkins University School of Education’s Center for Data-Driven Reform in Education (CDDRE) under funding from the Institute of Education Sciences, U.S. Department of Education.
120
Appendix 2
Table of Abbreviations
AA – African American
ACT- American College Testing
ANCOVA- Analysis of Covariance
ATDQT- Ability to Do Quantitative Thinking (subtest of ITED)
BSAP- Basic Skills Assessment Program
BST- Basic Skills Test
C- Control
CAI- Computer-Assisted Instruction
CAP – California Assessment Program
CAT- California Achievement Test
CMP- Connected Mathematics Program
CPM- College Preparatory Mathematics
CSR- Comprehensive School Reform
CST – California Standards Test
CTBS- Comprehensive Test of Basic Skills
E - Experimental
ERIC- Educational Resources Information Center
ES- Effect Size
ETS- Educational Testing Service
FCAT- Florida Comprehensive Assessment Test
FL – Free/Reduced Price Lunch
H - Hispanic
HLM- Hierarchical Linear Modeling
HSST- High School Subjects Test
IAAT- Iowa Algebra Aptitude Test
ICL- I Can Learn
IEA- International Association for the Evaluation of Educational Achievement
ILS- Integrated Learning System
IP- Instructional Process Program
ITBS- Iowa Tests of Basic Skills
ITED- Iowa Tests of Educational Development
IMP- Interactive Mathematics Program
KSA- Kansas State Assessment
LEAP – Louisiana Educational Assessment Program
LEP- Limited English proficient
M- Matched
MANCOVA- Multivariate Analysis of Variance
MAP – Missouri Assessment Program
MAT- Metropolitan Achievement Test
MC- Mathematics Curriculum
MCAS- Massachusetts Comprehensive Assessment System
Effective Programs in Middle and High School Mathematics
The Best Evidence Encyclopedia is a free web site created by the Johns Hopkins University School of Education’s Center for Data-Driven Reform in Education (CDDRE) under funding from the Institute of Education Sciences, U.S. Department of Education.
121
MCT- Mississippi Curriculum Test
MPH- Matched Post-Hoc
NAEP- National Assessment of Educational Progress
NCTM- National Council of Teachers of Mathematics
NRC- National Research Council
NSF- National Science Foundation
NWEA – Northwest Evaluation Association
OECD- Organization for Economic Cooperation and Development
PISA- Program for International Student Assessment
PSAT – Preliminary Scholastic Achievement Test
PSM- Lane County Problem Solving Method
PSSA- Pennsylvania Assessments
PUMP- Pittsburgh Urban Mathematics Project
RE- Randomized Experiment
RQE- Randomized Quasi-Experiment
SAT- Stanford Achievement Test
SCAT- School and College Ability Tests
SD- Standard Deviation
SDMT- Stanford Diagnostic Mathematics Test
SIMMS-IM- Systemic Initiative for Montana Mathematics and Science, Integrated Mathematics
SOL- Virginia Standards of Learning
SRA- Science Research Associates
SSAT – Secondary School Admissions Test
STAD- Student Teams-Achievement Divisions
STEP- Sequential Tests of Educational Progress
T- Treatment
TAAS- Texas Assessment of Academic Skills
TAKS- Texas Assessment of Knowledge and Skills
TCAP- Tennessee Comprehensive Achievement Test
TDHS- Talent Development High School
TDMS- Talent Development Middle School
TIMSS- Trends in International Mathematics and Science Study
TLI- Texas Learning Index
UCMP- University of Chicago Mathematics Project
UCSMP- University of Chicago School Mathematics Project
W - White
WASL- Washington Assessment of Student Learning
WICAT- World Institute for Computer-Assisted Teaching