effective tax rates letter - cbo
TRANSCRIPT

CONGRESSIONAL BUDGET OFFICE U.S. Congress Washington, DC 20515
December 23, 2008
Honorable Max Baucus Chairman Committee on Finance United States Senate Washington, DC 20510 Dear Mr. Chairman: The Congressional Budget Office (CBO) regularly publishes analyses of the distribution of federal taxes and household income. The most recent report, Historical Effective Federal Tax Rates: 1979 to 2005, was released in December 2007. At your request, CBO has prepared the attached supplement to that report. The supplement provides data on federal taxes and household income for additional income groups as well as information about the sources of household income. We would be pleased to answer any further questions you may have. I can be reached at (202) 226-2700. The staff contact is Ed Harris, who can be reached at (202) 226-2690. Sincerely, Robert A. Sunshine Acting Director Attachment cc: Honorable Charles E. Grassley Ranking Member Honorable Charles Rangel Chairman Committee on Ways and Means Honorable Jim McCrery Ranking Member
www.cbo.gov


Historical Effective Tax Rates, 1979 to 2005:
Supplement with Additional Data on Sources of Income and High-Income Households
December 2008
This supplement provides additional data on historical effective federal tax rates as estimated by the Congressional Budget Office (CBO) for the years 1979 through 2005. The data presented in this report show aggregate income and federal taxes, by source, for various income groupings, including a finer disaggregation in the highest income percentile. CBO derives its estimates from Internal Revenue Service data on individual income tax returns, supplemented with information from the Bureau of the Census’s Current Population Survey. Details about CBO’s methodology and additional tables are available on the agency’s Web site in the special collection “Distribution of Federal Taxes.” Effective Tax Rates and Tax Shares for High-Income Households This supplement provides data on federal taxes and household income for subgroups of the 1 percent of people with the highest income, including the 0.01 percent of people at the very top of the income scale (the top one-hundredth of 1 percent). CBO has previously estimated that the total federal effective tax rate (total federal taxes divided by comprehensive household income) for the 1 percent of the population with the highest income was 31.2 percent in 2005.1 The disaggregation presented in this analysis shows little difference in the total federal effective tax rates among subgroups of the top 1 percent. Those rates range from about 30 percent for people in the lower half of the top 1 percent to about 32 percent for people in the top tenth of 1 percent (see Table 1). CBO’s previous estimates show an effective individual income tax rate of 19.4 percent in 2005 for the 1 percent of the population with the highest income. There was little variation among subgroups in the top 1 percent, except for people in the top 0.01 percent, whose effective individual income tax rate was 17.0 percent in 2005. That lower rate results from the combination of a large share of income (44 percent) from capital gains among households in that group in 2005 and a lower tax rate on capital gains than on other income. High-income households have a disproportionate share of comprehensive income and pay a disproportionate share of federal taxes. The half-percent of the population with the highest income received 14.7 percent of total household income before taxes and paid 22.6 percent of total federal taxes in 2005 (see Tables 2 and 3). People at the top 0.01
1 Congressional Budget Office, Historical Effective Tax Rates: 1979 to 2005 (December 2007).

percent of the income scale received 4.2 percent of total income and paid 6.5 percent of total federal taxes in 2005. The half-percent of the population with the highest income paid 31.5 percent of federal individual income taxes, while the top 0.01 percent paid 8.0 percent of individual income taxes in 2005. Sources of Income This supplement also provides information on the sources of household income for all income groups, information not contained in previous CBO reports. For this analysis, CBO divided pretax household income into the following categories:
Wages: Cash wage and salary payments as well as employees’ contributions to 401(k) retirement plans.
Proprietors’ income: Net income from businesses and farms operated solely by their owners. The tax system considers this income to be labor income, and it is part of the payroll tax base.
Other business income: Partnership income, income from S corporations, and positive rental income. This income is a mix of labor and capital income.
Interest and dividends: Taxable and tax-exempt interest and dividends paid by C corporations (but not S corporations, the interest and dividends of which are considered other business income).
Capital gains: Profits realized from the sale of assets. Unrealized capital gains are not included.
Pension income: Income received in retirement for past services. This category also includes taxable withdrawals from individual retirement accounts and deferred compensation plans. Income is counted when it is distributed to the pensioner, not as it accrues inside retirement plans. This income is a mix of labor and capital income.
Cash transfers: Payments from Social Security, Unemployment Insurance, Supplemental Security Income, Aid to Families with Dependent Children, Temporary Assistance for Needy Families, veterans’ benefits, and workers’ compensation.
In-kind income: Employer-paid health insurance premiums, food stamps, school lunches and breakfasts, housing assistance, energy assistance, and the fungible value of Medicare and Medicaid, as estimated in the Current Population Survey.
2

Imputed taxes: Corporate income taxes and the employer’s share of Social Security, Medicare, and federal unemployment insurance payroll taxes. CBO assumes in this analysis that the employer’s share of payroll taxes is passed on to employees in the form of lower wages and that corporate income taxes are borne by owners of capital in proportion to their income from interest, dividends, capital gains, and rents. Therefore, the amount of those taxes is included in household income, and the taxes are counted as part of a household’s tax burden.
Wages accounted for 55.3 percent of total household income in 2005 (see Table 4). Wages account for more than half of total household income in all income groups, except for the 20 percent of people in the lowest income households (for whom wages were 47.5 percent of total income) and the 1 percent of people in households with the highest income. The overall wage share declined from 63.9 percent in 1979. Only for people in the lowest quintile (zero to 20th percentile) did the wage share rise, from 40.4 percent to 47.5 percent. For the remaining income groups up through the 95th percentile, the share generally fell. The wage share increased for the lowest income group as the share of income from cash transfers (Social Security, unemployment insurance, and low-income assistance) decreased from 34.3 percent to 23.1 percent. That change reflected a shift in the composition of the bottom quintile. In 1979, elderly childless households (households headed by a person age 65 and older and with no members under age 18) accounted for 35 percent of households in the bottom quintile. By 2005, elderly households accounted for only 24 percent of the lowest income quintile. The declining wage share for other income groups was accompanied by an increased share of comprehensive income from pensions and in-kind income—consisting mainly of employment-based health insurance and Medicare. Capital income grows in importance at the very top of the distribution. Interest, dividends, and realized capital gains accounted for 29.8 percent of pretax household income for people in the 99.5 through 99.9 percentiles, 42.6 percent of income for people in the 99.9 through 99.99 percentiles, and 55.9 percent of income for the 0.01 percent of the population with the very highest income. Other business income—which includes partnership income, income from S corporations, and rental income and is thus a mix of labor and capital income—was 3 percent or less of total pretax income for people in all income groups up through the 95th percentile in 2005. In contrast, other business income accounted for 15 percent to 20 percent of total income for groups at or above the 99th percentile in 2005. This analysis also presents information on aggregate income and federal taxes, by income and tax source, for all income groups for 1979 to 2005 (see Table 5).
3

Appendix: Comparing Income Totals to Estimates from the National Income and Product Accounts
The Bureau of Economic Analysis (BEA) publishes estimates of the total personal income earned in the household sector as part of the national income and product accounts (NIPAs). This appendix compares shares of total income by income source from the Congressional Budget Office’s (CBO’s) measure of household income with those in the NIPAs. Trends in income shares are broadly consistent across the two measures, despite numerous differences in the two income concepts. CBO’s measure of household income differs from NIPA personal income in many ways. NIPA income covers income earned in current production, whereas CBO’s household income measure is generally based on cash receipts, consistent with income reported on tax returns and in the Current Population Survey (CPS). Pension income provides a stark example of that difference. The NIPA measure includes employers’ contributions to a pension fund at the time they are made and any interest and dividends earned by pension funds as they accrue, but it excludes pension payments made to retirees. In contrast, CBO’s measure records only the pension payments made to retirees. Similarly, CBO includes capital gains realized on the sale of assets, but the NIPA measure of personal income does not. Another conceptual distinction concerns the population covered by the estimates. CBO’s measure includes only income received directly by households. The NIPA measure includes income earned on behalf of people by institutions such as nonprofits, pension funds, and insurance companies. Those institutions have substantial capital income, so NIPA measures of interest and dividends are significantly higher than CBO’s measure. Even among the many components common to both income concepts, substantial measurement differences exist. For example, BEA adjusts income for underreporting, and the adjustments can be quite large. Other researchers have detailed the differences between NIPA personal income, the CPS measure of money income, and adjusted gross income as reported on tax returns. (The latter two measures are the source of CBO’s measure of household income.)2 To compare income shares, CBO adjusts its household income measure to make it more comparable with the NIPA measure. First, CBO removes three components from its measure—capital gains, pensions, and corporate income taxes—because they are not
2 Mark Ledbetter, “Comparison of BEA Estimates of Personal Income and IRS Estimates of Adjusted Gross Income: New Estimates for 2005, Revised Estimates For 2004,” Survey of Current Business (November 2007); and John Ruser, Adrienne Pilot, and Charles Nelson, “Alternative Measures of Household Income: BEA Personal Income, CPS Money Income, and Beyond” (presentation to the Federal Economic Statistics Advisory Commission, December 2004).
4

included in NIPA personal income. Second, CBO reallocates income into categories more consistent with those used by BEA.3 After making those adjustments, CBO found that trends in the income shares were broadly similar across the two measures. Under both measures, income shares were fairly steady throughout the 1979–2005 period. Over that period, the wage share dropped by 5.0 percentage points using CBO’s measure and 5.8 points using BEA’s measure (see Table A-1). The interest share also fell under both measures, by 1.9 points by CBO’s definition and 0.6 points by BEA’s definition. Supplements to wages and salaries rose under both measures (by 2.2 points using CBO’s measure and 1.1 points using BEA’s), as did dividends (3.2 points and 2.6 points, respectively) and transfers (by 1.8 points and 3.0 points).
3 The specific changes made to the taxonomy used in the first section of this paper are the following: Employers’ contributions for health insurance are moved from in-kind income to wage and salary supplements; employers’ payroll taxes are moved from imputed taxes to wage and salary supplements; S corporation income is moved from other business income to dividends; rent becomes a separate category, and the remainder of the other business income category is moved to proprietors’ income; and cash transfers and in-kind income (excluding employers’ contributions for health insurance) are combined into a single transfer category.
5

6
Detailed Tables, by Household Income Category, 1979 to 2005 Table 1. Effective Federal Tax Rates for All Households Table 2. Shares of Federal Tax Liabilities for All Households Table 3. Number of Households, Average Income and Income Shares, and Income Category Minimums for All Households Table 4. Sources of Income for All Households Table 5. Total Income and Total Federal Tax Liabilities for All Households
Appendix Table Table A-1. Comparing Income Shares as Calculated by the Congressional Budget Office and the Bureau of Economic Analysis

Table 1
YearLowest Quintile
Second Quintile
Middle Quintile
Fourth Quintile
Percentiles 81-90
Percentiles 91-95
Percentiles 96-99
Percentiles 99.0 - 99.5
Percentiles 99.5 - 99.9
Percentiles 99.9 - 99.99
Top 0.01 Percentile All
Total Effective Federal Tax Rate
1979 8.0 14.3 18.6 21.2 23.3 24.9 27.7 32.3 35.8 40.7 42.9 22.21980 7.7 14.1 18.7 21.5 23.8 25.4 27.7 31.5 34.1 36.7 39.1 22.21981 8.3 14.7 19.2 22.1 24.3 25.7 27.5 30.2 31.6 33.2 33.6 22.41982 8.2 13.8 17.9 20.6 22.6 23.7 24.7 26.8 27.5 28.6 28.1 20.71983 9.1 13.7 17.5 20.1 22.0 22.9 23.7 25.4 27.1 29.4 30.7 20.41984 10.2 14.6 18.0 20.4 22.3 23.2 24.1 25.8 27.5 29.2 31.8 21.01985 9.8 14.8 18.1 20.4 22.3 23.3 23.8 25.0 26.0 28.9 29.2 20.91986 9.6 14.8 18.0 20.5 22.5 23.3 23.6 24.3 25.8 25.9 25.9 20.91987 8.7 14.0 17.6 20.2 22.8 24.3 26.0 29.0 30.7 32.7 33.9 21.61988 8.5 14.3 17.9 20.6 23.0 24.0 25.6 28.3 28.9 30.2 32.2 21.81989 7.9 13.9 17.9 20.5 22.9 24.0 25.4 27.4 28.4 29.3 31.3 21.51990 8.9 14.6 17.9 20.6 22.9 24.0 25.3 27.3 28.0 29.4 31.4 21.51991 8.4 14.2 17.6 20.5 22.7 24.1 25.6 28.0 29.3 31.0 32.7 21.51992 8.2 13.7 17.4 20.2 22.6 23.9 25.6 28.4 29.8 31.6 34.0 21.51993 8.0 13.5 17.3 20.2 22.6 24.1 26.6 30.3 33.7 36.8 38.8 22.01994 6.6 13.1 17.3 20.4 22.8 24.7 27.0 31.2 34.6 38.4 40.8 22.31995 6.3 13.4 17.3 20.5 23.1 25.0 27.5 31.5 35.1 38.7 40.9 22.61996 5.6 13.2 17.3 20.3 22.9 25.0 27.7 31.9 35.3 38.2 39.3 22.71997 5.8 13.6 17.4 20.5 23.2 25.1 27.8 32.0 34.8 36.6 36.1 22.91998 5.8 13.0 16.8 20.4 23.2 25.0 27.6 31.5 33.6 34.8 33.3 22.61999 6.1 13.3 16.9 20.5 23.4 25.3 28.1 32.0 33.9 34.7 32.8 22.92000 6.4 13.0 16.6 20.5 23.4 25.2 28.1 31.8 33.6 34.2 32.0 23.02001 5.1 11.5 15.3 18.9 22.1 24.3 26.6 30.5 32.7 34.2 33.7 21.42002 4.7 10.8 14.8 18.3 21.5 23.7 26.1 30.0 32.4 34.6 34.7 20.72003 4.6 9.8 13.8 17.4 20.3 22.3 25.0 29.0 31.1 33.1 33.6 19.82004 4.3 9.9 14.1 17.3 20.3 22.4 25.3 29.4 31.1 32.4 32.3 20.12005 4.3 9.9 14.2 17.4 20.3 22.4 25.7 29.7 31.2 32.1 31.5 20.5
Effective Individual Income Tax Rate
1979 0.0 4.1 7.5 10.1 12.3 14.1 16.7 20.3 22.1 23.6 21.0 11.01980 0.2 4.5 8.0 10.7 13.1 15.1 17.7 21.4 23.0 22.7 21.5 11.71981 0.5 4.8 8.3 11.1 13.6 15.3 18.1 21.6 22.2 21.7 18.8 12.01982 0.4 4.2 7.4 10.0 12.3 13.9 16.6 19.9 21.1 21.0 18.6 11.01983 0.4 3.8 6.7 9.1 11.2 12.7 14.8 17.6 19.5 20.5 20.5 10.21984 0.7 4.0 6.7 8.9 10.9 12.5 14.7 17.4 19.3 20.2 20.9 10.21985 0.5 4.0 6.6 8.8 10.9 12.5 14.6 17.3 18.3 20.6 19.7 10.21986 0.4 4.0 6.5 8.8 11.0 12.5 14.7 17.0 18.3 18.8 18.9 10.41987 -0.6 3.2 5.8 8.1 10.8 12.8 15.7 19.7 21.7 22.6 22.0 10.31988 -1.1 3.1 5.9 8.3 10.8 12.5 15.4 19.6 20.7 21.2 21.5 10.41989 -1.6 2.9 6.0 8.3 10.9 12.6 15.5 18.8 19.9 20.6 20.5 10.21990 -1.0 3.4 6.0 8.3 10.7 12.4 15.2 18.7 20.1 20.4 20.1 10.11991 -1.6 2.9 5.8 8.1 10.5 12.2 15.0 18.8 20.8 21.7 21.2 9.91992 -2.1 2.5 5.5 7.9 10.3 12.1 14.9 19.3 21.1 22.4 22.2 9.91993 -2.3 2.3 5.4 7.8 10.2 11.9 15.1 19.9 23.5 25.5 24.2 10.01994 -3.9 1.9 5.3 7.8 10.3 12.3 15.4 20.1 23.2 25.3 23.7 10.01995 -4.4 2.0 5.3 7.8 10.4 12.4 15.9 20.7 23.9 25.8 24.4 10.21996 -5.1 1.8 5.4 7.9 10.5 12.7 16.4 21.4 24.7 26.1 24.4 10.71997 -5.2 2.1 5.6 8.0 10.8 13.0 16.7 21.7 24.6 25.5 22.6 11.01998 -5.4 1.5 5.0 7.9 10.9 13.2 17.1 22.2 24.2 24.8 21.4 11.01999 -5.2 1.7 5.0 8.0 11.0 13.6 17.7 22.7 25.0 25.4 22.0 11.42000 -4.6 1.5 5.0 8.1 11.3 13.7 18.0 23.1 25.2 25.6 22.1 11.82001 -5.6 0.3 3.9 7.1 10.3 12.9 16.9 22.3 25.0 25.7 22.7 10.32002 -6.0 -0.2 3.6 6.7 9.8 12.3 16.2 21.7 24.3 25.6 22.6 9.72003 -6.0 -1.1 2.8 5.9 8.6 10.9 14.6 19.7 21.2 21.9 18.1 8.42004 -6.2 -0.9 3.0 5.9 8.7 10.8 14.9 19.5 20.8 20.6 17.0 8.72005 -6.5 -1.0 3.0 6.0 8.7 11.0 15.2 19.4 20.7 19.9 17.0 9.0
Effective Federal Tax Rates for All Households, by Comprehensive Household Income Category, 1979 to 2005 (Percent)

Table 1
YearLowest Quintile
Second Quintile
Middle Quintile
Fourth Quintile
Percentiles 81-90
Percentiles 91-95
Percentiles 96-99
Percentiles 99.0 - 99.5
Percentiles 99.5 - 99.9
Percentiles 99.9 - 99.99
Top 0.01 Percentile All
Effective Federal Tax Rates for All Households, by Comprehensive Household Income Category, 1979 to 2005 (Percent)
Effective Social Insurance Tax Rate
1979 5.3 7.7 8.6 8.5 7.9 7.0 4.3 2.0 1.1 0.2 -0.1 6.91980 5.3 7.6 8.5 8.5 8.0 7.0 4.6 2.2 1.1 0.2 -0.1 6.91981 5.9 8.1 9.1 9.1 8.6 7.7 5.1 2.6 1.4 0.3 -0.1 7.51982 5.9 8.0 8.9 9.1 8.7 8.0 5.6 2.9 1.7 0.6 0.1 7.51983 6.1 7.9 8.9 9.1 8.8 8.1 5.7 3.0 1.6 0.6 0.1 7.51984 6.5 8.4 9.2 9.3 9.3 8.3 5.8 2.8 1.6 0.5 0.1 7.81985 6.6 8.8 9.5 9.6 9.5 8.5 5.9 2.9 1.5 0.5 0.1 7.91986 6.7 8.8 9.5 9.7 9.7 8.5 5.7 2.5 1.2 0.3 0.1 7.71987 6.4 8.6 9.4 9.8 9.8 8.6 5.9 3.0 1.7 0.6 0.1 8.01988 6.9 9.0 9.7 10.2 10.1 8.8 6.1 2.9 1.6 0.5 0.1 8.11989 7.1 8.9 9.8 10.0 9.9 8.8 5.9 3.1 1.7 0.6 0.1 8.11990 7.3 9.3 9.9 10.3 10.1 9.0 6.4 3.3 1.8 0.5 0.1 8.41991 7.2 9.2 9.6 10.3 10.1 9.4 7.1 4.2 2.4 0.9 0.2 8.61992 7.3 8.9 9.7 10.2 10.2 9.2 6.9 3.9 2.2 0.7 0.1 8.41993 7.2 8.8 9.6 10.2 10.1 9.3 7.2 4.1 2.4 0.8 0.2 8.51994 7.2 8.9 9.5 10.2 10.2 9.5 7.2 4.6 3.0 1.5 0.6 8.61995 7.6 9.1 9.6 10.3 10.0 9.3 6.8 4.0 2.7 1.4 0.6 8.51996 7.8 9.2 9.6 10.2 9.9 9.1 6.7 4.0 2.6 1.3 0.5 8.31997 8.1 9.4 9.6 10.3 9.9 9.0 6.4 3.7 2.5 1.2 0.5 8.21998 8.4 9.4 9.6 10.4 10.0 8.9 6.3 3.7 2.3 1.2 0.6 8.11999 8.4 9.5 9.6 10.4 10.0 8.9 6.3 3.6 2.3 1.2 0.7 8.02000 8.2 9.4 9.6 10.4 9.9 8.9 6.3 3.7 2.3 1.3 0.7 7.92001 8.3 9.4 9.7 10.2 10.2 9.6 7.0 4.2 2.7 1.5 0.8 8.42002 8.2 9.3 9.6 10.1 10.1 9.6 7.4 4.3 2.9 1.5 0.7 8.52003 8.1 9.1 9.4 9.9 10.1 9.5 7.3 4.3 2.7 1.4 0.6 8.32004 8.0 9.1 9.5 9.7 9.9 9.2 6.8 3.8 2.4 1.2 0.5 8.02005 8.3 9.2 9.5 9.7 9.6 8.8 6.1 3.4 2.1 1.0 0.5 7.6
Effective Corporate Income Tax Rate
1979 1.1 1.2 1.4 1.6 2.2 3.0 6.0 9.5 12.1 16.5 21.7 3.41980 0.9 1.0 1.2 1.4 1.9 2.6 4.8 7.4 9.5 13.4 17.5 2.81981 0.7 0.8 1.0 1.2 1.5 2.0 3.7 5.6 7.6 10.8 14.5 2.21982 0.5 0.5 0.7 0.7 0.9 1.1 2.0 3.5 4.3 6.7 9.1 1.41983 0.6 0.7 0.9 1.0 1.2 1.5 2.6 4.3 5.6 7.9 9.8 1.81984 0.8 0.7 1.0 1.2 1.3 1.7 2.9 5.1 6.1 8.2 10.5 2.01985 0.6 0.7 0.9 1.0 1.1 1.5 2.7 4.3 5.8 7.4 9.1 1.81986 0.6 0.7 0.9 1.0 1.1 1.5 2.6 4.2 5.8 6.4 6.7 1.91987 0.7 0.9 1.2 1.4 1.4 2.0 3.7 5.8 6.8 9.2 11.4 2.41988 0.7 0.8 1.2 1.3 1.3 2.0 3.5 5.3 6.2 8.2 10.3 2.41989 0.6 0.8 1.1 1.2 1.4 2.0 3.4 5.0 6.5 7.9 10.6 2.31990 0.6 0.7 1.0 1.2 1.3 1.9 3.1 4.9 5.8 8.2 11.0 2.21991 0.6 0.7 1.0 1.1 1.3 1.7 2.9 4.5 5.8 8.1 11.1 2.01992 0.6 0.7 1.0 1.1 1.2 1.9 3.2 4.8 6.1 8.2 11.4 2.21993 0.6 0.8 1.0 1.2 1.4 2.1 3.7 5.8 7.4 10.2 14.2 2.51994 0.6 0.7 1.1 1.2 1.5 2.1 3.7 6.1 7.9 11.3 16.3 2.61995 0.7 0.8 1.1 1.3 1.7 2.4 4.1 6.3 8.1 11.2 15.7 2.81996 0.6 0.7 1.1 1.3 1.7 2.5 4.1 6.1 7.7 10.6 14.1 2.91997 0.5 0.7 1.1 1.3 1.7 2.4 4.1 6.2 7.3 9.6 12.7 2.91998 0.5 0.6 1.0 1.1 1.5 2.2 3.6 5.2 6.8 8.6 11.1 2.61999 0.5 0.6 1.0 1.1 1.5 2.1 3.5 5.2 6.3 7.8 10.0 2.52000 0.5 0.6 0.9 1.0 1.4 2.0 3.2 4.6 5.9 7.1 9.0 2.42001 0.3 0.4 0.6 0.7 0.9 1.2 2.2 3.5 4.8 6.9 10.1 1.72002 0.2 0.3 0.5 0.6 0.8 1.0 2.0 3.6 4.9 7.3 11.2 1.62003 0.3 0.4 0.6 0.7 0.9 1.3 2.7 4.7 7.0 9.7 14.7 2.22004 0.4 0.4 0.6 0.8 1.0 1.8 3.1 5.7 7.7 10.5 14.6 2.62005 0.4 0.5 0.7 1.0 1.3 2.1 3.9 6.5 8.2 11.0 13.9 3.1

Table 1
YearLowest Quintile
Second Quintile
Middle Quintile
Fourth Quintile
Percentiles 81-90
Percentiles 91-95
Percentiles 96-99
Percentiles 99.0 - 99.5
Percentiles 99.5 - 99.9
Percentiles 99.9 - 99.99
Top 0.01 Percentile All
Effective Federal Tax Rates for All Households, by Comprehensive Household Income Category, 1979 to 2005 (Percent)
Effective Excise Tax Rate
1979 1.6 1.3 1.1 0.9 0.9 0.8 0.7 0.6 0.5 0.4 0.3 1.01980 1.4 1.1 0.9 0.8 0.7 0.7 0.6 0.5 0.4 0.3 0.3 0.81981 1.3 1.0 0.9 0.7 0.7 0.6 0.5 0.4 0.4 0.3 0.3 0.81982 1.4 1.1 0.9 0.8 0.7 0.6 0.5 0.5 0.4 0.3 0.2 0.81983 2.0 1.3 1.1 0.9 0.8 0.7 0.6 0.5 0.4 0.4 0.3 0.91984 2.3 1.4 1.1 1.0 0.8 0.8 0.6 0.5 0.4 0.3 0.3 1.01985 2.2 1.4 1.1 0.9 0.8 0.7 0.7 0.5 0.4 0.3 0.3 0.91986 2.0 1.3 1.1 0.9 0.8 0.7 0.6 0.6 0.5 0.3 0.3 0.91987 2.1 1.4 1.1 0.9 0.8 0.8 0.6 0.5 0.4 0.4 0.3 0.91988 2.0 1.4 1.1 0.9 0.8 0.7 0.6 0.5 0.4 0.3 0.3 0.91989 1.8 1.2 1.0 0.9 0.8 0.7 0.6 0.4 0.3 0.2 0.2 0.81990 2.0 1.3 1.0 0.9 0.8 0.7 0.6 0.4 0.3 0.2 0.2 0.91991 2.2 1.4 1.2 1.0 0.8 0.7 0.6 0.5 0.4 0.3 0.3 1.01992 2.3 1.5 1.2 1.0 0.9 0.8 0.6 0.4 0.3 0.2 0.2 1.01993 2.5 1.6 1.2 1.0 0.9 0.8 0.7 0.5 0.4 0.3 0.2 1.01994 2.6 1.7 1.3 1.1 0.9 0.8 0.7 0.5 0.4 0.3 0.2 1.11995 2.4 1.6 1.3 1.1 0.9 0.8 0.6 0.5 0.4 0.3 0.2 1.01996 2.3 1.5 1.2 1.0 0.8 0.7 0.6 0.4 0.3 0.2 0.2 0.91997 2.3 1.5 1.1 0.9 0.8 0.7 0.6 0.4 0.3 0.2 0.2 0.91998 2.2 1.4 1.1 0.9 0.8 0.7 0.6 0.4 0.3 0.2 0.2 0.91999 2.4 1.6 1.2 1.0 0.9 0.8 0.6 0.4 0.3 0.2 0.2 0.92000 2.3 1.4 1.1 0.9 0.8 0.7 0.5 0.4 0.3 0.2 0.1 0.92001 2.2 1.4 1.1 0.9 0.8 0.7 0.5 0.4 0.3 0.2 0.1 0.82002 2.2 1.4 1.1 0.9 0.7 0.6 0.5 0.4 0.3 0.2 0.2 0.92003 2.3 1.4 1.1 0.9 0.7 0.6 0.5 0.4 0.3 0.2 0.2 0.82004 2.2 1.3 1.1 0.9 0.7 0.6 0.5 0.4 0.3 0.2 0.2 0.82005 2.1 1.3 1.0 0.8 0.7 0.6 0.5 0.3 0.3 0.2 0.2 0.8
Individual income taxes are distributed directly to households paying those taxes. Social insurance, or payroll, taxes are distributed to households paying those taxes directly or paying them indirectly through their employers. Corporate income taxes are distributed to households according to their share of capital income. Federal excise taxes are distributed to them according to their consumption of the taxed good or service.
Comprehensive household income equals pretax cash income plus income from other sources. Pretax cash income is the sum of wages, salaries, self-employment income, rents, taxable and nontaxable interest, dividends, realized capital gains, cash transfer payments, and retirement benefits plus taxes paid by businesses (corporate income taxes and the employer's share of Social Security, Medicare, and federal unemployment insurance payroll taxes) and employee contributions to 401(k) retirement plans. Other sources of income include all in-kind benefits (Medicare, Medicaid, employer-paid health insurance premiums, food stamps, school lunches and breakfasts, housing assistance, and energy assistance). Households with negative income are excluded from the lowest income category but are included in totals.
Source: Congressional Budget Office.
Notes: Effective tax rates are calculated by dividing taxes by comprehensive household income.
Income categories are defined by ranking all people by their comprehensive household income adjusted for household size—that is, divided by the square root of the household’s size. (A household consists of the people who share a housing unit, regardless of their relationships.) Quintiles, or fifths, contain equal numbers of people.
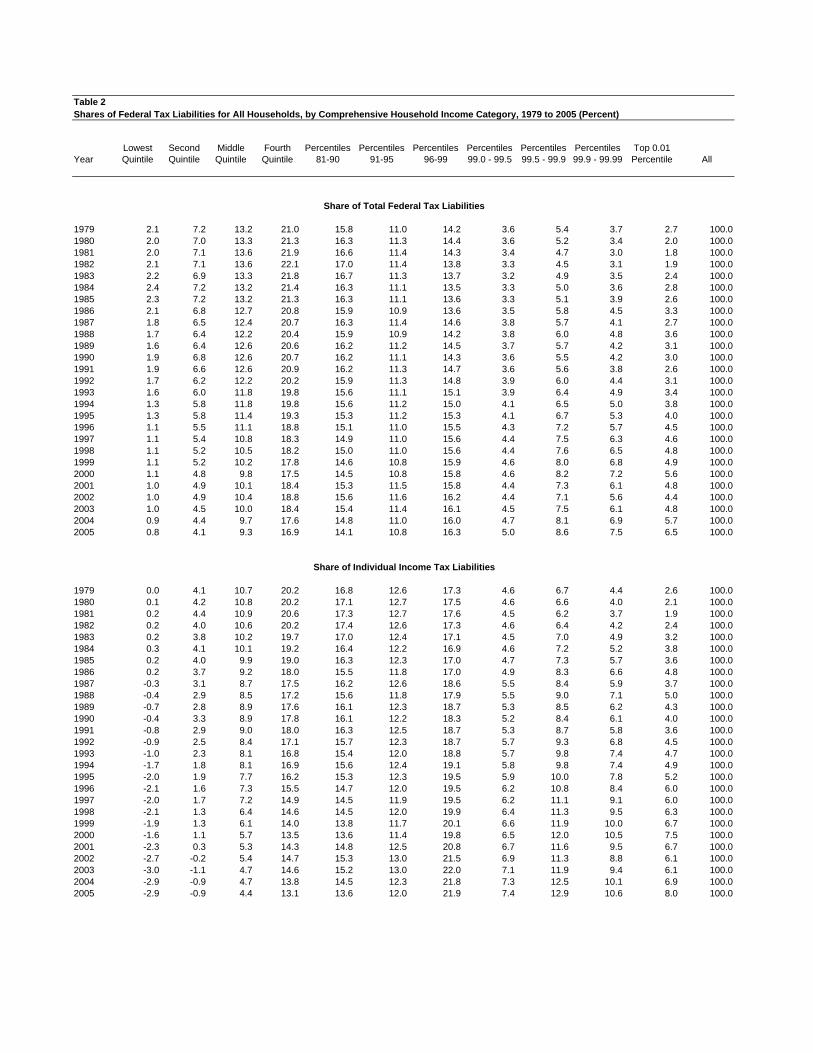
Table 2
YearLowest Quintile
Second Quintile
Middle Quintile
Fourth Quintile
Percentiles 81-90
Percentiles 91-95
Percentiles 96-99
Percentiles 99.0 - 99.5
Percentiles 99.5 - 99.9
Percentiles 99.9 - 99.99
Top 0.01 Percentile All
Share of Total Federal Tax Liabilities
1979 2.1 7.2 13.2 21.0 15.8 11.0 14.2 3.6 5.4 3.7 2.7 100.01980 2.0 7.0 13.3 21.3 16.3 11.3 14.4 3.6 5.2 3.4 2.0 100.01981 2.0 7.1 13.6 21.9 16.6 11.4 14.3 3.4 4.7 3.0 1.8 100.01982 2.1 7.1 13.6 22.1 17.0 11.4 13.8 3.3 4.5 3.1 1.9 100.01983 2.2 6.9 13.3 21.8 16.7 11.3 13.7 3.2 4.9 3.5 2.4 100.01984 2.4 7.2 13.2 21.4 16.3 11.1 13.5 3.3 5.0 3.6 2.8 100.01985 2.3 7.2 13.2 21.3 16.3 11.1 13.6 3.3 5.1 3.9 2.6 100.01986 2.1 6.8 12.7 20.8 15.9 10.9 13.6 3.5 5.8 4.5 3.3 100.01987 1.8 6.5 12.4 20.7 16.3 11.4 14.6 3.8 5.7 4.1 2.7 100.01988 1.7 6.4 12.2 20.4 15.9 10.9 14.2 3.8 6.0 4.8 3.6 100.01989 1.6 6.4 12.6 20.6 16.2 11.2 14.5 3.7 5.7 4.2 3.1 100.01990 1.9 6.8 12.6 20.7 16.2 11.1 14.3 3.6 5.5 4.2 3.0 100.01991 1.9 6.6 12.6 20.9 16.2 11.3 14.7 3.6 5.6 3.8 2.6 100.01992 1.7 6.2 12.2 20.2 15.9 11.3 14.8 3.9 6.0 4.4 3.1 100.01993 1.6 6.0 11.8 19.8 15.6 11.1 15.1 3.9 6.4 4.9 3.4 100.01994 1.3 5.8 11.8 19.8 15.6 11.2 15.0 4.1 6.5 5.0 3.8 100.01995 1.3 5.8 11.4 19.3 15.3 11.2 15.3 4.1 6.7 5.3 4.0 100.01996 1.1 5.5 11.1 18.8 15.1 11.0 15.5 4.3 7.2 5.7 4.5 100.01997 1.1 5.4 10.8 18.3 14.9 11.0 15.6 4.4 7.5 6.3 4.6 100.01998 1.1 5.2 10.5 18.2 15.0 11.0 15.6 4.4 7.6 6.5 4.8 100.01999 1.1 5.2 10.2 17.8 14.6 10.8 15.9 4.6 8.0 6.8 4.9 100.02000 1.1 4.8 9.8 17.5 14.5 10.8 15.8 4.6 8.2 7.2 5.6 100.02001 1.0 4.9 10.1 18.4 15.3 11.5 15.8 4.4 7.3 6.1 4.8 100.02002 1.0 4.9 10.4 18.8 15.6 11.6 16.2 4.4 7.1 5.6 4.4 100.02003 1.0 4.5 10.0 18.4 15.4 11.4 16.1 4.5 7.5 6.1 4.8 100.02004 0.9 4.4 9.7 17.6 14.8 11.0 16.0 4.7 8.1 6.9 5.7 100.02005 0.8 4.1 9.3 16.9 14.1 10.8 16.3 5.0 8.6 7.5 6.5 100.0
Share of Individual Income Tax Liabilities
1979 0.0 4.1 10.7 20.2 16.8 12.6 17.3 4.6 6.7 4.4 2.6 100.01980 0.1 4.2 10.8 20.2 17.1 12.7 17.5 4.6 6.6 4.0 2.1 100.01981 0.2 4.4 10.9 20.6 17.3 12.7 17.6 4.5 6.2 3.7 1.9 100.01982 0.2 4.0 10.6 20.2 17.4 12.6 17.3 4.6 6.4 4.2 2.4 100.01983 0.2 3.8 10.2 19.7 17.0 12.4 17.1 4.5 7.0 4.9 3.2 100.01984 0.3 4.1 10.1 19.2 16.4 12.2 16.9 4.6 7.2 5.2 3.8 100.01985 0.2 4.0 9.9 19.0 16.3 12.3 17.0 4.7 7.3 5.7 3.6 100.01986 0.2 3.7 9.2 18.0 15.5 11.8 17.0 4.9 8.3 6.6 4.8 100.01987 -0.3 3.1 8.7 17.5 16.2 12.6 18.6 5.5 8.4 5.9 3.7 100.01988 -0.4 2.9 8.5 17.2 15.6 11.8 17.9 5.5 9.0 7.1 5.0 100.01989 -0.7 2.8 8.9 17.6 16.1 12.3 18.7 5.3 8.5 6.2 4.3 100.01990 -0.4 3.3 8.9 17.8 16.1 12.2 18.3 5.2 8.4 6.1 4.0 100.01991 -0.8 2.9 9.0 18.0 16.3 12.5 18.7 5.3 8.7 5.8 3.6 100.01992 -0.9 2.5 8.4 17.1 15.7 12.3 18.7 5.7 9.3 6.8 4.5 100.01993 -1.0 2.3 8.1 16.8 15.4 12.0 18.8 5.7 9.8 7.4 4.7 100.01994 -1.7 1.8 8.1 16.9 15.6 12.4 19.1 5.8 9.8 7.4 4.9 100.01995 -2.0 1.9 7.7 16.2 15.3 12.3 19.5 5.9 10.0 7.8 5.2 100.01996 -2.1 1.6 7.3 15.5 14.7 12.0 19.5 6.2 10.8 8.4 6.0 100.01997 -2.0 1.7 7.2 14.9 14.5 11.9 19.5 6.2 11.1 9.1 6.0 100.01998 -2.1 1.3 6.4 14.6 14.5 12.0 19.9 6.4 11.3 9.5 6.3 100.01999 -1.9 1.3 6.1 14.0 13.8 11.7 20.1 6.6 11.9 10.0 6.7 100.02000 -1.6 1.1 5.7 13.5 13.6 11.4 19.8 6.5 12.0 10.5 7.5 100.02001 -2.3 0.3 5.3 14.3 14.8 12.5 20.8 6.7 11.6 9.5 6.7 100.02002 -2.7 -0.2 5.4 14.7 15.3 13.0 21.5 6.9 11.3 8.8 6.1 100.02003 -3.0 -1.1 4.7 14.6 15.2 13.0 22.0 7.1 11.9 9.4 6.1 100.02004 -2.9 -0.9 4.7 13.8 14.5 12.3 21.8 7.3 12.5 10.1 6.9 100.02005 -2.9 -0.9 4.4 13.1 13.6 12.0 21.9 7.4 12.9 10.6 8.0 100.0
Shares of Federal Tax Liabilities for All Households, by Comprehensive Household Income Category, 1979 to 2005 (Percent)

Table 2
YearLowest Quintile
Second Quintile
Middle Quintile
Fourth Quintile
Percentiles 81-90
Percentiles 91-95
Percentiles 96-99
Percentiles 99.0 - 99.5
Percentiles 99.5 - 99.9
Percentiles 99.9 - 99.99
Top 0.01 Percentile All
Shares of Federal Tax Liabilities for All Households, by Comprehensive Household Income Category, 1979 to 2005 (Percent)
Share of Social Insurance Tax Liabilities
1979 4.5 12.5 19.8 27.4 17.3 10.0 7.2 0.7 0.5 0.1 0.0 100.01980 4.4 12.1 19.5 27.2 17.6 10.0 7.7 0.8 0.5 0.1 0.0 100.01981 4.3 11.9 19.2 27.0 17.6 10.3 8.0 0.9 0.6 0.1 0.0 100.01982 4.1 11.3 18.7 26.7 18.0 10.7 8.5 1.0 0.8 0.2 0.0 100.01983 4.0 10.9 18.3 26.8 18.1 10.8 8.9 1.0 0.8 0.2 0.0 100.01984 4.2 11.2 18.3 26.5 18.3 10.7 8.8 1.0 0.8 0.2 0.0 100.01985 4.0 11.2 18.3 26.4 18.3 10.8 8.9 1.0 0.8 0.2 0.0 100.01986 3.9 11.0 18.1 26.7 18.6 10.9 8.8 1.0 0.7 0.1 0.0 100.01987 3.5 10.6 18.0 26.9 18.8 10.9 9.0 1.1 0.9 0.2 0.0 100.01988 3.6 10.8 17.8 27.0 18.7 10.8 9.0 1.0 0.9 0.2 0.0 100.01989 3.8 10.8 18.2 26.6 18.4 10.8 9.0 1.1 0.9 0.2 0.0 100.01990 4.0 11.1 17.8 26.5 18.3 10.7 9.3 1.1 0.9 0.2 0.0 100.01991 4.0 10.6 17.2 26.2 17.9 11.1 10.1 1.4 1.1 0.3 0.0 100.01992 3.8 10.3 17.3 26.1 18.3 11.1 10.2 1.4 1.1 0.3 0.0 100.01993 3.8 10.2 17.0 26.0 18.2 11.1 10.6 1.4 1.2 0.3 0.0 100.01994 3.7 10.1 16.9 25.8 18.0 11.2 10.4 1.6 1.5 0.5 0.1 100.01995 4.1 10.4 16.9 25.9 17.8 11.2 10.1 1.4 1.4 0.5 0.1 100.01996 4.1 10.4 16.9 25.8 17.9 11.0 10.2 1.5 1.5 0.5 0.2 100.01997 4.2 10.5 16.8 25.7 17.8 11.1 10.0 1.4 1.5 0.6 0.2 100.01998 4.4 10.4 16.6 25.8 18.0 10.9 9.9 1.4 1.5 0.6 0.2 100.01999 4.4 10.5 16.5 25.7 17.8 10.9 10.1 1.5 1.5 0.7 0.3 100.02000 4.2 10.2 16.3 25.8 17.7 11.0 10.3 1.6 1.6 0.8 0.3 100.02001 4.2 10.3 16.4 25.2 17.8 11.4 10.5 1.6 1.5 0.7 0.3 100.02002 4.1 10.2 16.2 25.0 17.8 11.5 11.1 1.5 1.5 0.6 0.2 100.02003 4.1 10.0 16.1 25.0 18.1 11.6 11.1 1.6 1.5 0.6 0.2 100.02004 4.1 10.1 16.5 24.9 18.1 11.4 10.9 1.5 1.5 0.6 0.2 100.02005 4.3 10.1 16.7 25.1 17.8 11.4 10.4 1.5 1.6 0.7 0.3 100.0
Share of Corporate Income Tax Liabilities
1979 1.8 4.1 6.7 10.5 9.8 8.8 20.2 7.0 12.0 9.9 8.9 100.01980 1.8 3.9 7.0 11.3 10.5 9.4 20.0 6.8 11.6 10.0 7.2 100.01981 1.6 3.8 7.1 11.9 10.3 9.2 19.6 6.3 11.4 10.0 8.1 100.01982 1.7 4.0 7.5 12.1 10.5 8.4 17.2 6.5 10.7 11.0 9.6 100.01983 1.6 3.8 7.5 12.2 10.4 8.5 17.6 6.3 11.6 10.9 8.7 100.01984 1.9 3.8 7.5 12.7 9.7 8.4 16.6 6.8 11.6 10.5 9.6 100.01985 1.4 3.7 7.5 12.3 9.3 8.0 17.2 6.4 12.9 11.2 9.3 100.01986 1.4 3.3 7.2 11.7 8.3 7.9 16.6 6.6 14.5 12.4 9.3 100.01987 1.3 3.8 7.7 12.8 9.2 8.6 18.7 6.9 11.3 10.3 8.2 100.01988 1.2 3.4 7.5 11.6 8.4 8.1 17.7 6.5 11.8 11.9 10.4 100.01989 1.2 3.6 7.0 11.7 9.3 8.6 18.3 6.3 12.2 10.6 9.9 100.01990 1.2 3.2 6.9 11.6 9.3 8.9 17.7 6.4 11.5 11.6 10.3 100.01991 1.4 3.4 7.5 11.6 9.7 8.5 17.9 6.3 11.9 10.7 9.4 100.01992 1.3 3.2 6.9 10.8 8.6 8.8 18.3 6.5 12.3 11.4 10.5 100.01993 1.1 3.0 6.3 10.3 8.7 8.7 18.3 6.6 12.5 11.9 11.1 100.01994 1.0 2.7 6.2 10.1 8.4 8.0 17.6 6.6 12.6 12.5 12.7 100.01995 1.1 2.6 5.9 10.0 8.9 8.6 18.3 6.5 12.3 12.3 12.1 100.01996 0.9 2.4 5.8 9.7 8.9 8.7 17.9 6.6 12.5 12.6 12.8 100.01997 0.8 2.2 5.3 9.2 8.9 8.5 18.4 6.8 12.7 13.2 13.0 100.01998 0.8 2.2 5.4 8.7 8.3 8.3 17.6 6.4 13.4 14.0 14.0 100.01999 0.8 2.2 5.5 8.5 8.3 8.1 18.0 6.7 13.6 13.8 13.6 100.02000 0.9 2.1 5.3 8.0 8.3 8.1 17.4 6.3 13.6 14.1 15.0 100.02001 0.7 2.0 4.8 8.5 7.8 7.0 15.9 6.3 13.0 14.9 17.6 100.02002 0.6 1.8 4.3 8.0 7.4 6.5 16.1 6.8 13.7 15.0 18.0 100.02003 0.6 1.5 3.7 6.9 6.4 6.2 15.7 6.7 15.2 16.3 19.3 100.02004 0.6 1.5 3.0 6.5 5.9 6.6 15.3 7.1 15.4 17.2 19.8 100.02005 0.6 1.4 3.0 6.2 6.2 6.7 16.3 7.3 14.9 17.2 19.2 100.0
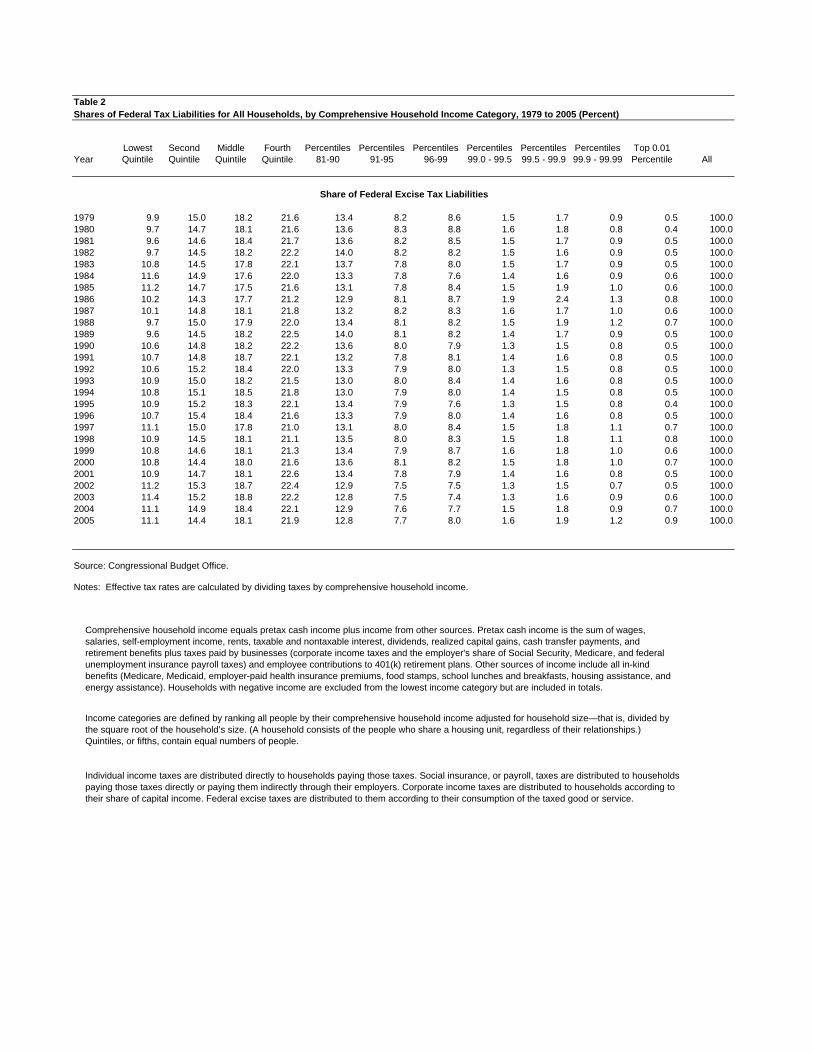
Table 2
YearLowest Quintile
Second Quintile
Middle Quintile
Fourth Quintile
Percentiles 81-90
Percentiles 91-95
Percentiles 96-99
Percentiles 99.0 - 99.5
Percentiles 99.5 - 99.9
Percentiles 99.9 - 99.99
Top 0.01 Percentile All
Shares of Federal Tax Liabilities for All Households, by Comprehensive Household Income Category, 1979 to 2005 (Percent)
Share of Federal Excise Tax Liabilities
1979 9.9 15.0 18.2 21.6 13.4 8.2 8.6 1.5 1.7 0.9 0.5 100.01980 9.7 14.7 18.1 21.6 13.6 8.3 8.8 1.6 1.8 0.8 0.4 100.01981 9.6 14.6 18.4 21.7 13.6 8.2 8.5 1.5 1.7 0.9 0.5 100.01982 9.7 14.5 18.2 22.2 14.0 8.2 8.2 1.5 1.6 0.9 0.5 100.01983 10.8 14.5 17.8 22.1 13.7 7.8 8.0 1.5 1.7 0.9 0.5 100.01984 11.6 14.9 17.6 22.0 13.3 7.8 7.6 1.4 1.6 0.9 0.6 100.01985 11.2 14.7 17.5 21.6 13.1 7.8 8.4 1.5 1.9 1.0 0.6 100.01986 10.2 14.3 17.7 21.2 12.9 8.1 8.7 1.9 2.4 1.3 0.8 100.01987 10.1 14.8 18.1 21.8 13.2 8.2 8.3 1.6 1.7 1.0 0.6 100.01988 9.7 15.0 17.9 22.0 13.4 8.1 8.2 1.5 1.9 1.2 0.7 100.01989 9.6 14.5 18.2 22.5 14.0 8.1 8.2 1.4 1.7 0.9 0.5 100.01990 10.6 14.8 18.2 22.2 13.6 8.0 7.9 1.3 1.5 0.8 0.5 100.01991 10.7 14.8 18.7 22.1 13.2 7.8 8.1 1.4 1.6 0.8 0.5 100.01992 10.6 15.2 18.4 22.0 13.3 7.9 8.0 1.3 1.5 0.8 0.5 100.01993 10.9 15.0 18.2 21.5 13.0 8.0 8.4 1.4 1.6 0.8 0.5 100.01994 10.8 15.1 18.5 21.8 13.0 7.9 8.0 1.4 1.5 0.8 0.5 100.01995 10.9 15.2 18.3 22.1 13.4 7.9 7.6 1.3 1.5 0.8 0.4 100.01996 10.7 15.4 18.4 21.6 13.3 7.9 8.0 1.4 1.6 0.8 0.5 100.01997 11.1 15.0 17.8 21.0 13.1 8.0 8.4 1.5 1.8 1.1 0.7 100.01998 10.9 14.5 18.1 21.1 13.5 8.0 8.3 1.5 1.8 1.1 0.8 100.01999 10.8 14.6 18.1 21.3 13.4 7.9 8.7 1.6 1.8 1.0 0.6 100.02000 10.8 14.4 18.0 21.6 13.6 8.1 8.2 1.5 1.8 1.0 0.7 100.02001 10.9 14.7 18.1 22.6 13.4 7.8 7.9 1.4 1.6 0.8 0.5 100.02002 11.2 15.3 18.7 22.4 12.9 7.5 7.5 1.3 1.5 0.7 0.5 100.02003 11.4 15.2 18.8 22.2 12.8 7.5 7.4 1.3 1.6 0.9 0.6 100.02004 11.1 14.9 18.4 22.1 12.9 7.6 7.7 1.5 1.8 0.9 0.7 100.02005 11.1 14.4 18.1 21.9 12.8 7.7 8.0 1.6 1.9 1.2 0.9 100.0
Individual income taxes are distributed directly to households paying those taxes. Social insurance, or payroll, taxes are distributed to households paying those taxes directly or paying them indirectly through their employers. Corporate income taxes are distributed to households according to their share of capital income. Federal excise taxes are distributed to them according to their consumption of the taxed good or service.
Comprehensive household income equals pretax cash income plus income from other sources. Pretax cash income is the sum of wages, salaries, self-employment income, rents, taxable and nontaxable interest, dividends, realized capital gains, cash transfer payments, and retirement benefits plus taxes paid by businesses (corporate income taxes and the employer's share of Social Security, Medicare, and federal unemployment insurance payroll taxes) and employee contributions to 401(k) retirement plans. Other sources of income include all in-kind benefits (Medicare, Medicaid, employer-paid health insurance premiums, food stamps, school lunches and breakfasts, housing assistance, and energy assistance). Households with negative income are excluded from the lowest income category but are included in totals.
Source: Congressional Budget Office.
Notes: Effective tax rates are calculated by dividing taxes by comprehensive household income.
Income categories are defined by ranking all people by their comprehensive household income adjusted for household size—that is, divided by the square root of the household’s size. (A household consists of the people who share a housing unit, regardless of their relationships.) Quintiles, or fifths, contain equal numbers of people.

Table 3
YearLowest Quintile
Second Quintile
Middle Quintile
Fourth Quintile
Percentiles 81-90
Percentiles 91-95
Percentiles 96-99
Percentiles 99.0 - 99.5
Percentiles 99.5 - 99.9
Percentiles 99.9 - 99.99
Top 0.01 Percentile All
Number of Households (Thousands)
1979 17,874 15,839 14,986 15,430 8,102 4,299 3,408 422 349 82 9 81,0691980 18,090 16,083 15,247 15,746 8,343 4,342 3,532 437 364 82 8 82,6311981 17,878 16,279 15,732 15,943 8,483 4,444 3,660 445 365 84 9 83,7931982 17,570 16,302 15,968 16,184 8,728 4,522 3,640 464 357 83 8 84,2671983 17,454 16,828 16,375 16,648 8,850 4,535 3,724 458 372 83 9 85,8091984 18,510 16,847 16,560 16,829 8,856 4,522 3,655 470 377 85 9 87,1831985 18,452 17,266 16,838 17,276 9,110 4,652 3,800 469 391 90 9 88,8111986 18,779 17,313 17,274 17,535 9,045 4,721 3,800 483 402 80 9 89,8641987 18,200 18,352 17,770 17,969 9,256 4,706 3,803 483 375 86 10 91,3931988 18,464 18,700 18,056 18,438 9,376 4,811 3,889 468 386 91 9 93,0981989 18,380 18,779 18,333 18,481 9,507 4,844 3,932 474 397 91 10 93,6261990 18,824 18,574 18,442 18,730 9,670 4,962 4,039 485 397 95 10 94,6181991 19,278 18,613 18,910 18,856 9,772 5,007 4,117 488 413 91 10 95,9791992 18,995 18,910 18,934 19,012 9,857 5,102 4,108 492 405 88 9 96,2821993 19,144 19,186 19,079 19,194 9,909 5,120 4,196 507 411 93 9 97,2621994 19,436 19,633 19,687 19,481 10,079 5,156 4,193 509 418 95 10 99,0871995 20,118 19,330 19,652 19,728 10,085 5,295 4,188 498 412 94 11 99,6841996 20,151 19,756 19,820 19,992 10,359 5,302 4,312 534 425 92 10 101,0831997 20,595 19,810 20,187 20,175 10,567 5,440 4,338 525 427 95 10 102,5841998 21,105 19,837 20,678 20,397 10,713 5,512 4,338 527 424 94 10 103,9921999 21,158 20,024 20,921 20,578 10,698 5,516 4,455 537 439 93 10 104,7812000 22,089 20,754 21,603 21,085 11,005 5,696 4,572 552 446 96 10 108,2892001 22,490 20,921 21,277 21,731 11,124 5,707 4,580 553 441 98 11 109,3882002 22,960 21,403 21,702 22,029 11,200 5,732 4,689 563 438 98 11 111,3812003 23,112 21,610 22,002 22,107 11,233 5,753 4,627 562 455 100 10 112,1172004 23,613 21,931 21,992 22,265 11,330 5,797 4,686 575 464 101 10 113,2782005 24,116 21,990 22,153 22,571 11,420 5,924 4,672 564 451 99 11 114,510
Average Income (2005 dollars)Pretax Income
1979 15,700 34,000 51,000 69,000 89,700 110,500 162,400 286,500 461,700 1,190,500 7,333,000 59,700 1980 15,100 32,600 49,300 66,900 87,200 108,600 156,100 275,900 441,400 1,210,900 6,433,900 57,700 1981 14,700 32,300 48,600 67,200 87,000 108,000 153,400 269,700 439,200 1,165,800 6,151,400 57,600 1982 14,300 31,500 47,600 66,400 86,300 107,100 153,300 264,400 455,100 1,285,700 7,907,200 57,300 1983 13,800 30,300 46,800 66,000 86,900 109,700 157,200 282,600 490,600 1,446,500 8,162,000 57,700 1984 14,200 32,100 48,800 68,700 91,000 116,100 168,200 299,800 530,800 1,599,500 9,712,100 60,300 1985 14,300 32,200 49,600 69,400 91,900 117,700 171,700 319,600 569,700 1,686,800 10,394,300 61,700 1986 14,300 33,000 50,800 72,000 97,100 124,000 188,500 369,500 694,600 2,669,300 16,956,700 66,300 1987 14,100 31,800 50,400 72,100 97,700 125,900 186,500 346,500 620,900 1,806,800 9,965,000 64,000 1988 14,300 32,400 51,200 72,900 99,800 127,900 193,300 385,400 730,500 2,367,200 15,278,100 66,900 1989 14,900 33,000 51,800 73,800 100,800 130,500 197,300 381,700 690,700 2,114,500 12,828,000 67,400 1990 15,300 33,800 51,600 72,900 99,000 127,300 190,700 365,700 674,500 2,009,900 12,241,400 66,700 1991 15,300 33,300 50,800 72,100 97,500 125,800 186,600 355,600 621,600 1,798,500 10,205,500 64,900 1992 15,000 33,100 51,100 72,800 98,700 127,700 194,400 383,300 689,000 2,173,700 13,691,400 66,700 1993 15,300 33,300 51,400 73,400 100,100 129,100 193,800 367,100 665,200 2,036,000 12,946,900 67,000 1994 15,200 33,600 51,800 74,600 101,300 131,500 198,900 382,100 674,600 2,059,200 12,655,000 67,800 1995 16,000 35,200 53,200 75,800 104,400 134,400 209,800 412,800 731,700 2,309,800 13,731,000 70,400 1996 15,700 35,000 53,900 77,100 105,900 139,300 216,100 425,400 806,300 2,726,000 17,963,400 72,700 1997 16,100 35,800 54,700 78,500 108,200 143,500 229,600 463,800 897,800 3,182,500 22,145,700 75,600 1998 16,900 37,400 56,100 81,600 112,200 149,000 241,900 498,100 992,800 3,673,200 25,749,300 79,300 1999 17,400 38,400 57,300 83,700 116,000 154,400 251,900 531,300 1,070,900 4,139,500 29,944,400 82,700 2000 16,600 37,700 57,000 84,500 117,600 157,200 257,300 547,800 1,139,800 4,522,300 34,440,100 84,000 2001 16,400 38,000 57,700 83,200 115,400 152,900 240,400 484,800 940,900 3,356,400 22,859,200 79,300 2002 15,900 36,800 56,400 81,400 113,400 149,700 231,200 458,000 868,600 2,860,400 18,850,700 75,900 2003 15,700 36,500 56,100 82,000 115,000 151,900 237,500 470,700 898,100 3,130,100 23,202,200 77,000 2004 15,800 37,200 58,000 84,500 118,700 157,200 250,400 517,300 1,036,600 3,872,200 29,743,900 81,300 2005 15,900 37,400 58,500 85,200 120,600 161,800 269,800 588,100 1,207,200 4,699,500 35,473,200 84,800
Number of Households, Average Income and Income Shares, and Income Category Minimums for All Households, by Household Income Category, 1979 to 2005

Table 3
YearLowest Quintile
Second Quintile
Middle Quintile
Fourth Quintile
Percentiles 81-90
Percentiles 91-95
Percentiles 96-99
Percentiles 99.0 - 99.5
Percentiles 99.5 - 99.9
Percentiles 99.9 - 99.99
Top 0.01 Percentile All
Number of Households, Average Income and Income Shares, and Income Category Minimums for All Households, by Household Income Category, 1979 to 2005
After-Tax Income
1979 14,400 29,100 41,500 54,300 68,800 82,900 117,400 193,900 296,500 706,400 4,188,300 46,400 1980 13,900 28,000 40,100 52,500 66,500 81,000 112,800 189,000 291,000 766,700 3,920,900 44,900 1981 13,500 27,500 39,300 52,300 65,900 80,200 111,200 188,300 300,600 778,600 4,087,000 44,700 1982 13,100 27,100 39,100 52,700 66,800 81,700 115,500 193,600 329,800 918,100 5,688,500 45,400 1983 12,500 26,200 38,600 52,700 67,800 84,500 119,900 210,900 357,700 1,021,800 5,655,400 45,900 1984 12,800 27,400 40,000 54,700 70,800 89,100 127,700 222,300 384,800 1,131,800 6,624,900 47,600 1985 12,900 27,400 40,600 55,200 71,400 90,300 130,800 239,600 421,400 1,200,100 7,360,300 48,900 1986 13,000 28,100 41,700 57,200 75,200 95,200 144,000 279,800 515,500 1,978,300 12,569,200 52,400 1987 12,900 27,300 41,600 57,600 75,500 95,400 138,000 246,200 430,400 1,216,600 6,590,300 50,200 1988 13,100 27,800 42,000 57,900 76,800 97,200 143,800 276,300 519,700 1,651,900 10,363,600 52,300 1989 13,700 28,400 42,500 58,700 77,700 99,200 147,100 277,300 494,800 1,494,900 8,813,800 52,900 1990 13,900 28,900 42,400 57,800 76,300 96,800 142,500 266,000 485,400 1,418,600 8,395,600 52,300 1991 14,000 28,600 41,900 57,300 75,400 95,600 138,900 256,100 439,700 1,241,300 6,870,200 51,000 1992 13,700 28,600 42,200 58,100 76,400 97,200 144,600 274,300 483,800 1,486,600 9,040,400 52,400 1993 14,000 28,800 42,500 58,500 77,500 98,000 142,200 256,000 441,300 1,286,800 7,917,200 52,200 1994 14,200 29,200 42,800 59,400 78,200 99,100 145,100 262,700 441,200 1,268,400 7,493,400 52,700 1995 15,000 30,500 44,000 60,300 80,400 100,800 152,100 282,900 475,200 1,416,300 8,120,300 54,500 1996 14,800 30,400 44,500 61,400 81,600 104,500 156,300 289,700 521,900 1,684,000 10,910,600 56,200 1997 15,200 30,900 45,200 62,400 83,200 107,500 165,800 315,200 585,700 2,019,100 14,149,800 58,300 1998 15,900 32,600 46,700 65,000 86,300 111,800 175,100 341,400 659,100 2,395,500 17,163,800 61,400 1999 16,300 33,300 47,600 66,500 88,900 115,300 181,100 361,400 707,500 2,703,000 20,128,900 63,700 2000 15,500 32,800 47,500 67,100 90,100 117,500 185,000 373,800 756,500 2,977,700 23,434,400 64,600 2001 15,600 33,600 48,900 67,500 89,800 115,700 176,400 337,000 633,000 2,207,300 15,154,200 62,300 2002 15,200 32,800 48,000 66,500 89,100 114,300 170,900 320,500 587,300 1,870,700 12,305,800 60,200 2003 15,000 32,900 48,300 67,800 91,700 117,900 178,100 334,000 618,500 2,094,400 15,396,400 61,800 2004 15,100 33,500 49,800 69,900 94,600 122,000 187,100 365,100 714,000 2,616,700 20,136,800 64,900 2005 15,300 33,700 50,200 70,300 96,100 125,500 200,500 413,300 830,100 3,191,600 24,286,300 67,400
Share of Income (Percent)Pretax Income
1979 5.8 11.1 15.8 22.0 15.0 9.8 11.4 2.5 3.3 2.0 1.4 100.01980 5.7 11.0 15.7 22.1 15.2 9.9 11.6 2.5 3.4 2.1 1.1 100.01981 5.5 10.9 15.9 22.2 15.3 10.0 11.6 2.5 3.3 2.0 1.2 100.01982 5.2 10.6 15.7 22.2 15.6 10.0 11.6 2.5 3.4 2.2 1.4 100.01983 4.9 10.3 15.5 22.2 15.5 10.0 11.8 2.6 3.7 2.4 1.6 100.01984 5.0 10.3 15.4 22.0 15.3 10.0 11.7 2.7 3.8 2.6 1.8 100.01985 4.8 10.1 15.2 21.9 15.3 10.0 11.9 2.7 4.1 2.8 1.9 100.01986 4.5 9.6 14.7 21.2 14.7 9.8 12.0 3.0 4.7 3.6 2.6 100.01987 4.4 10.0 15.3 22.1 15.5 10.1 12.1 2.9 4.0 2.7 1.7 100.01988 4.3 9.7 14.9 21.6 15.0 9.9 12.1 2.9 4.5 3.5 2.4 100.01989 4.3 9.8 15.1 21.6 15.2 10.0 12.3 2.9 4.4 3.1 2.2 100.01990 4.6 10.0 15.1 21.6 15.2 10.0 12.2 2.8 4.2 3.0 2.0 100.01991 4.7 10.0 15.4 21.8 15.3 10.1 12.3 2.8 4.1 2.6 1.7 100.01992 4.4 9.7 15.1 21.5 15.2 10.1 12.4 2.9 4.4 3.0 2.0 100.01993 4.5 9.8 15.0 21.6 15.2 10.2 12.5 2.9 4.2 2.9 2.0 100.01994 4.4 9.8 15.2 21.6 15.2 10.1 12.4 2.9 4.2 2.9 2.1 100.01995 4.6 9.7 14.9 21.3 15.0 10.1 12.5 2.9 4.3 3.1 2.2 100.01996 4.3 9.4 14.5 21.0 14.9 10.1 12.7 3.1 4.7 3.4 2.6 100.01997 4.3 9.1 14.2 20.4 14.7 10.1 12.8 3.1 4.9 3.9 2.9 100.01998 4.3 9.0 14.1 20.2 14.6 10.0 12.7 3.2 5.1 4.2 3.2 100.01999 4.2 8.9 13.8 19.9 14.3 9.8 13.0 3.3 5.4 4.5 3.5 100.02000 4.0 8.6 13.5 19.6 14.2 9.9 12.9 3.3 5.6 4.8 4.0 100.02001 4.3 9.2 14.2 20.8 14.8 10.1 12.7 3.1 4.8 3.8 3.0 100.02002 4.3 9.3 14.5 21.2 15.0 10.2 12.8 3.1 4.5 3.3 2.6 100.02003 4.2 9.1 14.3 21.0 15.0 10.1 12.7 3.1 4.7 3.6 2.8 100.02004 4.1 8.9 13.9 20.4 14.6 9.9 12.7 3.2 5.2 4.3 3.5 100.02005 4.0 8.5 13.3 19.8 14.2 9.9 13.0 3.4 5.6 4.8 4.2 100.0

Table 3
YearLowest Quintile
Second Quintile
Middle Quintile
Fourth Quintile
Percentiles 81-90
Percentiles 91-95
Percentiles 96-99
Percentiles 99.0 - 99.5
Percentiles 99.5 - 99.9
Percentiles 99.9 - 99.99
Top 0.01 Percentile All
Number of Households, Average Income and Income Shares, and Income Category Minimums for All Households, by Household Income Category, 1979 to 2005
After-Tax Income
1979 6.8 12.3 16.5 22.3 14.8 9.5 10.6 2.2 2.8 1.6 1.0 100.01980 6.8 12.1 16.5 22.3 14.9 9.5 10.7 2.2 2.9 1.7 0.9 100.01981 6.5 12.0 16.5 22.3 14.9 9.5 10.9 2.2 2.9 1.8 1.1 100.01982 6.0 11.5 16.3 22.3 15.2 9.7 11.0 2.3 3.1 2.0 1.3 100.01983 5.5 11.2 16.1 22.3 15.2 9.7 11.3 2.5 3.4 2.2 1.4 100.01984 5.7 11.1 16.0 22.2 15.1 9.7 11.2 2.5 3.5 2.3 1.6 100.01985 5.5 10.9 15.8 22.0 15.0 9.7 11.5 2.6 3.8 2.5 1.7 100.01986 5.2 10.3 15.3 21.3 14.4 9.5 11.6 2.9 4.4 3.4 2.5 100.01987 5.1 10.9 16.1 22.5 15.2 9.8 11.4 2.6 3.5 2.3 1.4 100.01988 5.0 10.7 15.6 21.9 14.8 9.6 11.5 2.7 4.1 3.1 2.1 100.01989 5.1 10.8 15.7 21.9 14.9 9.7 11.7 2.7 4.0 2.8 1.9 100.01990 5.3 10.8 15.8 21.9 14.9 9.7 11.6 2.6 3.9 2.7 1.8 100.01991 5.5 10.9 16.2 22.1 15.0 9.8 11.7 2.6 3.7 2.3 1.5 100.01992 5.2 10.7 15.9 21.9 14.9 9.8 11.8 2.7 3.9 2.6 1.7 100.01993 5.3 10.9 16.0 22.1 15.1 9.9 11.8 2.6 3.6 2.4 1.5 100.01994 5.3 11.0 16.1 22.2 15.1 9.8 11.7 2.6 3.5 2.3 1.6 100.01995 5.5 10.9 15.9 21.9 14.9 9.8 11.7 2.6 3.6 2.5 1.7 100.01996 5.3 10.6 15.6 21.6 14.9 9.8 11.9 2.7 3.9 2.7 2.1 100.01997 5.2 10.2 15.3 21.1 14.7 9.8 12.0 2.8 4.2 3.2 2.4 100.01998 5.3 10.1 15.1 20.8 14.5 9.7 11.9 2.8 4.4 3.5 2.8 100.01999 5.2 10.0 14.9 20.5 14.2 9.5 12.1 2.9 4.7 3.8 3.0 100.02000 4.9 9.7 14.7 20.2 14.2 9.6 12.1 3.0 4.8 4.1 3.6 100.02001 5.1 10.3 15.2 21.5 14.7 9.7 11.8 2.7 4.1 3.2 2.6 100.02002 5.2 10.5 15.5 21.8 14.9 9.8 12.0 2.7 3.8 2.7 2.1 100.02003 5.0 10.3 15.4 21.6 14.9 9.8 11.9 2.7 4.1 3.0 2.3 100.02004 4.9 10.0 14.9 21.2 14.6 9.6 11.9 2.9 4.5 3.6 3.0 100.02005 4.8 9.6 14.4 20.6 14.2 9.6 12.1 3.0 4.9 4.1 3.7 100.0
Minimum Adjusted Income (2005 dollars)
1979 0 16,400 26,000 35,600 49,700 63,600 80,600 157,700 218,900 486,300 1,844,700 NA1980 0 15,700 25,100 34,600 48,500 62,700 78,800 152,900 211,300 483,000 1,834,800 NA1981 0 15,500 24,900 34,800 48,900 62,800 79,500 150,600 210,000 478,900 1,805,700 NA1982 0 15,100 24,300 34,300 48,900 63,100 79,000 151,200 209,100 504,600 2,088,200 NA1983 0 14,400 24,100 34,300 49,200 63,800 80,800 157,700 222,800 565,900 2,318,500 NA1984 0 15,300 25,100 35,900 51,300 67,200 85,200 168,400 241,600 642,700 2,655,500 NA1985 0 15,400 25,500 36,400 52,000 68,300 87,300 175,000 255,100 673,400 2,869,500 NA1986 0 15,500 26,200 37,600 54,200 71,500 92,700 203,300 302,800 882,500 4,270,100 NA1987 0 15,000 26,100 37,900 55,000 72,500 92,600 190,800 280,300 690,700 2,861,900 NA1988 0 15,400 26,700 38,600 56,000 74,200 95,300 205,200 313,800 891,000 4,043,000 NA1989 0 15,700 27,100 39,000 56,800 75,300 97,600 208,000 305,100 825,300 3,576,300 NA1990 0 16,100 27,100 38,800 56,000 74,000 96,000 198,400 295,600 782,500 3,384,400 NA1991 0 16,100 26,600 38,400 55,200 72,900 94,400 194,600 281,700 727,500 2,858,400 NA1992 0 15,700 26,700 38,700 55,900 74,200 97,300 205,800 304,000 810,200 3,495,100 NA1993 0 15,900 26,800 38,700 56,300 74,700 97,000 202,500 293,200 784,400 3,363,600 NA1994 0 16,100 27,200 39,600 57,200 75,800 99,100 208,600 304,600 777,800 3,419,500 NA1995 0 16,900 28,100 40,300 58,700 78,500 103,200 221,900 326,000 865,500 3,892,200 NA1996 0 16,600 28,400 40,900 59,900 80,600 106,200 234,300 347,000 993,200 4,755,300 NA1997 0 17,000 28,800 41,500 61,300 83,000 111,400 248,600 380,000 1,130,300 5,685,200 NA1998 0 17,800 29,900 43,000 63,600 86,600 116,200 265,300 413,000 1,251,900 6,480,400 NA1999 0 18,300 30,500 43,900 65,500 89,100 119,800 283,100 441,900 1,397,300 7,340,400 NA2000 0 17,900 30,300 44,100 66,200 90,700 122,800 290,900 457,800 1,503,300 8,393,000 NA2001 0 18,100 30,500 44,300 65,600 88,500 118,300 262,400 398,900 1,156,100 5,719,300 NA2002 0 17,700 29,700 43,400 64,100 86,600 115,000 249,600 372,700 1,015,400 4,779,400 NA2003 0 17,400 29,500 43,300 65,000 87,300 116,500 253,600 381,900 1,097,500 5,494,000 NA2004 0 17,700 30,200 44,600 66,500 90,300 120,800 276,200 429,500 1,332,400 7,020,400 NA2005 0 17,900 30,500 45,200 67,400 92,400 126,300 307,500 482,400 1,532,400 8,579,000 NA

Table 3
YearLowest Quintile
Second Quintile
Middle Quintile
Fourth Quintile
Percentiles 81-90
Percentiles 91-95
Percentiles 96-99
Percentiles 99.0 - 99.5
Percentiles 99.5 - 99.9
Percentiles 99.9 - 99.99
Top 0.01 Percentile All
Number of Households, Average Income and Income Shares, and Income Category Minimums for All Households, by Household Income Category, 1979 to 2005
The minimum adjusted income is the lower income boundary for each quintile. Because incomes are adjusted by dividing income by the square root of household size, an adjusted income range implies different unadjusted income for households of different sizes. To compute the unadjusted income range for a household of a particular size, the adjusted income must be multiplied by the square root of the household size: 1.414 for a two-person household, 1.732 for a three-person household; 2.0 for a four-person household, 2.236 for a five-person household. For example, in 2005, the highest quintile had adjusted income above $67,400. A two-person household would need income above $95,300 to fall in that quintile, while a four-person household would need income in excess of $134,800.
Source: Congressional Budget Office.
Notes: Effective tax rates are calculated by dividing taxes by comprehensive household income.
Income categories are defined by ranking all people by their comprehensive household income adjusted for household size—that is, divided by the square root of the household’s size. (A household consists of the people who share a housing unit, regardless of their relationships.) Quintiles, or fifths, contain equal numbers of people.
Comprehensive household income equals pretax cash income plus income from other sources. Pretax cash income is the sum of wages, salaries, self-employment income, rents, taxable and nontaxable interest, dividends, realized capital gains, cash transfer payments, and retirement benefits plus taxes paid by businesses (corporate income taxes and the employer's share of Social Security, Medicare, and federal unemployment insurance payroll taxes) and employee contributions to 401(k) retirement plans. Other sources of income include all in-kind benefits (Medicare, Medicaid, employer-paid health insurance premiums, food stamps, school lunches and breakfasts, housing assistance, and energy assistance). Households with negative income are excluded from the lowest income category but are included in totals.
Individual income taxes are distributed directly to households paying those taxes. Social insurance, or payroll, taxes are distributed to households paying those taxes directly or paying them indirectly through their employers. Corporate income taxes are distributed to households according to their share of capital income. Federal excise taxes are distributed to them according to their consumption of the taxed good or service.

Table 4
Year WagesProprietors'
Income
Other Business Income
Interest and
DividendsCapital Gains Pensions
Cash Transfers
In-Kind Income
Imputed Taxes
Other Income Total
1979 40.4 1.6 1.0 2.5 0.3 2.0 34.3 13.1 3.7 1.2 1001980 40.4 1.2 0.7 2.8 0.3 1.6 35.1 13.3 3.5 1.2 1001981 41.0 0.9 0.6 3.0 0.4 1.6 34.6 13.3 3.5 1.1 1001982 40.9 0.8 0.8 3.6 0.4 1.7 34.3 13.9 3.3 0.3 1001983 42.0 1.0 0.5 3.5 0.5 1.5 33.4 13.8 3.5 0.3 1001984 42.8 0.7 0.8 4.0 0.6 2.6 31.4 13.4 3.9 -0.2 1001985 42.0 1.3 0.8 3.2 0.4 1.9 32.5 13.8 3.7 0.4 1001986 41.9 1.7 0.9 3.0 0.5 2.1 31.5 14.2 3.8 0.3 1001987 39.6 2.9 0.4 2.8 0.3 2.1 32.1 15.7 3.7 0.4 1001988 40.4 3.1 0.2 2.7 0.3 2.2 31.8 14.8 3.9 0.6 1001989 41.9 3.1 0.2 2.6 0.3 2.3 30.0 14.9 4.0 0.8 1001990 42.4 3.2 0.2 2.6 0.0 2.3 29.6 15.2 4.0 0.4 1001991 42.3 3.0 0.0 2.8 0.2 2.4 30.3 14.9 4.0 0.2 1001992 42.5 3.3 0.1 2.1 0.3 2.3 30.6 15.0 4.0 -0.3 1001993 41.8 3.4 0.2 1.7 0.2 2.4 30.2 15.6 4.0 0.3 1001994 41.7 3.5 0.4 1.6 0.1 2.4 29.9 16.3 4.0 0.1 1001995 43.3 3.7 0.4 1.7 0.2 2.3 28.3 15.7 4.2 0.1 1001996 44.9 3.9 0.3 1.5 0.3 2.1 27.2 15.3 4.2 0.3 1001997 46.7 4.2 0.4 1.4 0.4 2.3 26.0 14.3 4.3 0.1 1001998 48.6 4.4 0.2 1.3 0.4 2.4 24.0 13.9 4.4 0.3 1001999 48.6 4.5 1.2 1.3 0.4 2.3 23.4 13.4 4.4 0.4 1002000 47.6 4.4 0.8 1.5 0.5 2.6 24.2 13.7 4.3 0.4 1002001 47.8 4.6 0.5 1.4 0.0 2.0 24.7 15.3 4.1 -0.3 1002002 47.0 4.6 0.4 1.2 -0.2 2.1 26.2 15.1 4.0 -0.4 1002003 47.1 4.8 0.6 1.1 -0.2 1.8 25.7 15.7 4.0 -0.5 1002004 46.8 4.9 0.5 1.0 0.0 2.3 24.9 16.5 4.0 -0.9 1002005 47.5 5.4 0.1 1.0 0.1 2.4 23.1 16.8 4.2 -0.6 100
1979 61.3 2.5 0.9 3.0 0.3 2.8 14.7 7.9 5.1 1.4 1001980 60.1 2.3 0.9 3.3 0.3 2.6 16.2 7.9 4.7 1.6 1001981 59.8 2.1 0.8 3.8 0.3 2.4 16.2 8.1 4.8 1.6 1001982 58.2 1.9 0.6 4.4 0.4 2.5 17.5 8.9 4.5 1.1 1001983 56.9 2.3 0.7 4.2 0.5 2.5 17.9 9.2 4.6 1.2 1001984 58.7 2.2 0.7 4.1 0.4 3.4 15.8 8.8 4.9 1.0 1001985 59.2 2.3 0.8 4.2 0.3 3.1 15.1 8.7 5.0 1.2 1001986 58.4 2.6 0.8 3.7 0.5 3.3 15.1 9.2 4.9 1.5 1001987 56.2 3.1 0.6 3.8 0.4 3.6 16.4 9.8 5.1 1.1 1001988 56.1 3.4 0.6 3.5 0.3 3.9 15.7 9.8 5.2 1.4 1001989 55.8 3.3 0.6 3.7 0.4 3.8 15.6 10.1 5.1 1.5 1001990 57.5 3.1 0.6 3.4 0.1 3.8 14.9 10.0 5.2 1.4 1001991 56.4 2.9 0.6 3.1 0.3 3.8 15.9 10.6 5.1 1.4 1001992 55.0 3.1 0.6 2.6 0.3 3.9 16.8 11.4 5.0 1.5 1001993 54.5 3.0 0.5 2.2 0.3 3.9 16.9 12.3 5.0 1.3 1001994 54.5 3.0 0.7 1.9 0.2 3.7 16.9 12.7 5.0 1.4 1001995 55.8 2.7 0.6 2.0 0.3 3.7 15.6 12.6 5.1 1.5 1001996 56.2 3.0 0.5 1.8 0.3 3.7 15.0 12.7 5.1 1.5 1001997 58.1 2.9 0.4 1.7 0.5 3.7 14.5 11.6 5.2 1.3 1001998 58.3 2.8 0.5 1.8 0.5 4.0 13.8 11.6 5.1 1.5 1001999 58.8 2.8 1.0 1.7 0.6 4.4 13.2 11.0 5.2 1.3 1002000 58.4 2.6 0.9 1.7 0.6 4.4 13.6 11.3 5.1 1.4 1002001 58.2 2.8 0.6 1.7 0.1 4.2 13.9 12.1 4.9 1.5 1002002 57.1 2.9 0.7 1.4 -0.1 4.3 14.9 12.4 4.8 1.6 1002003 55.9 2.9 0.4 1.2 -0.1 4.1 16.0 13.2 4.7 1.7 1002004 56.1 2.9 0.6 1.2 0.1 4.2 14.1 14.5 4.7 1.7 1002005 56.9 2.8 0.5 1.1 0.2 4.1 13.3 14.9 4.9 1.4 100
Sources of Income for All Households, by Household Income Category, 1979 to 2005
Sources of Pretax Income (Percentage of total pretax income)
Lowest Quintile
Second Quintile

Table 4
Year WagesProprietors'
Income
Other Business Income
Interest and
DividendsCapital Gains Pensions
Cash Transfers
In-Kind Income
Imputed Taxes
Other Income Total
Sources of Income for All Households, by Household Income Category, 1979 to 2005
Sources of Pretax Income (Percentage of total pretax income)
1979 71.4 2.1 0.9 3.5 0.5 2.5 6.7 5.3 5.7 1.3 1001980 70.6 2.2 0.8 4.1 0.5 2.6 7.5 5.0 5.5 1.2 1001981 69.3 1.8 0.8 5.1 0.4 2.7 7.9 5.2 5.5 1.4 1001982 67.6 1.6 0.7 5.8 0.4 2.9 8.9 5.8 5.1 1.1 1001983 66.5 1.7 0.7 5.6 0.5 3.2 9.3 6.0 5.3 1.2 1001984 66.6 2.0 0.8 5.8 0.5 3.6 8.2 5.8 5.5 1.1 1001985 66.2 2.0 0.7 5.8 0.5 3.8 8.3 6.0 5.6 1.2 1001986 64.9 2.3 0.7 5.3 0.8 4.2 8.7 6.4 5.6 1.2 1001987 64.5 2.5 0.6 5.0 0.5 4.6 8.8 6.7 5.8 0.9 1001988 63.7 2.6 0.6 5.1 0.4 5.0 8.6 6.8 5.9 1.3 1001989 63.8 2.7 0.7 5.0 0.4 4.8 8.5 7.0 5.9 1.4 1001990 63.2 2.5 0.7 4.9 0.2 5.0 9.0 7.4 5.8 1.3 1001991 61.8 2.3 0.6 4.7 0.3 5.7 9.9 7.6 5.7 1.3 1001992 61.5 2.6 0.7 3.8 0.3 5.6 10.0 8.3 5.7 1.5 1001993 61.3 2.3 0.7 3.1 0.4 5.6 10.2 9.2 5.7 1.4 1001994 60.9 2.2 0.7 3.0 0.3 6.3 10.0 9.5 5.7 1.5 1001995 61.0 2.1 0.8 2.9 0.4 6.1 9.8 9.8 5.8 1.5 1001996 61.2 2.1 0.8 3.0 0.5 6.1 9.3 9.7 5.8 1.5 1001997 61.4 2.2 0.7 2.9 0.7 6.5 9.2 9.2 5.7 1.4 1001998 61.1 2.2 0.8 2.9 0.8 7.1 9.0 9.1 5.6 1.4 1001999 60.9 2.0 0.9 3.0 0.9 7.2 9.3 8.8 5.7 1.3 1002000 60.9 2.0 0.7 2.9 0.9 7.3 9.2 9.0 5.6 1.4 1002001 62.0 1.9 0.8 2.7 0.3 6.8 9.7 9.2 5.3 1.4 1002002 61.0 2.0 0.8 2.1 0.1 7.0 10.5 9.9 5.1 1.5 1002003 60.0 2.1 0.8 1.8 0.0 7.3 10.9 10.5 5.1 1.6 1002004 60.8 2.1 0.8 1.4 0.2 6.9 9.6 11.4 5.1 1.6 1002005 61.2 2.1 0.8 1.5 0.4 6.6 9.1 11.6 5.3 1.5 100
1979 74.6 2.3 1.1 3.8 0.8 2.2 4.1 4.3 5.9 1.1 1001980 73.8 2.0 1.0 4.8 0.7 2.4 4.7 4.0 5.7 1.1 1001981 72.6 1.7 0.9 5.9 0.6 2.6 4.9 4.1 5.7 1.1 1001982 71.2 1.5 0.9 6.6 0.5 2.8 5.6 4.6 5.2 1.0 1001983 70.2 1.7 1.0 6.2 0.8 3.1 5.6 4.8 5.5 1.1 1001984 70.0 1.6 0.8 6.6 0.8 3.5 5.1 4.6 5.8 1.1 1001985 69.4 1.8 0.9 6.5 0.8 3.7 5.2 4.8 5.8 1.1 1001986 69.0 1.9 0.8 5.9 1.2 4.0 5.2 5.0 5.8 1.0 1001987 69.0 2.3 0.8 5.6 0.8 4.1 5.0 5.3 6.2 0.9 1001988 68.5 2.4 0.8 5.4 0.5 4.7 4.8 5.4 6.2 1.1 1001989 67.9 2.3 0.8 5.7 0.6 4.8 5.0 5.6 6.1 1.2 1001990 67.8 2.3 0.7 5.6 0.4 5.0 5.0 5.9 6.2 1.1 1001991 68.0 2.2 0.7 5.0 0.5 5.1 5.4 5.9 6.1 1.2 1001992 67.6 2.1 0.8 4.1 0.5 5.5 5.6 6.5 6.1 1.2 1001993 67.5 2.1 0.9 3.3 0.7 5.4 5.5 7.0 6.2 1.4 1001994 67.4 2.2 1.0 3.2 0.6 5.4 5.4 7.3 6.2 1.3 1001995 67.1 2.0 0.8 3.4 0.6 5.5 5.4 7.4 6.3 1.4 1001996 66.8 2.0 0.9 3.4 0.8 5.8 5.4 7.4 6.3 1.3 1001997 67.1 2.0 1.0 3.4 1.1 5.8 5.2 6.7 6.3 1.4 1001998 67.9 2.1 1.0 3.1 1.2 5.9 5.0 6.4 6.2 1.3 1001999 67.8 2.1 1.0 3.0 1.4 6.3 4.9 5.9 6.1 1.4 1002000 68.3 1.9 0.9 2.9 1.4 6.3 4.9 6.1 6.1 1.3 1002001 66.1 1.9 1.1 3.1 0.5 7.4 6.2 6.7 5.7 1.3 1002002 66.0 1.8 1.0 2.5 0.2 7.6 6.7 7.3 5.5 1.4 1002003 65.4 1.8 1.0 2.2 0.2 7.8 6.7 7.9 5.5 1.4 1002004 64.0 1.8 1.2 2.0 0.5 7.9 6.7 9.0 5.6 1.4 1002005 63.6 1.8 1.1 2.1 0.7 7.9 6.6 9.2 5.7 1.3 100
Middle Quintile
Fourth Quintile

Table 4
Year WagesProprietors'
Income
Other Business Income
Interest and
DividendsCapital Gains Pensions
Cash Transfers
In-Kind Income
Imputed Taxes
Other Income Total
Sources of Income for All Households, by Household Income Category, 1979 to 2005
Sources of Pretax Income (Percentage of total pretax income)
1979 73.8 3.0 1.3 4.9 1.4 2.0 2.8 3.7 6.1 1.1 1001980 73.1 2.5 1.4 5.9 1.4 2.3 3.1 3.3 5.9 1.1 1001981 72.5 2.1 1.3 7.1 1.0 2.5 3.2 3.5 5.7 1.1 1001982 71.7 1.7 1.3 7.7 1.0 2.9 3.7 3.8 5.2 0.9 1001983 71.0 1.9 1.2 7.2 1.3 3.1 3.7 3.9 5.5 1.0 1001984 72.2 2.0 1.1 6.8 1.2 2.9 3.0 3.7 5.8 1.0 1001985 72.1 2.1 1.1 6.5 1.4 3.2 3.0 3.8 5.8 1.0 1001986 72.1 2.5 1.0 5.6 2.1 3.4 2.7 3.9 5.8 0.9 1001987 72.4 2.6 0.9 5.5 1.2 3.6 2.6 4.1 6.2 0.9 1001988 71.9 2.7 1.0 5.4 0.9 3.7 2.7 4.3 6.3 1.2 1001989 69.9 3.0 1.1 6.1 1.0 4.2 3.1 4.4 6.2 1.0 1001990 70.1 2.5 1.0 6.0 0.8 4.5 3.1 4.5 6.2 1.2 1001991 69.1 2.6 1.2 5.7 0.8 5.0 3.6 4.6 6.1 1.2 1001992 69.9 2.4 1.1 4.2 0.9 5.3 3.6 5.2 6.2 1.3 1001993 69.4 2.4 1.2 3.7 1.1 5.3 3.8 5.7 6.4 1.2 1001994 69.8 2.3 1.2 3.4 1.0 5.2 3.5 5.9 6.4 1.3 1001995 68.1 2.4 1.3 4.0 1.1 5.8 3.7 5.9 6.6 1.2 1001996 67.5 2.3 1.4 4.0 1.3 5.9 3.8 5.7 6.5 1.4 1001997 67.0 2.4 1.4 4.2 1.9 6.2 3.9 5.3 6.5 1.2 1001998 67.8 2.5 1.3 3.9 2.0 6.4 3.6 4.9 6.3 1.3 1001999 67.9 2.2 1.5 3.8 2.3 6.4 3.4 4.7 6.3 1.3 1002000 66.9 2.3 1.5 3.9 2.3 6.9 3.8 4.8 6.2 1.3 1002001 68.3 2.2 1.6 3.7 0.9 6.9 4.0 5.2 5.8 1.4 1002002 68.2 2.2 1.6 3.0 0.6 7.4 4.2 5.7 5.7 1.5 1002003 68.3 2.3 1.5 2.5 0.6 7.2 4.0 6.1 5.8 1.6 1002004 67.4 2.1 1.7 2.3 1.0 7.3 4.1 6.9 5.8 1.4 1002005 65.6 2.3 1.8 2.6 1.5 7.5 4.3 7.0 6.0 1.3 100
1979 69.8 4.1 2.3 6.3 2.2 2.2 2.4 3.2 6.4 1.2 1001980 69.8 3.4 2.1 7.8 2.2 2.2 2.6 2.8 6.1 1.2 1001981 69.2 2.6 1.7 9.4 1.7 2.6 2.6 3.0 5.8 1.2 1001982 70.1 2.2 1.5 9.4 1.3 3.0 3.0 3.3 5.1 1.1 1001983 69.2 2.8 1.7 8.5 2.1 2.9 2.7 3.3 5.5 1.2 1001984 68.4 2.8 1.6 9.0 1.9 3.5 2.7 3.2 5.8 1.2 1001985 69.4 2.5 1.6 8.2 2.3 3.3 2.5 3.2 5.6 1.2 1001986 68.0 3.0 1.7 7.5 4.1 3.2 2.4 3.2 5.7 1.1 1001987 68.6 3.2 1.3 7.3 2.4 3.9 2.5 3.5 6.2 1.1 1001988 67.1 3.5 1.4 7.7 1.7 4.6 2.8 3.8 6.2 1.1 1001989 66.6 3.4 2.0 8.3 1.8 4.2 2.5 3.7 6.2 1.2 1001990 66.0 3.6 1.9 8.3 1.3 4.6 2.8 4.0 6.2 1.3 1001991 67.1 3.7 1.8 7.2 1.3 4.9 2.8 4.0 6.1 1.2 1001992 66.7 3.5 1.9 6.2 1.5 5.2 3.1 4.4 6.3 1.2 1001993 66.1 3.6 2.1 5.3 1.8 5.0 3.3 4.7 6.6 1.4 1001994 67.1 3.9 2.1 4.7 1.4 5.0 2.8 5.1 6.6 1.3 1001995 65.7 3.2 2.2 5.7 1.6 5.5 3.1 4.8 6.9 1.2 1001996 65.0 3.2 2.2 5.7 2.3 5.7 3.0 4.7 6.8 1.3 1001997 64.5 3.2 2.3 5.5 3.2 6.0 3.0 4.2 6.7 1.3 1001998 64.2 3.3 2.4 5.4 3.5 6.6 3.0 4.1 6.4 1.2 1001999 63.9 3.2 2.6 4.9 4.2 6.9 2.8 3.9 6.3 1.3 1002000 63.9 3.1 2.7 5.1 4.2 6.7 2.9 3.9 6.2 1.3 1002001 67.8 3.0 2.5 4.5 1.6 6.4 2.9 4.1 5.8 1.4 1002002 68.7 2.9 2.6 3.5 1.1 6.7 3.0 4.5 5.7 1.4 1002003 67.9 3.0 2.7 3.1 1.3 6.6 3.0 5.0 5.9 1.5 1002004 65.8 3.1 2.8 3.3 2.3 6.6 3.1 5.5 6.1 1.5 1002005 63.8 3.0 3.1 3.6 3.0 7.1 3.1 5.6 6.3 1.4 100
Percentiles 91-95
Percentiles 81-90

Table 4
Year WagesProprietors'
Income
Other Business Income
Interest and
DividendsCapital Gains Pensions
Cash Transfers
In-Kind Income
Imputed Taxes
Other Income Total
Sources of Income for All Households, by Household Income Category, 1979 to 2005
Sources of Pretax Income (Percentage of total pretax income)
1979 55.7 6.9 5.1 10.5 6.4 1.9 2.0 2.2 8.0 1.5 1001980 57.3 5.3 4.5 12.7 5.4 2.1 2.0 2.0 7.0 1.6 1001981 57.4 4.4 4.2 15.4 4.5 2.3 2.2 2.2 6.1 1.2 1001982 59.6 3.9 4.0 14.8 3.8 2.8 2.5 2.4 4.7 1.5 1001983 58.8 3.9 3.9 13.0 5.8 2.7 2.2 2.4 5.4 1.8 1001984 59.1 4.4 4.0 12.6 5.5 2.6 2.2 2.2 5.6 1.8 1001985 58.1 4.4 3.9 12.2 7.1 2.9 2.3 2.3 5.5 1.3 1001986 55.7 4.7 4.2 10.6 10.7 3.0 2.1 2.3 5.2 1.4 1001987 57.3 5.3 4.3 11.6 5.8 3.4 2.2 2.6 6.5 1.0 1001988 56.8 6.1 4.5 11.8 4.8 3.6 2.1 2.7 6.3 1.3 1001989 56.1 5.7 4.4 12.7 4.7 3.9 2.3 2.7 6.2 1.4 1001990 57.6 6.1 4.4 12.2 3.3 3.8 2.2 2.8 6.1 1.6 1001991 58.6 6.0 4.5 11.0 3.1 4.4 2.2 2.9 6.0 1.3 1001992 58.5 6.1 5.0 9.4 3.3 4.3 2.3 3.2 6.4 1.6 1001993 58.7 5.9 5.1 8.2 3.9 4.4 2.2 3.4 6.9 1.3 1001994 58.3 5.7 5.3 7.7 3.4 4.7 2.6 3.8 6.9 1.5 1001995 58.1 5.6 5.5 8.3 4.0 4.2 2.3 3.5 7.2 1.2 1001996 56.4 5.5 5.9 8.3 4.9 5.0 2.3 3.4 7.1 1.3 1001997 55.0 5.2 5.9 8.4 6.7 5.1 2.2 3.1 7.0 1.5 1001998 55.0 5.3 6.6 7.8 7.3 5.6 2.0 2.8 6.4 1.1 1001999 54.5 5.2 6.5 7.4 8.7 5.7 1.9 2.7 6.4 1.1 1002000 55.1 4.6 6.3 7.6 8.3 5.8 2.1 2.7 6.1 1.4 1002001 60.0 4.7 6.8 6.7 4.3 5.5 2.1 3.0 5.4 1.5 1002002 62.0 4.9 6.7 5.4 3.3 5.4 2.2 3.3 5.4 1.5 1002003 61.6 4.6 6.8 4.8 4.0 5.2 2.1 3.6 6.0 1.2 1002004 59.1 4.7 7.6 4.9 5.5 5.3 2.0 3.7 6.2 1.1 1002005 54.8 4.9 8.2 5.5 7.5 5.2 2.1 3.7 6.6 1.5 100
1979 41.6 6.9 8.8 15.2 11.7 1.2 1.3 1.2 10.3 1.7 1001980 44.2 5.9 8.8 17.5 10.1 1.2 1.3 1.2 8.4 1.6 1001981 46.8 4.6 7.4 19.3 9.6 1.5 1.4 1.4 6.7 1.3 1001982 45.9 3.9 8.1 21.8 9.3 1.5 1.7 1.5 4.8 1.6 1001983 46.1 3.8 7.3 17.4 13.1 1.7 1.5 1.3 5.6 2.0 1001984 43.9 4.5 7.8 17.6 14.1 1.8 1.8 1.3 6.4 0.8 1001985 43.4 5.3 7.4 15.7 16.2 1.9 1.7 1.3 5.5 1.5 1001986 38.8 4.8 5.5 14.5 24.8 1.8 1.8 1.3 5.3 1.3 1001987 45.3 6.0 8.2 15.8 11.9 2.1 1.5 1.5 7.0 0.8 1001988 45.5 6.2 9.5 14.5 11.4 2.4 1.3 1.5 6.6 1.1 1001989 44.5 6.7 9.4 16.1 9.5 2.5 1.4 1.5 6.4 2.0 1001990 46.6 6.8 9.9 16.4 7.0 2.5 1.6 1.6 6.3 1.2 1001991 49.0 6.5 9.7 14.8 6.6 2.6 1.4 1.7 6.1 1.5 1001992 50.2 6.4 11.4 12.0 6.4 2.6 1.3 1.7 6.5 1.4 1001993 48.6 6.5 10.1 11.5 7.3 3.4 1.6 1.9 7.3 1.7 1001994 48.3 6.3 11.2 10.5 7.0 3.1 1.4 2.2 7.9 2.1 1001995 47.7 6.3 10.4 11.2 7.4 3.0 1.6 2.3 8.0 2.3 1001996 47.2 5.7 10.8 11.0 9.5 2.9 1.3 2.1 7.8 1.9 1001997 45.4 5.3 11.0 11.3 12.0 3.0 1.2 1.7 7.8 1.3 1001998 45.9 5.0 11.8 9.9 13.1 3.4 1.1 1.7 6.8 1.4 1001999 44.2 4.4 12.1 9.5 15.7 3.7 1.1 1.5 6.8 1.1 1002000 45.6 4.6 12.2 9.2 14.9 3.7 1.1 1.6 6.2 1.1 1002001 51.0 5.0 13.6 9.1 8.8 3.1 1.1 1.8 5.4 1.2 1002002 51.1 5.5 14.9 7.9 7.4 3.3 1.3 2.0 5.4 1.2 1002003 51.8 5.3 14.2 7.2 8.4 2.7 1.1 2.0 6.6 0.9 1002004 46.4 4.7 14.9 7.6 12.1 2.8 1.1 2.0 7.3 1.2 1002005 42.2 4.5 16.0 7.9 15.2 2.5 1.0 1.8 8.0 0.9 100
Percentiles 96-99
Percentiles 99.0 - 99.5

Table 4
Year WagesProprietors'
Income
Other Business Income
Interest and
DividendsCapital Gains Pensions
Cash Transfers
In-Kind Income
Imputed Taxes
Other Income Total
Sources of Income for All Households, by Household Income Category, 1979 to 2005
Sources of Pretax Income (Percentage of total pretax income)
1979 34.2 4.6 9.7 17.6 17.4 0.8 0.9 0.7 12.6 1.6 1001980 37.2 3.9 9.3 19.3 16.3 0.9 0.9 0.7 10.0 1.6 1001981 38.0 2.6 8.8 22.4 16.1 0.9 0.9 0.9 8.2 1.3 1001982 41.2 2.5 9.3 21.9 15.7 0.9 0.9 0.9 5.2 1.7 1001983 37.9 2.7 8.9 19.4 20.3 1.0 0.9 0.9 6.3 1.7 1001984 37.4 2.6 8.2 19.2 20.4 1.1 1.2 0.7 6.9 2.1 1001985 34.4 2.5 8.1 21.3 22.5 1.2 1.2 0.7 6.5 1.7 1001986 26.5 2.4 7.7 18.7 35.4 1.0 0.9 0.7 6.3 0.5 1001987 41.5 4.1 9.6 17.2 16.0 1.3 0.9 0.9 7.6 1.0 1001988 42.1 4.2 11.2 15.9 14.9 1.7 0.7 0.8 6.9 1.5 1001989 39.1 4.3 11.7 19.2 13.8 1.6 0.8 0.9 7.2 1.4 1001990 42.3 5.7 12.5 17.7 9.9 1.9 0.7 0.9 6.6 1.7 1001991 42.9 5.1 12.5 17.8 9.1 2.1 1.0 1.0 6.6 2.0 1001992 44.4 5.3 13.7 14.3 9.3 2.2 0.8 0.9 7.1 1.8 1001993 44.0 4.8 13.9 13.5 10.7 2.0 0.8 1.1 8.3 1.0 1001994 41.8 4.9 15.4 13.6 9.6 1.9 0.8 1.3 9.1 1.7 1001995 41.2 4.6 15.3 13.4 10.8 1.9 0.8 1.3 9.2 1.5 1001996 40.4 3.6 15.7 12.6 13.7 2.0 0.7 1.1 8.8 1.5 1001997 39.0 3.1 15.4 11.7 17.3 2.0 0.6 0.9 8.4 1.5 1001998 37.0 2.8 15.7 11.6 20.0 2.0 0.7 0.9 7.8 1.5 1001999 37.3 2.7 15.8 10.9 21.1 2.0 0.5 0.7 7.3 1.6 1002000 38.0 2.5 15.2 11.0 21.9 1.8 0.5 0.8 6.9 1.4 1002001 42.8 3.1 18.8 10.7 13.6 1.9 0.7 1.0 5.9 1.5 1002002 44.1 3.3 20.3 9.5 11.5 1.7 0.7 1.1 6.1 1.6 1002003 40.5 3.4 19.8 9.8 13.5 1.6 0.7 1.1 8.1 1.5 1002004 37.1 3.0 19.6 8.8 18.1 1.6 0.6 1.0 8.6 1.5 1002005 33.4 2.7 20.9 9.1 20.7 1.4 0.5 0.9 9.0 1.4 100
1979 21.9 2.2 8.9 20.5 27.9 0.4 0.3 0.3 16.5 1.0 1001980 23.4 2.6 7.1 21.2 30.0 0.4 0.3 0.3 13.5 1.1 1001981 23.5 0.9 8.2 22.8 31.5 0.4 0.4 0.3 10.9 0.9 1001982 23.7 1.1 8.5 23.4 33.5 0.6 0.4 0.3 7.0 1.6 1001983 21.7 1.2 9.2 19.2 38.1 0.6 0.3 0.3 8.2 1.2 1001984 23.9 1.3 9.8 19.0 34.3 0.9 0.4 0.2 8.4 1.7 1001985 20.7 1.6 10.4 18.5 37.6 0.5 0.4 0.3 7.6 2.5 1001986 12.8 0.5 5.7 12.2 61.5 0.4 0.2 0.2 6.6 0.0 1001987 28.1 1.7 12.8 20.0 25.9 0.8 0.4 0.3 9.4 0.8 1001988 27.5 2.1 16.0 17.9 24.0 1.7 0.3 0.3 8.4 1.7 1001989 27.7 2.6 16.5 20.0 21.3 1.3 0.3 0.4 8.2 1.8 1001990 29.8 2.7 16.1 21.8 17.2 1.4 0.3 0.3 8.5 1.9 1001991 31.0 2.8 16.5 22.2 15.5 1.2 0.4 0.4 8.3 2.0 1001992 35.5 2.5 17.4 17.2 14.9 1.3 0.3 0.3 8.6 2.1 1001993 32.2 2.2 17.8 16.1 17.8 1.0 0.3 0.3 10.4 1.8 1001994 29.0 2.0 20.7 15.4 17.8 1.0 0.3 0.4 11.9 1.5 1001995 29.7 1.7 19.1 15.4 19.0 1.0 0.3 0.4 11.8 1.6 1001996 27.9 1.5 17.8 14.1 24.6 0.8 0.2 0.4 11.2 1.6 1001997 28.0 1.4 17.1 12.3 28.2 0.9 0.2 0.3 10.1 1.6 1001998 27.8 1.1 16.0 11.1 32.2 0.7 0.1 0.2 9.1 1.5 1001999 29.4 1.1 15.2 10.4 33.0 0.7 0.1 0.2 8.4 1.5 1002000 31.8 1.0 13.0 10.1 34.1 0.6 0.1 0.2 7.7 1.4 1002001 33.7 1.5 18.2 12.5 23.7 0.7 0.2 0.3 7.5 1.7 1002002 33.0 1.4 22.9 11.7 19.8 0.7 0.2 0.3 8.0 1.9 1002003 30.1 1.4 22.2 10.9 22.0 0.6 0.2 0.4 10.2 1.9 1002004 26.9 1.3 19.8 10.2 28.2 0.6 0.2 0.3 11.0 1.6 1002005 23.2 1.1 19.3 10.2 32.4 0.5 0.2 0.3 11.4 1.3 100
Percentiles 99.5 - 99.9
Percentiles 99.9 - 99.99

Table 4
Year WagesProprietors'
Income
Other Business Income
Interest and
DividendsCapital Gains Pensions
Cash Transfers
In-Kind Income
Imputed Taxes
Other Income Total
Sources of Income for All Households, by Household Income Category, 1979 to 2005
Sources of Pretax Income (Percentage of total pretax income)
1979 5.9 1.2 4.1 13.4 53.2 0.2 0.0 0.0 21.7 0.3 1001980 8.6 2.0 3.1 17.4 50.5 0.2 0.0 0.0 17.4 0.7 1001981 8.1 0.5 4.0 18.3 53.9 0.2 0.0 0.0 14.4 0.7 1001982 7.2 0.7 5.8 16.2 60.1 0.1 0.1 0.0 9.1 0.6 1001983 8.4 0.9 7.7 13.7 58.7 0.1 0.0 0.0 9.8 0.6 1001984 7.9 0.7 9.5 11.7 59.1 0.1 0.1 0.0 10.5 0.4 1001985 7.5 0.5 7.9 11.1 63.5 0.1 0.1 0.0 9.1 0.2 1001986 5.1 0.0 4.8 6.7 76.8 0.1 0.1 0.0 6.7 -0.4 1001987 13.8 0.9 14.2 19.0 40.0 0.2 0.1 0.1 11.4 0.4 1001988 15.7 1.6 15.0 16.9 37.8 0.7 0.1 0.1 10.3 1.7 1001989 13.1 1.2 16.4 21.1 35.4 0.4 0.1 0.1 10.6 1.8 1001990 16.5 1.3 17.6 21.3 30.0 0.5 0.1 0.1 11.1 1.6 1001991 16.4 1.4 18.3 23.6 27.1 0.3 0.1 0.1 11.0 1.7 1001992 23.2 2.1 17.7 16.8 26.9 0.4 0.1 0.1 11.4 1.3 1001993 18.1 1.2 17.4 15.2 32.7 0.2 0.1 0.1 14.2 1.0 1001994 13.9 0.9 19.2 15.2 32.9 0.2 0.1 0.1 16.5 1.1 1001995 15.9 0.7 17.1 16.3 32.6 0.2 0.1 0.1 15.9 1.2 1001996 14.5 0.5 14.8 13.0 41.3 0.2 0.1 0.1 14.3 1.2 1001997 15.0 0.4 12.7 11.3 46.3 0.2 0.0 0.0 13.0 1.1 1001998 16.9 0.4 9.8 9.4 50.8 0.1 0.0 0.0 11.4 1.1 1001999 19.1 0.6 8.5 8.8 51.4 0.2 0.0 0.0 10.3 1.1 1002000 20.7 0.5 6.1 8.6 53.2 0.1 0.0 0.0 9.3 1.4 1002001 22.1 0.9 10.9 11.5 42.5 0.2 0.0 0.0 10.5 1.3 1002002 20.1 0.7 17.0 11.6 36.5 0.2 0.0 0.0 11.5 2.2 1002003 16.9 0.4 15.0 11.8 38.7 0.2 0.0 0.0 15.0 1.9 1002004 15.2 0.4 13.2 12.1 42.9 0.2 0.0 0.0 14.9 1.1 1002005 13.2 0.5 14.7 11.5 44.4 0.2 0.0 0.0 14.1 1.4 100
1979 63.9 3.0 2.3 6.0 3.6 2.1 6.5 4.6 6.8 1.1 1001980 64.0 2.5 2.0 7.1 3.4 2.2 7.1 4.4 6.2 1.1 1001981 63.6 1.9 1.9 8.5 3.2 2.3 7.1 4.5 5.9 1.0 1001982 63.2 1.6 1.9 9.0 3.4 2.6 7.6 4.9 5.1 0.7 1001983 62.1 1.9 2.0 8.3 4.4 2.7 7.4 4.9 5.5 0.8 1001984 62.1 2.0 2.1 8.4 4.6 3.0 6.7 4.7 5.8 0.6 1001985 61.5 2.1 2.1 8.2 5.2 3.1 6.6 4.8 5.7 0.6 1001986 58.8 2.4 2.0 7.3 9.2 3.2 6.3 4.8 5.6 0.4 1001987 61.6 2.9 2.2 7.6 3.9 3.6 6.5 5.3 6.3 0.2 1001988 60.4 3.2 2.7 7.6 3.9 3.9 6.2 5.2 6.3 0.5 1001989 60.0 3.2 2.7 8.2 3.5 4.0 6.3 5.4 6.2 0.6 1001990 60.6 3.2 2.6 8.0 2.6 4.1 6.4 5.6 6.2 0.6 1001991 60.9 3.1 2.5 7.5 2.3 4.5 6.9 5.8 6.1 0.5 1001992 60.7 3.2 2.9 6.1 2.5 4.6 7.0 6.2 6.2 0.6 1001993 60.3 3.1 3.0 5.3 2.9 4.6 7.0 6.7 6.5 0.5 1001994 60.0 3.1 3.2 5.0 2.8 4.7 6.9 7.0 6.7 0.6 1001995 59.5 2.9 3.3 5.4 3.1 4.7 6.7 6.9 6.9 0.5 1001996 58.7 2.9 3.4 5.4 4.2 4.8 6.3 6.7 6.8 0.6 1001997 58.2 2.8 3.6 5.4 5.6 5.0 6.1 6.1 6.8 0.6 1001998 58.1 2.8 3.6 5.1 6.5 5.2 5.7 5.8 6.5 0.7 1001999 57.8 2.7 3.8 4.9 7.3 5.4 5.5 5.5 6.4 0.7 1002000 57.6 2.6 3.6 5.0 7.9 5.4 5.5 5.5 6.2 0.8 1002001 60.1 2.6 3.8 4.8 4.2 5.6 6.2 6.1 5.8 0.7 1002002 60.6 2.6 4.0 4.0 3.1 5.8 6.8 6.7 5.7 0.8 1002003 59.5 2.7 4.1 3.7 3.6 5.7 6.8 7.0 6.1 0.8 1002004 57.5 2.6 4.5 3.7 5.3 5.6 6.2 7.5 6.4 0.7 1002005 55.3 2.7 5.1 4.0 6.9 5.5 5.8 7.4 6.7 0.6 100
All Income Groups
Top 0.01 Percentile

Table 4
Year WagesProprietors'
Income
Other Business Income
Interest and
DividendsCapital Gains Pensions
Cash Transfers
In-Kind Income
Imputed Taxes
Other Income Total
Sources of Income for All Households, by Household Income Category, 1979 to 2005
Sources of Pretax Income (Percentage of total pretax income)
Imputed taxes are taxes paid by businesses (corporate income taxes and the employer's share of Social Security, Medicare, and federal unemployment insurance payroll taxes). It is assumed that income would have been higher in absence of those taxes.
Income categories are defined by ranking all people by their comprehensive household income adjusted for household size—that is, divided by the square root of the household’s size. (A household consists of the people who share a housing unit, regardless of their relationships.) Income groups contain equal numbers of people.
Individual income taxes are distributed directly to households paying those taxes. Social insurance, or payroll, taxes are distributed to households paying those taxes directly or paying them indirectly through their employers. Corporate income taxes are distributed to households according to their share of capital income. Federal excise taxes are distributed to them according to their consumption of the taxed good or service.
Wages include cash wage and salary payments as well as employees' contributions to 401(k) retirement plans.Proprietors' income is net income from businesses and farms operated solely by their owners. Other business income includes partnership income, income from S corporations, and positive rental income.Interest and dividends includes taxable and nontaxable interest and dividends paid by C corporations.Capital gains are the profits from the sale of assets. Unrealized capital gains are not included.Pension income is income received in retirement for past services. It also includes taxable withdrawals from individual retirement accounts and deferred compensation plans.Cash transfers include payments from Social Security, unemployment insurance, Supplemental Security Income, Aid to Families with Dependent Children, Temporary Assistance For Needy Families, veterans' benefits, and workers' compensation.In-kind income includes employer-paid health insurance premiums, food stamps, school lunches and breakfasts, housing assistance, energy assistance, and the fungible value of Medicare and Medicaid, as estimated in the Current Population Survey.
Source: Congressional Budget Office.
Notes: Pretax household income equals the sum of several components:

Table 5
YearPretax Income
After-tax Income Wages
Proprietors' Income
Other Business Income
Interest and
DividendsCapital Gains Pensions
Cash Transfers
In-Kind Income
Imputed Taxes
Other Income
All Federal Taxes
Individual Income Taxes
Social Insurance
Taxes
Corporate Income Taxes
Excise Taxes
1979 279.8 257.5 113.0 4.5 2.8 7.1 0.7 5.6 95.9 36.6 10.3 3.3 22.3 -0.1 14.9 3.0 4.61980 272.3 251.3 109.9 3.3 1.9 7.5 0.8 4.4 95.6 36.1 9.4 3.3 21.0 0.4 14.4 2.3 3.81981 263.3 241.5 107.9 2.5 1.7 7.9 1.0 4.2 91.0 34.9 9.3 2.9 21.9 1.2 15.5 1.7 3.51982 250.6 229.9 102.6 1.9 2.0 9.0 1.1 4.3 86.0 34.8 8.3 0.7 20.6 1.1 14.8 1.1 3.61983 240.5 218.6 101.1 2.4 1.1 8.3 1.2 3.7 80.4 33.2 8.5 0.7 21.9 0.9 14.7 1.4 4.91984 262.7 236.0 112.5 1.8 2.1 10.4 1.5 6.8 82.6 35.3 10.2 -0.6 26.7 1.7 17.0 2.0 6.01985 264.4 238.5 111.0 3.4 2.1 8.5 1.0 5.1 86.0 36.6 9.8 1.0 25.9 1.2 17.4 1.5 5.81986 269.2 243.2 112.8 4.7 2.5 8.2 1.4 5.7 84.8 38.2 10.2 0.8 26.0 1.1 17.9 1.6 5.41987 256.2 233.9 101.4 7.4 0.9 7.3 0.8 5.4 82.2 40.1 9.6 1.1 22.3 -1.5 16.4 1.9 5.51988 264.8 242.3 107.0 8.1 0.5 7.2 0.8 5.9 84.2 39.3 10.3 1.5 22.5 -2.9 18.2 1.8 5.41989 273.1 251.4 114.3 8.6 0.6 7.0 0.8 6.3 81.8 40.7 10.8 2.1 21.7 -4.4 19.3 1.7 5.01990 287.1 261.7 121.7 9.2 0.6 7.6 -0.1 6.7 85.1 43.7 11.4 1.2 25.4 -2.8 21.0 1.6 5.71991 294.1 269.3 124.3 8.8 0.1 8.2 0.5 7.1 89.2 43.8 11.8 0.5 24.8 -4.7 21.3 1.8 6.51992 284.4 261.0 120.8 9.4 0.4 6.1 0.8 6.5 86.9 42.8 11.5 -0.8 23.3 -5.9 20.8 1.8 6.71993 292.1 268.7 122.2 10.0 0.7 5.0 0.6 7.0 88.3 45.5 11.7 0.9 23.3 -6.8 21.0 1.8 7.31994 296.1 276.6 123.5 10.4 1.1 4.6 0.3 7.1 88.6 48.4 11.7 0.4 19.5 -11.5 21.4 1.7 7.81995 321.4 301.2 139.2 12.0 1.3 5.5 0.8 7.4 91.1 50.3 13.4 0.4 20.1 -14.2 24.3 2.2 7.91996 316.7 298.8 142.2 12.5 1.1 4.6 0.9 6.6 86.0 48.6 13.4 0.9 17.9 -16.1 24.7 1.9 7.31997 331.3 312.2 154.6 14.0 1.2 4.7 1.2 7.7 86.0 47.5 14.2 0.2 19.1 -17.2 26.8 1.8 7.71998 355.7 335.2 173.0 15.5 0.7 4.8 1.3 8.7 85.4 49.5 15.6 1.1 20.5 -19.1 29.8 1.8 8.01999 368.0 345.4 179.0 16.6 4.4 4.7 1.6 8.6 86.2 49.4 16.1 1.4 22.6 -19.0 30.8 1.8 8.92000 366.5 343.1 174.4 16.0 3.1 5.4 2.0 9.4 88.7 50.2 15.8 1.4 23.4 -17.0 30.2 1.9 8.32001 369.0 350.1 176.5 17.0 1.8 5.0 0.0 7.2 91.3 56.3 15.1 -1.2 18.9 -20.6 30.5 1.1 8.02002 365.2 348.1 171.5 16.8 1.6 4.3 -0.6 7.5 95.6 55.3 14.5 -1.3 17.1 -21.8 29.9 0.8 8.22003 363.0 346.2 170.8 17.5 2.0 3.9 -0.6 6.7 93.4 56.9 14.4 -1.9 16.8 -21.9 29.4 1.1 8.22004 372.9 356.8 174.7 18.4 1.7 3.7 -0.1 8.6 92.9 61.7 14.8 -3.5 16.1 -23.2 29.8 1.3 8.12005 384.5 368.0 182.8 20.7 0.3 4.0 0.2 9.2 89.0 64.6 16.0 -2.3 16.5 -25.1 31.8 1.7 8.2
1979 538.6 461.6 330.2 13.4 5.1 16.2 1.8 15.0 79.2 42.8 27.2 7.6 77.1 22.0 41.5 6.6 6.91980 525.0 451.0 315.7 12.0 4.5 17.5 1.8 13.8 85.2 41.4 24.8 8.2 74.0 23.4 39.7 5.1 5.81981 525.5 448.2 314.4 10.8 4.1 20.0 1.8 12.8 85.2 42.8 25.1 8.5 77.3 25.2 42.8 4.0 5.31982 512.9 442.3 298.6 9.6 3.2 22.6 2.1 12.9 89.7 45.8 22.9 5.5 70.6 21.5 41.0 2.6 5.41983 510.4 440.4 290.5 11.9 3.8 21.2 2.7 12.8 91.4 46.8 23.3 6.0 70.0 19.4 40.6 3.4 6.61984 540.3 461.2 317.0 12.0 3.9 22.4 2.3 18.2 85.1 47.5 26.3 5.6 79.1 21.8 45.6 4.0 7.71985 555.3 472.8 328.8 13.0 4.5 23.3 1.9 17.4 83.8 48.4 27.5 6.7 82.4 22.3 48.8 3.7 7.61986 571.5 487.1 333.6 14.9 4.4 21.1 2.9 18.7 86.3 52.7 28.2 8.7 84.4 22.7 50.4 3.7 7.61987 583.5 501.6 327.9 18.2 3.4 21.9 2.2 20.8 95.9 57.2 29.5 6.4 81.9 18.5 50.0 5.3 8.11988 605.8 519.0 340.0 20.6 3.8 21.3 1.6 23.9 95.3 59.5 31.2 8.6 86.8 19.0 54.5 5.1 8.31989 619.7 533.4 346.1 20.3 4.0 23.1 2.3 23.8 96.4 62.4 31.8 9.5 86.4 18.1 55.4 5.2 7.71990 628.6 536.8 361.6 19.4 3.6 21.6 0.5 23.7 93.6 63.0 32.5 9.1 91.8 21.1 58.4 4.4 7.91991 620.4 532.4 349.6 18.3 3.5 19.4 1.8 23.5 98.4 65.7 31.6 8.8 88.0 18.0 56.8 4.2 8.91992 626.0 540.5 344.1 19.3 3.9 16.1 1.7 24.2 104.9 71.1 31.3 9.4 85.6 15.6 56.0 4.4 9.61993 639.8 553.5 348.9 19.0 3.4 14.2 1.8 25.2 108.0 78.5 32.2 8.6 86.3 14.8 56.6 5.0 10.01994 659.3 572.8 359.2 19.8 4.3 12.6 1.5 24.6 111.5 83.7 33.0 9.3 86.5 12.3 58.4 4.9 11.01995 681.0 589.5 380.3 18.6 3.9 13.6 1.8 25.5 106.4 85.6 34.9 10.3 91.5 13.5 61.7 5.2 10.91996 692.3 600.7 389.4 20.5 3.5 12.7 2.4 25.7 103.8 88.1 35.5 10.6 91.6 12.6 63.4 5.1 10.41997 708.8 612.2 411.5 20.5 3.1 12.2 3.4 26.4 103.1 82.3 36.9 9.5 96.6 14.7 66.7 4.8 10.41998 742.3 645.7 432.9 20.9 3.8 13.3 3.6 29.6 102.3 86.2 38.2 11.4 96.6 11.4 70.0 4.6 10.51999 768.5 666.0 451.6 21.5 7.5 12.8 4.9 33.6 101.6 84.8 39.9 10.3 102.6 12.7 73.1 4.8 11.92000 782.8 681.4 457.1 20.4 6.7 13.3 4.8 34.5 106.2 88.5 40.1 11.3 101.4 12.0 73.7 4.6 11.12001 794.4 703.2 462.3 22.0 4.7 13.5 1.1 33.0 110.4 96.4 39.1 12.1 91.2 2.3 75.0 3.1 10.82002 787.6 702.4 450.1 22.6 5.2 11.2 -0.4 33.6 117.2 97.8 37.5 12.9 85.2 -1.6 73.2 2.5 11.12003 787.7 710.7 440.6 22.6 3.3 9.7 -0.5 32.1 125.7 104.2 36.9 13.2 77.0 -8.3 71.5 2.8 11.02004 816.7 735.5 458.5 23.9 4.6 9.4 0.7 34.0 115.0 118.4 38.7 13.5 81.2 -7.3 74.0 3.6 10.92005 822.2 740.4 467.6 23.2 4.2 9.1 1.5 33.4 109.7 122.2 40.0 11.2 81.7 -8.2 75.2 4.1 10.6
Taxes PaidSources of Pretax Income
Lowest Quintile
Second Quintile
Total Income and Total Federal Tax Liabilities for All Households, by Household Income Category, 1979 to 2005 (Billions of 2005 dollars)

Table 5
YearPretax Income
After-tax Income Wages
Proprietors' Income
Other Business Income
Interest and
DividendsCapital Gains Pensions
Cash Transfers
In-Kind Income
Imputed Taxes
Other Income
All Federal Taxes
Individual Income Taxes
Social Insurance
Taxes
Corporate Income Taxes
Excise Taxes
Taxes PaidSources of Pretax Income
Total Income and Total Federal Tax Liabilities for All Households, by Household Income Category, 1979 to 2005 (Billions of 2005 dollars)
1979 764.0 621.8 545.6 16.4 6.5 26.9 3.7 19.1 51.3 40.8 43.7 10.2 142.2 57.3 65.7 10.9 8.41980 751.5 610.9 530.5 16.4 6.2 31.1 3.7 19.3 56.7 37.2 41.2 9.2 140.6 60.0 64.2 9.2 7.11981 765.3 618.6 530.1 13.9 6.3 38.7 3.2 20.8 60.3 39.5 41.9 10.7 146.8 63.2 69.3 7.6 6.71982 760.6 624.3 514.3 12.2 5.5 44.2 3.3 22.1 67.9 43.8 38.8 8.4 136.3 56.6 68.0 4.9 6.81983 767.1 632.7 510.0 13.4 5.7 43.0 3.9 24.4 71.0 46.1 40.5 9.2 134.4 51.5 68.2 6.6 8.11984 808.5 662.8 538.4 16.3 6.5 46.6 3.8 29.4 66.4 47.1 44.8 9.1 145.6 53.9 74.7 8.0 9.11985 835.3 684.2 552.6 16.4 6.0 48.5 4.2 31.9 69.0 50.3 46.6 9.8 151.1 55.2 79.2 7.6 9.11986 877.9 719.8 569.9 20.1 6.2 46.9 6.7 36.6 76.4 55.9 48.9 10.2 158.1 57.2 83.4 8.1 9.41987 896.5 739.0 578.3 22.4 5.5 45.0 4.8 41.3 78.6 60.5 52.2 7.9 157.5 52.2 84.6 10.9 9.91988 924.7 758.8 588.8 23.7 6.0 47.3 3.6 46.2 79.2 63.3 54.9 11.7 165.9 54.8 90.1 11.1 9.91989 950.2 779.7 606.3 25.2 6.4 47.7 3.4 45.5 80.5 66.3 55.6 13.3 170.5 57.3 93.5 10.1 9.61990 951.9 781.5 601.6 24.1 7.1 46.2 1.7 47.9 85.3 70.5 55.2 12.3 170.4 57.2 94.1 9.4 9.81991 960.0 791.4 593.4 22.3 6.2 45.5 2.9 54.8 94.7 73.0 54.4 12.7 168.6 55.5 92.5 9.3 11.31992 967.8 799.2 595.4 25.6 6.7 36.8 3.2 54.2 96.5 80.0 55.2 14.1 168.6 53.6 93.8 9.6 11.61993 979.8 810.6 600.6 22.6 6.9 30.2 3.9 55.2 100.0 90.5 55.9 14.0 169.2 53.1 93.8 10.2 12.01994 1,019.0 842.8 620.1 22.8 7.4 30.1 3.3 63.7 101.6 97.0 58.4 14.8 176.2 54.4 97.2 11.1 13.51995 1,046.0 865.0 637.6 21.8 7.9 30.7 4.1 64.0 102.2 102.0 60.5 15.2 181.0 55.6 100.5 11.7 13.21996 1,067.7 882.9 653.6 22.8 8.5 31.6 5.4 64.9 99.3 103.3 62.0 16.1 184.7 57.4 102.6 12.2 12.51997 1,104.3 912.4 678.5 24.5 8.2 31.5 7.8 71.5 101.1 101.9 63.4 16.0 192.0 61.4 106.5 11.7 12.31998 1,159.7 965.2 709.0 25.1 8.9 33.5 9.5 82.3 104.2 105.8 65.5 15.7 194.4 58.3 111.6 11.4 13.11999 1,198.0 996.1 729.9 24.3 10.2 35.7 11.2 86.7 111.1 106.0 67.9 15.1 201.9 60.1 114.8 12.2 14.92000 1,230.5 1,025.7 749.6 24.9 9.1 35.9 11.6 89.3 113.1 111.3 68.8 17.0 204.7 61.4 117.7 11.6 13.92001 1,227.8 1,039.8 761.7 22.9 10.0 33.0 3.3 82.9 119.1 112.7 65.4 16.7 187.9 47.8 119.5 7.3 13.32002 1,223.3 1,042.4 746.1 24.6 9.3 26.1 0.8 85.4 128.5 121.3 62.7 18.4 180.9 44.3 117.0 5.9 13.62003 1,233.8 1,063.1 739.7 25.8 9.4 22.8 0.5 89.8 134.4 129.1 62.8 19.5 170.7 34.5 115.8 6.9 13.62004 1,275.8 1,096.1 775.6 27.0 10.6 18.3 2.5 87.5 122.8 145.3 65.7 20.4 179.7 37.8 121.3 7.1 13.42005 1,296.2 1,111.8 792.9 27.2 10.9 19.3 4.6 85.7 117.9 149.8 68.5 19.4 184.4 38.8 123.5 8.9 13.3
1979 1,064.1 838.5 793.7 24.2 11.2 40.5 8.0 23.3 43.1 46.0 62.4 11.7 225.7 107.8 90.8 17.1 10.01980 1,053.1 827.1 777.0 21.0 10.1 50.3 7.2 24.8 49.6 41.7 59.7 11.8 226.0 112.9 89.6 15.0 8.51981 1,071.4 834.5 777.9 17.7 9.6 63.4 6.5 27.5 52.0 44.4 61.0 11.4 236.8 118.9 97.4 12.6 7.91982 1,074.2 852.9 765.1 16.1 9.4 70.7 5.8 30.1 60.6 49.2 56.3 10.8 221.4 107.9 97.2 7.9 8.31983 1,098.2 877.7 771.4 18.9 10.6 68.3 8.3 34.3 62.0 52.2 60.3 11.9 220.5 99.9 99.8 10.7 10.11984 1,156.3 920.6 808.9 18.2 9.6 76.5 9.8 40.4 59.5 53.7 67.0 12.8 235.6 102.8 108.0 13.5 11.31985 1,198.6 954.3 831.7 21.7 10.6 78.0 9.2 44.6 62.5 57.8 69.0 13.5 244.3 106.0 114.6 12.5 11.21986 1,261.7 1,003.5 870.8 24.4 9.9 74.2 15.4 50.9 66.1 63.7 73.4 12.8 258.2 111.3 122.6 13.1 11.21987 1,296.0 1,034.3 894.2 30.0 10.4 73.0 10.2 53.6 64.4 68.7 79.9 11.6 261.7 105.4 126.5 18.0 11.91988 1,344.0 1,066.9 920.5 32.1 11.3 72.7 7.0 63.0 65.0 73.1 83.9 15.3 277.1 111.1 136.5 17.2 12.21989 1,363.2 1,084.0 925.8 31.5 11.1 77.4 8.6 66.1 67.5 75.8 83.7 15.7 279.2 113.7 136.7 16.9 11.81990 1,364.9 1,083.5 924.8 31.2 10.2 76.7 5.3 68.1 68.9 79.9 84.3 15.5 281.4 113.5 140.0 15.9 11.91991 1,359.3 1,080.5 924.5 29.3 9.8 68.4 6.2 69.4 72.8 79.8 83.0 16.1 278.8 110.7 140.3 14.4 13.31992 1,383.7 1,104.2 935.7 28.5 11.2 57.3 6.6 75.9 78.0 89.3 84.4 16.8 279.5 109.0 141.6 15.0 13.91993 1,408.2 1,123.4 950.2 30.2 13.2 46.4 9.9 76.4 77.2 98.3 87.0 19.2 284.7 110.0 143.7 16.8 14.31994 1,453.9 1,157.8 980.5 31.3 14.0 46.0 8.0 79.1 78.8 106.8 90.7 18.8 296.1 113.4 148.8 18.0 15.91995 1,494.8 1,189.0 1,003.4 30.0 12.7 50.9 8.9 82.9 80.5 110.5 94.7 20.3 305.8 116.6 153.5 19.8 15.91996 1,541.5 1,227.8 1,029.6 30.1 13.8 51.9 12.4 89.7 83.2 113.5 97.1 20.3 313.7 121.5 157.0 20.5 14.71997 1,584.7 1,259.2 1,064.1 31.5 15.5 53.5 16.7 91.9 83.0 106.7 100.0 21.9 325.4 127.3 163.2 20.4 14.51998 1,663.8 1,324.9 1,129.4 34.7 16.0 51.1 20.7 97.4 83.3 106.3 102.9 22.0 339.0 131.8 173.3 18.5 15.41999 1,722.5 1,368.9 1,168.7 35.8 17.0 51.0 24.7 108.4 85.0 102.4 105.8 23.7 353.6 138.5 178.9 18.7 17.42000 1,780.9 1,415.8 1,215.8 33.4 16.7 51.3 24.6 112.4 86.8 108.5 108.3 23.1 365.1 144.8 186.0 17.6 16.72001 1,807.1 1,465.8 1,195.1 34.6 19.4 55.7 8.8 134.6 112.1 121.3 102.4 23.2 341.3 128.1 183.7 12.9 16.52002 1,792.1 1,464.3 1,182.5 32.0 17.9 45.6 4.1 135.6 120.0 131.3 98.8 24.3 327.7 120.2 180.3 11.0 16.32003 1,813.3 1,498.5 1,185.8 32.6 18.7 40.0 3.7 142.0 121.0 143.1 100.1 26.2 314.8 106.4 179.5 12.9 16.02004 1,881.0 1,555.9 1,204.4 34.2 21.9 38.0 9.4 148.0 125.9 168.6 104.5 26.2 325.1 110.3 183.0 15.6 16.12005 1,922.8 1,587.4 1,223.6 35.2 21.7 40.4 13.9 151.4 126.2 176.3 108.9 25.2 335.4 114.6 186.3 18.5 16.0
Middle Quintile
Fourth Quintile

Table 5
YearPretax Income
After-tax Income Wages
Proprietors' Income
Other Business Income
Interest and
DividendsCapital Gains Pensions
Cash Transfers
In-Kind Income
Imputed Taxes
Other Income
All Federal Taxes
Individual Income Taxes
Social Insurance
Taxes
Corporate Income Taxes
Excise Taxes
Taxes PaidSources of Pretax Income
Total Income and Total Federal Tax Liabilities for All Households, by Household Income Category, 1979 to 2005 (Billions of 2005 dollars)
1979 726.7 557.4 536.0 21.5 9.7 35.6 9.9 14.7 20.3 26.6 44.5 7.9 169.4 89.6 57.6 16.0 6.21980 727.6 554.7 531.7 18.3 10.4 42.8 10.1 17.0 22.5 24.1 42.6 8.0 172.9 95.6 58.0 13.9 5.31981 738.5 558.9 535.2 15.5 9.8 52.7 7.2 18.4 23.7 25.6 42.3 8.1 179.6 100.3 63.4 11.0 4.91982 753.4 583.1 540.5 13.0 9.9 57.9 7.2 22.1 27.9 28.8 39.4 6.5 170.3 92.7 65.4 6.9 5.21983 769.5 600.4 546.2 14.9 9.2 55.7 10.2 24.2 28.6 30.1 42.7 7.7 169.1 86.1 67.6 9.2 6.31984 806.2 626.6 582.0 16.5 9.0 55.1 10.0 23.6 24.5 30.1 47.1 8.3 179.5 87.7 74.7 10.2 6.81985 837.1 650.4 603.6 17.7 9.4 54.5 11.4 26.8 24.7 32.0 48.4 8.6 186.7 91.2 79.4 9.4 6.81986 878.2 680.3 633.4 21.6 8.8 49.4 18.3 29.7 23.6 33.9 51.1 8.3 197.8 96.2 85.5 9.3 6.81987 904.6 698.5 655.1 23.2 8.4 49.4 10.8 32.7 23.2 37.4 56.0 8.2 206.1 97.6 88.4 12.8 7.21988 935.7 720.4 672.8 25.4 9.0 50.2 8.8 34.8 24.9 39.8 58.7 11.3 215.4 100.7 94.8 12.5 7.41989 957.8 738.5 669.9 28.4 10.3 58.5 9.9 40.2 29.6 41.9 59.3 9.9 219.3 104.0 94.6 13.4 7.31990 957.6 738.2 671.3 23.8 9.9 57.7 7.3 43.3 30.0 43.4 59.8 11.1 219.3 102.6 96.7 12.7 7.31991 953.1 736.7 658.9 24.5 11.7 54.7 7.3 48.0 34.0 44.3 58.6 11.2 216.4 100.4 95.9 12.1 8.01992 973.3 753.3 680.1 23.8 10.8 40.6 8.4 51.2 34.7 50.4 60.4 12.8 220.0 100.2 99.5 11.9 8.41993 991.9 767.9 688.5 23.9 11.6 36.3 10.6 52.2 37.2 56.6 63.0 12.1 224.0 100.8 100.3 14.2 8.71994 1,021.2 788.2 712.7 23.6 12.0 35.0 9.9 53.3 35.9 60.3 65.4 13.3 233.0 104.9 103.7 15.0 9.41995 1,053.2 810.4 717.0 24.8 13.5 42.2 11.2 61.3 39.2 62.5 69.1 12.4 242.8 109.8 105.7 17.7 9.61996 1,096.9 845.2 740.8 25.3 15.2 44.1 14.7 64.4 42.2 63.0 71.6 15.7 251.7 114.9 109.0 18.8 9.01997 1,143.8 878.8 766.7 27.1 15.7 48.1 21.5 71.1 44.6 61.0 74.3 13.7 265.0 123.5 112.8 19.6 9.11998 1,202.6 924.1 815.6 29.7 15.2 46.7 23.7 77.0 43.6 59.2 75.9 15.9 278.5 130.7 120.4 17.6 9.81999 1,241.1 950.9 843.1 27.7 18.5 46.8 28.9 80.0 42.7 58.5 78.5 16.3 290.2 136.8 124.2 18.2 11.02000 1,294.1 991.8 865.4 30.3 19.7 51.1 30.1 89.5 49.6 62.1 80.2 16.2 302.4 145.7 127.9 18.3 10.52001 1,283.5 999.3 876.0 28.4 20.5 47.8 11.0 88.3 51.8 66.3 75.0 18.5 284.2 132.3 130.3 11.8 9.82002 1,270.6 997.9 866.7 27.5 20.0 38.3 7.0 94.0 53.7 71.8 72.5 19.1 272.7 124.6 128.6 10.1 9.42003 1,292.4 1,030.3 882.9 30.0 19.8 32.5 8.2 92.8 52.2 78.6 74.8 20.5 262.1 110.9 130.0 12.0 9.22004 1,344.7 1,071.8 906.9 28.6 22.7 30.7 13.2 98.1 54.9 92.3 78.4 18.7 272.9 116.5 132.9 14.1 9.42005 1,377.0 1,097.4 903.6 32.3 25.4 35.7 20.6 103.6 58.9 96.6 82.3 18.1 279.7 119.5 132.2 18.6 9.4
1979 475.0 356.5 331.6 19.3 10.9 29.9 10.6 10.3 11.3 15.0 30.6 5.5 118.4 67.1 33.3 14.3 3.81980 471.5 351.9 329.1 16.0 9.7 36.6 10.2 10.3 12.1 13.4 28.6 5.6 119.7 71.0 33.0 12.4 3.31981 480.2 356.6 332.3 12.7 8.0 45.3 8.4 12.5 12.7 14.4 28.0 5.8 123.5 73.6 37.1 9.8 3.01982 484.2 369.6 339.3 10.8 7.5 45.6 6.5 14.3 14.3 16.0 24.7 5.1 114.6 67.1 38.9 5.5 3.11983 497.6 383.4 344.5 13.8 8.6 42.3 10.6 14.6 13.5 16.4 27.2 6.1 114.2 63.0 40.1 7.5 3.51984 525.2 403.1 359.1 14.8 8.4 47.2 9.9 18.4 14.1 16.6 30.2 6.5 122.1 65.5 43.6 8.9 4.01985 547.6 420.2 380.2 13.9 9.0 45.0 12.8 18.0 13.5 17.7 30.9 6.8 127.5 68.6 46.8 8.1 4.01986 585.4 449.3 397.8 17.8 10.2 43.9 24.1 18.9 14.3 18.9 33.1 6.2 136.1 73.0 50.0 8.9 4.31987 592.7 448.9 406.3 18.8 7.9 43.4 14.2 23.3 14.7 20.8 37.0 6.3 143.8 76.0 51.2 12.1 4.51988 615.4 467.7 413.2 21.6 8.9 47.4 10.2 28.5 17.4 23.3 38.4 6.6 147.7 76.7 54.5 12.1 4.51989 632.2 480.4 421.1 21.5 12.7 52.4 11.1 26.8 16.1 23.6 39.2 7.6 151.8 79.5 55.6 12.5 4.31990 631.6 480.3 416.6 22.8 12.0 52.6 8.4 28.8 17.8 25.2 39.4 8.1 151.3 78.1 56.7 12.2 4.31991 630.0 478.5 422.6 23.1 11.3 45.5 8.2 30.6 17.8 24.9 38.7 7.4 151.6 77.0 59.3 10.6 4.71992 651.8 495.9 435.0 22.7 12.6 40.1 9.9 33.6 20.1 28.8 41.1 7.8 155.9 78.6 60.2 12.2 4.91993 661.3 501.8 437.4 24.0 14.2 35.3 11.7 32.8 21.7 31.3 43.4 9.5 159.5 78.5 61.4 14.2 5.31994 678.0 510.8 454.7 26.4 14.0 31.8 9.8 34.2 19.3 34.8 44.6 8.5 167.2 83.1 64.3 14.1 5.71995 711.7 534.0 467.6 23.1 15.7 40.6 11.4 39.4 22.0 34.5 48.9 8.5 177.8 88.6 66.5 17.1 5.71996 738.7 554.2 480.5 24.0 16.2 41.8 17.3 42.0 22.1 34.6 50.5 9.7 184.5 93.7 67.0 18.4 5.31997 780.8 584.8 503.7 24.9 18.1 42.9 25.1 47.2 23.8 32.9 52.3 9.8 196.0 101.5 70.1 18.8 5.61998 821.3 616.4 527.2 27.1 19.6 44.0 28.4 54.6 24.5 33.6 52.6 9.8 205.0 108.2 73.2 17.7 5.91999 851.8 636.2 544.4 27.6 21.8 42.0 35.5 59.1 23.9 32.8 53.8 10.9 215.6 115.6 75.7 17.8 6.52000 895.7 669.6 572.5 28.0 23.9 46.0 37.4 60.1 25.9 34.5 55.6 11.8 226.1 122.7 79.3 17.8 6.22001 872.4 660.3 591.5 26.1 22.1 39.5 13.8 55.9 25.3 35.5 50.6 12.0 212.1 112.3 83.4 10.7 5.72002 858.4 655.4 589.4 24.5 22.5 30.1 9.2 57.1 26.0 38.9 48.6 12.1 203.0 105.9 82.8 8.9 5.52003 873.7 678.5 593.4 26.1 23.8 27.4 11.6 57.3 26.2 43.7 51.3 13.1 195.2 95.0 83.2 11.6 5.42004 911.3 707.3 599.4 28.3 25.3 30.3 20.7 59.7 28.2 49.8 55.7 13.8 204.0 98.8 83.6 16.0 5.62005 958.5 743.5 611.8 28.6 29.5 34.7 28.3 68.3 29.9 53.6 60.1 13.6 215.0 105.0 84.4 20.0 5.7
Percentiles 91-95
Percentiles 81-90

Table 5
YearPretax Income
After-tax Income Wages
Proprietors' Income
Other Business Income
Interest and
DividendsCapital Gains Pensions
Cash Transfers
In-Kind Income
Imputed Taxes
Other Income
All Federal Taxes
Individual Income Taxes
Social Insurance
Taxes
Corporate Income Taxes
Excise Taxes
Taxes PaidSources of Pretax Income
Total Income and Total Federal Tax Liabilities for All Households, by Household Income Category, 1979 to 2005 (Billions of 2005 dollars)
1979 553.3 400.2 308.1 38.0 28.0 58.2 35.4 10.7 10.8 11.9 44.1 8.2 153.1 92.2 24.0 32.9 4.01980 551.4 398.4 316.0 29.2 24.6 70.3 29.9 11.7 11.1 11.2 38.5 9.0 153.0 97.7 25.4 26.4 3.41981 561.4 407.0 322.3 24.9 23.5 86.2 25.4 13.0 12.5 12.4 34.5 6.9 154.4 101.6 28.9 20.8 3.11982 558.0 420.3 332.7 21.8 22.3 82.5 21.0 15.8 13.7 13.6 26.1 8.5 137.8 92.4 31.0 11.3 3.11983 585.3 446.5 344.1 23.1 22.8 76.0 34.2 15.8 13.0 14.3 31.4 10.6 138.9 86.4 33.3 15.5 3.71984 615.0 466.8 363.3 27.2 24.3 77.7 33.7 16.1 13.5 13.7 34.5 10.9 148.1 90.7 35.9 17.6 3.91985 652.5 497.1 379.2 28.8 25.4 79.8 46.1 19.2 14.8 15.3 35.6 8.3 155.4 95.1 38.6 17.4 4.31986 716.5 547.2 399.2 33.5 30.2 76.3 77.0 21.2 15.1 16.5 37.6 9.7 169.3 105.4 40.6 18.6 4.61987 709.2 524.9 406.7 37.3 30.6 82.6 40.8 23.9 15.5 18.7 45.8 7.4 184.4 111.5 42.1 26.2 4.51988 751.9 559.3 426.9 45.9 34.0 88.8 36.1 27.0 15.7 20.4 47.4 9.7 192.6 116.0 45.8 26.3 4.61989 775.7 578.4 434.8 44.0 34.3 98.7 36.1 30.2 17.5 21.1 47.9 11.0 197.3 120.4 46.1 26.5 4.31990 770.5 575.7 443.8 46.7 33.9 93.8 25.2 29.0 17.2 21.8 46.9 12.2 194.8 117.2 49.1 24.2 4.31991 768.4 571.9 450.3 45.8 34.2 84.9 24.0 33.5 17.1 22.5 46.2 9.9 196.5 115.1 54.2 22.3 4.91992 798.9 594.2 467.4 48.9 39.9 75.1 26.3 34.0 18.4 25.3 51.1 12.5 204.7 119.0 55.2 25.4 5.01993 813.3 596.6 477.6 48.0 41.4 66.5 31.6 35.7 18.2 27.8 55.8 10.8 216.7 122.7 58.6 29.8 5.61994 834.0 608.7 486.6 47.8 44.6 64.2 28.1 38.9 21.4 32.0 57.9 12.6 225.3 128.2 60.1 31.2 5.81995 878.9 637.1 510.6 49.6 48.5 72.6 35.2 37.2 20.1 31.0 63.6 10.5 241.8 139.9 60.1 36.3 5.51996 932.1 673.9 525.7 51.3 54.7 77.5 45.4 46.5 21.7 31.4 66.0 11.9 258.2 152.9 62.0 37.9 5.41997 996.1 719.3 547.9 52.1 58.3 84.1 66.3 51.0 21.6 30.7 69.5 14.7 276.8 166.8 63.6 40.7 5.81998 1,049.4 759.9 577.6 55.6 68.9 82.0 76.7 58.8 21.0 29.8 67.2 11.9 289.5 179.9 66.2 37.4 6.01999 1,122.4 806.8 611.3 58.3 72.8 83.1 98.0 63.9 21.1 29.8 71.3 12.9 315.6 198.6 70.4 39.5 7.12000 1,176.8 846.0 648.9 54.0 73.6 89.7 98.2 68.1 24.7 31.3 72.2 16.2 330.8 212.0 74.2 38.2 6.42001 1,101.1 807.8 661.2 51.6 75.1 73.4 47.1 61.0 23.5 33.0 59.3 16.1 293.3 186.5 76.8 24.2 5.82002 1,084.2 801.5 671.7 53.0 72.2 58.7 36.0 58.7 23.6 35.3 58.4 16.6 282.6 175.5 79.8 21.9 5.52003 1,099.2 824.4 677.5 50.9 74.7 53.1 43.9 57.6 23.1 39.8 66.0 12.8 274.8 160.2 80.0 29.3 5.42004 1,173.6 876.9 693.1 54.8 88.7 57.5 64.2 61.7 23.5 43.6 73.0 13.4 296.7 174.6 79.7 36.7 5.62005 1,260.5 936.9 691.2 61.4 103.6 69.4 95.0 65.7 26.0 46.1 83.5 18.4 323.6 191.7 77.4 48.7 5.9
1979 121.2 82.0 50.4 8.4 10.7 18.4 14.2 1.5 1.6 1.5 12.5 2.0 39.2 24.6 2.4 11.5 0.71980 120.7 82.7 53.3 7.1 10.6 21.1 12.2 1.4 1.6 1.4 10.1 1.9 38.0 25.8 2.6 8.9 0.61981 120.1 83.9 56.2 5.5 8.9 23.2 11.5 1.8 1.7 1.7 8.1 1.6 36.2 25.9 3.1 6.7 0.51982 122.7 89.9 56.3 4.8 9.9 26.7 11.4 1.9 2.1 1.8 5.9 2.0 32.9 24.4 3.6 4.3 0.61983 129.6 96.7 59.8 4.9 9.5 22.6 17.0 2.2 2.0 1.7 7.3 2.6 32.9 22.8 3.8 5.5 0.71984 141.0 104.6 61.9 6.3 11.0 24.8 19.9 2.5 2.6 1.8 9.0 1.1 36.4 24.5 4.0 7.2 0.71985 149.9 112.4 65.0 7.9 11.1 23.5 24.3 2.9 2.6 2.0 8.3 2.2 37.5 26.0 4.3 6.4 0.81986 178.7 135.3 69.4 8.6 9.9 25.9 44.3 3.3 3.2 2.3 9.4 2.4 43.4 30.4 4.5 7.4 1.01987 167.5 119.0 75.8 10.1 13.7 26.4 19.9 3.6 2.5 2.5 11.8 1.3 48.5 33.0 5.0 9.7 0.91988 180.6 129.5 82.1 11.2 17.2 26.2 20.6 4.3 2.4 2.7 12.0 2.0 51.1 35.4 5.2 9.6 0.81989 181.1 131.5 80.6 12.2 17.0 29.2 17.2 4.5 2.5 2.8 11.5 3.6 49.5 34.1 5.6 9.1 0.81990 177.5 129.1 82.7 12.1 17.5 29.1 12.5 4.4 2.8 2.9 11.2 2.2 48.4 33.2 5.8 8.7 0.71991 173.6 125.1 85.1 11.3 16.8 25.7 11.4 4.6 2.5 3.0 10.6 2.6 48.6 32.6 7.3 7.8 0.81992 188.8 135.1 94.7 12.0 21.5 22.7 12.1 5.0 2.5 3.3 12.3 2.7 53.7 36.5 7.4 9.0 0.81993 186.4 130.0 90.6 12.2 18.8 21.5 13.6 6.4 3.0 3.5 13.7 3.1 56.4 37.1 7.7 10.8 0.91994 194.8 133.9 94.1 12.2 21.9 20.5 13.6 6.0 2.8 4.3 15.3 4.1 60.9 39.1 9.0 11.8 1.01995 205.9 141.2 98.2 12.9 21.4 23.0 15.3 6.1 3.2 4.7 16.5 4.7 64.8 42.6 8.3 12.9 0.91996 227.5 154.9 107.3 12.9 24.6 25.0 21.5 6.5 2.9 4.8 17.7 4.4 72.6 48.7 9.0 13.9 1.01997 243.6 165.5 110.5 12.9 26.8 27.6 29.2 7.3 2.9 4.2 18.9 3.2 78.1 52.9 9.1 15.0 1.01998 262.7 180.1 120.5 13.2 30.9 26.1 34.3 8.9 3.0 4.4 17.8 3.6 82.6 58.2 9.6 13.7 1.11999 285.5 194.2 126.2 12.6 34.5 27.0 44.9 10.5 3.1 4.2 19.3 3.1 91.3 64.9 10.4 14.8 1.32000 302.8 206.6 138.0 13.9 36.8 28.0 45.0 11.2 3.2 4.7 18.7 3.2 96.2 69.9 11.2 13.9 1.22001 268.4 186.6 136.8 13.5 36.5 24.4 23.6 8.2 3.0 4.7 14.4 3.3 81.8 60.0 11.3 9.5 1.02002 257.9 180.5 131.8 14.1 38.3 20.4 19.0 8.5 3.4 5.2 14.0 3.1 77.4 56.0 11.2 9.3 0.92003 264.7 187.9 137.0 14.1 37.5 19.1 22.2 7.1 2.8 5.3 17.4 2.4 76.9 52.0 11.4 12.5 0.92004 297.7 210.1 138.0 14.1 44.3 22.5 35.9 8.4 3.3 5.9 21.8 3.5 87.6 58.2 11.3 17.0 1.12005 331.8 233.2 139.9 14.9 53.2 26.1 50.4 8.4 3.4 5.9 26.4 3.0 98.6 64.5 11.3 21.7 1.1
Percentiles 96-99
Percentiles 99.0 - 99.5

Table 5
YearPretax Income
After-tax Income Wages
Proprietors' Income
Other Business Income
Interest and
DividendsCapital Gains Pensions
Cash Transfers
In-Kind Income
Imputed Taxes
Other Income
All Federal Taxes
Individual Income Taxes
Social Insurance
Taxes
Corporate Income Taxes
Excise Taxes
Taxes PaidSources of Pretax Income
Total Income and Total Federal Tax Liabilities for All Households, by Household Income Category, 1979 to 2005 (Billions of 2005 dollars)
1979 161.3 103.6 55.1 7.4 15.6 28.4 28.0 1.3 1.4 1.2 20.3 2.6 57.7 35.7 1.7 19.5 0.81980 160.9 106.1 59.8 6.2 15.0 31.0 26.3 1.4 1.5 1.1 16.1 2.5 54.8 37.0 1.8 15.3 0.71981 160.7 110.0 61.1 4.1 14.2 36.0 25.8 1.4 1.5 1.4 13.2 2.1 50.7 35.7 2.2 12.2 0.61982 162.7 117.9 67.0 4.0 15.1 35.6 25.6 1.5 1.5 1.4 8.4 2.7 44.8 34.3 2.8 7.1 0.61983 182.7 133.2 69.2 5.0 16.2 35.5 37.0 1.9 1.6 1.6 11.5 3.1 49.5 35.5 2.9 10.2 0.81984 200.1 145.1 74.8 5.2 16.5 38.5 40.8 2.3 2.5 1.5 13.8 4.3 55.0 38.7 3.2 12.3 0.81985 223.0 164.9 76.8 5.5 18.1 47.6 50.1 2.6 2.6 1.6 14.5 3.7 58.1 40.8 3.3 13.0 1.01986 279.7 207.6 74.0 6.8 21.5 52.3 98.9 2.7 2.4 1.9 17.6 1.5 72.1 51.3 3.3 16.2 1.31987 233.3 161.8 96.9 9.6 22.3 40.1 37.3 3.0 2.2 2.0 17.7 2.3 71.6 50.7 4.0 15.9 1.01988 282.5 201.0 118.9 12.0 31.6 44.8 42.1 4.9 2.1 2.3 19.6 4.2 81.5 58.5 4.4 17.6 1.11989 274.8 196.8 107.4 11.8 32.2 52.7 37.9 4.4 2.2 2.5 19.8 3.8 77.9 54.7 4.6 17.7 0.91990 267.9 192.8 113.3 15.2 33.4 47.5 26.5 5.2 2.0 2.4 17.8 4.6 75.1 53.9 4.8 15.6 0.81991 257.0 181.8 110.3 13.0 32.1 45.8 23.5 5.4 2.6 2.5 16.9 5.1 75.2 53.4 6.1 14.8 1.01992 279.4 196.2 124.0 14.8 38.4 40.0 26.1 6.2 2.3 2.6 19.9 5.1 83.2 59.1 6.0 17.1 1.01993 273.6 181.5 120.3 13.0 38.1 37.0 29.2 5.4 2.1 3.0 22.6 2.8 92.1 64.2 6.6 20.3 1.01994 282.3 184.6 117.9 13.7 43.4 38.3 27.1 5.5 2.3 3.6 25.7 4.9 97.7 65.5 8.6 22.4 1.11995 302.1 196.2 124.5 13.9 46.3 40.6 32.7 5.7 2.3 3.9 27.8 4.5 105.9 72.2 8.3 24.3 1.11996 343.2 222.2 138.6 12.4 53.9 43.2 47.0 6.7 2.4 3.9 30.1 5.2 121.1 84.8 8.9 26.3 1.11997 383.4 250.1 149.6 11.7 59.1 44.9 66.2 7.8 2.3 3.6 32.2 5.9 133.3 94.4 9.5 28.1 1.31998 421.2 279.6 155.9 11.9 66.2 48.7 84.4 8.4 2.8 3.7 32.7 6.5 141.5 101.9 9.7 28.5 1.31999 470.1 310.6 175.5 12.6 74.3 51.2 99.4 9.2 2.5 3.5 34.5 7.4 159.5 117.4 10.8 29.8 1.52000 509.0 337.8 193.3 12.7 77.6 56.1 111.5 9.4 2.6 3.9 35.0 6.9 171.2 128.3 11.5 30.0 1.42001 415.5 279.5 177.8 12.8 78.2 44.5 56.6 7.8 2.9 4.2 24.6 6.2 136.0 103.8 11.3 19.8 1.12002 381.2 257.8 168.1 12.6 77.2 36.3 44.0 6.6 2.6 4.3 23.4 6.1 123.4 92.6 11.0 18.7 1.12003 408.8 281.5 165.5 13.9 80.8 40.2 55.3 6.7 2.9 4.5 33.0 6.0 127.3 86.8 10.9 28.4 1.12004 481.6 331.7 178.9 14.4 94.4 42.5 87.4 7.5 2.8 4.7 41.6 7.2 149.9 100.3 11.4 36.9 1.32005 545.6 375.2 182.5 14.9 113.8 49.7 113.1 7.4 2.9 4.8 49.3 7.4 170.4 112.9 11.6 44.5 1.4
1979 98.5 58.5 21.6 2.2 8.8 20.2 27.5 0.4 0.3 0.3 16.3 1.0 40.1 23.3 0.2 16.2 0.41980 99.4 62.9 23.3 2.6 7.1 21.1 29.8 0.4 0.3 0.3 13.4 1.1 36.5 22.6 0.2 13.3 0.31981 98.7 65.9 23.2 0.9 8.1 22.5 31.1 0.4 0.4 0.3 10.8 0.9 32.8 21.5 0.3 10.7 0.31982 107.8 77.0 25.5 1.2 9.2 25.2 36.1 0.6 0.4 0.3 7.5 1.7 30.8 22.6 0.7 7.2 0.31983 121.1 85.6 26.3 1.4 11.1 23.3 46.1 0.7 0.4 0.4 9.9 1.5 35.6 24.8 0.7 9.6 0.41984 136.6 96.6 32.7 1.8 13.4 26.0 46.8 1.2 0.5 0.3 11.5 2.3 39.9 27.6 0.7 11.1 0.51985 153.3 109.0 31.8 2.5 16.0 28.3 57.6 0.7 0.6 0.4 11.6 3.8 44.2 31.6 0.8 11.3 0.51986 216.2 160.2 27.6 1.0 12.4 26.3 133.0 0.8 0.5 0.4 14.2 0.0 56.0 40.7 0.7 13.9 0.71987 157.1 105.8 44.1 2.6 20.1 31.4 40.7 1.2 0.6 0.4 14.8 1.2 51.3 35.4 0.9 14.4 0.61988 216.0 150.7 59.4 4.6 34.5 38.7 51.9 3.7 0.6 0.7 18.2 3.6 65.3 45.8 1.1 17.7 0.71989 194.4 137.4 53.9 5.0 32.0 38.9 41.5 2.5 0.5 0.7 15.9 3.5 57.0 40.0 1.1 15.4 0.51990 191.8 135.4 57.2 5.2 30.9 41.8 32.9 2.7 0.6 0.6 16.3 3.7 56.4 39.1 1.1 15.8 0.51991 164.7 113.6 51.0 4.6 27.1 36.5 25.5 1.9 0.6 0.6 13.7 3.3 51.0 35.7 1.5 13.3 0.51992 192.8 131.9 68.5 4.8 33.6 33.1 28.7 2.5 0.5 0.6 16.5 4.0 60.9 43.2 1.4 15.9 0.51993 190.7 120.5 61.5 4.2 34.0 30.7 33.9 1.9 0.5 0.6 19.9 3.5 70.2 48.6 1.5 19.4 0.61994 196.5 121.1 57.0 3.9 40.6 30.3 35.0 2.0 0.5 0.8 23.3 3.0 75.5 49.7 2.9 22.3 0.61995 218.2 133.8 64.9 3.8 41.6 33.5 41.5 2.1 0.6 0.9 25.7 3.6 84.4 56.4 3.1 24.4 0.61996 251.3 155.2 70.1 3.8 44.7 35.4 61.8 1.9 0.5 1.0 28.1 3.9 96.0 65.6 3.3 26.7 0.51997 304.4 193.1 85.2 4.2 52.1 37.4 85.9 2.6 0.5 1.0 30.8 4.8 111.3 77.6 3.8 29.1 0.71998 346.3 225.8 96.1 3.9 55.5 38.6 111.6 2.5 0.5 0.8 31.6 5.1 120.5 85.7 4.1 29.8 0.81999 388.0 253.3 114.0 4.2 58.8 40.2 128.2 2.9 0.5 0.9 32.6 5.7 134.6 98.6 4.8 30.4 0.82000 438.5 288.7 139.3 4.5 57.1 44.3 149.4 2.7 0.5 0.9 33.6 6.2 149.8 112.3 5.6 31.1 0.72001 329.9 216.9 111.1 5.0 60.2 41.2 78.1 2.4 0.6 1.0 24.8 5.5 112.9 84.9 4.8 22.7 0.62002 280.4 183.4 92.4 4.0 64.3 32.8 55.5 2.0 0.7 0.9 22.3 5.4 97.0 71.7 4.2 20.5 0.52003 314.8 210.7 94.9 4.4 69.8 34.3 69.4 2.0 0.7 1.2 32.2 5.9 104.2 68.8 4.3 30.4 0.62004 393.1 265.7 105.8 5.2 77.8 40.0 110.9 2.3 0.7 1.2 43.2 6.1 127.5 80.9 4.6 41.2 0.72005 467.4 317.4 108.5 5.2 90.4 47.6 151.6 2.5 0.8 1.2 53.3 6.3 150.0 93.0 4.8 51.3 0.8
Percentiles 99.9 - 99.99
Percentiles 99.5 - 99.9

Table 5
YearPretax Income
After-tax Income Wages
Proprietors' Income
Other Business Income
Interest and
DividendsCapital Gains Pensions
Cash Transfers
In-Kind Income
Imputed Taxes
Other Income
All Federal Taxes
Individual Income Taxes
Social Insurance
Taxes
Corporate Income Taxes
Excise Taxes
Taxes PaidSources of Pretax Income
Total Income and Total Federal Tax Liabilities for All Households, by Household Income Category, 1979 to 2005 (Billions of 2005 dollars)
1979 66.5 38.0 3.9 0.8 2.7 8.9 35.4 0.1 0.0 0.0 14.4 0.2 28.5 13.9 -0.1 14.5 0.21980 54.7 33.4 4.7 1.1 1.7 9.5 27.6 0.1 0.0 0.0 9.5 0.4 21.4 11.7 -0.1 9.6 0.21981 59.6 39.6 4.8 0.3 2.4 10.9 32.1 0.1 0.0 0.0 8.6 0.4 20.0 11.2 0.0 8.6 0.21982 69.1 49.7 5.0 0.5 4.0 11.2 41.5 0.1 0.1 0.0 6.3 0.4 19.4 12.9 0.1 6.3 0.21983 78.3 54.2 6.6 0.7 6.0 10.7 46.0 0.1 0.0 0.0 7.7 0.5 24.0 16.1 0.1 7.7 0.21984 96.8 66.0 7.6 0.7 9.2 11.3 57.2 0.1 0.1 0.0 10.2 0.4 30.8 20.2 0.1 10.2 0.31985 102.9 72.8 7.7 0.5 8.1 11.4 65.3 0.1 0.1 0.0 9.4 0.2 30.0 20.3 0.1 9.4 0.31986 157.4 116.7 8.0 0.0 7.6 10.6 120.9 0.2 0.1 0.0 10.5 -0.6 40.7 29.8 0.1 10.5 0.41987 100.5 66.5 13.9 0.9 14.3 19.1 40.2 0.2 0.1 0.1 11.5 0.4 34.0 22.1 0.1 11.5 0.31988 150.4 102.0 23.6 2.4 22.6 25.4 56.9 1.1 0.1 0.1 15.5 2.6 48.4 32.4 0.1 15.5 0.41989 136.5 93.8 17.9 1.6 22.4 28.8 48.3 0.5 0.1 0.1 14.5 2.4 42.7 27.9 0.1 14.4 0.31990 128.3 88.0 21.2 1.7 22.6 27.3 38.5 0.7 0.1 0.1 14.2 2.1 40.3 25.8 0.1 14.1 0.31991 105.4 71.0 17.3 1.5 19.3 24.9 28.6 0.3 0.1 0.1 11.6 1.8 34.5 22.3 0.2 11.7 0.31992 127.7 84.3 29.6 2.7 22.6 21.5 34.4 0.5 0.1 0.1 14.6 1.7 43.4 28.4 0.1 14.5 0.31993 127.1 77.7 23.0 1.5 22.1 19.3 41.6 0.3 0.1 0.1 18.1 1.3 49.4 30.8 0.2 18.1 0.31994 137.8 81.6 19.2 1.3 26.4 21.0 45.3 0.3 0.1 0.1 22.8 1.5 56.2 32.6 0.8 22.5 0.31995 153.3 90.6 24.3 1.1 26.2 25.0 50.0 0.3 0.1 0.1 24.4 1.8 62.6 37.4 0.9 24.0 0.31996 191.8 116.5 27.8 1.0 28.4 25.0 79.3 0.3 0.1 0.1 27.5 2.3 75.3 46.8 1.1 27.1 0.31997 225.5 144.1 33.8 0.9 28.7 25.4 104.3 0.5 0.1 0.1 29.3 2.4 81.4 51.0 1.2 28.7 0.51998 267.0 177.9 45.1 1.1 26.1 25.0 135.6 0.4 0.1 0.1 30.4 3.0 89.0 57.2 1.6 29.7 0.61999 300.1 201.8 57.4 1.8 25.5 26.5 154.2 0.5 0.0 0.1 30.9 3.3 98.4 65.9 2.0 30.0 0.52000 366.5 249.4 75.8 1.7 22.2 31.7 195.1 0.4 0.1 0.1 34.2 5.1 117.1 81.0 2.5 33.1 0.52001 263.7 174.8 58.2 2.5 28.7 30.3 112.2 0.5 0.1 0.1 27.6 3.5 88.9 59.8 2.0 26.7 0.42002 218.9 142.9 44.1 1.6 37.2 25.4 79.8 0.4 0.1 0.1 25.2 4.8 76.0 49.5 1.6 24.6 0.42003 245.2 162.7 41.5 1.1 36.8 28.9 94.9 0.4 0.1 0.1 36.7 4.7 82.5 44.5 1.5 36.1 0.42004 325.0 220.0 49.5 1.3 42.9 39.3 139.5 0.5 0.1 0.1 48.3 3.6 105.0 55.2 1.7 47.5 0.52005 411.9 282.0 54.4 2.0 60.7 47.2 183.0 0.7 0.1 0.1 58.1 5.7 129.9 70.1 1.9 57.3 0.6
1979 4,835.8 3,761.2 3,091.4 147.1 109.3 291.0 176.4 102.0 316.2 223.1 327.1 52.2 1,074.6 533.3 331.9 163.3 46.11980 4,771.9 3,712.9 3,054.3 121.5 97.7 339.7 161.0 104.8 337.5 208.5 294.6 52.4 1,059.0 558.4 329.1 132.2 39.31981 4,823.4 3,741.8 3,069.0 93.2 91.3 408.2 155.6 113.0 342.7 217.9 283.5 48.9 1,081.6 578.5 360.2 106.4 36.41982 4,830.3 3,829.7 3,050.7 79.3 93.3 433.4 164.1 126.0 365.6 236.5 245.3 36.2 1,000.7 533.5 364.1 65.8 37.31983 4,952.3 3,939.8 3,073.2 95.2 99.3 408.8 220.2 135.1 365.7 243.6 271.3 39.9 1,012.5 506.7 372.4 87.8 45.61984 5,254.4 4,153.5 3,262.7 104.8 108.4 439.0 239.3 159.3 353.2 248.5 305.7 33.6 1,101.0 535.4 408.1 106.0 51.51985 5,484.0 4,338.8 3,373.5 115.6 114.4 450.7 287.8 169.4 362.2 263.1 312.9 34.3 1,145.3 558.4 433.9 101.2 51.71986 5,956.0 4,712.1 3,501.9 141.8 118.7 437.1 548.4 189.0 374.4 285.2 335.3 24.1 1,243.9 619.1 459.8 112.2 52.91987 5,853.6 4,587.7 3,605.6 171.2 128.1 443.2 225.7 209.4 381.2 309.1 367.9 12.1 1,265.8 601.0 469.9 140.4 54.51988 6,225.2 4,867.9 3,758.6 198.4 168.1 474.7 244.5 243.6 388.1 325.2 392.3 31.6 1,357.3 647.5 505.8 148.4 55.51989 6,311.3 4,954.9 3,783.8 201.5 167.9 519.6 222.1 251.6 396.4 338.8 392.3 37.4 1,356.4 645.4 513.3 145.0 52.61990 6,308.9 4,951.1 3,821.0 204.1 166.0 507.0 162.9 261.0 405.1 354.3 391.3 36.3 1,357.8 638.9 528.5 136.6 53.71991 6,232.4 4,895.3 3,793.0 194.3 154.0 464.8 143.8 279.7 431.9 361.2 379.5 30.3 1,337.1 616.3 536.2 124.2 60.41992 6,422.3 5,040.5 3,899.6 206.5 188.7 393.6 161.2 294.7 446.4 395.2 400.6 35.8 1,381.8 637.3 542.6 138.9 63.01993 6,512.2 5,077.2 3,925.1 202.3 192.8 345.9 191.7 299.2 458.3 436.8 425.7 34.5 1,435.0 653.8 552.1 162.7 66.31994 6,720.2 5,222.3 4,030.1 206.9 217.9 337.8 185.3 315.3 464.4 472.5 451.5 38.4 1,497.8 671.8 575.8 177.5 72.71995 7,014.8 5,432.2 4,172.8 205.5 228.4 382.1 216.8 332.7 468.9 486.8 482.5 38.3 1,582.6 718.6 593.6 198.3 72.01996 7,347.0 5,676.4 4,310.5 210.4 253.3 396.7 312.0 355.8 465.8 493.1 502.3 47.1 1,670.6 782.7 608.8 211.3 67.81997 7,755.3 5,977.0 4,510.8 218.2 275.6 416.0 431.8 385.7 470.5 472.9 524.2 49.6 1,778.2 853.8 634.1 221.1 69.31998 8,241.5 6,381.6 4,787.6 232.6 298.1 417.7 533.6 429.5 471.9 480.6 532.7 57.3 1,859.9 904.3 670.4 212.5 72.81999 8,666.8 6,677.9 5,007.4 237.0 330.6 424.9 635.9 464.3 479.3 473.4 552.8 61.2 1,989.0 990.3 696.8 219.9 82.02000 9,092.0 7,000.5 5,237.1 232.2 325.8 457.3 714.8 488.0 502.9 497.0 564.9 71.9 2,091.5 1,073.2 720.9 220.0 77.32001 8,671.0 6,819.0 5,215.4 227.9 332.0 413.8 360.1 483.1 541.7 532.6 500.8 63.7 1,852.0 897.1 729.9 151.7 73.22002 8,450.9 6,703.9 5,122.4 223.9 335.2 335.0 259.1 490.7 573.3 563.7 480.7 67.0 1,747.0 816.7 720.7 136.7 72.82003 8,630.2 6,923.8 5,137.6 230.4 350.4 316.6 312.5 495.9 584.8 607.8 528.7 65.6 1,706.4 728.9 718.7 186.6 72.22004 9,205.1 7,355.2 5,293.1 241.8 411.2 336.7 489.5 517.5 572.0 693.3 589.3 60.6 1,849.9 802.2 734.7 240.0 73.02005 9,713.2 7,723.4 5,366.6 257.4 492.4 388.3 668.0 537.8 567.0 722.9 650.1 62.8 1,989.8 876.7 741.6 298.3 73.3
Top 0.01 Percentile
All Income Groups

Table 5
YearPretax Income
After-tax Income Wages
Proprietors' Income
Other Business Income
Interest and
DividendsCapital Gains Pensions
Cash Transfers
In-Kind Income
Imputed Taxes
Other Income
All Federal Taxes
Individual Income Taxes
Social Insurance
Taxes
Corporate Income Taxes
Excise Taxes
Taxes PaidSources of Pretax Income
Total Income and Total Federal Tax Liabilities for All Households, by Household Income Category, 1979 to 2005 (Billions of 2005 dollars)
Other business income includes partnership income, income from S corporations, and positive rental income.Interest and dividends includes taxable and nontaxable interest and dividends paid by C corporations.Capital gains are the profits from the sale of assets. Unrealized capital gains are not included.
Individual income taxes are distributed directly to households paying those taxes. Social insurance, or payroll, taxes are distributed to households paying those taxes directly or paying them indirectly through their employers. Corporate income taxes are distributed to households according to their share of capital income. Federal excise taxes are distributed to them according to their consumption of the taxed good or service.
Income categories are defined by ranking all people by their comprehensive household income adjusted for household size—that is, divided by the square root of the household’s size. (A household consists of the people who share a housing unit, regardless of their relationships.) Income groups contain equal numbers of people.
Source: Congressional Budget Office.
Notes: Pretax household income equals the sum of several components:
Cash transfers include payments from Social Security, unemployment insurance, Supplemental Security Income, Aid to Families with Dependent Children, Temporary Assistance For Needy Families, veterans' benefits, and workers' compensation.In-kind income includes employer-paid health insurance premiums, food stamps, school lunches and breakfasts, housing assistance, energy assistance, and the fungible value of Medicare and Medicaid, as estimated in the Current Population Survey.Imputed taxes are taxes paid by businesses (corporate income taxes and the employer's share of Social Security, Medicare, and federal unemployment insurance payroll taxes). It is assumed that income would have been higher in absence of those taxes.
Wages include cash wage and salary payments as well as employees' contributions to 401(k) retirement plans.
Pension income is income received in retirement for past services. It also includes taxable withdrawals from individual retirement accounts and deferred compensation plans.
Proprietors' income is net income from businesses and farms operated solely by their owners.

Table A-1Comparing Income Shares as Calculated by the Congressional Budget Office and the Bureau of Economic Analysis (Percent)
YearWages and
Salaries
Supplements to Wages and
SalariesProprietors'
income Rent Interest Dividends Transfers Other Total
1979 70.4 6.8 4.8 0.9 4.6 2.1 9.2 1.2 100.01980 69.8 6.4 4.0 0.9 5.7 2.1 9.8 1.2 100.01981 69.0 6.7 3.2 1.0 6.9 2.2 9.9 1.1 100.01982 68.2 7.0 2.9 1.0 7.3 2.3 10.5 0.8 100.01983 68.2 7.2 3.3 1.0 7.0 2.2 10.4 0.9 100.01984 68.7 7.2 3.3 0.9 7.3 2.2 9.7 0.7 100.01985 68.5 7.3 3.5 0.9 7.2 2.2 9.7 0.7 100.01986 68.6 7.4 4.0 0.9 6.4 2.4 9.9 0.5 100.01987 68.3 7.6 4.3 0.8 6.3 2.6 9.8 0.2 100.01988 67.3 7.7 4.8 0.8 6.3 3.2 9.4 0.6 100.01989 66.5 7.7 4.7 0.8 7.0 3.1 9.5 0.7 100.01990 66.5 7.8 4.7 0.8 6.8 2.9 9.8 0.6 100.01991 66.7 7.9 4.5 0.9 6.3 2.7 10.5 0.5 100.01992 66.9 8.2 4.8 0.9 4.9 3.0 10.7 0.6 100.01993 67.0 8.7 4.6 0.9 4.1 3.0 11.1 0.6 100.01994 66.7 8.9 4.5 0.9 3.8 3.4 11.1 0.6 100.01995 66.6 8.8 4.4 0.9 4.2 3.6 11.0 0.6 100.01996 66.6 8.6 4.5 0.9 4.1 3.8 10.7 0.7 100.01997 67.2 8.2 4.5 0.9 4.0 4.1 10.4 0.7 100.01998 67.8 8.0 4.6 0.9 3.9 4.0 10.0 0.8 100.01999 68.2 7.9 4.7 0.9 3.7 4.2 9.6 0.8 100.02000 68.3 7.9 4.4 0.9 3.8 4.2 9.6 0.9 100.02001 67.9 8.1 4.4 0.9 3.7 3.7 10.4 0.8 100.02002 67.7 8.5 4.4 0.9 2.9 3.6 11.1 0.9 100.02003 67.3 8.8 4.5 0.9 2.5 3.9 11.3 0.9 100.02004 66.5 9.1 4.6 0.9 2.3 4.7 11.2 0.8 100.02005 65.4 9.1 5.0 0.9 2.7 5.3 10.9 0.8 100.0
Change, 1979-2005 -5.0 2.2 0.2 0.0 -1.9 3.2 1.8 -0.4 0.0
1979 56.7 11.1 8.1 1.1 9.8 2.6 10.6 0 100.01980 55.7 11.1 7.0 1.2 11.1 2.6 11.3 0 100.01981 54.4 11.1 6.6 1.4 12.5 2.6 11.4 0 100.01982 53.4 11.1 5.9 1.3 13.8 2.6 11.9 0 100.01983 52.9 11.2 6.0 1.2 14.0 2.6 12.0 0 100.01984 52.3 11.3 6.9 1.1 14.6 2.6 11.3 0 100.01985 52.4 11.3 6.9 1.1 14.6 2.6 11.2 0 100.01986 52.5 11.3 6.8 0.8 14.6 2.6 11.2 0 100.01987 53.2 11.2 7.1 0.8 14.2 2.6 10.9 0 100.01988 53.1 11.1 7.4 0.9 13.9 2.8 10.8 0 100.01989 52.2 11.0 7.3 0.9 14.5 3.2 10.9 0 100.01990 52.1 11.0 7.2 1.0 14.3 3.2 11.3 0 100.01991 51.5 11.4 6.9 1.1 13.7 3.3 12.2 0 100.01992 51.2 11.5 7.4 1.3 12.4 3.2 12.9 0 100.01993 51.1 11.8 7.5 1.6 11.6 3.3 13.1 0 100.01994 50.9 11.8 7.5 1.9 11.3 3.7 13.0 0 100.01995 51.1 11.3 7.4 1.8 11.4 3.8 13.1 0 100.01996 51.2 10.8 7.7 1.9 11.2 4.2 13.1 0 100.01997 51.7 10.5 7.7 1.7 11.3 4.4 12.7 0 100.01998 52.0 10.4 7.8 1.7 11.6 4.3 12.2 0 100.01999 52.8 10.5 8.0 1.7 11.0 4.0 12.1 0 100.02000 52.9 10.4 8.0 1.6 11.1 4.1 11.9 0 100.02001 52.3 10.6 8.2 1.8 10.7 3.9 12.6 0 100.02002 51.7 11.5 8.0 1.6 9.7 4.1 13.4 0 100.02003 51.4 12.0 8.2 1.3 9.2 4.3 13.6 0 100.02004 51.1 12.1 8.6 1.1 8.5 5.1 13.5 0 100.02005 50.9 12.2 8.6 0.4 9.2 5.2 13.6 0 100.0
Change, 1979-2005 -5.8 1.1 0.5 -0.7 -0.6 2.6 3.0 0 0
Source: Congressional Budget Office.
Adjusted Household Income as Measured by the Congressional Budget Office
Personal Income as Measured by the National Income and Product Accounts
