effective use of insulin in diabetes: update for 2007 thomas m. flood, md director georgia center...
TRANSCRIPT

Effective Use of Insulin in Diabetes: Update for 2007
Thomas M. Flood, MDDirector
Georgia Center for DiabetesAtlanta, Georgia

Key Question
1. Completely comfortable
2. Somewhat comfortable
3. Slightly comfortable
4. Not comfortable at all
Use your keypad to vote now!
?How comfortable are you with initiating insulin therapy in your patient population?

Faculty Disclosure
Dr Flood has no relevant financial relationships with any commercial interests to disclose.
Learning Objectives
State current management goals for diabetes Identify barriers to optimal use of insulin,
and how to overcome them Discuss the roles of short-, intermediate-,
and long-acting insulins in the management of diabetes
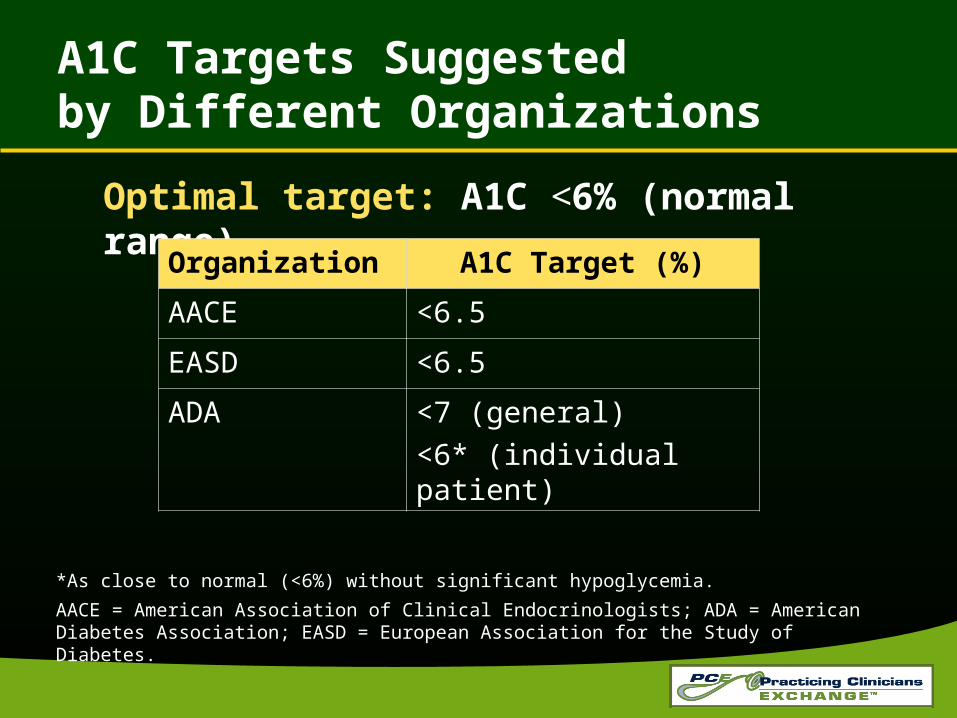
A1C Targets Suggested by Different Organizations
Optimal target: A1C <6% (normal range)
*As close to normal (<6%) without significant hypoglycemia.
AACE = American Association of Clinical Endocrinologists; ADA = American Diabetes Association; EASD = European Association for the Study of Diabetes.
Organization A1C Target (%)
AACE <6.5
EASD <6.5
ADA <7 (general)
<6* (individual patient)

Key Question
What percentage of patients with diabetes achieve the AACE goal of A1C <6.5%?
1. 25%
2. 35%
3. 55%
4. 75%
Use your keypad to vote now!
?
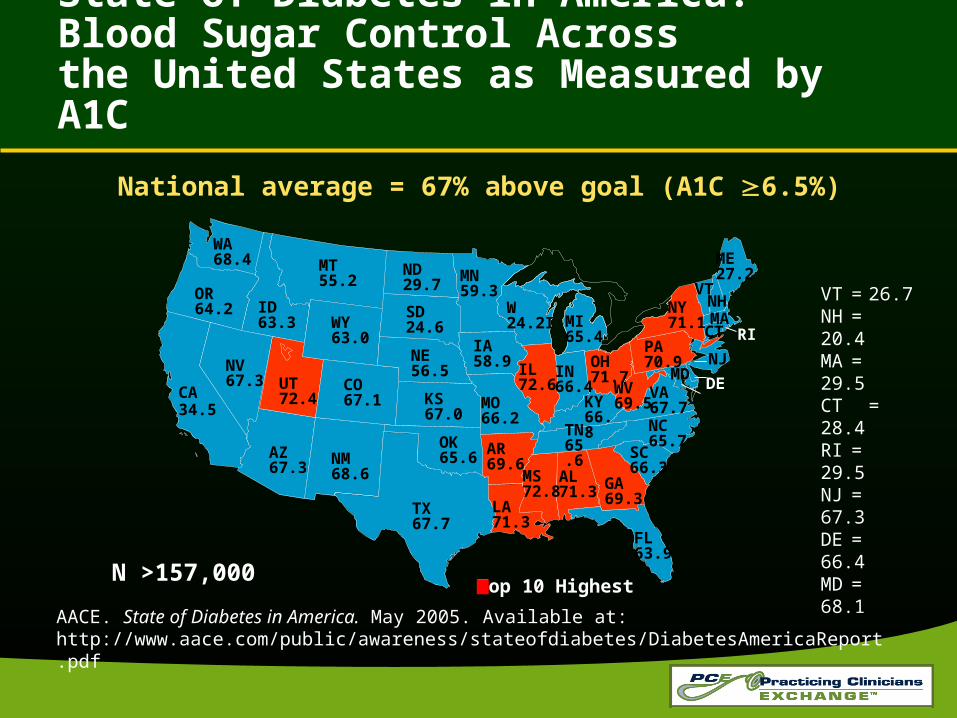
VT = 26.7NH = 20.4MA = 29.5CT = 28.4RI = 29.5NJ = 67.3DE = 66.4MD= 68.1
WA 68.4 MT
55.2OR64.2 ID
63.3 WY63.0
ND29.7
SD24.6
NE56.5
CO67.1
UT72.4
NV67.3
CA34.5
AZ67.3
NM68.6
TX67.7
OK65.6
KS67.0
MN59.3
IA58.9
MO66.2
AR69.6
LA71.3
MS72.8
AL71.3 GA
69.3
FL63.9
SC66.3
NC65.7
VA67.7
WV69.5KY
66.8TN65.6
IL72.6
W24.2I MI
65.4
IN66.4
OH71.7
PA70.9
NY71.1
VTNH
ME27.2
MARI
NJ
DEMD
CT
Top 10 Highest
AACE. State of Diabetes in America. May 2005. Available at: http://www.aace.com/public/awareness/stateofdiabetes/DiabetesAmericaReport.pdf
National average = 67% above goal (A1C 6.5%)
N >157,000
State of Diabetes in America: Blood Sugar Control Across the United States as Measured by A1C

Diabetes Demographics in the United States
Physician-Diagnosed Diabetes (%)
Undiagnosed Diabetes (%)
1998-1994 2001-2004 1998-1994 2001-2004
Male 5.4 7.6 3.5 4.3
Female 5.4 7.1 2.6 1.8
White 5.0 6.2 2.6 2.8
Black 8.6 11.4 4.2 3.1
Mexican 9.7 11.8 4.7 3.3
Total 5.4 7.3 3.0 3.0
Population Aged ≥20 Years
Adapted from: National Center for Health Statistics. Health, United States, 2006. With Chartbook on Trends in the Health of Americans. Hyattsville, Md: 2006.
Ad
just
ed I
nci
den
ce p
er 1
000
Per
son
-Yea
rs (
%)
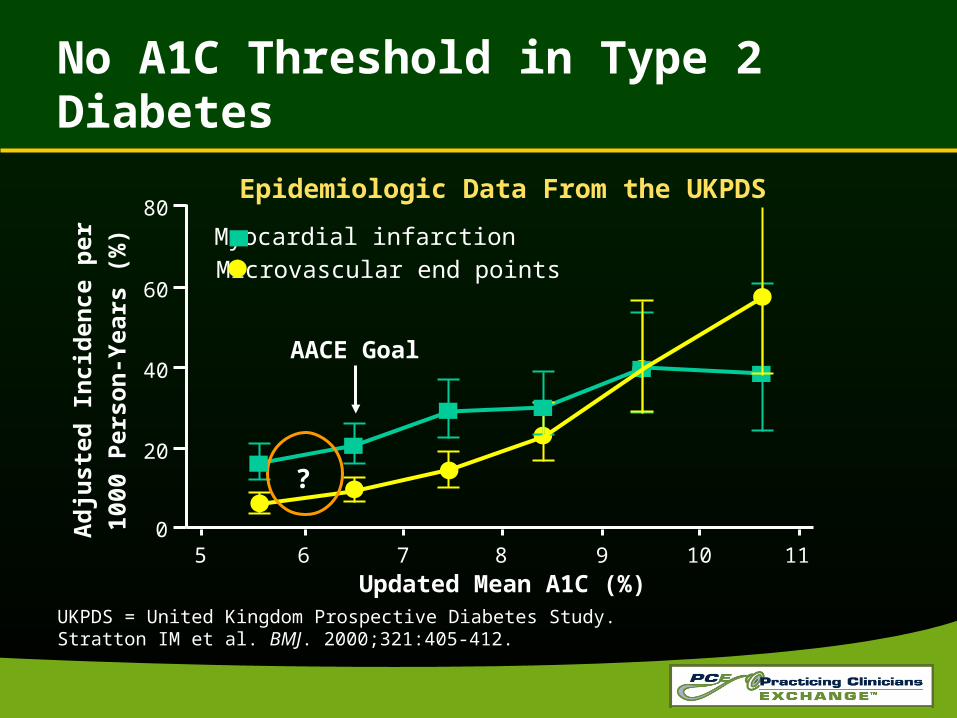
UKPDS = United Kingdom Prospective Diabetes Study.Stratton IM et al. BMJ. 2000;321:405-412.
Epidemiologic Data From the UKPDS
Updated Mean A1C (%)
Myocardial infarctionMicrovascular end points
40
60
80
20
05 6 7 8 9 10 11
?
AACE Goal
No A1C Threshold in Type 2 Diabetes

*Achieved all 3 indicated goals.BP = blood pressure; NHANES = National Health and Nutrition Examination Survey; TC = total cholesterol. Saydah SH et al. JAMA. 2004;291:335-342.
Pat
ien
ts (
%)
A1C <7%
44.3%
NHANES III, n = 1204
0
10
20
30
40
50
BP <130/80 mm Hg
TC <200 mg/dL
29.0%
Good control*
7.3%5.2%
33.9%35.8%
37.0%P <.001
48.2%
Risk Factor Control in Adults With Diabetes: NHANES III (1988-1994)/NHANES 1999-2000
NHANES 1999-2000, n = 370
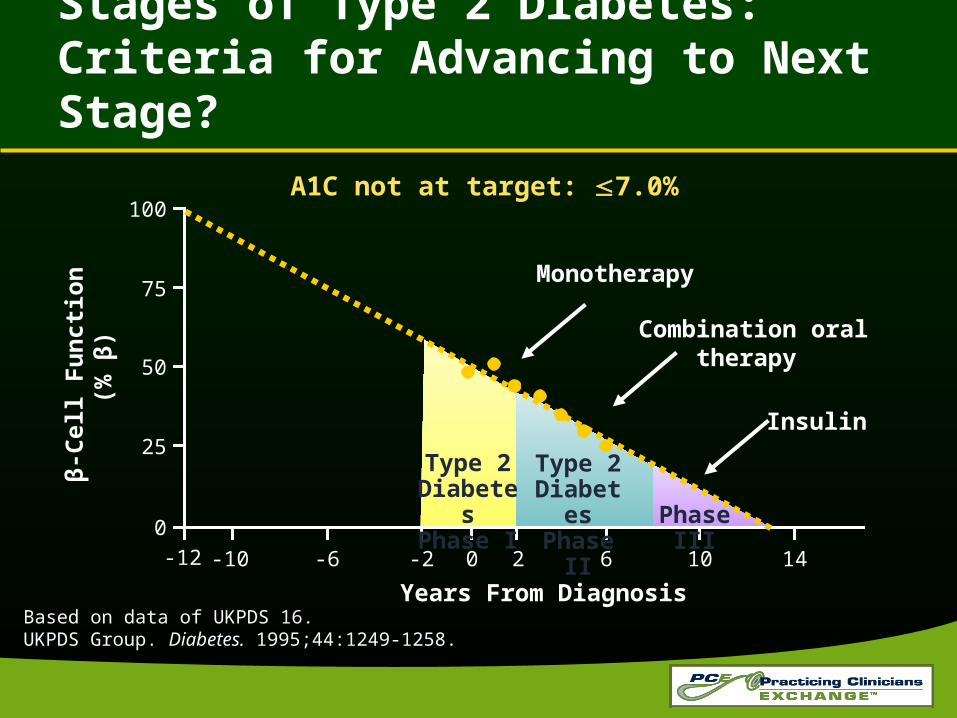
Stages of Type 2 Diabetes: Criteria for Advancing to Next Stage?
100
75
50
25
0
-10 -6 -2 20 6 10 14-12
Years From Diagnosis
β-C
ell
Fu
nct
ion
(%
β)
Type 2DiabetesPhase I
Monotherapy
Type 2DiabetesPhase II
Combination oral therapy
Phase III
Insulin
A1C not at target: 7.0%
Based on data of UKPDS 16. UKPDS Group. Diabetes. 1995;44:1249-1258.

Adapted from Williams G. Lancet. 1994;343:95-100.
Stepwise Management of Type 2 Diabetes
+ +
Diet andexercise
+ Oral monotherapy
+ Oral combination
+ Oral combo + insulin
+ Insulin
+
Biggest Clinical Hurdle?

Key Question
What is the approximate amount that A1C can be lowered through use of oral agents?
1. 1%
2. 2%
3. 3%
4. 4%
Use your keypad to vote now!
?
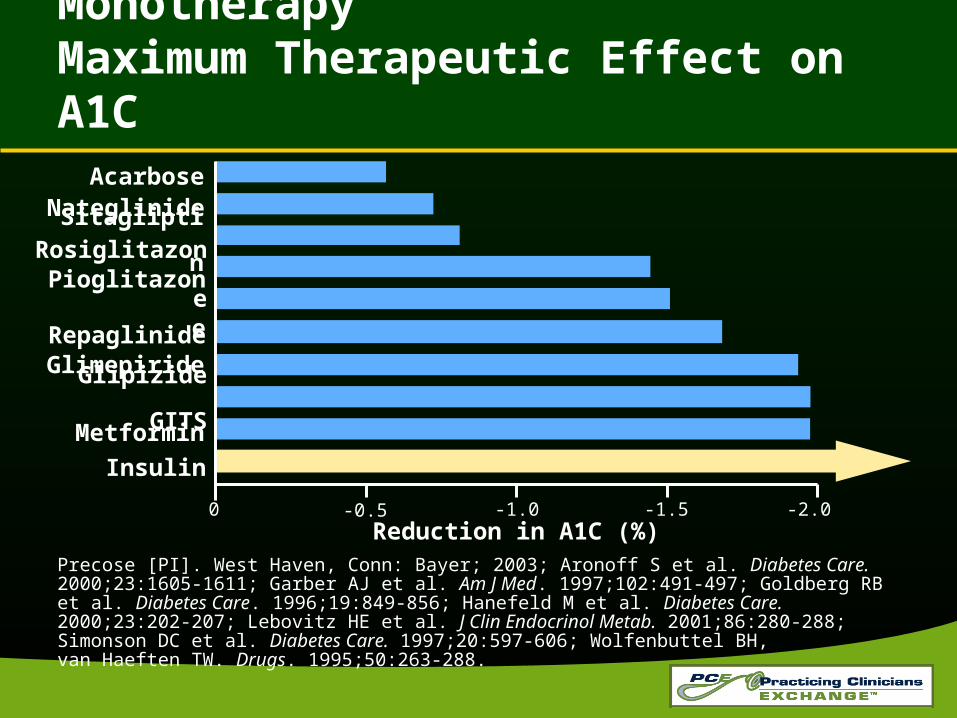
Oral Antihyperglycemic MonotherapyMaximum Therapeutic Effect on A1C
Precose [PI]. West Haven, Conn: Bayer; 2003; Aronoff S et al. Diabetes Care. 2000;23:1605-1611; Garber AJ et al. Am J Med. 1997;102:491-497; Goldberg RB et al. Diabetes Care. 1996;19:849-856; Hanefeld M et al. Diabetes Care. 2000;23:202-207; Lebovitz HE et al. J Clin Endocrinol Metab. 2001;86:280-288; Simonson DC et al. Diabetes Care. 1997;20:597-606; Wolfenbuttel BH, van Haeften TW. Drugs. 1995;50:263-288.
Acarbose
Insulin
-0.50 -1.0 -1.5 -2.0
Nateglinide
Reduction in A1C (%)
Glipizide GITSGlimepirideRepaglinidePioglitazone
Metformin
Rosiglitazone
Sitagliptin
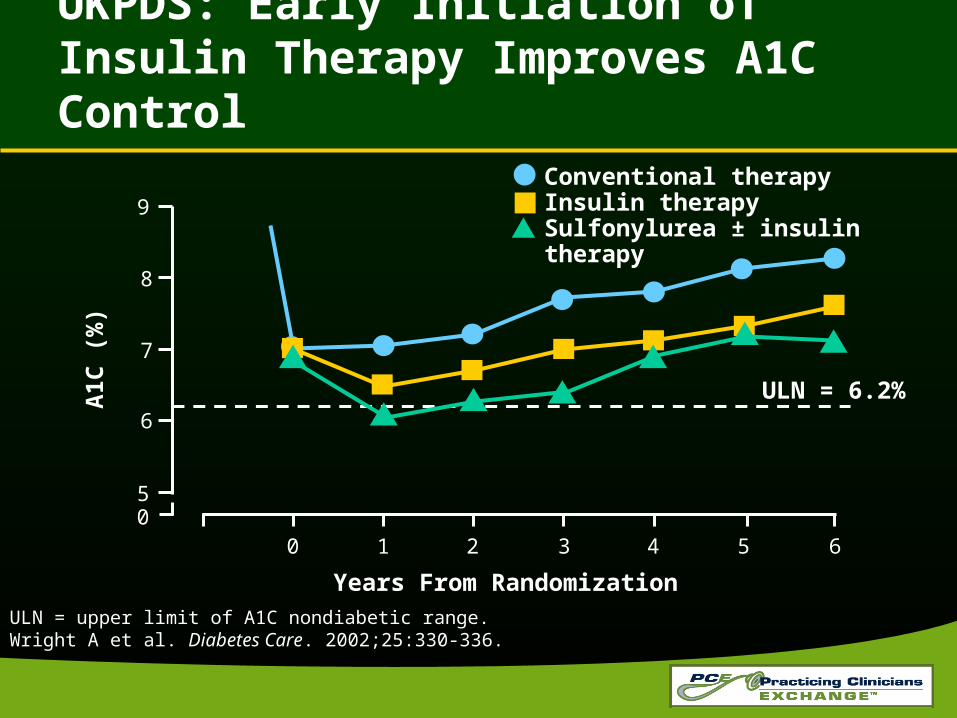
UKPDS: Early Initiation of Insulin Therapy Improves A1C Control
ULN = upper limit of A1C nondiabetic range.Wright A et al. Diabetes Care. 2002;25:330-336.
Conventional therapyInsulin therapySulfonylurea ± insulin therapy
9
8
7
6
50
A1C
(%
)
ULN = 6.2%
41 2 3 650
Years From Randomization
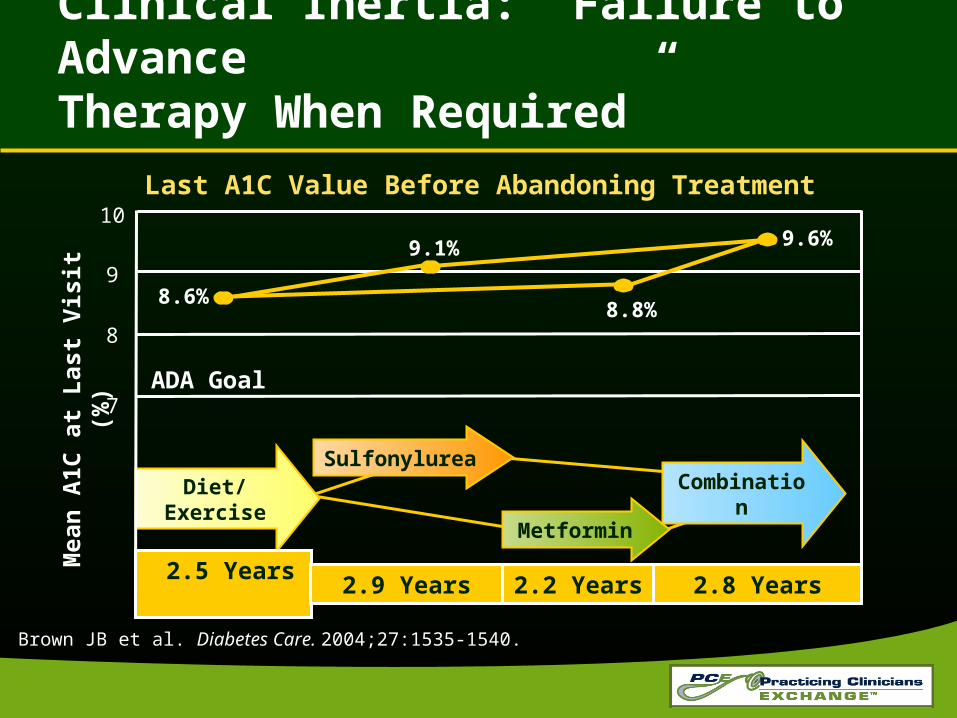
Clinical Inertia: “Failure to Advance Therapy When Required”
Brown JB et al. Diabetes Care. 2004;27:1535-1540.
Diet/Exercise
2.5 Years
Mea
n A
1C a
t L
ast
Vis
it (
%)
8
9
10
7
8.6%
Last A1C Value Before Abandoning Treatment
2.9 Years
Sulfonylurea
2.2 Years
Metformin
2.8 Years
Combination
9.1%
8.8%
9.6%
ADA Goal

Key Question
What are the barriers for your patients with type 2 diabetes regarding initiation of insulin therapy?1. Concern that insulin use is “forever”2. Fear of injection3. Equating insulin use with worsening diabetes
and complications4. Fear of weight gain
Use your keypad to vote now!
?
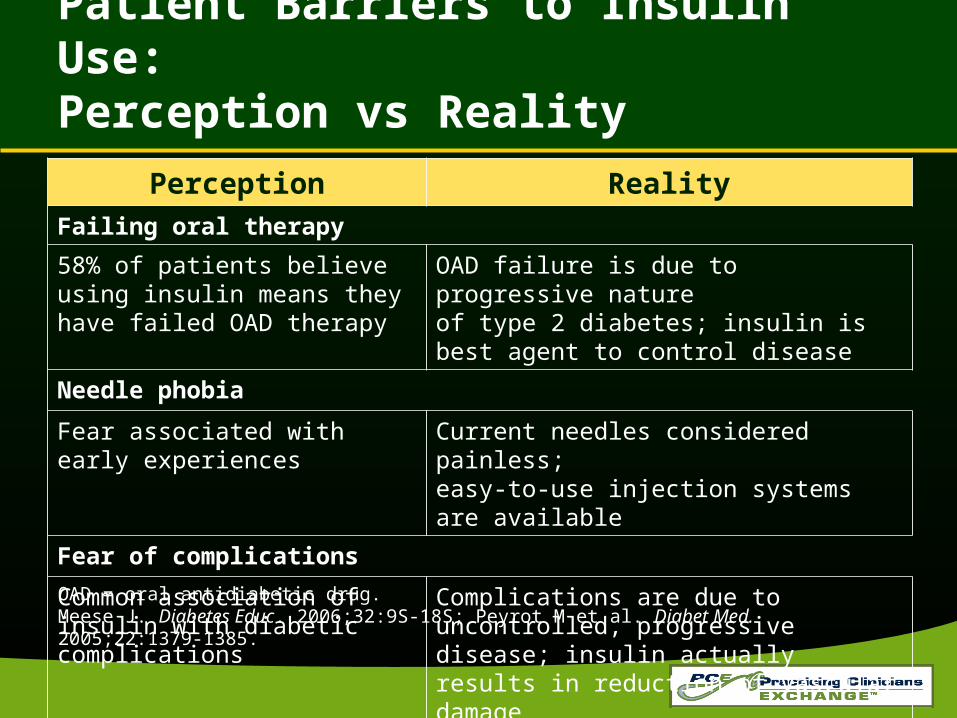
Perception Reality
Failing oral therapy
58% of patients believe using insulin means they have failed OAD therapy
OAD failure is due to progressive nature of type 2 diabetes; insulin is best agent to control disease
Needle phobia
Fear associated with early experiences
Current needles considered painless; easy-to-use injection systems are available
Fear of complications
Common association of insulin with diabetic complications
Complications are due to uncontrolled, progressive disease; insulin actually results in reduction of vascular damage
Patient Barriers to Insulin Use: Perception vs Reality
OAD = oral antidiabetic drug. Meese J. Diabetes Educ. 2006;32:9S-18S; Peyrot M et al. Diabet Med. 2005;22:1379-1385.
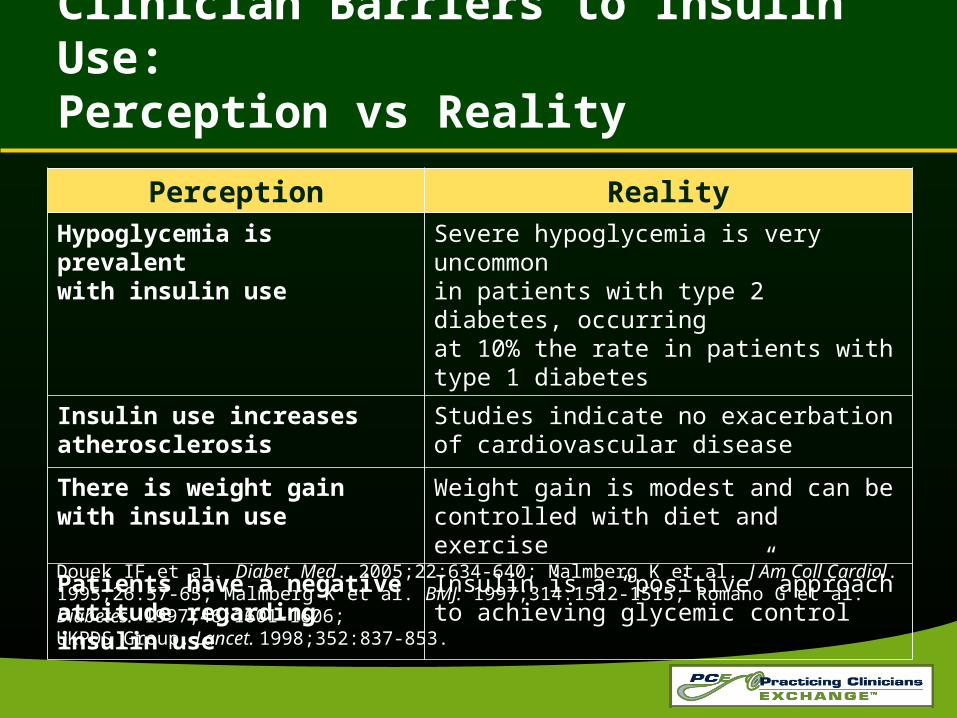
Perception RealityHypoglycemia is prevalent with insulin use
Severe hypoglycemia is very uncommon in patients with type 2 diabetes, occurring at 10% the rate in patients with type 1 diabetes
Insulin use increases atherosclerosis
Studies indicate no exacerbation of cardiovascular disease
There is weight gain with insulin use
Weight gain is modest and can be controlled with diet and exercise
Patients have a negative attitude regarding insulin use
Insulin is a “positive” approach to achieving glycemic control
Clinician Barriers to Insulin Use: Perception vs Reality
Douek IF et al. Diabet Med. 2005;22:634-640; Malmberg K et al. J Am Coll Cardiol. 1995;26:57-65; Malmberg K et al. BMJ. 1997;314:1512-1515; Romano G et al. Diabetes. 1997;46:1601-1606; UKPDS Group. Lancet. 1998;352:837-853.
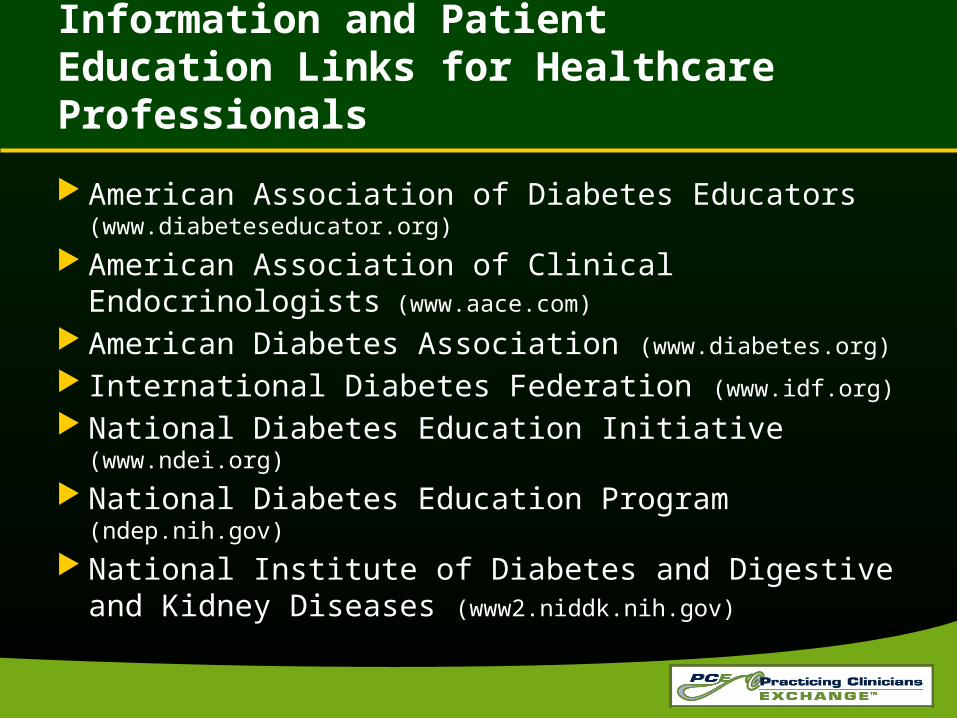
American Association of Diabetes Educators (www.diabeteseducator.org)
American Association of Clinical Endocrinologists (www.aace.com)
American Diabetes Association (www.diabetes.org)
International Diabetes Federation (www.idf.org)
National Diabetes Education Initiative (www.ndei.org)
National Diabetes Education Program (ndep.nih.gov)
National Institute of Diabetes and Digestive and Kidney Diseases (www2.niddk.nih.gov)
Information and Patient Education Links for Healthcare Professionals
Next Steps…
What do we do for the patient who has failed on 1 or 2 oral agents?
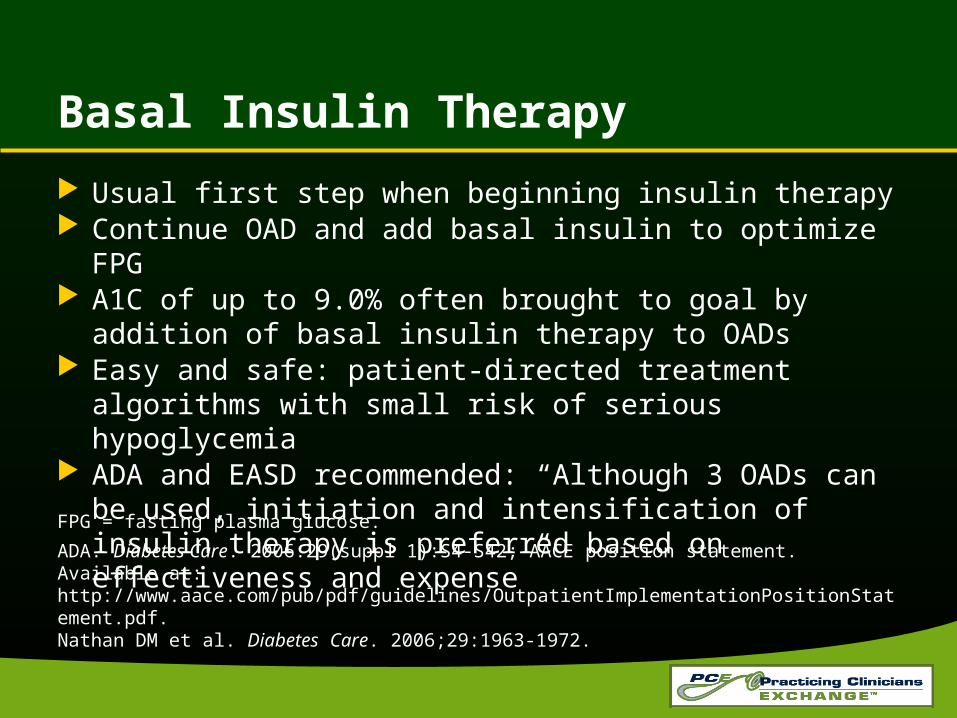
Basal Insulin Therapy
Usual first step when beginning insulin therapy Continue OAD and add basal insulin to optimize FPG A1C of up to 9.0% often brought to goal by addition of basal
insulin therapy to OADs Easy and safe: patient-directed treatment algorithms with
small risk of serious hypoglycemia ADA and EASD recommended: “Although 3 OADs can be
used, initiation and intensification of insulin therapy is preferred based on effectiveness and expense”
FPG = fasting plasma glucose.
ADA. Diabetes Care. 2006:29(suppl 1):S4-S42; AACE position statement. Available at: http://www.aace.com/pub/pdf/guidelines/OutpatientImplementationPositionStatement.pdf. Nathan DM et al. Diabetes Care. 2006;29:1963-1972.

B = breakfast; D = dinner; L = lunch; T2DM = type 2 diabetes mellitus.Polonsky KS et al. N Engl J Med. 1988;318:1231-1239.
100
200
300
400Glucose Insulin
6:00 10:00 18:0014:00 2:0022:00 6:00
Time
6:00 10:00 18:0014:00 2:0022:00 6:00
Time
20
40
60
80
100
120
B L DB L D
Normal T2DM
mg
/dL
μU
/mL
Basal insulin
Rationale for Basal Insulin Therapy:Insulin and Glucose Patterns

Options for Initiating Insulin Therapy
Basal insulinNPH insulin (at bedtime) Insulin detemir (once or twice daily) Insulin glargine (once daily)
Premixed insulin preparations70/30 NPH insulin/regular insulin50/50 NPL insulin/insulin lispro 70/30 NPA insulin/insulin aspart75/25 NPL insulin/insulin lispro
NPA = neutral protamine aspart; NPL = neutral protamine lispro.
Analog premixes

Plank J et al. Diabetes Care. 2005;28:1107-1112; Rave K et al. Diabetes Care. 2005;28:1077-1082; Rosenstock J, Goldstein BJ, et al, eds. Textbook of Type 2 Diabetes. London, UK, and New York, NY: Martin Dunitz; 2003:131-154.
Idealized Profiles of Human Insulinand Basal Insulin Analogs
0:00 2:00 4:00 6:00 8:00 10:00 12:00 14:00 16:00 18:00 20:00 22:00 24:00
Pla
sma
Insu
lin
Lev
els
Time
NPH
GlargineDetemir

Adapted with permission from Leahy J. In: Leahy J, Cefalu W, eds. Insulin Therapy. New York: Marcel Dekker; 2002:87; Nathan DM. N Engl J Med. 2002;347:1342-1349.
Twice-Daily Split-Mixed Regimens or Lispro Mix (75/25)–Aspart Mix (70/30)
4:00 16:00 20:00 24:00 4:00
Breakfast Lunch Dinner
Insu
lin
Act
ion
8:0012:008:00Time
Glucose levelsInsulin levels

Open-Label, Twice-Daily Exenatide vs Once-Daily Insulin Glargine: Self-Monitoring Blood Glucose Profiles (n = 549)
Blo
od
Glu
cose
(m
g/d
L)
3 AM
100
120
140
160
180
200
220
240
Baseline (week 0)Endpoint (week 26)
100
120
140
160
180
200
220
240
Baseline (week 0)Endpoint (week 26)
Exenatide5 μg bid 1st 4 weeks, then 10 μg bid
Insulin Glargine10 U/d, titrated to target FPG <100 mg/dL
Prebreakfast Prelunch Predinner
Both medications lowered A1C from 8.2% to 7.1% from baselineWeight change: exenatide –2.3 kg, glargine +1.8 kg
Nausea: exenatide 57.1%, glargine 8.6%
Heine RJ et al. Ann Intern Med. 2005;143:559-569.
3 AMPrebreakfast Prelunch Predinner

HS = at bedtime.Adapted with permission from Karl DM. Curr Diab Rep. 2004;4:352-357.
Steps in Transition From Basal to Basal-Bolus Insulin Therapy in T2DM
Above target:A1C >7.0%FPG >110 mg/dL
A1C <7.0%, FPG <110 mg/dL
Glargine, Detemir,
or NPH HS
• Weekly titration based on FPG
• All oral agents continued
STEP 1
Abovetarget
Add insulin
Main meal
STEP 2
Abovetarget
Add insulin
Next largestmeal
STEP 3
Abovetarget
Add insulin
Last meal
STEP 4

Case Study

Case Study: Initiating Insulin Therapy 60-year-old man: 10-year history of T2DM and hypertension Current T2DM medications: metformin 1000 mg bid, rosiglitazone
8 mg AM, and glimepiride 8 mg qd Hypertension medications: 40 mg lisinopril, 10 mg amlodipine,
12.5 mg HCTZ Dyslipidemia medication: 10 mg atorvastatin Physical exam: weight = 245 lb (10-lb increase); height = 6’0”;
BMI = 34.2 kg/m2; waist circumference = 44 in; BP = 130/80 mm Hg Laboratory: TC = 167 mg/dL; TG = 206 mg/dL; HDL = 35 mg/dL;
LDL = 90 mg/dL A1C = 8.9%; plasma glucose in the office = 198 mg/dL Creatinine 1.1 mg/dL, normal LFTs
HCTZ = hydrochlorothiazide; TG = triglycerides; HDL = high-density lipoprotein; LFTs = liver function tests; BMI = body mass index.

Case Study (cont’d)
Patient agrees to basal insulin therapy, however: Expresses feelings of failure at inability to control
glycemia with OADs Displays anxiety about injections
You explain the progressive nature of diabetes: Convey that insulin injections are the best way
to achieve glycemic control Describe injection options (“painless” needles,
injector pens, etc) Indicate that you and the patient will be a “team”
in getting to the A1C goal
Decision Point
Which insulin would you use?
1. NPH at bedtime
2. Glargine once daily
3. Twice-daily premixed
4. Detemir at bedtime
Use your keypad to vote now!
?
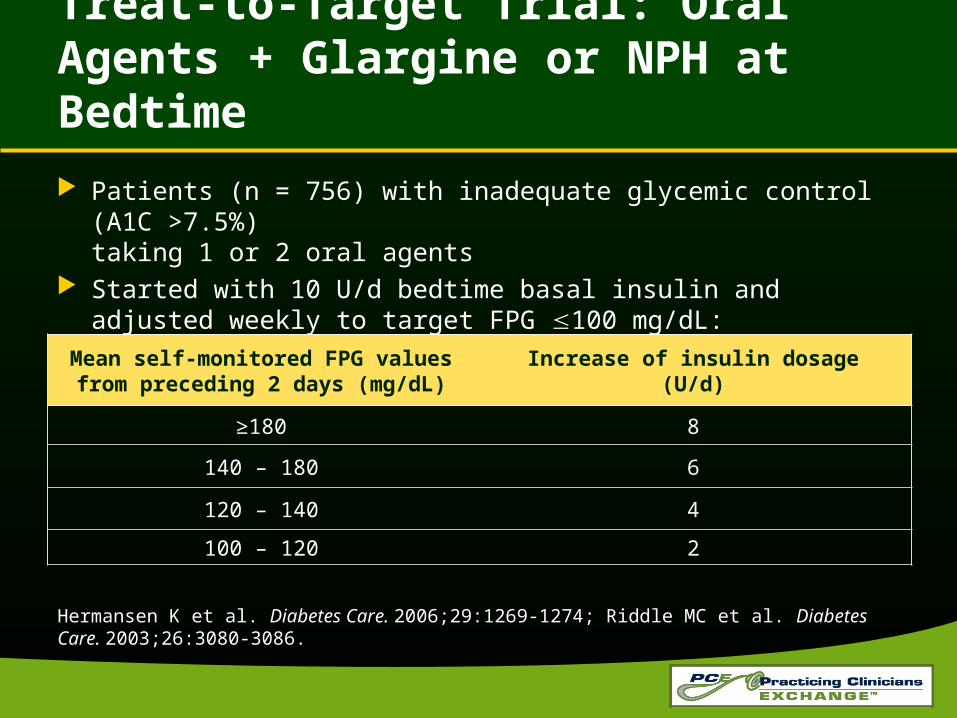
Treat-to-Target Trial: Oral Agents + Glargine or NPH at Bedtime
Patients (n = 756) with inadequate glycemic control (A1C >7.5%) taking 1 or 2 oral agents
Started with 10 U/d bedtime basal insulin and adjusted weekly to target FPG 100 mg/dL:
Hermansen K et al. Diabetes Care. 2006;29:1269-1274; Riddle MC et al. Diabetes Care. 2003;26:3080-3086.
Mean self-monitored FPG values from preceding 2 days (mg/dL)
Increase of insulin dosage(U/d)
≥180 8
140 – 180 6
120 – 140 4
100 – 120 2
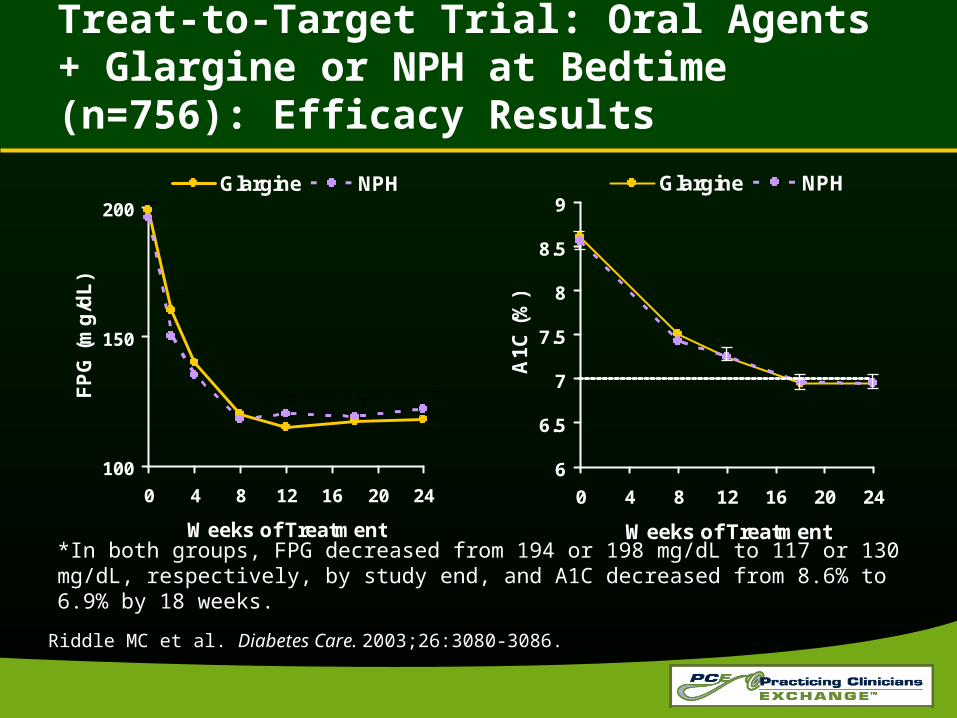
Treat-to-Target Trial: Oral Agents + Glargine or NPH at Bedtime (n=756): Efficacy Results
*In both groups, FPG decreased from 194 or 198 mg/dL to 117 or 130 mg/dL, respectively, by study end, and A1C decreased from 8.6% to 6.9% by 18 weeks.
Riddle MC et al. Diabetes Care. 2003;26:3080-3086.
100
150
200
0 4 8 12 16 20 24
Weeks of Treatment
FP
G (
mg
/dL
)
Glargine NPH
6
6.5
7
7.5
8
8.5
9
0 4 8 12 16 20 24
Weeks of TreatmentA
1C
(%
)
Glargine NPH

Insulin glargine
NPH insulin
0
50
100
150
200
250
300
350
20:00 22:00 24:00 2:00 4:00 6:00 8:00 10:00 12:00 14:00 16:00 18:00
Time
B L D
Basal insulin
20:00
Hypoglycemia by Time of Day
Hyp
og
lyce
mia
Ep
iso
des
(P
G
72 m
g/d
L)
Riddle MC et al. Diabetes Care. 2003;26:3080-3086.
*P <.05 (between treatment).
*
**
**
**
Treat-to-Target Trial: Timing and Frequency of Hypoglycemia
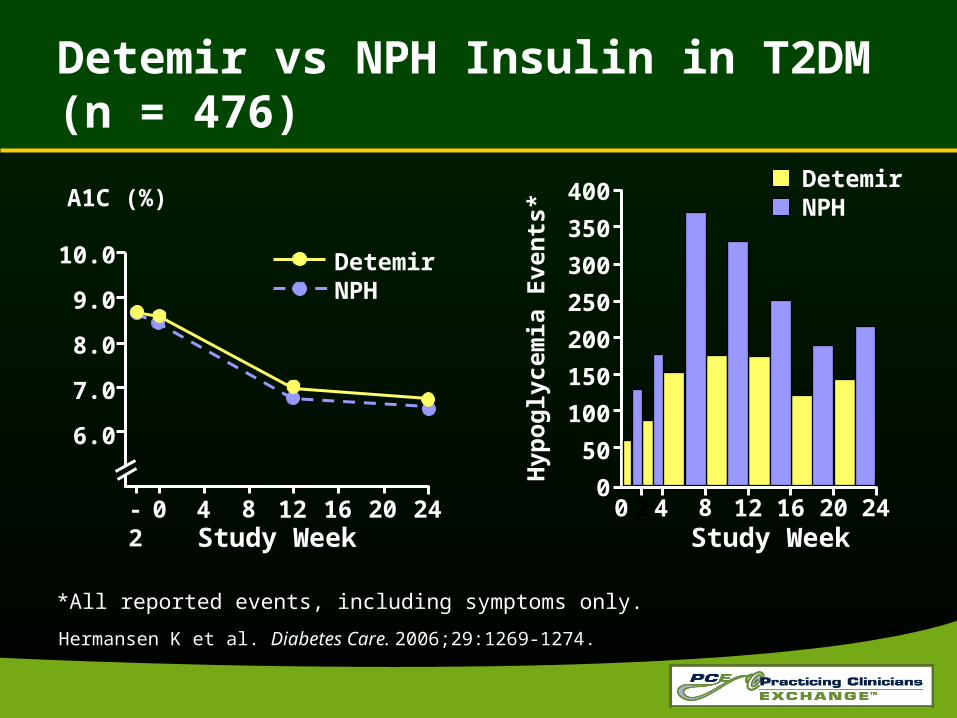
Detemir vs NPH Insulin in T2DM (n = 476)
*All reported events, including symptoms only.
Hermansen K et al. Diabetes Care. 2006;29:1269-1274.
Hyp
og
lyce
mia
Eve
nts
*
10.0
9.0
8.0
7.0
6.0
-2 0 4 8 12 16 20 24
DetemirNPH
A1C (%)
Study Week20 4 8 12 16 20 24
Study Week
400
350
300
250
200
150
100
50
0
DetemirNPH

Case Study (cont’d)
10 U glargine is added to OADs Patient is sent home with the “2, 4, 6, 8 algorithm” with a target
FPG goal of 100 to 110 mg/dL.1 Similar algorithm can be used with detemir2
FPG (mg/dL) Insulin Dose (U/d) 120-140 2 140-160 4 160-180 6 >180 8
Alternative strategy: increase basal insulin dose by 2 units every 3 days until FPG 100 mg/dL*3
*Certain populations (children, pregnant women, and the elderly) require special considerations.
1. Riddle MC et al. Diabetes Care. 2003;26:3080-3086.2. Hermansen K et al. Diabetes Care. 2006;29:1259-1271.3. Davies M et al. Diabetes. 2004;53(suppl 2):1980.
Case Study (cont’d)
Patient is seen 1 month laterFPG still above 200 mg/dL, using up to
30 U dailyPatient is frustrated and feels the insulin
does not work
Decision Point
What do you do now?
1. Keep increasing the insulin dose
2. Go to twice-daily premixed
3. Switch to exenatide
4. Send patient for gastric bypass consult
Use your keypad to vote now!
?

42
10
21
28
3337
45
0
10
20
30
40
50
0 1 2 3 4 5 6 7 8 10 12 15 18 21
Units
Weeks in Study
To
tal
Dai
ly D
ose
(U
)
N = 756.
Riddle MC et al. Diabetes Care. 2003;26:3080-3086.
Treat-to-Target Trial

Case Study (cont’d)
Patient is taking 75 U with FPG controlled (<100 mg/dL to rarely >110 mg/dL) since last visit 4 months ago
Patient’s last A1C = 6.9%, monitoring occasional postprandial blood sugars
Patient finds insulin injections painless and after speaking with you, feels that he is now a partner in his therapy program

Over the next 3 years, patient seen for routine follow-up every 3 to 4 months
Remains medically stable, with A1C values 6.5% to 7.2%
3.25 years after adding basal insulin glargine, A1C has increased to 8.2%, however, FPG checks remain <120 mg/dL
Case Study (cont’d)

Decision Point
What do you do now?
1. Increase glargine
2. Switch to twice-daily premixed
3. Switch to 4-shot basal-bolus program
4. Increase monitoring to AC and HS, and have patient report after 2 weeks
Use your keypad to vote now!
?
AC = before meals; HS = at bedtime.
Because the patient’s FPGs are good and post-prandial glucose levels are high, the decision is made to switch to twice-daily premixed insulin
The patient is encouraged to increase daily monitoring to adjust insulin dose
Case Study (cont’d)

PPG = postprandial glucose.Reprinted with permission from Monnier L et al. Diabetes Care. 2003;26:881-885.
Co
ntr
ibu
tio
n (
%)
A1C Quintile
At Lower A1C Levels, PPG Contributes More to Overall A1C Than FPG
1 2 3 4 5

Prandial Excursions Are Evident, Especially Around a Single Key Meal: Insulin Glargine vs Premixed (n = 209)
Total units = 51.3 ± 26.7 with glargine plus OADs vs 78.5 ± 39.5 with premixed insulin (BIAsp 70/30)
*Denotes statistically significant difference between treatment groups at specific times.†Premixed = BIAsp 70/30.Raskin P et al. Diabetes Care. 2005;28:260-265.
*
Pla
sma
Glu
cose
(m
g/d
L)
Week 28
Baseline
GlarginePremixed†
Time of DayBB B90 BL L90 BD D90 Bed 3 AM
350
300
250
200
150
100
50
**
**

Case Study (cont’d)
Breakfast Lunch Dinner MSMiddle of NightDose Blood
Sugar Dose Blood Sugar Dose Blood
Sugar Dose Blood Sugar
Monday 147 110 153 185 57
Tuesday 138 112 170 164 48
Wednesday 140 90 155 205
Thursday 166 105 134 213 60
Friday
Saturday
Sunday
Daily Blood Glucose Diary March 24Week Ending

Adapted with permission from Leahy J. In: Leahy J, Cefalu W, eds. Insulin Therapy. New York: Marcel Dekker; 2002:87; Nathan DM. N Engl J Med. 2002;347:1342-1349.
Twice-Daily Split-Mixed Regimens or Lispro Mix (75/25)–Aspart Mix (70/30)
4:00 16:00 20:00 24:00 4:00
Breakfast Lunch Dinner
Insu
lin
Act
ion
8:0012:008:00Time
Glucose levelsInsulin levels
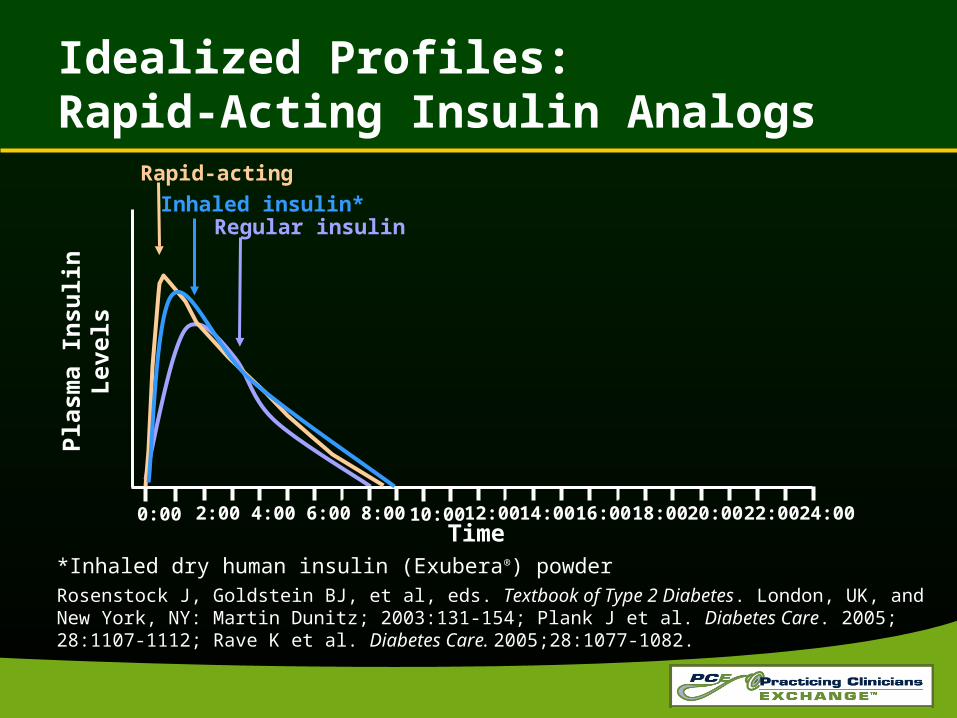
*Inhaled dry human insulin (Exubera®) powder Rosenstock J, Goldstein BJ, et al, eds. Textbook of Type 2 Diabetes. London, UK, and New York, NY: Martin Dunitz; 2003:131-154; Plank J et al. Diabetes Care. 2005; 28:1107-1112; Rave K et al. Diabetes Care. 2005;28:1077-1082.
Idealized Profiles: Rapid-Acting Insulin Analogs
0:00 2:00 4:00 6:00 8:00 10:00 12:00 14:00 16:00 18:00 20:00 22:00 24:00
Pla
sma
Insu
lin
Lev
els
Time
Regular insulin
Rapid-acting
Inhaled insulin*

Case Study (cont’d)
Decision is made to switch to basal-prandial therapy to reduce hypoglycemia and postprandial highs
60% of patient’s total daily insulin dose is given as basal insulin – 54 U glargine qhs titrated to FPG 100-110 mg/dL
Before the main meal, a rapid-acting analog is added: glulisine, initiated at 5 units, up-titrated using a treat-to-target algorithm
Patient continues to self-monitor glucose
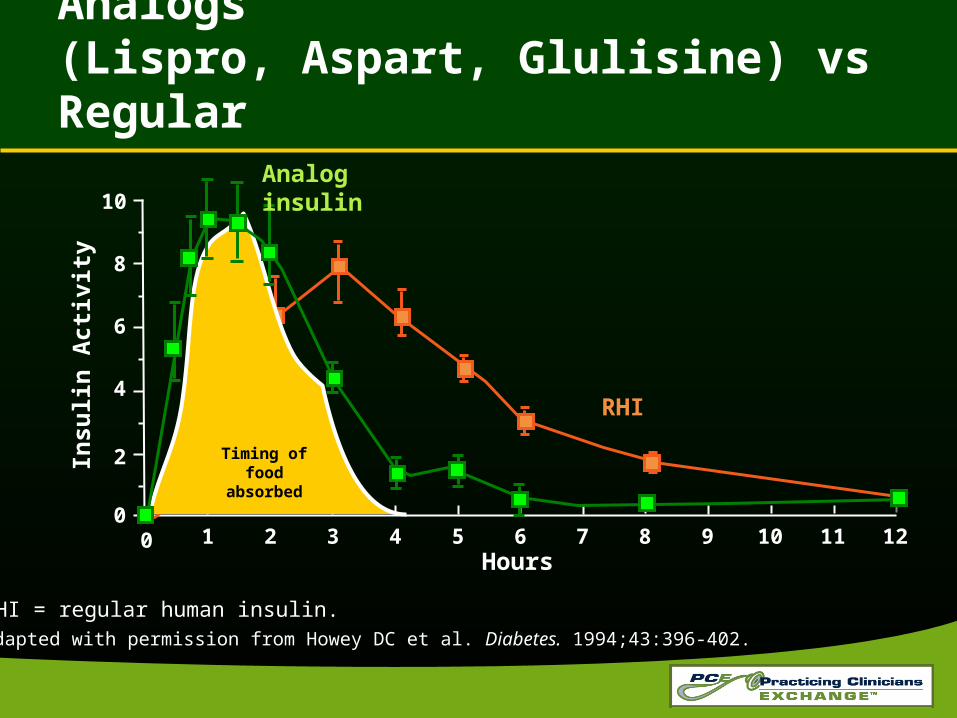
Meal Insulin: Rapid-Acting Analogs (Lispro, Aspart, Glulisine) vs Regular
Hours
RHI = regular human insulin.Adapted with permission from Howey DC et al. Diabetes. 1994;43:396-402.
10
8
6
4
2
00 1 2 3 4 5 6 7 8 9 10 11 12
Insu
lin
Act
ivit
y
RHI
Timing offood
absorbed
Analog insulin
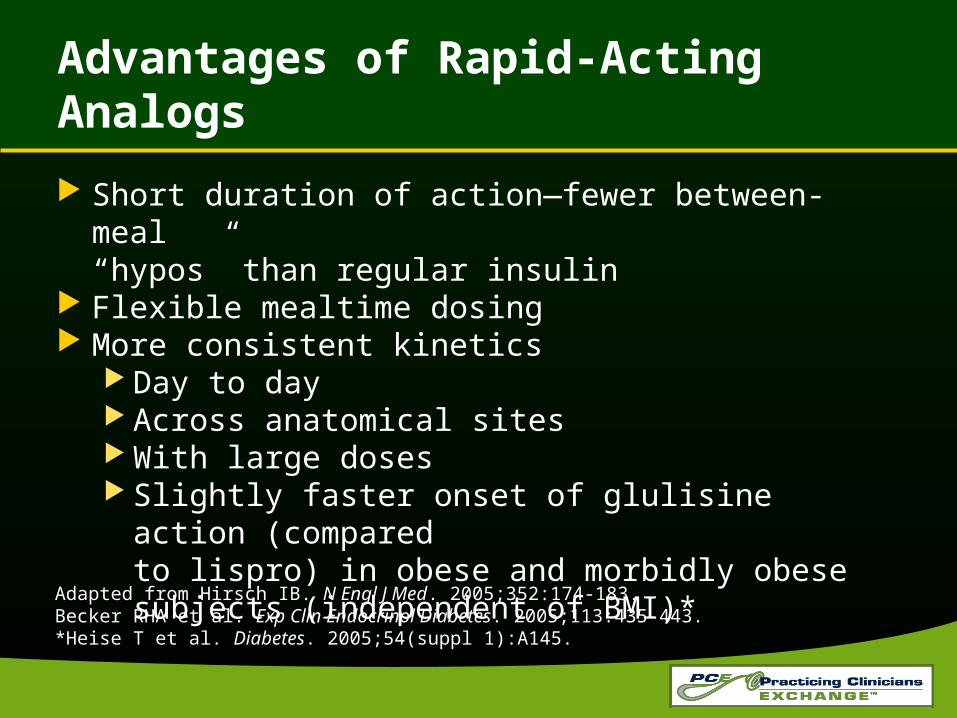
Advantages of Rapid-Acting Analogs
Short duration of action—fewer between-meal “hypos” than regular insulin
Flexible mealtime dosing More consistent kinetics
Day to day Across anatomical sites With large doses Slightly faster onset of glulisine action (compared
to lispro) in obese and morbidly obese subjects (independent of BMI)*
Adapted from Hirsch IB. N Engl J Med. 2005;352:174-183.Becker RHA et al. Exp Clin Endocrinol Diabetes. 2005;113:435-443.*Heise T et al. Diabetes. 2005;54(suppl 1):A145.

Decision Point
The best time to use a rapid-acting insulin analog is:
1. Before a meal
2. After a meal
3. Either works well
Use your keypad to vote now!
?
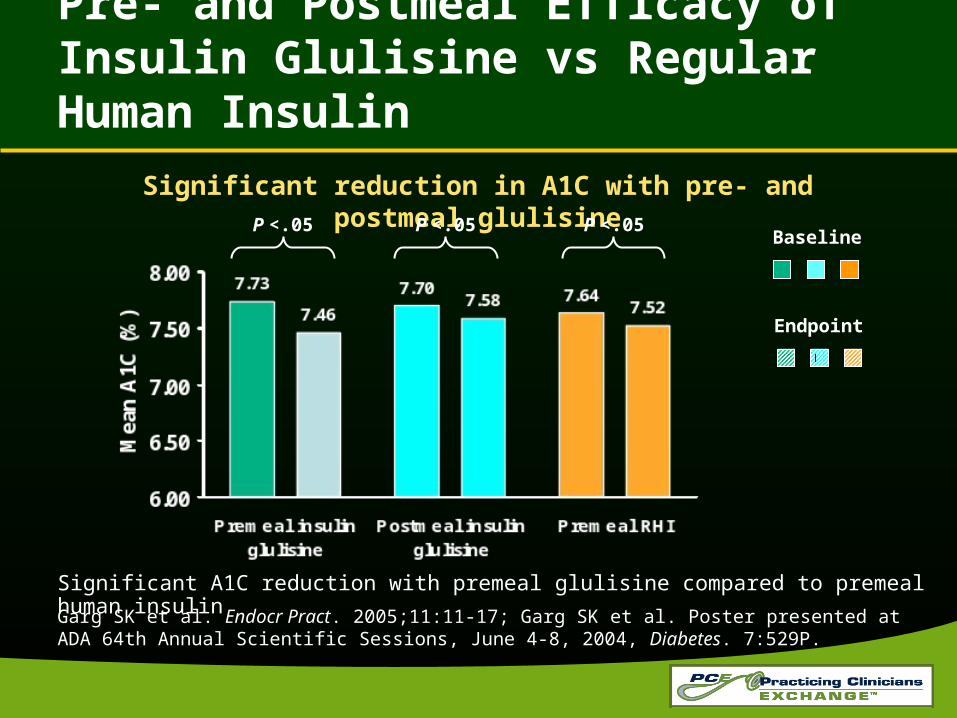
Pre- and Postmeal Efficacy of Insulin Glulisine vs Regular Human Insulin
Garg SK et al. Endocr Pract. 2005;11:11-17; Garg SK et al. Poster presented at ADA 64th Annual Scientific Sessions, June 4-8, 2004, Diabetes. 7:529P.
Significant A1C reduction with premeal glulisine compared to premeal human insulin
Significant reduction in A1C with pre- and postmeal glulisine
Baseline
Endpoint
P <.05P <.05P <.05
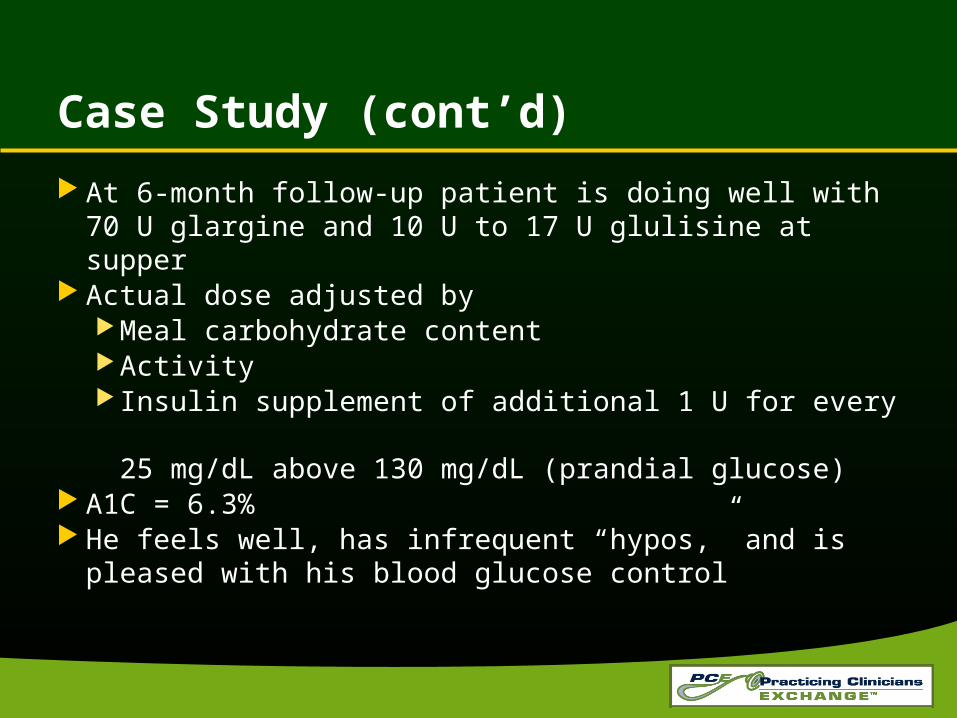
Case Study (cont’d)
At 6-month follow-up patient is doing well with 70 U glargine and 10 U to 17 U glulisine at supper
Actual dose adjusted byMeal carbohydrate contentActivity Insulin supplement of additional 1 U for every
25 mg/dL above 130 mg/dL (prandial glucose) A1C = 6.3% He feels well, has infrequent “hypos,” and is pleased
with his blood glucose control

Q & A

PCE Takeaways
PCE Takeaways: Basal-Prandial Insulin Replacement
1. An effective insulin treatment strategy provides both basal and postprandial insulin coverage
2. Initially, prandial insulin may be needed only at the largest meal of the day, with coverage at other meals added based on prandial glucose levels
3. Rapid-acting insulin analogs closely match normal mealtime insulin patterns
Key Question
1. Much more comfortable
2. Somewhat comfortable
3. Slightly comfortable
4. Not comfortable at all
Use your keypad to vote now!
?How much more comfortable do you now feel you will be initiating insulin therapy in your patient population?