effectiveness of beach nourishment in response to sea ...€¦ · ... dean, r.g and dalrymple,...
TRANSCRIPT

Michael Walther, P. E., D. CE
Andrew Condon, Ph. D.
September 24, 2014
2014 FSBPA Annual Conference
Lovers Key Lee County
April 23, 2012
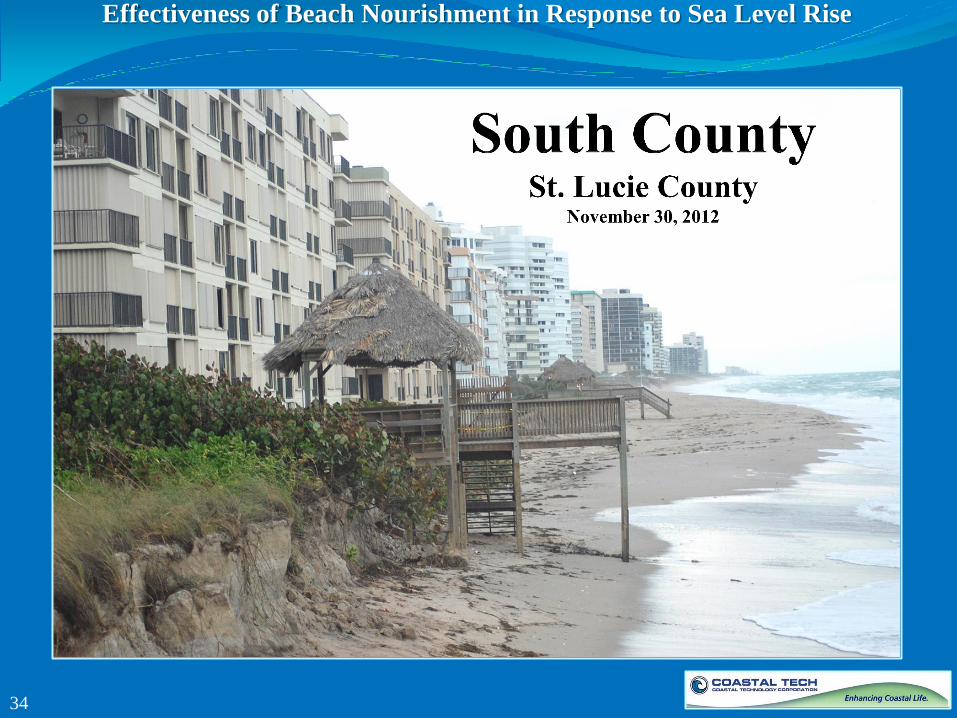
South County St. Lucie County
November 30, 2012
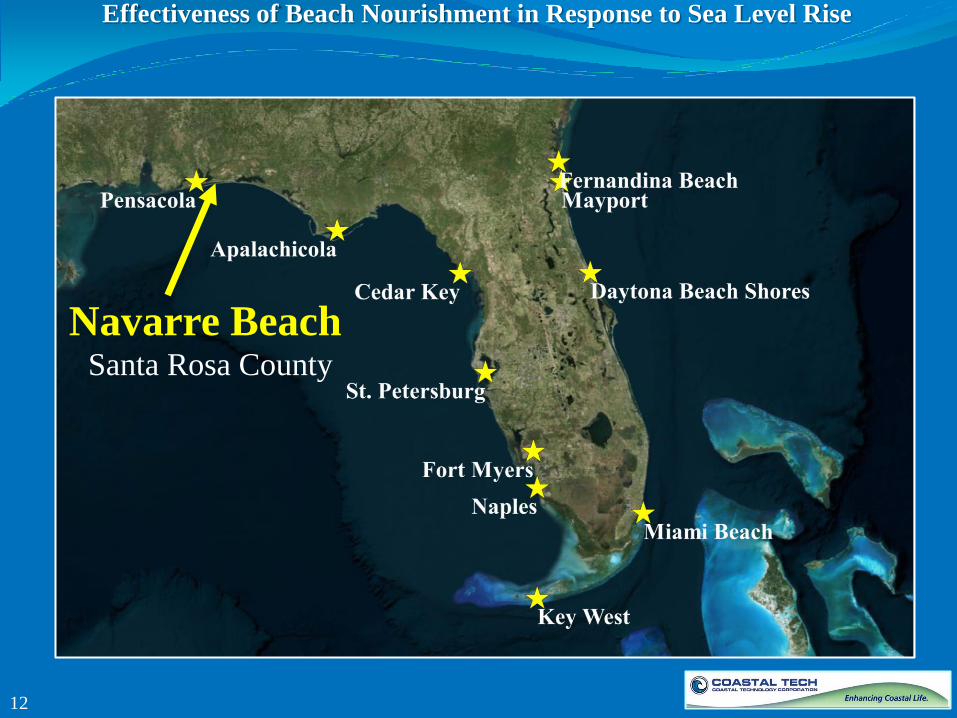
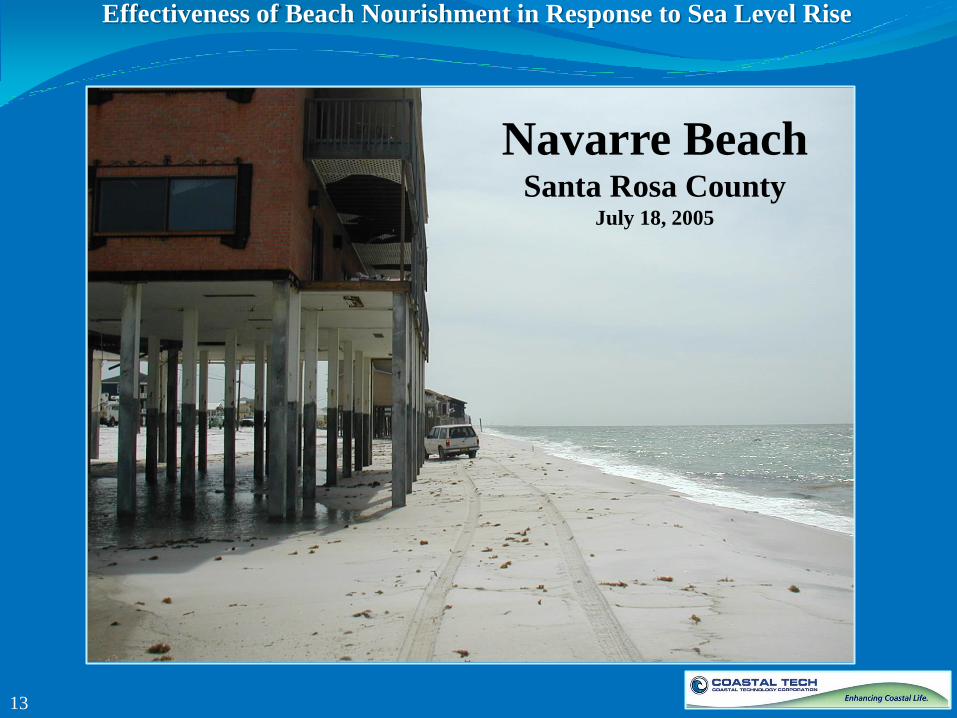
Navarre Beach Santa Rosa County
July 18, 2005
Effectiveness of Beach Nourishment
in Response to Sea Level Rise

• Beach Management Objectives
• Sea Level Rise in Florida - historical & projected
• Effectiveness of Alternatives – relative to Objectives
• Beach Fill
• Managed Retreat
• Coastal Armoring – Seawalls
• Conclusions
Effectiveness of Beach Nourishment in Response to Sea Level Rise
2
Presentation
Outline
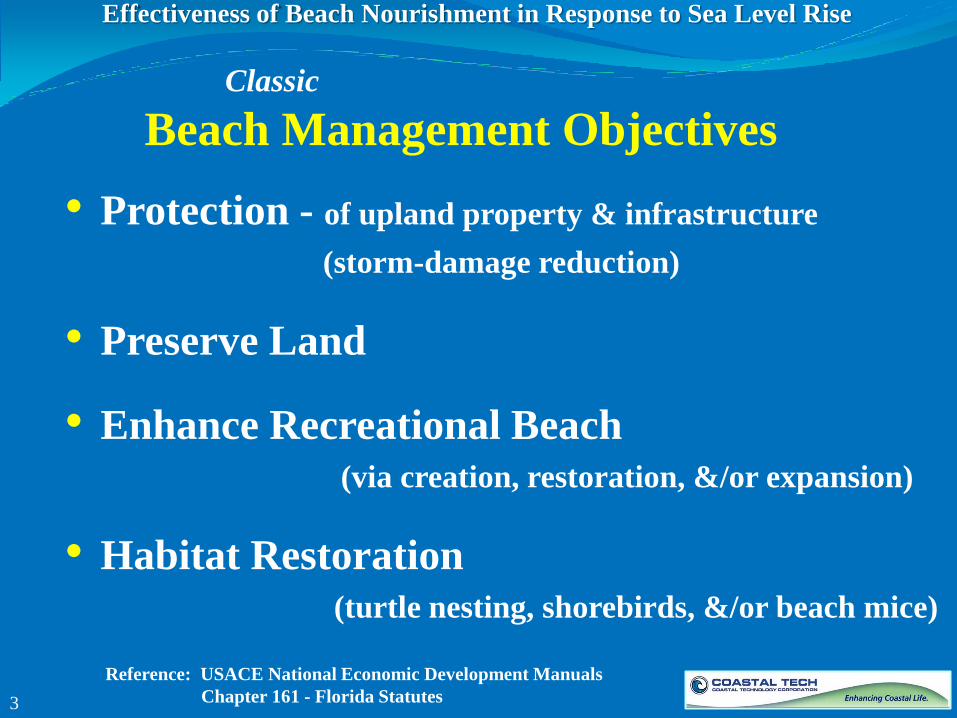
• Protection - of upland property & infrastructure
(storm-damage reduction)
• Preserve Land
• Enhance Recreational Beach
(via creation, restoration, &/or expansion)
• Habitat Restoration
(turtle nesting, shorebirds, &/or beach mice)
Reference: USACE National Economic Development Manuals
Chapter 161 - Florida Statutes
Effectiveness of Beach Nourishment in Response to Sea Level Rise
3
Classic
Beach Management Objectives
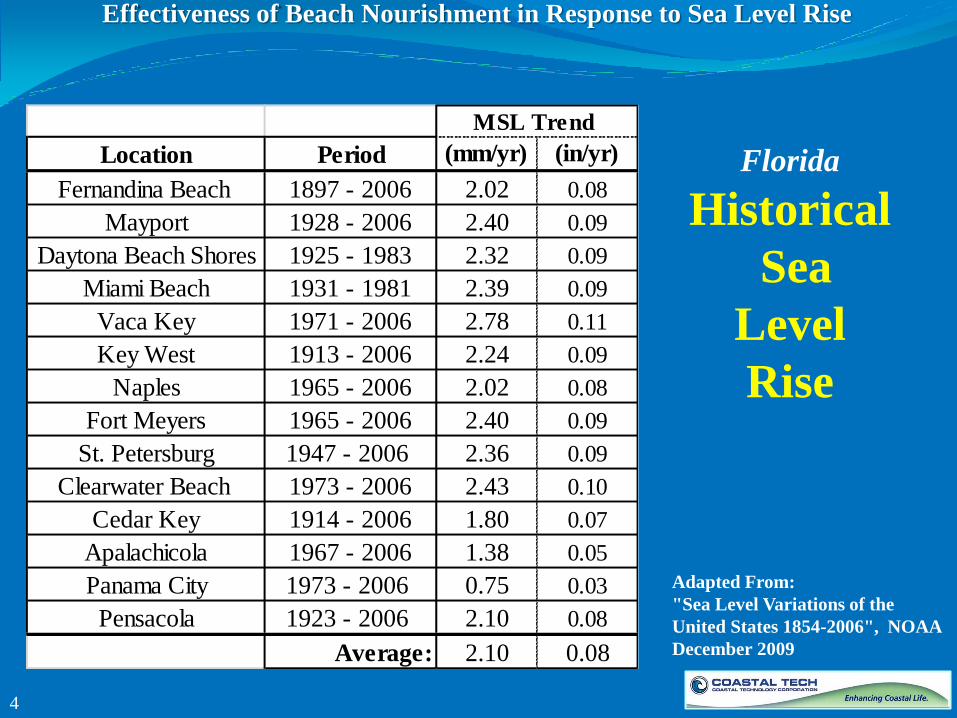
Adapted From:
"Sea Level Variations of the
United States 1854-2006", NOAA
December 2009
Location Period (mm/yr) (in/yr)
Fernandina Beach 1897 - 2006 2.02 0.08
Mayport 1928 - 2006 2.40 0.09
Daytona Beach Shores 1925 - 1983 2.32 0.09
Miami Beach 1931 - 1981 2.39 0.09
Vaca Key 1971 - 2006 2.78 0.11
Key West 1913 - 2006 2.24 0.09
Naples 1965 - 2006 2.02 0.08
Fort Meyers 1965 - 2006 2.40 0.09
St. Petersburg 1947 - 2006 2.36 0.09
Clearwater Beach 1973 - 2006 2.43 0.10
Cedar Key 1914 - 2006 1.80 0.07
Apalachicola 1967 - 2006 1.38 0.05
Panama City 1973 - 2006 0.75 0.03
Pensacola 1923 - 2006 2.10 0.08
Average: 2.10 0.08
MSL Trend
Effectiveness of Beach Nourishment in Response to Sea Level Rise
4
Florida
Historical
Sea
Level
Rise
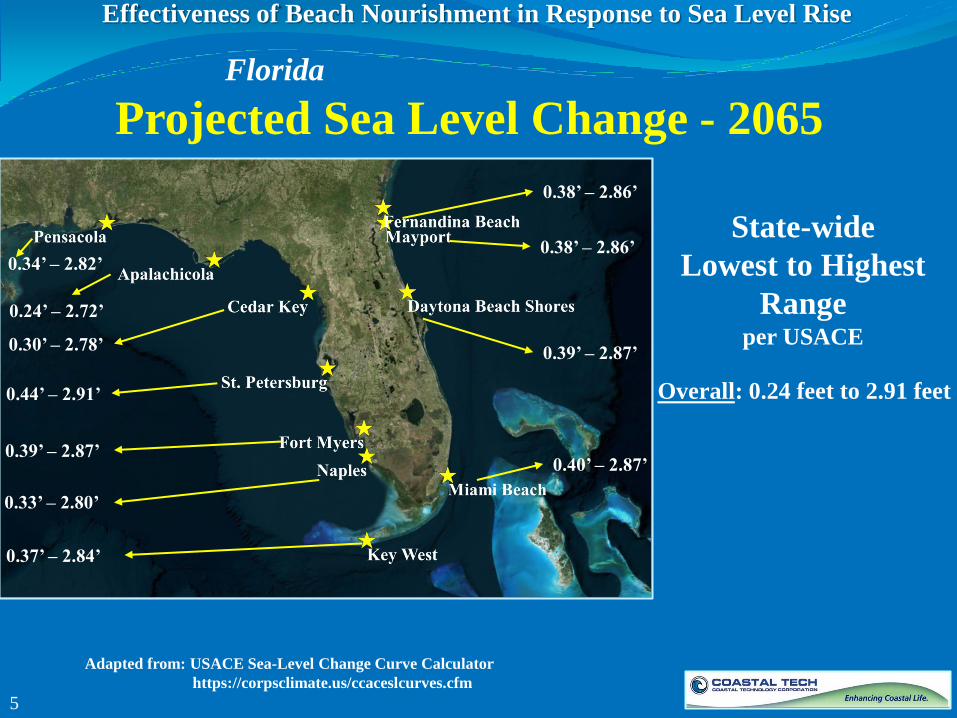
0.34’ – 2.82’
0.24’ – 2.72’
0.30’ – 2.78’
0.44’ – 2.91’
0.39’ – 2.87’
0.33’ – 2.80’
0.37’ – 2.84’
0.40’ – 2.87’
0.38’ – 2.86’
0.38’ – 2.86’
0.39’ – 2.87’
Adapted from: USACE Sea-Level Change Curve Calculator
https://corpsclimate.us/ccaceslcurves.cfm
State-wide
Lowest to Highest
Range per USACE
Overall: 0.24 feet to 2.91 feet
Effectiveness of Beach Nourishment in Response to Sea Level Rise
5
Florida
Projected Sea Level Change - 2065
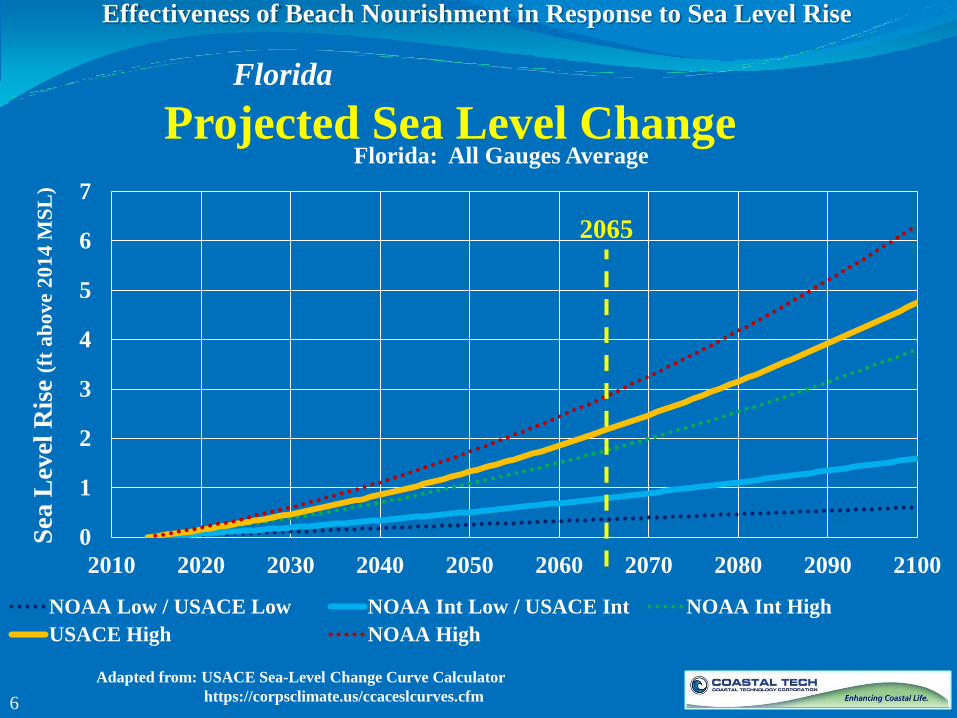
0
1
2
3
4
5
6
7
2010 2020 2030 2040 2050 2060 2070 2080 2090 2100
Sea
Lev
el R
ise
(ft
ab
ov
e 2
01
4 M
SL
)
Florida: All Gauges Average
NOAA Low / USACE Low NOAA Int Low / USACE Int NOAA Int High
USACE High NOAA High
2065
Effectiveness of Beach Nourishment in Response to Sea Level Rise
6
Florida
Projected Sea Level Change
Adapted from: USACE Sea-Level Change Curve Calculator
https://corpsclimate.us/ccaceslcurves.cfm
• Beach Fill
• Managed Retreat ≡ “No Action” to abate erosion
• Coastal Armoring – Seawalls
Effectiveness of Beach Nourishment in Response to Sea Level Rise
7
Alternatives
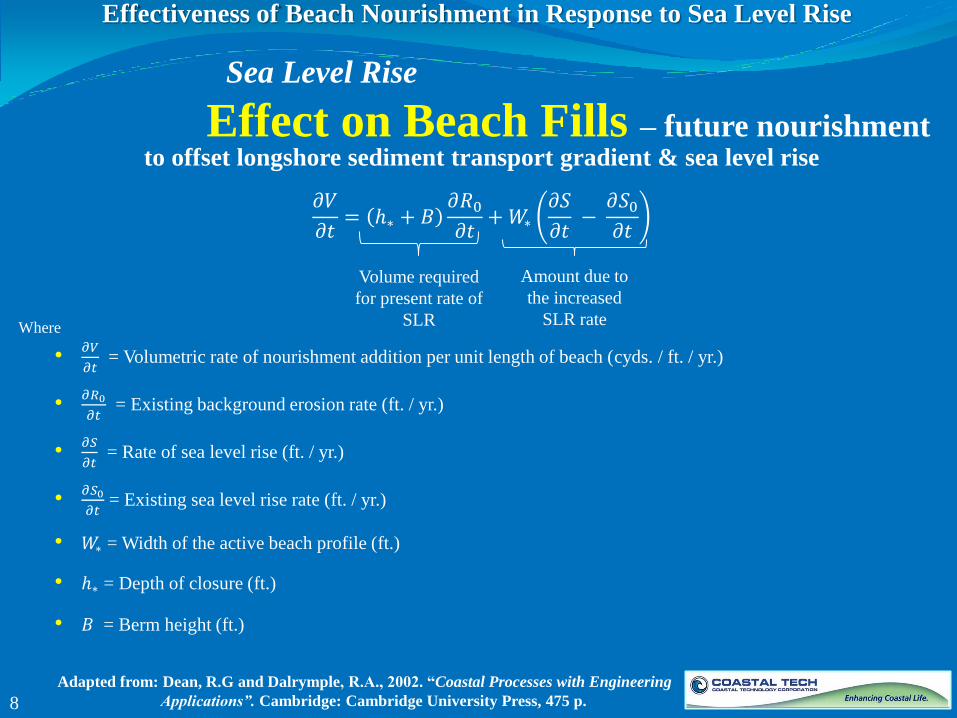
to offset longshore sediment transport gradient & sea level rise
𝜕𝑉
𝜕𝑡= ℎ∗ + 𝐵
𝜕𝑅0
𝜕𝑡+ 𝑊∗
𝜕𝑆
𝜕𝑡 −
𝜕𝑆0
𝜕𝑡
Where
•𝜕𝑉
𝜕𝑡 = Volumetric rate of nourishment addition per unit length of beach (cyds. / ft. / yr.)
•𝜕𝑅0
𝜕𝑡 = Existing background erosion rate (ft. / yr.)
•𝜕𝑆
𝜕𝑡 = Rate of sea level rise (ft. / yr.)
•𝜕𝑆0
𝜕𝑡 = Existing sea level rise rate (ft. / yr.)
• 𝑊∗ = Width of the active beach profile (ft.)
• ℎ∗ = Depth of closure (ft.)
• 𝐵 = Berm height (ft.)
Volume required
for present rate of
SLR
Amount due to
the increased
SLR rate
Effectiveness of Beach Nourishment in Response to Sea Level Rise
Adapted from: Dean, R.G and Dalrymple, R.A., 2002. “Coastal Processes with Engineering
Applications”. Cambridge: Cambridge University Press, 475 p. 8
Sea Level Rise
Effect on Beach Fills – future nourishment
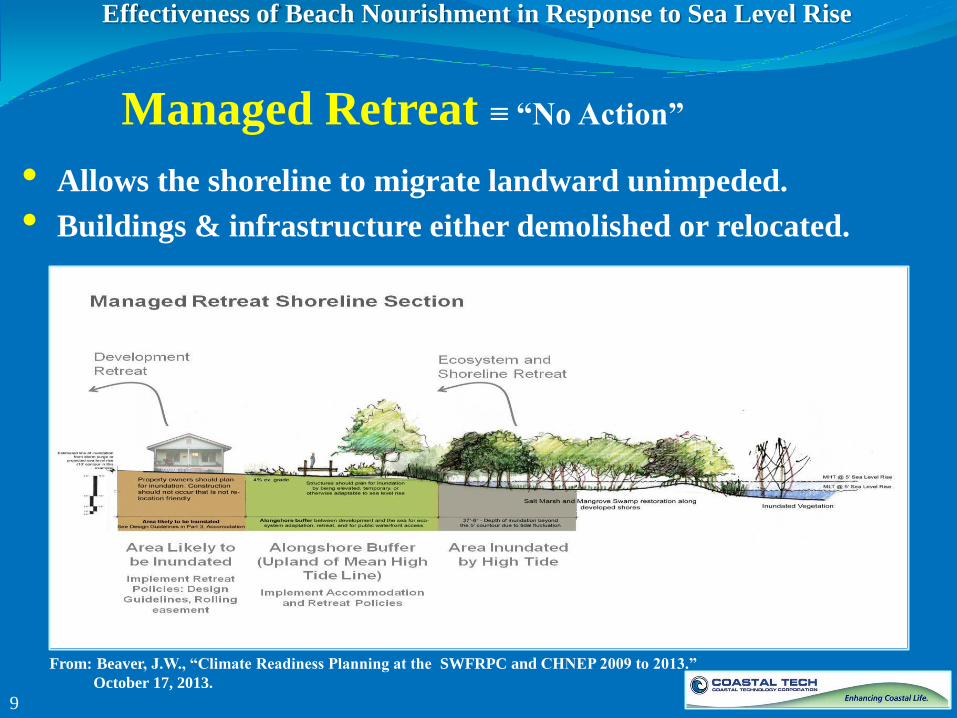
From: Beaver, J.W., “Climate Readiness Planning at the SWFRPC and CHNEP 2009 to 2013.”
October 17, 2013.
• Allows the shoreline to migrate landward unimpeded.
• Buildings & infrastructure either demolished or relocated.
Effectiveness of Beach Nourishment in Response to Sea Level Rise
9
Managed Retreat ≡ “No Action”

Assumes
1. Profile shape does not change with respect to the water line.
2. The sand volume in the profile must be conserved.
∆𝒚 = −𝑹 = −𝑺𝑾∗
𝒉∗ + 𝑩
Where
• ∆𝒚 = -R = Horizontal shoreline recession
• 𝑺 = Sea level rise
• 𝑾∗ = Width of the active beach profile
• 𝒉∗ = Depth of closure
• 𝑩 = Berm height
Effectiveness of Beach Nourishment in Response to Sea Level Rise
10
Sea Level Rise
Shoreline Recession: Bruun Rule
Adapted from: Dean, R.G and Dalrymple, R.A., 2002. “Coastal Processes with Engineering
Applications”. Cambridge: Cambridge University Press, 475 p.
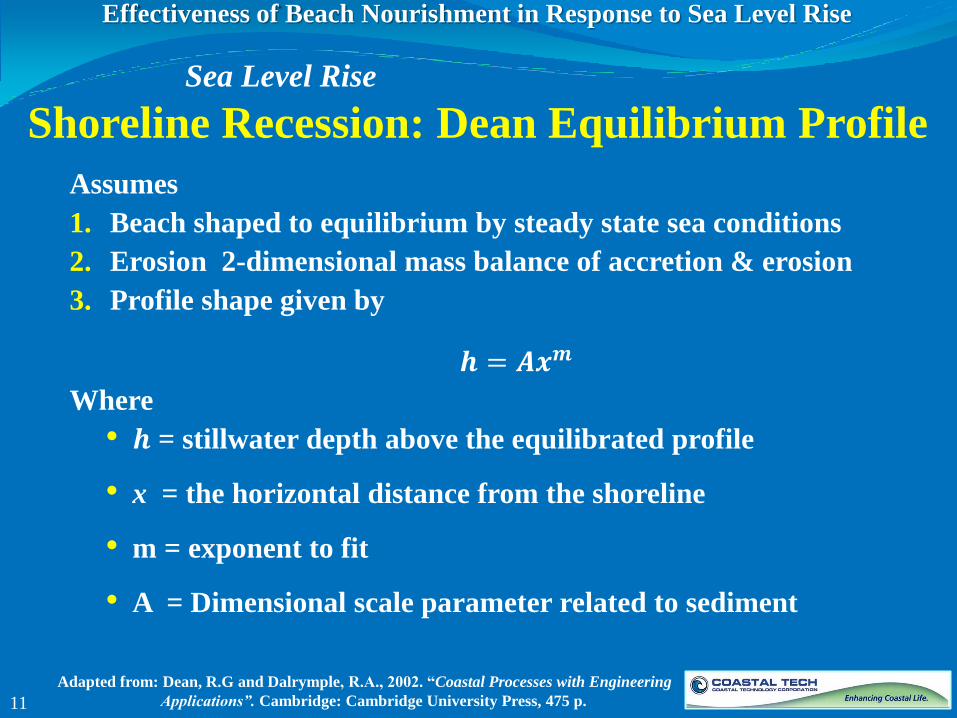
Assumes
1. Beach shaped to equilibrium by steady state sea conditions
2. Erosion 2-dimensional mass balance of accretion & erosion
3. Profile shape given by
𝒉 = 𝑨𝒙𝒎
Where
• 𝒉 = stillwater depth above the equilibrated profile
• x = the horizontal distance from the shoreline
• m = exponent to fit
• A = Dimensional scale parameter related to sediment
Effectiveness of Beach Nourishment in Response to Sea Level Rise
11
Sea Level Rise
Shoreline Recession: Dean Equilibrium Profile
Adapted from: Dean, R.G and Dalrymple, R.A., 2002. “Coastal Processes with Engineering
Applications”. Cambridge: Cambridge University Press, 475 p.
Effectiveness of Beach Nourishment in Response to Sea Level Rise
12
Navarre Beach Santa Rosa County
Effectiveness of Beach Nourishment in Response to Sea Level Rise
13
Navarre Beach Santa Rosa County
July 18, 2005

Effectiveness of Beach Nourishment in Response to Sea Level Rise
14
Navarre
Beach Santa Rosa County
Initial Construction:
2.95 Mcy
4.1 miles
136 cyds/ft
2006

R-200
Photo From: Google Earth
Effectiveness of Beach Nourishment in Response to Sea Level Rise
15
Navarre Beach Santa Rosa County

Effectiveness of Beach Nourishment in Response to Sea Level Rise
R-200
16
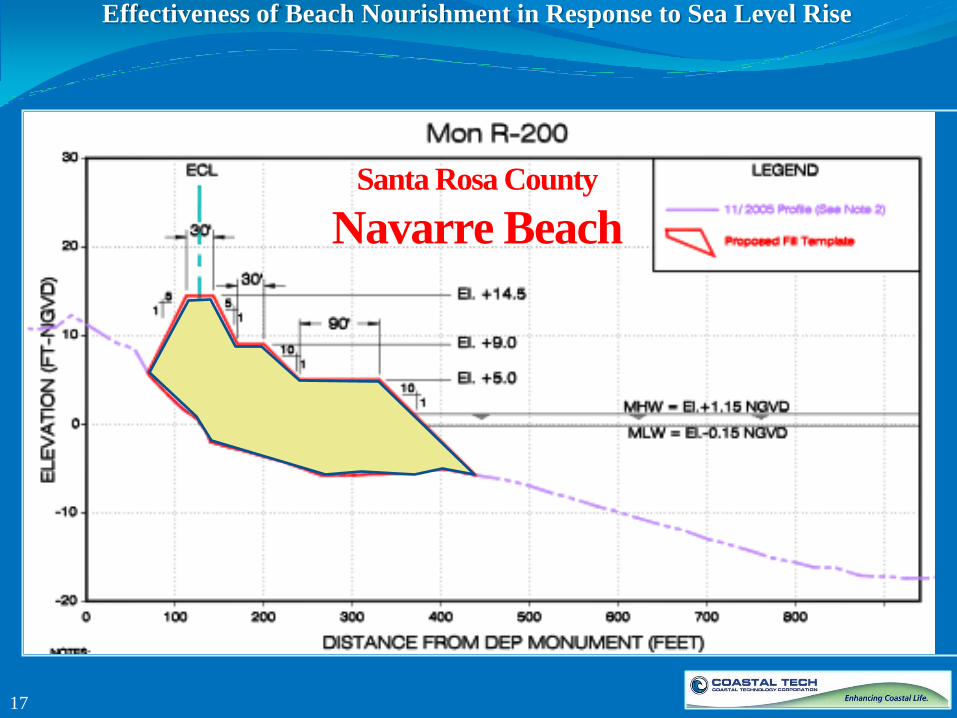
Navarre Beach - Santa Rosa County
Effectiveness of Beach Nourishment in Response to Sea Level Rise
17
Santa Rosa County
Navarre Beach

41.09 41.53 42.41 42.86 42.86 43.74 44.18 44.62 45.50 45.50 46.4 48.6
50.8 53.0
54.8 57.0
59.2 61.4
63.2 65.4
30
35
40
45
50
55
60
65
70
2020 2030 2040 2050 2060 2070 2080 2090 2100
Ren
ou
rish
men
t V
olu
me
(cy
ds/
ft)
USACE Int. USACE High
2006 Fill Density = 136 cyds/ft for 8-year cycle
2015 Fill Density = 73 cyds/ft for 8-year cycle
Effectiveness of Beach Nourishment in Response to Sea Level Rise
18
Navarre Beach - Santa Rosa County Nourishment - future needs based on 8 year cycle
to offset longshore sediment transport gradient & sea level rise

-5.0
-2.5
0.0
2.5
5.0
7.5
10.0
12.5
15.0
-300 -250 -200 -150 -100 -50 0 50
Hei
gh
t a
bo
ve
MS
L (
ft)
Distance from MSL (ft)
R-200
Equilibrium Profile Zero Int Bruun Dean
40’
122’
Effectiveness of Beach Nourishment in Response to Sea Level Rise
19
Navarre Beach - Santa Rosa County No Action - Intermediate Sea Level Change - 2065
-5.0
-2.5
0.0
2.5
5.0
7.5
10.0
12.5
15.0
-300 -250 -200 -150 -100 -50 0 50
Hei
gh
t a
bo
ve
MS
L (
ft)
Distance from MSL (ft)
R-200
Equilibrium Profile Zero High Bruun Dean
112’ 268’
Effectiveness of Beach Nourishment in Response to Sea Level Rise
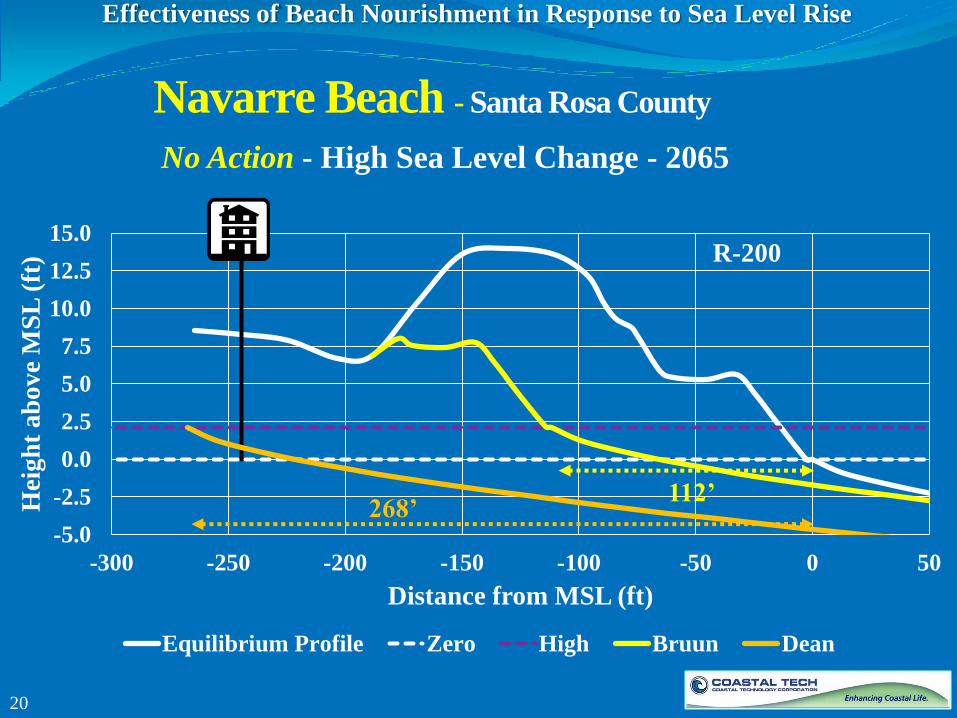
20
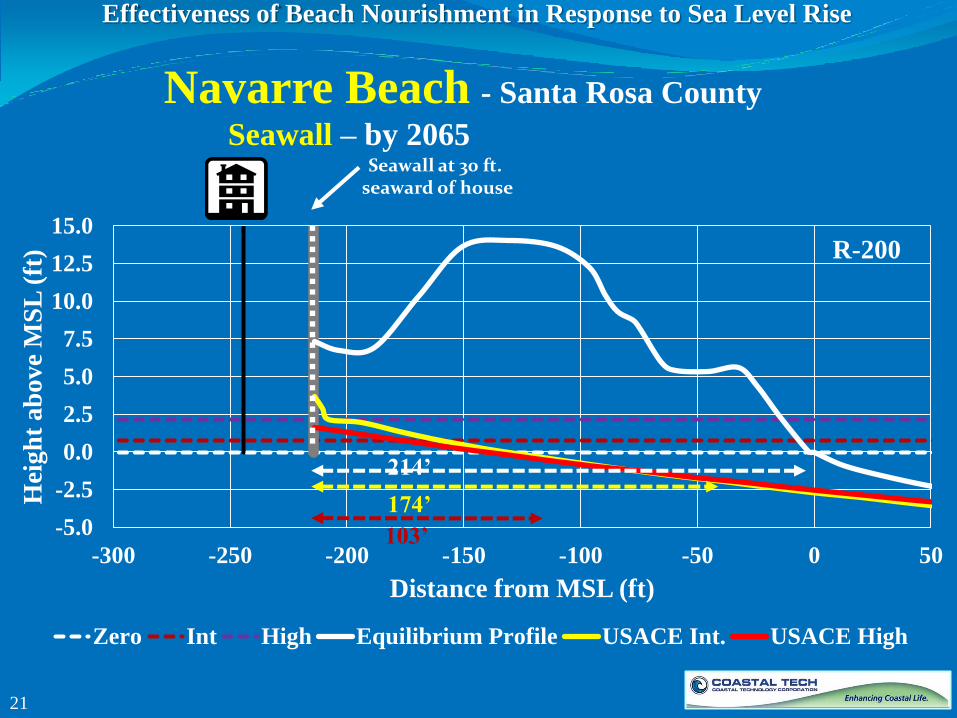
Navarre Beach - Santa Rosa County No Action - High Sea Level Change - 2065
-5.0
-2.5
0.0
2.5
5.0
7.5
10.0
12.5
15.0
-300 -250 -200 -150 -100 -50 0 50
Hei
gh
t a
bo
ve
MS
L (
ft)
Distance from MSL (ft)
R-200
Zero Int High Equilibrium Profile USACE Int. USACE High
Seawall at 30 ft. seaward of house
174’
103’
214’
21
Navarre Beach - Santa Rosa County
Seawall – by 2065
Effectiveness of Beach Nourishment in Response to Sea Level Rise
Effectiveness of Beach Nourishment in Response to Sea Level Rise
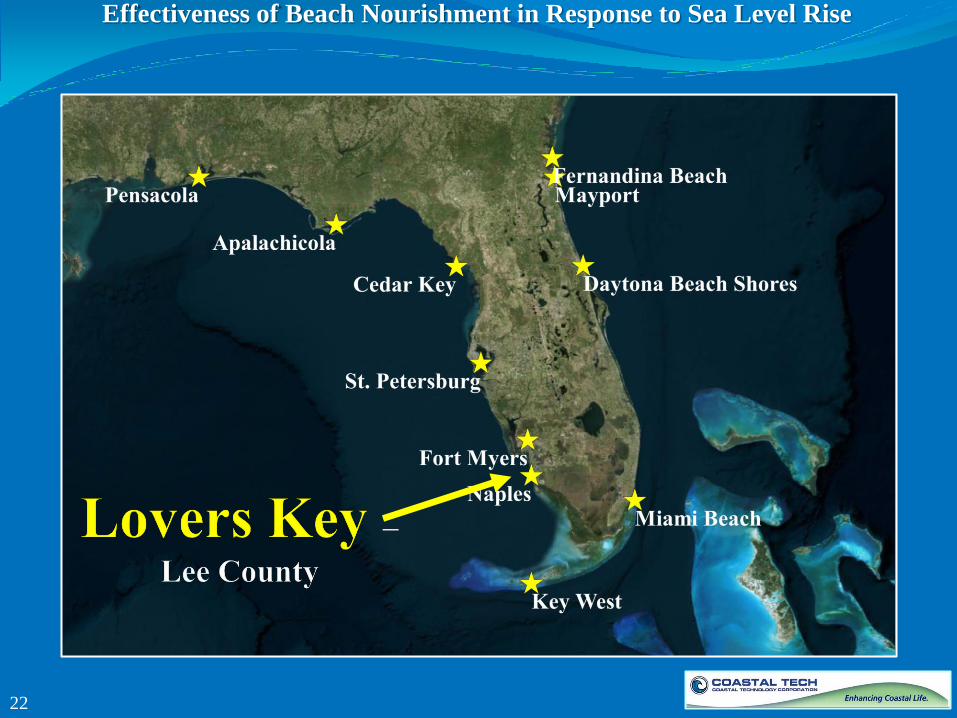
22

We are here!
R-219
Effectiveness of Beach Nourishment in Response to Sea Level Rise
23
Lovers
Key
Lovers Key - Lee County

Effectiveness of Beach Nourishment in Response to Sea Level Rise
April 23, 2012
24
Effectiveness of Beach Nourishment in Response to Sea Level Rise
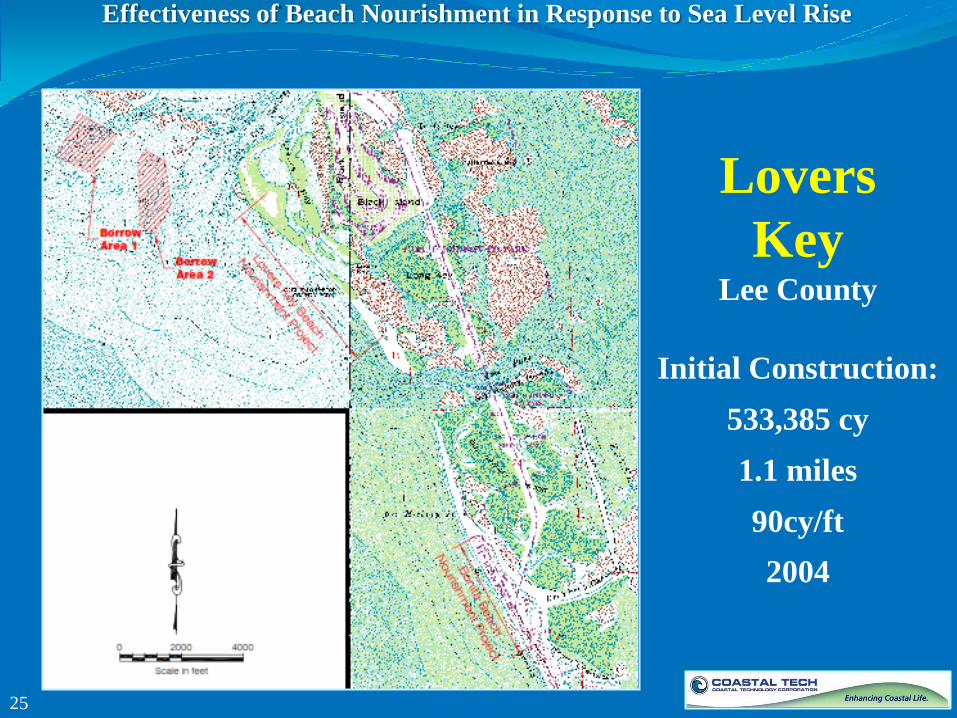
25
Initial Construction:
533,385 cy
1.1 miles
90cy/ft
2004
Lovers
Key Lee County
Effectiveness of Beach Nourishment in Response to Sea Level Rise
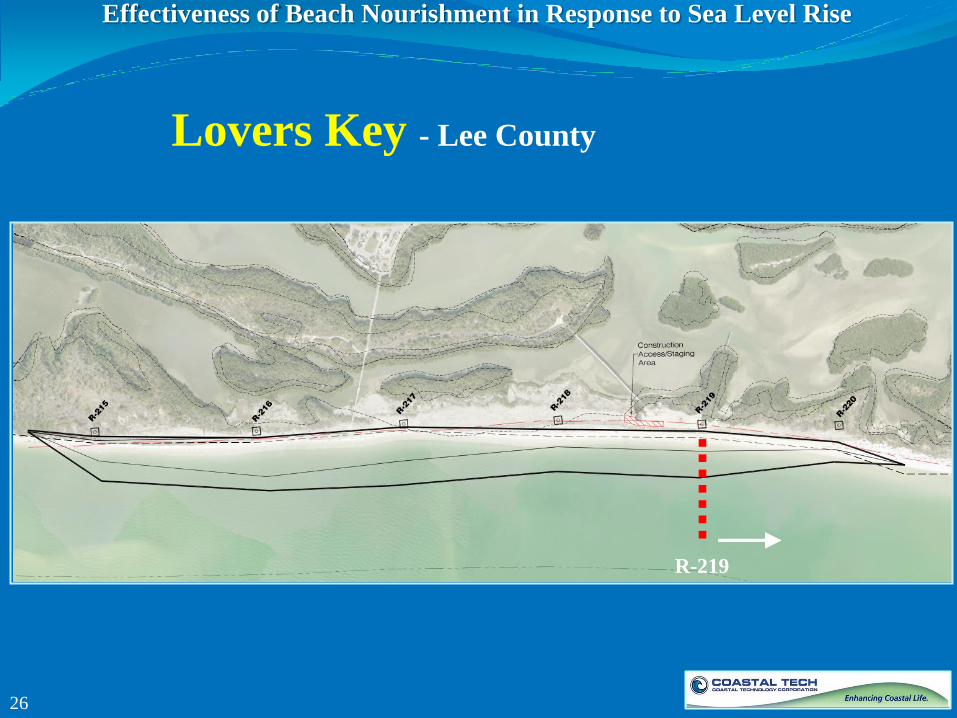
R-219
26
Lovers Key - Lee County

Effectiveness of Beach Nourishment in Response to Sea Level Rise
27
XLovers Key Lee County
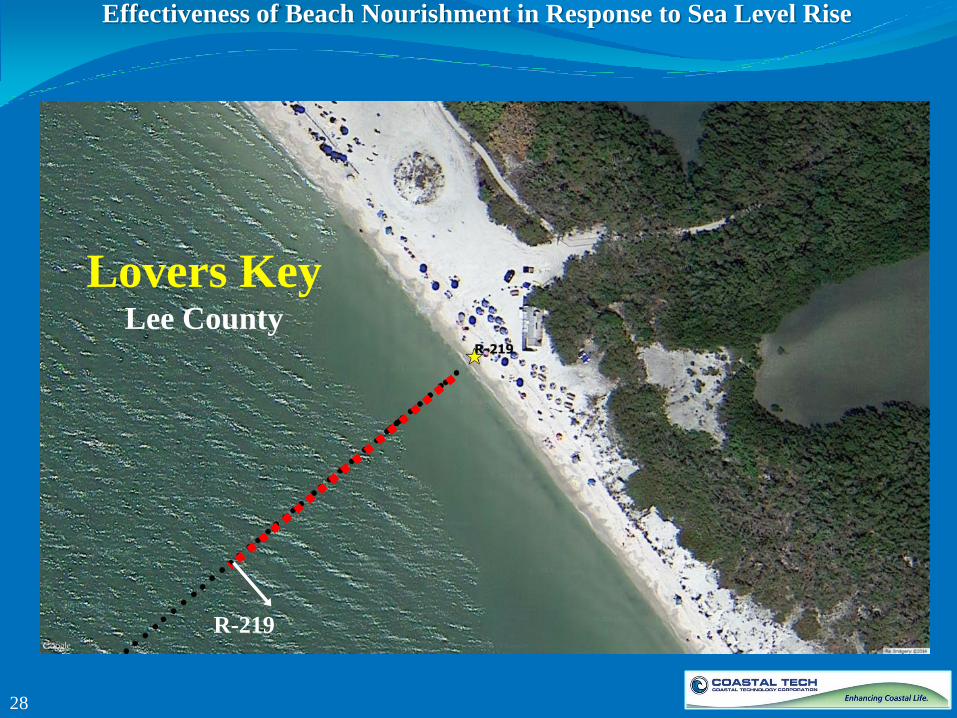
R-219
Effectiveness of Beach Nourishment in Response to Sea Level Rise
28
Lovers Key Lee County

2004 Average Fill Density = 90.0 cyds/ft for 8 year cycle
2014 Average Fill Density = 58.1 cyds/ft for 8 year cycle
Effectiveness of Beach Nourishment in Response to Sea Level Rise
29
Lovers Key - Lee County
Nourishment - future needs based on 8 year cycle to offset longshore sediment transport gradient & sea level rise
57.9 58.4 59.0 60.0 60.0
61.0 61.6 62.1 62.6 63.1 64.2
66.8
69.4 71.5
74.1
76.7
79.3
81.4
84.1
86.7
50
60
70
80
90
2020 2030 2040 2050 2060 2070 2080 2090 2100
Ren
ou
rish
men
t V
olu
me
(cy
ds/
ft)
USACE Int. USACE High

-8.00
-6.00
-4.00
-2.00
0.00
2.00
4.00
6.00
8.00
-200 -100 0 100
Hei
gh
t a
bo
ve
MS
L (
ft)
Distance from MSL (ft)
R-219
Equilibrium Profile Zero Int Bruun Dean
75’
34’
Effectiveness of Beach Nourishment in Response to Sea Level Rise
30
Lovers Key - Lee County
No Action - Intermediate Sea Level Change - 2065
-8.00
-6.00
-4.00
-2.00
0.00
2.00
4.00
6.00
8.00
-400 -300 -200 -100 0 100
Hei
gh
t a
bo
ve
MS
L (
ft)
Distance from MSL (ft)
R-219
Equilibrium Profile Zero High Bruun Dean
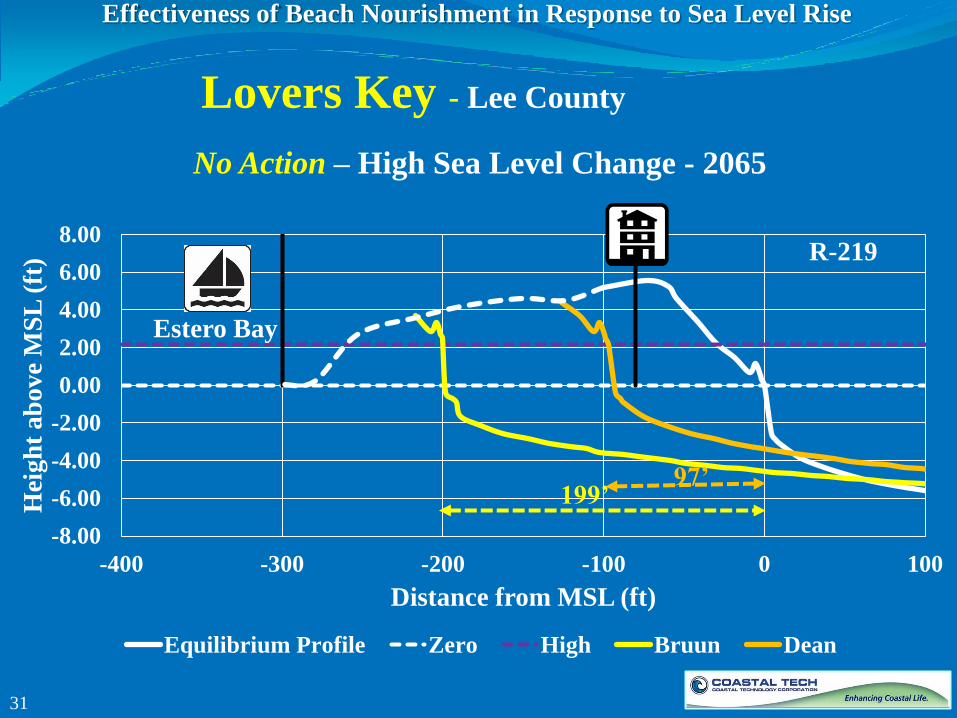
199’ 97’
Estero Bay
Effectiveness of Beach Nourishment in Response to Sea Level Rise
31
Lovers Key - Lee County
No Action – High Sea Level Change - 2065
-8.00
-6.00
-4.00
-2.00
0.00
2.00
4.00
6.00
8.00
-100 0 100
Hei
gh
t a
bo
ve
MS
L (
ft)
Distance from MSL (ft)
R-219
Zero Int High Equilibrium Profile USACE Int. USACE High
Effectiveness of Beach Nourishment in Response to Sea Level Rise
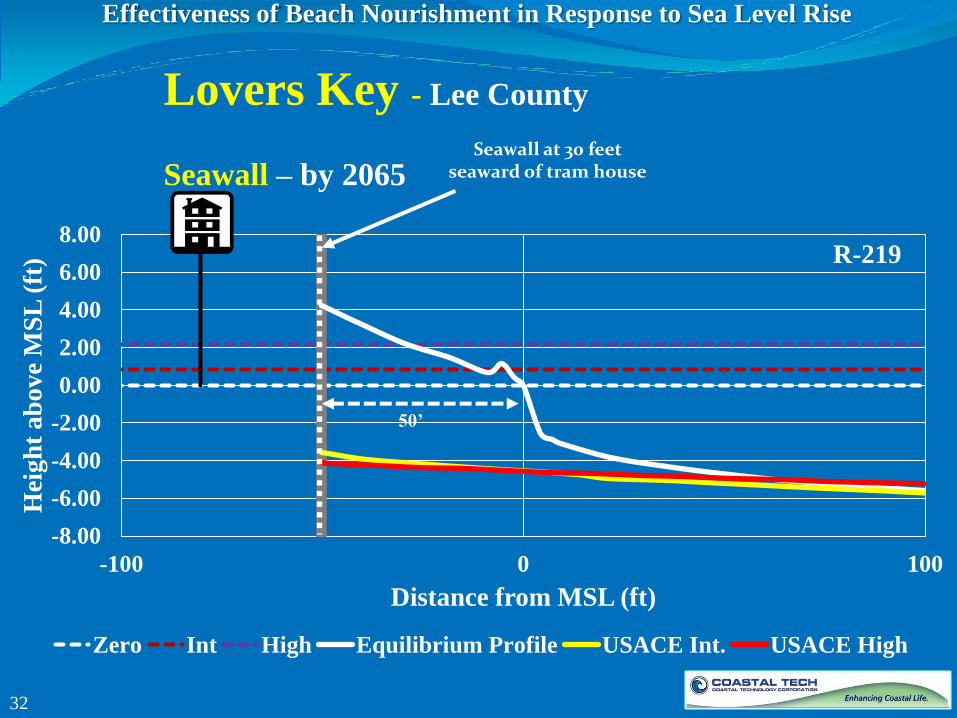
50’
Seawall at 30 feet seaward of tram house
32
Lovers Key - Lee County
Seawall – by 2065

Effectiveness of Beach Nourishment in Response to Sea Level Rise
33
South
County St. Lucie County
Effectiveness of Beach Nourishment in Response to Sea Level Rise
34

Effectiveness of Beach Nourishment in Response to Sea Level Rise
Martin County Line
Ft. Pierce Inlet
Initial Construction:
682,500 cy
3.4 miles
38.5cy/ft
2013
35
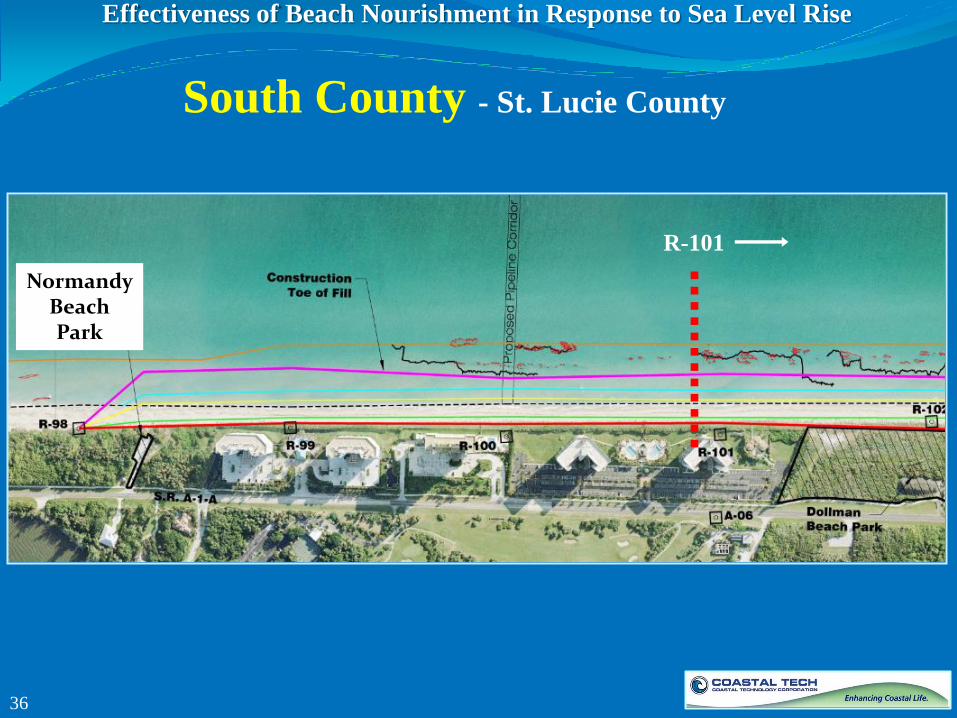
South County St. Lucie County
Effectiveness of Beach Nourishment in Response to Sea Level Rise
Normandy Beach Park
R-101
36
South County - St. Lucie County
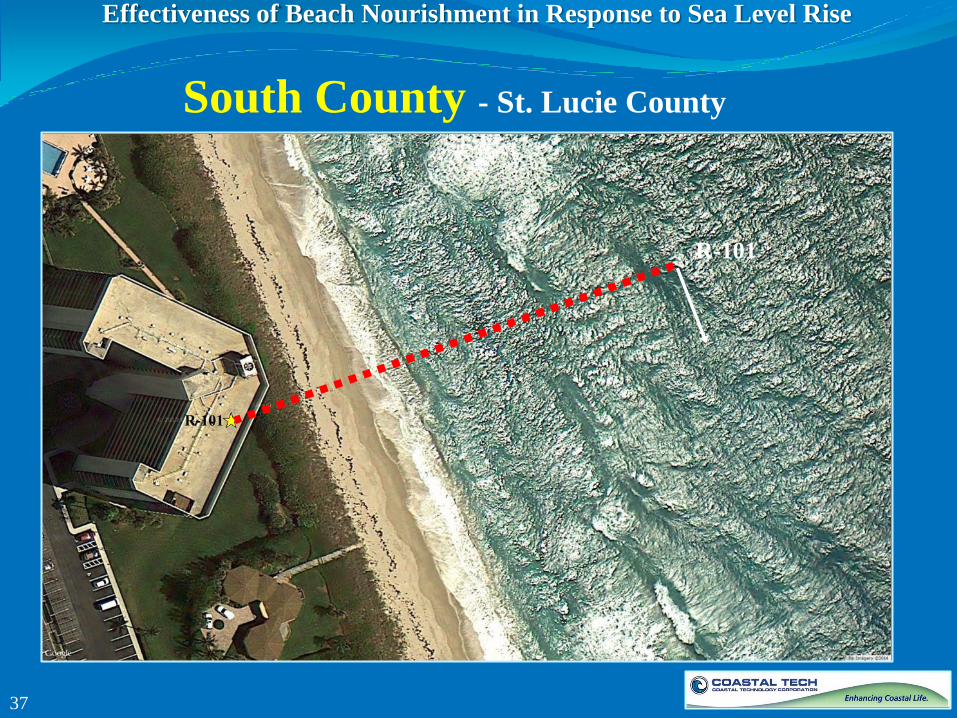
R-101
Effectiveness of Beach Nourishment in Response to Sea Level Rise
37
South County - St. Lucie County
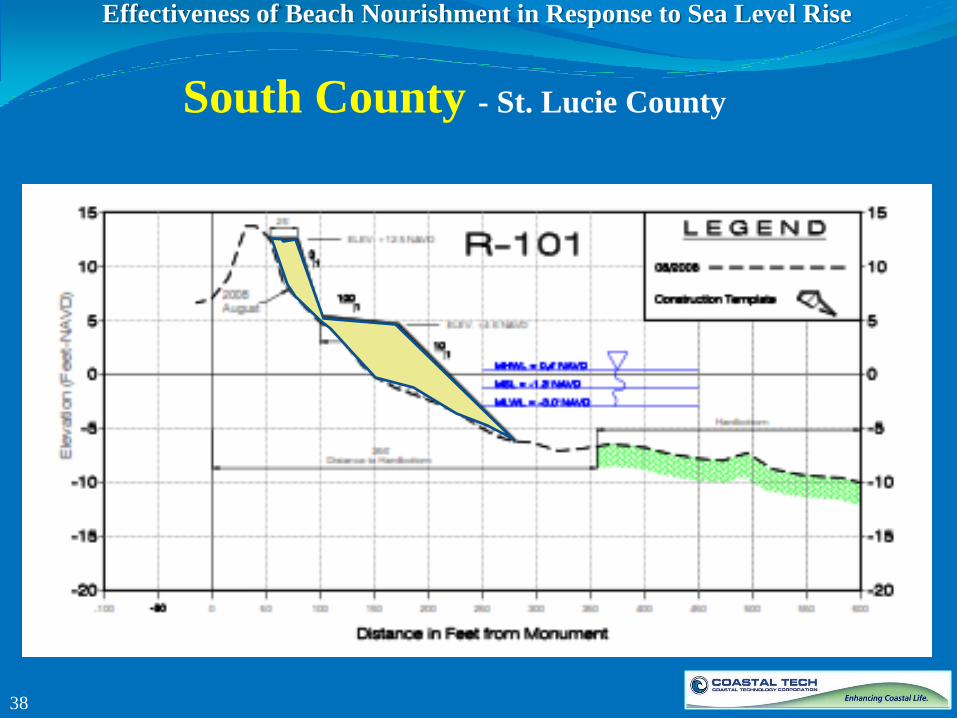
Effectiveness of Beach Nourishment in Response to Sea Level Rise
38
South County - St. Lucie County
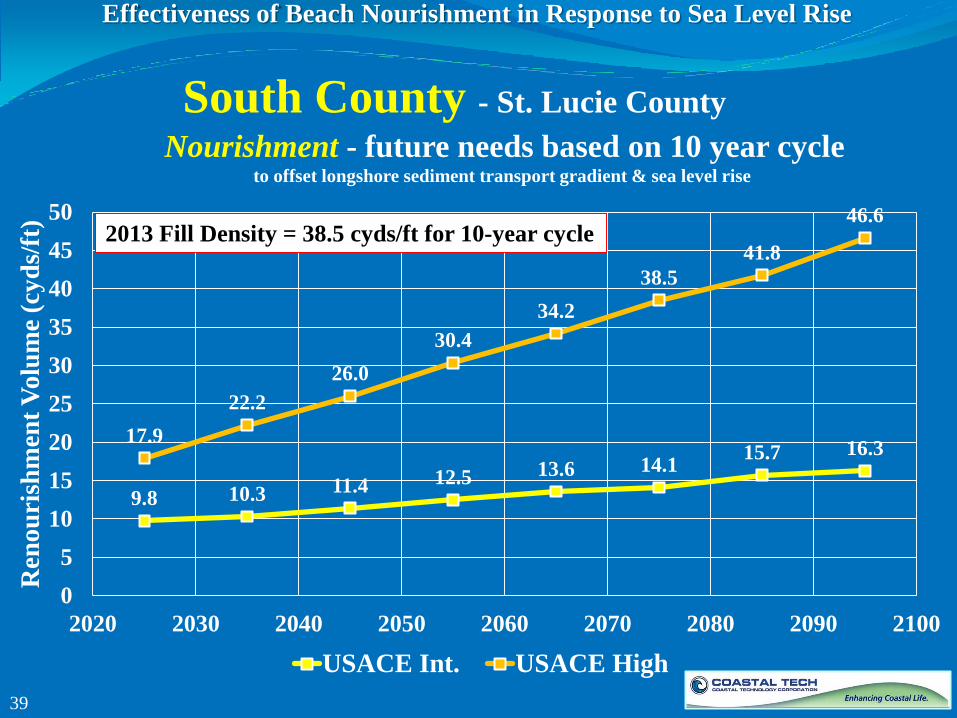
9.8 10.3 11.4 12.5 13.6 14.1 15.7 16.3
17.9
22.2
26.0
30.4
34.2
38.5
41.8
46.6
0
5
10
15
20
25
30
35
40
45
50
2020 2030 2040 2050 2060 2070 2080 2090 2100
Ren
ou
rish
men
t V
olu
me
(cy
ds/
ft)
USACE Int. USACE High
2013 Fill Density = 38.5 cyds/ft for 10-year cycle
Effectiveness of Beach Nourishment in Response to Sea Level Rise
39
South County - St. Lucie County
Nourishment - future needs based on 10 year cycle to offset longshore sediment transport gradient & sea level rise

-10.00
-5.00
0.00
5.00
10.00
15.00
20.00
-200 -150 -100 -50 0 50 100
Hei
gh
t a
bo
ve
MS
L (
ft)
Distance from MSL (ft)
R-101
Equilibrium Profile Zero Int Bruun Dean
36’
85’
Effectiveness of Beach Nourishment in Response to Sea Level Rise
40
No Action - Intermediate Sea Level Change - 2065
South County - St. Lucie County

-10.00
-5.00
0.00
5.00
10.00
15.00
20.00
-200 -150 -100 -50 0 50 100
Hei
gh
t a
bo
ve
MS
L (
ft)
Distance from MSL (ft)
R-101
Equilibrium Profile Zero High Bruun Dean
183’ 95’
Effectiveness of Beach Nourishment in Response to Sea Level Rise
41
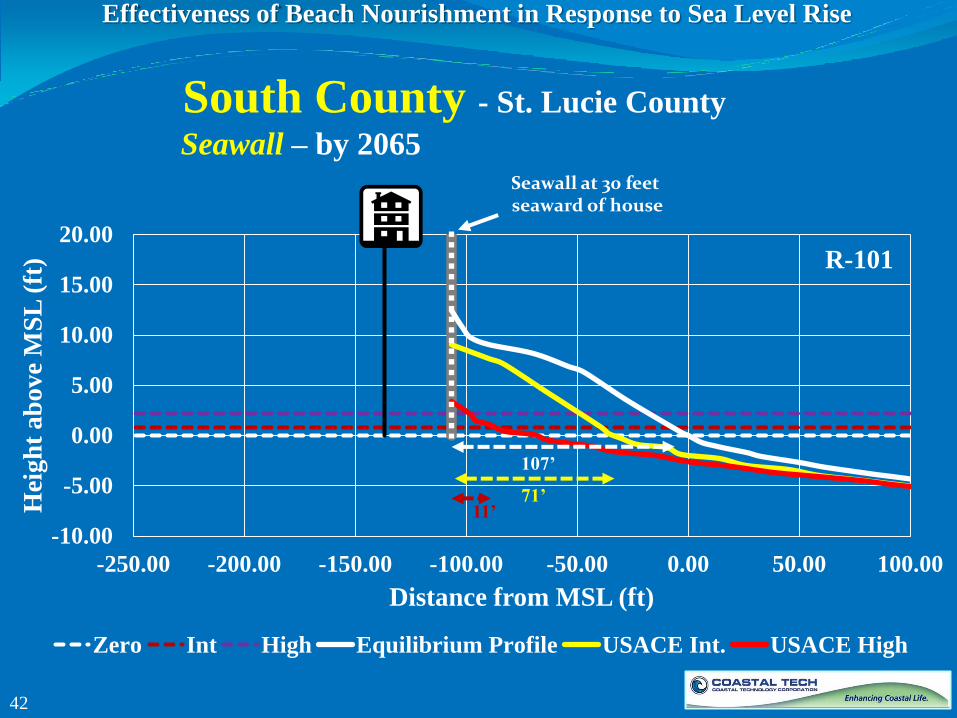
No Action – High Sea Level Change - 2065
South County - St. Lucie County
-10.00
-5.00
0.00
5.00
10.00
15.00
20.00
-250.00 -200.00 -150.00 -100.00 -50.00 0.00 50.00 100.00
Hei
gh
t a
bo
ve
MS
L (
ft)
Distance from MSL (ft)
R-101
Zero Int High Equilibrium Profile USACE Int. USACE High
Seawall at 30 feet seaward of house
71’ 11’
107’
Effectiveness of Beach Nourishment in Response to Sea Level Rise
42
South County - St. Lucie County
Seawall – by 2065

Shoreline Recession (feet / year)
Navarre
Beach
SRC1
Lovers
Key
Lee2
South
County
SLC3
Int. High Int. High Int. High
Bruun 0.81 2.24 1.49 3.97 0.72 1.91
Dean 2.45 5.35 0.67 1.94 1.70 3.65
Historic 1.0 4.4 0.56
1: Historic based on 1970 – 2008 surveys
2: Historic based on 1972 – 2008 surveys
3: Historic based on 1972 – 2006 surveys
Effectiveness of Beach Nourishment in Response to Sea Level Rise
Historic data from: Absalonsen, L. and Dean, R. G., 2010. “Characteristics of the Shoreline
Change Along the Sandy Beaches of the State of Florida: An Atlas.” 43
Florida
Shoreline
Recession
Summary

Effectiveness of Beach Nourishment in Response to Sea Level Rise
44
Summary
Alternative Protection Preserve Land Recreational Beach Habitat
Yes Yes Yes Yes
limited by Design MHWL fluctuates beach width fluctuates habitat fluctuates
No No Yes Somewhat
"demolished/ relocated" MHWL recedes width same & migrates loss of upland habitat
Yes Somewhat No No
limited by Design landward of seawall beach width diminishes loss of beach habitat
Beach Fill
Retreat
Seawall
Classic Beach Management Objectives
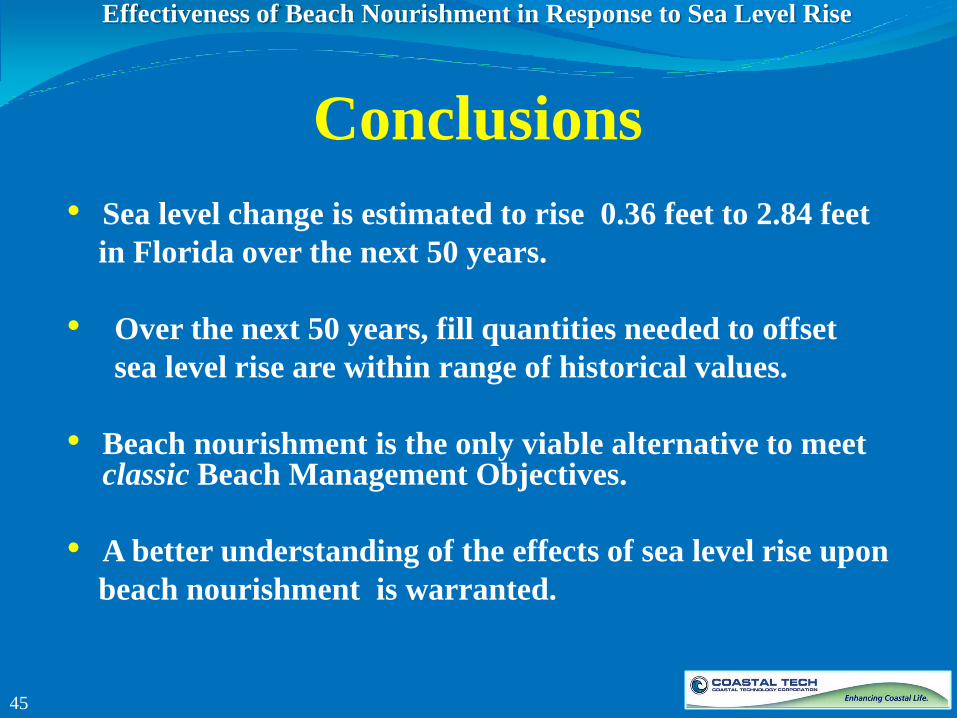
• Sea level change is estimated to rise 0.36 feet to 2.84 feet
in Florida over the next 50 years.
• Over the next 50 years, fill quantities needed to offset
sea level rise are within range of historical values.
• Beach nourishment is the only viable alternative to meet classic Beach Management Objectives.
• A better understanding of the effects of sea level rise upon
beach nourishment is warranted.
Effectiveness of Beach Nourishment in Response to Sea Level Rise
45
Conclusions

Thank you
Questions?
Effectiveness of Beach Nourishment in Response to Sea Level Rise
