effectiveness of eu-supported public urban transport projects
TRANSCRIPT

Special Report Effectiveness of EU-supported public urban transport projects
EN 2014 NO 01
EUROPEANCOURTOF AUDITORS

EUROPEAN COURT OF AUDITORS 12, rue Alcide De Gasperi 1615 Luxembourg LUXEMBOURG
Tel. +352 4398-1
E-mail: [email protected] Internet: http://eca.europa.eu
Twitter: @EUAuditorsECA YouTube: EUAuditorsECA
More information on the European Union is available on the Internet (http://europa.eu).
Luxembourg: Publications Office of the European Union, 2014
ISBN 978-92-9241-658-4doi:10.2865/30848
© European Union, 2014Reproduction is authorised provided the source is acknowledged.For any use or reproduction of photo 1, permission must be sought directly from the copyright holder.
Printed in Luxembourg

EN 2014 N0 01Special Report Effectiveness of
EU-supported public urban transport projects
(pursuant to Article 287(4), second subparagraph, TFEU)

02Contents
Paragraph
Glossary
I–III Executive summary
1–9 Introduction
1–3 The main urban transport challenges in Europe
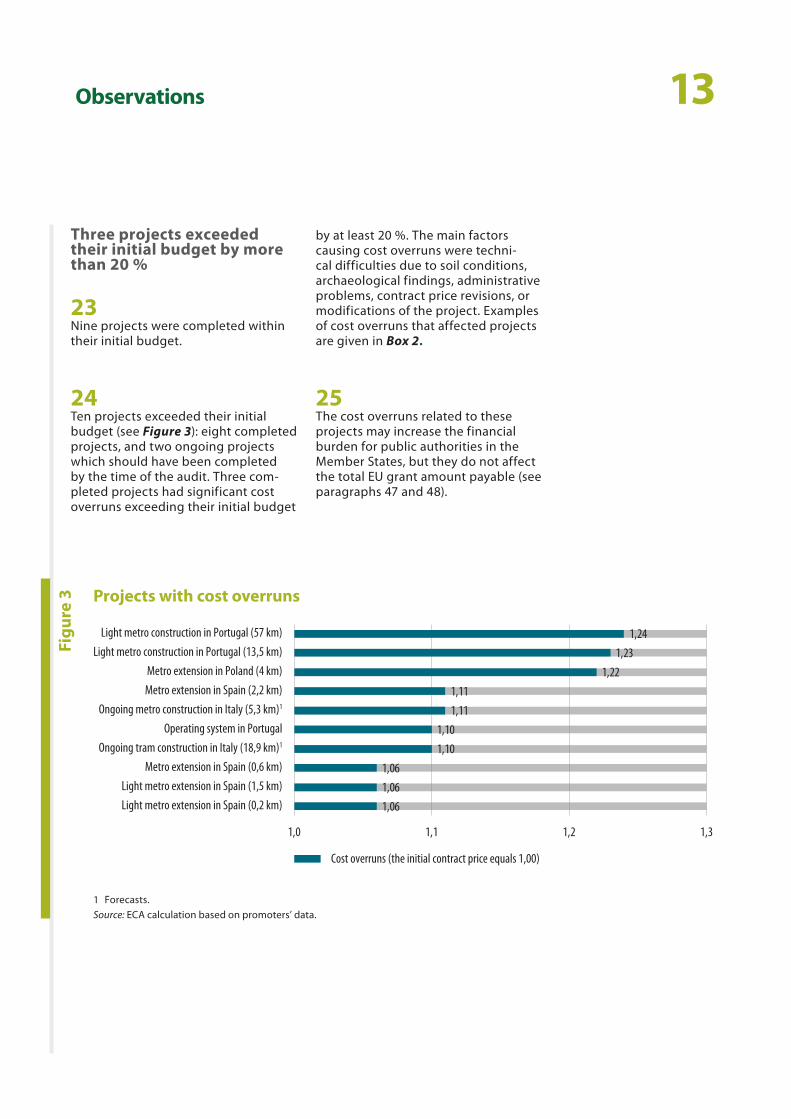
4–5 EU policy on urban transport
6–9 EU support for urban transport projects
10–16 Audit scope and approach
17–48 Observations
17–25 Were the projects implemented as planned in the grant applications?
20 Most projects were physically implemented
21–22 Four infrastructure projects had significant implementation delays
23–25 Three projects exceeded their initial budget by more than 20 %
26–34 Did the services provided by the projects meet user needs?
28–30 Feedback from operators’ monitoring indicators was positive
31–32 User satisfaction surveys, when available, had positive results
33–34 Transport services were generally accessible
35–48 Did the projects achieve their objectives in terms of utilisation?
37–38 Few projects have as many users as expected
39–41 Several causes of underutilisation could have been tackled
42–43 Underutilisation may affect the achievement of expected benefits …
44–46 … which is not monitored …
47–48 … and it may also increase the financial burden for the public authorities

03Contents
49–57 Conclusions and recommendations
50–52 Project implementation
53 Services provided by the projects
54–57 Utilisation of the projects
Annex I — EU urban transport policy: successive documents issued over the last decade
Annex II — Overview of audited projects at the time of the audit
Reply of the Commission

04Glossary
Cohesion Fund (CF): The CF provides financial assistance to increase economic and social cohesion in Member States with a per capita GNP of less than 90 % of the EU average by financing environment and transport projects.
European Regional Development Fund (ERDF): The ERDF provides financial assistance to promote economic and social cohesion between the regions of the EU. ERDF interventions are mainly implemented through operational programmes involving a large number of projects.
Managing authority: A national, regional or local public authority or a public or private body designated by the Member State to manage an operational programme.
Operational programme (OP): A Commission‑approved programme of EU‑funded investments by a Member State, which takes the form of a coherent set of priorities comprising multiannual measures under which projects are co‑financed.
Operator: A public or private firm running a mode of transport according to an operating contract signed with the project promoter. It usually receives subsidies to cover financial losses resulting from operations.
Programming period: The multiannual framework within which structural action expenditure is planned and implemented. The programming periods covered in this report are 2000–06 and 2007–13.
Promoter: A public legal person who is the beneficiary of ERDF or CF support to build a transport infrastructure or a related IT system. The mode of public transport and the equipment resulting from the project are often run by an operator other than the beneficiary.

05Executive summary
IThe proportion of the European population residing in urban areas is expected to increase from 73 % in 2010 to 82 % by 2050. Meanwhile, European cities need to enhance mobility and to reduce congestion, accidents and pollution through local mobility policies. The EU allocated 10,7 billion euro between 2000 and 2013 to co‑finance projects helping cities to implement urban transport such as metros, trams and buses.
IIThe Court assessed whether the projects were imple‑mented as planned, provided services that meet user needs and were used as much as expected. The Court audited the performance of 26 public urban transport projects directly in 11 cities in five Member States. The Court concludes the following.
(a) In general, infrastructure and vehicles for most projects were implemented in accordance with project specifications (paragraph 20). Significant delays affected four urban transport projects (paragraphs 21 and 22) and three projects had significant cost overruns (paragraphs 23 to 25).
(b) Once completed, almost all the projects audited met users’ needs (paragraphs 26 to 34). However, a comparison between planned use at specific dates and actual use shows that two thirds of the projects were underutilised (paragraphs 35 to 38). This implies underperformance in terms of economic and social benefits (reductions in pollution and congestion etc.) which is generally not followed up by the promoters or the national authorities (paragraphs 42 to 46). It may also imply financial imbalances for the public authorities that have to ensure the sustainability of the urban transport concerned (paragraphs 47 and 48).
(c) The underutilisation of public transport is mainly due to weaknesses in project design and mobility policy. Several could have been addressed at the project planning stage (paragraphs 39 to 41).
IIIThe Court recommends that the Commission should:
(a) for projects subject to its approval, require that management tools will be put in place to moni‑tor the quality of the service and the level of user satisfaction once the project is operational;
(b) for projects subject to its approval, require that a minimum number of result indicators with re‑lated targets are included in the grant agreements and are subsequently measured;
(c) for projects subject to its approval, require that the estimation of the number of expected users is more rigorously analysed and that the choice of the mode of transport is supported by a quanti‑fied comparison of different transport options;
(d) for projects subject to its approval, require that urban transport projects are included in a sound mobility policy;
(e) require that the aspects mentioned under points (a) to (d) are also addressed by the Member States’ authorities when managing EU‑funded urban transport projects.

06Introduction
The main urban transport challenges in Europe
01 The proportion of the European popu‑lation living in urban areas increased from 71 % in 2000 to 73 % in 2010. This trend is expected to continue, reach‑ing 82 % by 20501.
02 European cities are increasingly facing transport‑related problems. The migra‑tion of city dwellers to the suburbs is leading to settlement structures with long travel distances. This phenom‑enon of urban sprawl goes hand in hand with an increase in car ownership and commuter traffic.
03 Enhancing mobility while reducing congestion, accidents and pollution is a challenge common to all major cities. According to the Commission2, trans‑port congestion in and around urban areas costs nearly 100 billion euro each year, or 1 % of the EU’s GDP, due to delays and pollution. In addition, one in three fatal accidents happens in urban areas. Urban mobility accounts for 40 % of all CO2 emissions from road transport and up to 70 % of other pollutants. Noise in urban areas is also a serious and growing problem, mainly due to road traffic.
EU policy on urban transport
04 Over the last decade, the Commission has issued several policy papers on urban transport (see Annex I). Accord‑ing to a Commission communication the objective of sustainable urban transport is freedom of movement, health, safety and quality of life for current and future generations, as well as environmental efficiency and inclusive economic growth, access to opportunities and services for all, including less affluent, elderly or dis‑abled citizens3.
05 To this end, the Commission supports research, encourages better manage‑ment and disseminates good practices such as the establishment of urban mobility plans fostering modal shift, i.e. a reduction in the use of private cars and increased usage of public transport, as well as non‑motorised cycling and walking.
1 United Nations, Department of Economic and Social affairs, Population Division, ‘World urbanisation prospects: the 2011 revision’ (http://esa.un.org/unpd/wup/index.htm).
2 The data indicated in this paragraph are included in the Commission’s Green Paper ‘Towards a new culture for urban mobility’, COM(2007) 551 final of 25 September 2007.
3 COM(2004) 60 final of 11 February 2004, p. 45.

07Introduction
EU support for urban transport projects
06 The European Regional Development Fund (ERDF) and the Cohesion Fund (CF) may co‑finance urban transport projects in eligible regions of the Member States. The EU contribution, for urban transport projects, typically represents up to 85 % of the related eligible expenditure.
07 The EU funding allocated to urban transport for the 2000–06 and 2007–13 periods totals 10,7 billion euro, i.e. 2,9 billion euro and 7,8 billion euro, respectively. The total breakdown by Member State is provided in Figure 1.
Total ERDF and CF funding allocated to urban transport for the 2000–06 and 2007–13 programming periods (million euro)
2 8821 528
1 4141 073
726708
358346
290226
167152143
130126
9262
228
0 500 1 000 1 500 2 000 2 500 3 000
OtherGermanyRomaniaSlovakia
LithuaniaBulgaria
EstoniaLatvia
United KingdomFranceSpain
IrelandCzech Republic
ItalyPortugal
GreeceHungary
Poland
Total: 10 651 million euro
2000–06 2007–13
Figu
re 1
Source: ECA calculation based on European Commission data.

08Introduction
08 Co‑financed urban transport projects are included in the operational pro‑grammes (OPs) implemented by the Member States under shared manage‑ment arrangements. In particular:
(a) the Commission negotiates and approves OPs proposed by Member States, and allocates EU funding;
(b) the Member States manage the OPs, implementing them by select‑ing projects, and then overseeing and assessing these projects;
(c) the Commission assesses national management and control systems, monitors the implementation of OPs, commits the EU financial con‑tributions and pays them on the basis of approved expenditure;
(d) the Commission is required to ap‑prove specific individual projects submitted by the Member States. For the 2000–06 programming period the Commission’s approval was needed for every CF project, irrespective of the total cost, and ERDF projects whose total cost4 exceeded 50 million euro. For the 2007–13 programming period, one change made was that CF projects below 50 million euro5 were no longer subject to Commission approval.
09 The two Commission directorates‑ general (DGs) which play a significant role in the area of urban transport are:
(a) DG Regional and Urban Policy, which is responsible for the part of the EU budget that co‑finances urban transport projects. As part of its appraisal of specific projects, it consults other DGs, in particular DG Mobility and Transport;
(b) DG Mobility and Transport which is responsible for EU transport policy.
4 Total cost as stated in the grant application for each project.
5 From 1 January 2007 to 25 June 2010, the threshold was 25 million euro in the case of environment projects.

09Audit scope and approach
10 The main objective of this perform‑ance audit was to assess the imple‑mentation and effectiveness of public urban transport projects co‑financed by EU structural funds (hereafter re‑ferred to as ‘projects’).
11 The Court addressed the following questions.
(a) Were the projects implemented as planned in the grant applications?
(b) Did the services provided by the projects meet user needs?
(c) Did the projects achieve their ob‑jectives in terms of utilisation?
12 The audit covered a sample of 26 pro‑jects6 co‑financed by the ERDF or the CF during the 2000–06 and 2007–13 programming periods. The selected projects are located in 11 cities in five Member States — Spain, France, Italy, Poland and Portugal. The EU funding allocated to urban transport in these five countries (5,3 billion euro) rep‑resents 50 % of the total EU funding (10,7 billion euro). The sample includes projects that consisted of creating, extending or modernising railways (three), metros (eight), light metros7 (four), trams (six) and one bus project. They range from a single line or a sim‑ple section to a whole network. The sample also includes four smaller IT projects relating to operating, informa‑tion or ticketing systems (see Annex II).
13 For the 2000–06 and 2007–13 pro‑gramming periods, the projects subject to the approval of the Com‑mission represented 66 % and 78 % respectively of the total ERDF and CF funding allocated to urban transport (see paragraph 8(d)). The audit sam‑ple included 17 projects which were subject to this approval process. The remaining nine projects, including the four smaller IT projects, were approved by the managing authorities in the Member States.
14 At the time of the audit, 20 of the 26 projects were completed and oper‑ational. Three were not completed, two were partially completed and op‑erational, and one was recently com‑pleted but was not yet operational.
15 In order to identify audit standards and good practice in the area of urban transport, the Court consulted rep‑resentatives of several organisations with expertise in the area of urban transportation, including the UITP8 (Union Internationale des Transports Publics), the CERTU9 (Centre d’Études sur les Réseaux, les Transports, l’Urbanisme et les constructions pub‑liques) and Polis10.
6 The selection criteria were: project cost, project type and planned implementation dates.
7 Light metro is an intermediate system between tram and metro. It can be regarded as a medium‑capacity rapid transit system.
8 UITP is the international network for public transport authorities and operators, policy decision‑makers, scientific institutes and the public transport supply and service industry.
9 CERTU is responsible for carrying out studies in the fields of urban networks, transport, urban planning and public facilities on behalf of the French state or for the benefit of local authorities, public bodies, companies entrusted with public‑service commissions or the relevant professions (Decree 94‑134 of 9 February 1994).
10 Polis is a network of European cities and regions working together to deploy innovative technologies and policies for more sustainable mobility.

10Audit scope and approach
16 For each project, the audit team met representatives in the Member States of the relevant managing authority, project promoters in receipt of EU grants (usually local authorities) and operators (public or private compa‑nies) managing the mode of transport. They also used the co‑financed facil‑ities themselves and visited operating and maintenance centres.
Phot
o 1 Light metro in Portugal
© Metro Transportes do Sul.
11Observations
Were the projects implemented as planned in the grant applications?
17 When assessing whether the projects were implemented as planned in the grant applications, three aspects were considered by the Court, namely compliance with the provisions of the grant decisions in terms of physical implementation, timing and budget.
18 Four projects were completed before a grant was requested11 and were therefore excluded from the analysis. Another project was excluded because it was initially scheduled for comple‑tion in 2015. In addition, a number of other projects were not considered under each of the three criteria due to delays or non‑finalisation of the total project costs.
19 Finally, for this question, the audit covered 18 projects regarding phys‑ical implementation (paragraph 20), 21 concerning the respect of planned completion deadlines (paragraphs 21 and 22) and 19 in relation to total costs incurred (paragraphs 23 to 25).
Most projects were physically implemented
20 In 14 projects, infrastructure, equip‑ment and rolling stock were imple‑mented in accordance with the project specifications, while very minor dis‑crepancies were noted for three cases. For one other project about a third of the 70 information panels delivered in 2008 had still not been installed. The municipalities concerned withheld the required permission for various reasons, e.g. some required payment of a fee.
Four infrastructure projects had significant implementation delays
21 Eight projects met their deadline and seven were delayed by 9 months or less.
22 Six projects were significantly behind schedule, including four infrastructure projects (see Figure 2), with delays of between 2 and 4 years based on the latest forecasts. Examples of sig‑nificant delays affecting projects are outlined in Box 1.
11 For the EU to fund completed projects raises the risk of deadweight, and therefore of the EU added value of such funding. The Court notes that this issue has been addressed by the Commission in the legislative proposals for the 2014–20 financial framework.

12ObservationsFi
gure
2 Infrastructure projects with significant implementation delays
1 Forecasts.Source: ECA calculation based on promoters’ data.
Examples of significant delays affecting projects
ο The full commissioning of a light metro (Portugal) took place in November 2008, 3 years after the initial planned date. The main reason was the difficulty in making the necessary land available, even though it was owned by the municipalities.
ο The first line of a tram project (Italy) was completed in February 2010 with a slight delay of 3 months. Two additional lines were initially planned to be implemented by June 2012. Following the holding of a referen‑dum, the route was dramatically modified in order to avoid crossing the historic city centre. This resulted in the postponement of the implementation by a period of 4 years.
Box
1
0 1 2 3 4 5
Light metro construction in Portugal (13,5 km)
Tram construction in Italy (18,9 km)1
Metro extension in Italy (5,3 km)1
Delay in years
Light metro construction in Portugal(57 km)
13Observations
Three projects exceeded their initial budget by more than 20 %
23 Nine projects were completed within their initial budget.
24 Ten projects exceeded their initial budget (see Figure 3): eight completed projects, and two ongoing projects which should have been completed by the time of the audit. Three com‑pleted projects had significant cost overruns exceeding their initial budget
by at least 20 %. The main factors causing cost overruns were techni‑cal difficulties due to soil conditions, archaeological findings, administrative problems, contract price revisions, or modifications of the project. Examples of cost overruns that affected projects are given in Box 2.
25 The cost overruns related to these projects may increase the financial burden for public authorities in the Member States, but they do not affect the total EU grant amount payable (see paragraphs 47 and 48).
Figu
re 3 Projects with cost overruns
1,061,061,06
1,101,10
1,111,11
1,221,23
1,24
1,0 1,1 1,2 1,3
Light metro construction in Portugal (57 km)Light metro construction in Portugal (13,5 km)
Metro extension in Poland (4 km)Metro extension in Spain (2,2 km)
Ongoing metro construction in Italy (5,3 km)1
Operating system in PortugalOngoing tram construction in Italy (18,9 km)1
Metro extension in Spain (0,6 km)Light metro extension in Spain (1,5 km)Light metro extension in Spain (0,2 km)
Cost overruns (the initial contract price equals 1,00)
1 Forecasts.Source: ECA calculation based on promoters’ data.

14Observations
Did the services provided by the projects meet user needs?
26 Twenty‑one projects were reviewed under this heading (paragraphs 26 to 34), including one tram project where only one line out of three was oper‑ational. The remaining five projects were not operational at the time of the audit.
27 Based on surveys reviewed and on other feedback from project pro‑moters and operators, public transport services are satisfactory for users when they are punctual, frequent, reliable, comfortable, safe, clean, easily acces‑sible, affordable and provide appropri‑ate information. Operators’ monitoring indicators and user satisfaction surveys were reviewed in order to assess whether the services provided by the projects met user needs. Aspects of the accessibility of public transport were also considered.
Feedback from operators’ monitoring indicators was positive
28 Eighteen of the projects included indi‑cators (e.g. punctuality, cleanliness of vehicles and information for travellers) which were set and monitored by op‑erators and showed that the services offered by the projects were in line with the related targets set. The type and level of indicators varied between projects being basic and of limited value in some cases. Shortcomings in the services provided were identified in two cases (see Box 3).
Examples of cost overruns that affected projects
ο A metro extension (Poland) encountered a series of difficulties which increased the costs by 47 million euro (+ 22 %). These include the occurrence of particularly unfavourable ground conditions; an exceptional rise in the prices of services and building materials; the redesign of the roofs of buildings further to new legis‑lative standards; the use of modern vibration isolation methods; and a change in the designated function of a building.
ο The total cost of a light metro (Portugal) was 399 million euro, i.e. 75 million euro (+ 23 %) more than the initial budget. The cost overrun was borne by the state budget and corresponds to 48 million euro in price revisions and additional works, and 27 million euro to compensate the operator for loss of income over 3 years due to delays in releasing public land (see first example of Box 1).
Box
2

15ObservationsPh
oto
2 Train in Poland
29 Such indicators enable transport operators to take remedial action as necessary in order to improve the service provided to users. They can also be useful for operators in terms of operational efficiency. For example, in seven cases they led to an adjustment of transportation services to the actual demand.
30 In five cases, indicators which linked the remuneration of the transport operator to the quality of the service provided were contractually required by the project promoter. This is good practice and an example is provided in Box 4.
Shortcomings affecting the services offered
ο An increase in the number of trains with a delay of more than 5 minutes impacted negatively the punctu‑ality of a metro line (Italy). The audit also noted that there was no train timetable available for the public, either in stations or on the trains. There were no electronic displays of expected waiting times in any of the four metro stations resulting from the project. When a delay occurred, there was no public announcement or visual display to inform users.
ο The number of trains (Poland) circulating on the EU co‑financed rail track was 25 % lower than planned (three trains instead of four per hour). This was due to the limited capacity of the connecting rail track in the city centre, which led to congestion.
Box
3
Source: ECA.

16Observations
Example of good practice linking remuneration to quality of service
One metro operating contract (Portugal) has a wide range of indicators and targets relating to the service offered. They reflect the service offered, delays, functioning escalators, level of brightness, cleanliness of sta‑tions and vehicles, and the number of failures and signal problems. At first, the related targets were not met. The deficiencies mainly concerned punctuality, and occasionally cleanliness and the number of failures. This led to monthly penalties for the operator, ranging from 10 000 euro to 30 000 euro per month. The situation gradually improved and the target levels were consistently achieved for all indicators.
Box
4
User satisfaction surveys, when available, had positive results
31 User satisfaction surveys help to meas‑ure the quality perceived by users and are carried out with a view to giving the possibility of improving transport services. They can highlight the most satisfactory aspects and any concerns that need to be addressed. They can also show changes in the level of user satisfaction over time, and sometimes provide interesting comparisons between the various lines of a single network.
32 User satisfaction surveys were avail‑able for nine of the audited projects. The scores of the different surveys indicated a high level of satisfaction of public transport users.
Transport services were generally accessible
33 Based on a physical inspection, project stations and vehicles were generally easily accessible to pedestrians, push‑chairs and wheelchairs.
34 Based on a review of publicly disclosed information (e.g. Internet) all the ser‑vice providers for the audited projects offer special discount fares to favour access for certain classes of user such as students and jobseekers.

17Observations
Did the projects achieve their objectives in terms of utilisation?
35 Six projects were excluded from the assessment of this question due to their level of implementation. Para‑graphs 36 to 48 therefore concern 20 projects.
36 Apart from meeting user needs (see paragraphs 28 to 34), the most impor‑tant aspect to consider when assessing the performance of public transport is the level of usage, generally expressed in numbers of passengers, trips, kilo‑metres travelled or rate of occupancy. The modal shift, e.g. people who change their mode of transport from private car to tram, can also provide an indication of the success of public transport.
Few projects have as many users as expected
37 Targets and the corresponding data on the usage levels were available for 12 of the projects audited. A comparison between planned use at specific dates and actual use shows that only two reached the set target (see Box 5). The other 10 projects, including nine infra‑structure projects, failed to meet their targeted utilisation level demonstrat‑ing a dramatic rate of underutilisation in some cases (see Figure 4).
Two projects for which targets and data were available and which met their objectives
ο A new tram line (Italy) had 12,2 million passengers in 2012, i.e. 113 % of the target (10,8 million). According to its promoter, this result was mainly the result of good coordination with the bus network and integra‑tion of fares.
ο The annual number of trips on a bus network (France) was 99,2 % of the assumption for 2011 used in a socio‑economic analysis carried out in 2009. It increased by 12 %, from 4,3 million in 2008 (the year the project became operational) to 4,8 million in 2011 (the most recent measurement).
Box
5

18ObservationsFi
gure
4 Infrastructure projects with fewer users than forecast
87 %
72 %
72 %
63 %
35 %
32 %
32 %
18 %
2 %
0 % 20 % 40 % 60 % 80 % 100 %
Metro construction in Italy (2,2 km)1
Metro extension in Spain (3,3 km)
Light metro extension in Spain (0,2 km)
Light metro extension in Spain (1,5 km)
Light metro construction in Portugal (13,5 km)
Metro extension in Portugal (4,8 km)
Tram construction in France (8,5 km)
Tram construction in France (9,5 km)
Light metro construction in Portugal (57 km)
Rate of actual users compared to planned at speci�c dates
1 According to the promoter, the situation should improve with the completion of other sections of this metro line.Source: ECA calculation based on promoters’ data.
38 For the remaining eight projects without targets or corresponding data, the Court used other sources of infor‑mation to determine whether their
utilisation was satisfactory. For four of these projects, evidence of good performance was noted (examples in Box 6) while the other four showed evidence of poor performance.
Examples of projects for which targets were not available but where signs of good performance were noted
ο One project consisted of modernising two stretches of tramway (Poland). For one stretch, data before and after the project showed an increase in passengers of 49 % at rush hours, and 29 % on a working day.
ο For the new stretch of another tramway project (Poland), data showed that there were 2 500 passengers per hour at rush hours, and 35 700 per working day, which is considered satisfactory according to an avail‑able indicative benchmark12.
12 2 500 passengers for a tramway is consistent with the capacity spectrum established by the UITP for various modes of urban transport (http://www.btrust.org.za/library/assets/uploads/documents/2_Resource%20docs_Making%20the%20Right%20Choice.pdf).
Box
6

19Observations
Examples of causes of underutilisation
ο For a light metro (Portugal) of 58 stations replacing part of a bus network, the estimation of users was claimed by the promoter to be overstated by about 30 % because of the lack of a reliable system for counting bus users. The feasibility study had identified parking policy as crucial to achieving the expected demand and transfer from individual to collective transport. However, P + R parking at both ends of the north–south line and a terminal station for the bus outside the city were still lacking. Furthermore, park‑ing spaces were available at attractive prices in the city centre (the price in the city centre is the same as the P + R price, to which the price of a metro ticket should be added). The utilisation of the metro network is below expectations in terms of the number of passengers (87 %), the number of passengers switching from other modes of transport (55 %) and the occupancy rate (62 %). The occupancy rate for the last three stations of a line is below 5 %.
ο A new metro station (Spain) was constructed in response to strong public demand for an end to social isolation. The analysis of mobility needs prior to the project did not include a quantified comparison of dif‑ferent transport options. The number of users represents only 18 % of the target.
ο A new tram network (France) had 8,3 million passengers per year, i.e. 72 % of the target (11,6 million). Simultaneously, the use of private cars increased from 60 % of trips in 1997 to 65 % in 2011, whereas the objective of the urban mobility plan was already to reduce the figure to 59 % in 2005. According to the transport authority, demand for the tram is affected by the poor quality of the transportation services of‑fered by the bus network and by an inadequate parking policy. The number of parking spaces in the city centre increased by 17 % between 2005 and 2012, while it was already considered excessive in the 2005 plan de déplacement urbain (urban transport plan).
Box
7
Several causes of underutilisation could have been tackled
39 The main factors over which the promoter and/or local authorities had direct influence13 and which led to underutilisation of the projects audited can be classified in two categories: insufficiencies in project design (insufficient feasibility stud‑ies including overestimation of users) and, more importantly, weaknesses in mobility policy (lack of coordin‑ation between modes of transport and with parking policy, absence of urban mobility plan).
40 These factors affected the utilisation rates of 11 of the 14 projects which were assessed as being underutilised (paragraphs 37 and 38)14. Seven pro‑jects were approved by the Commis‑sion and four by the Member States’. Box 7 provides examples.
41 The causes of underutilisation could have been subject to a more thorough analysis during the project design and planning phase.
13 An external factor which may have impacted the utilisation of urban transport projects is the international economic and financial crisis.
14 As projects can be affected by multiple causes, a total of 23 occurrences were identified for these 11 projects.

20Observations
Underutilisation may affect the achievement of expected benefits …
42 The grant application for every project submitted to the Commission for approval includes expected benefits, other than the level of use, such as reductions in air pollution, noise, con‑gestion, accidents and oil consump‑tion, which in turn should have a wider positive impact on the environment, public health, growth and employ‑ment, in particular through reduced congestion.
43 These expected benefits are estimated by the project promoters on the basis of a key indicator such as the number of passengers switching from private cars to public transport. Therefore, if the utilisation rate for public transport projects does not meet the targets set, such benefits may also be affected.
… which is not monitored …
44 The expected benefits are taken into account in the social‑economic assess‑ment. They are an important factor for the decision to invest public money in urban transport projects, which are by nature financially non‑viable.
45 While initially estimated, there was no systematic follow‑up to determine the actual expected benefits achieved for the projects concerned.
46 Nevertheless, the auditors noticed in two of the cities they visited that a set of indicators on aspects influenced by the co‑financed projects was estab‑lished and subsequently monitored.
Phot
o 3 Tram in Italy
Source: ECA.

21Observations
… and it may also increase the financial burden for the public authorities
47 For all audited projects which are by nature not financially viable, op‑erational revenue did not fully cover running and maintenance costs with the deficit being funded by public subsidies15.
48 For the 14 underutilised projects, the fewer number of users than initially forecast led to lower revenue from ticket sales. This was offset by a public subsidy that was higher than planned, except in one case where the actual operational revenues exceeded expec‑tations because of tariff increases.
Phot
o 4 Tram and bus in France
Source: ECA.
15 For example, public subsidies represent 9 % of the annual budget for one light metro, 66 % for another one (against an expected 0 %), 68 % for a tram, and 75 % for a bus network.

22Conclusions and recommendations
49 The overall conclusion of the audit is that despite being implemented sat‑isfactorily and generally meeting user needs, EU co‑financed urban trans‑port projects are often underutilised, which has an impact on their overall performance.
Project implementation
50 For most projects, the infrastructure, equipment and rolling stock were im‑plemented in accordance with project specifications (paragraph 20).
51 Significant delays of between 2 and 4 years based on latest forecasts were encountered for four projects. Delays were due to natural or historic obsta‑cles, late modifications, coordination problems and delays in making land available (paragraphs 21 and 22).
52 Three projects had significant cost overruns in excess of 20 % due to delays, technical difficulties, adminis‑trative problems and a lack of coordin‑ation (paragraphs 23 to 25).
Services provided by the projects
53 Indicators monitored by the trans‑port operators and user satisfaction surveys, where available, indicate that the projects do meet user needs. However, not all audited projects benefited from the application of such management tools. Some good practices were identified, such as the inclusion of indicators in the operat‑ing contract between the promoter and the oper ator whose remuneration is then linked to the results achieved. The facilities and services provided by the projects were generally easily ac‑cessible (paragraphs 26 to 34).
Utilisation of the projects
54 40 % of the projects assessed lacked utilisation targets and/or data. This prevented measurement of the project utilisation rate, which is a key perform‑ance indicator for assessing the per‑formance of public transport projects (paragraph 37).
55 When information on utilisation was lacking, the Court gathered various other data in order to reach a con‑clusion about project performance. Overall, the Court considers that two thirds of the projects are underutilised (paragraphs 37 and 38).

23Conclusions and recommendations
56 Two main factors over which the pro‑moter and/or the local authorities have a direct influence, leading to underutil‑isation of most of the projects audited are weaknesses in project design and weaknesses in mobility policy (para‑graphs 39 to 41).
57 Having fewer passengers than expect‑ed also implies underperformance in terms of economic and social bene‑fits (e.g. pollution and congestion). However, this is generally not followed up by the promoters or the national authorities (paragraphs 42 to 46). This also implies that there may be a need for additional public funding in order to ensure the financial sustainability of the urban transport projects con‑cerned (paragraphs 47 and 48).
Recommendation 1
The Commission should, for projects subject to its approval, require that management tools will be put in place to monitor the quality of services and the level of user satisfaction once a project is operational, such as:
(a) a minimum set of indicators with related targets to be included in operating contracts and, where possible, a link between the oper‑ator’s remuneration and the results achieved;
(b) user satisfaction surveys, which would enable appropriate action to be taken so as better to meet users’ expectations.
Recommendation 2
The Commission should, for projects subject to its approval, require that a minimum number of result indicators with related targets are included in the grant agreements and are subsequent‑ly measured, so that:
(a) the utilisation rate of public trans‑port, which is a key performance indicator for this type of project, is monitored and assessed;
(b) expected benefits such as a reduc‑tion in pollution, noise and con‑gestion, and better road safety, are monitored and assessed.
Recommendation 3
The Commission should, for projects subject to its approval, require that the estimation of the number of expected users is more rigorously analysed and that the choice of the mode of trans‑port is supported by a quantified com‑parison of different transport options.

24Conclusions and recommendations
Recommendation 4
The Commission should, for projects subject to its approval, require that the projects are included in a mobility policy which:
(a) addresses the consistency of all modes and forms of transport, including parking policy, in the entire urban agglomeration;
(b) demonstrates that it is a priority and the most appropriate project;
(c) indicates to what extent it will contribute to its overall objectives (e.g. modal shift).
Recommendation 5
The Commission should also require that the aspects mentioned under rec‑ommendations 1 to 4 are addressed by the Member States’ authorities when managing EU‑funded urban transport projects.
This Report was adopted by Chamber II, headed by Mr Henri GRETHEN, Member of the Court of Auditors, in Luxembourg at its meeting of 5 February 2014.
For the Court of Auditors
Vítor Manuel da SILVA CALDEIRAPresident

25Annexes
EU urban transport policy: successive documents issued over the last decade
01 White paper 2001: European transport policy for 2010: Time to decide, COM(2001) 370 final.
02 Communication from the Commission to the Council, the European Parliament, the European Economic and Social Committee and the Committee of the Regions: Towards a thematic strategy on the urban environment, COM(2004) 60 final.
03 Communication from the Commission to the Council and the European Parliament on thematic strategy on the urban environment, COM(2005) 718 final.
04 Communication from the Commission to the Council and the European Parliament: Keep Europe moving — Sus‑tainable mobility for our continent. Mid‑term review of the European Commission’s 2001 Transport White Paper, COM(2006) 314 final.
05 Communication from the Commission: Action plan for energy efficiency: realising the potential, COM(2006) 545 final.
06 Commission Green Paper: Towards a new culture for urban mobility, COM(2007) 551 final.
07 Communication from the Commission to the European Parliament, the Council, the European Economic and Social Committee and the Committee of the Regions: Action plan on urban mobility, COM(2009) 490 final.
08 White paper: Roadmap to a single European transport area — Towards a competitive and resource‑efficient transport system, COM(2011) 144 final.
Ann
ex I

26Annexes
Overview of audited projects at the time of the audit
Country/City Project Operational
since
Total final3 cost
Eligible cost (A) EU grant
Project approved by COM or
MS4million euro % of (A)
Spain
Barcelona
Extension of metro Line 3 by 0,6 km and one station May 2001 82,5 19,3 5,5 28,5 % MS
Extension of metro Line 3 by 2,2 km and two stations Sep 2008 106,9 40,5 9,6 23,7 % MS
Extension of light metro Line 11 by 1,5 km and two stations Dec 2003 51,8 22,7 6,8 30,0 % MS
Extension of light metro Line 11 by 0,2 km and two stations Dec 2003 56,9 16,7 4,4 26,3 % MS
Madrid Extension of metro Line 11 by 3,3 km and one station Oct 2010 167,6 113,9 50,3 44,2 % COM
France
Le HavreConstruction of a 13 km tram route Not yet2 394,7 249,5 10,0 4,0 % COM
Operating and information system Partially 1,9 0,7 0,3 47,1 % MS
Val de Sambre Construction of a 8,4 km bus lanes Dec 2008 88,7 50,7 15,9 31,4 % COM
ValenciennesConstruction of a 9,5 km tram route, section 1 Jul 2006 263,7 106,1 5,1 4,8 % COM
Construction of a 8,5 km tram route, section 2 Sep 2007 67,8 45,4 7,5 16,5 % COM
Italy
FlorenceConstruction of a 18,9 km tram route for Lines 1, 2 and 3 Partially 688,0 159,9 53,3 33,3 % COM
Information system May 2012 0,3 0,3 0,1 33,3 % MS
Naples
Extension of metro L1 by 5,3 km and six stations Not yet 1 524,0 1 015,0 507,0 50,0 % COM
Construction of 2,2 km and four stations for Metro L6 Feb 2007 140,9 122,3 61,2 50,0 % COM
Extension of metro L6 by 3,3 km and four stations Due 2015 643,0 173,1 86,5 50,0 % COM
Poland1
KrakowModernisation/rebuilding of 4 km and purchase of 24 trams May 2008 63,7 51,9 25,7 49,5 % COM
Construction/rebuilding of 5,4 km and purchase of 24 trams Jun 2011 107,2 92,0 54,2 58,9 % COM
Warsaw
Extension of 4 km and four metro stations, Line 1 Oct 2008 261,7 189,8 80,1 42,2 % COM
Modernisation of 14 km rail connection to airport Sep 2008 65,1 52,5 13,7 26,1 % MS
Extension of 2 km rail connection to airport with tunnel Not yet2 91,5 72,1 50,5 70,0 % COM
Purchase of 13 trains for the rail connection to airport Nov 2011 86,2 69,7 41,1 59,0 % COM
Ann
ex II
27Annexes
Country/City Project Operational
since
Total final3 cost
Eligible cost (A) EU grant
Project approved by COM or
MS4million euro % of (A)
Portugal
LisbonExtension of metro Line B by 4,8 km and five stations Mar 2004 295,1 266,0 100,0 37,6 % COM
Construction of 13,5 km of light metro with 19 stations Nov 2008 352,9 265,0 79,5 30,0 % COM
Porto
Construction of 57 km of light metro with 58 stations Mar 2006 1 962,0 890,4 320,2 36,0 % COM
Integrated ticketing system Dec 2005 11,2 8,1 4,4 54,3 % MS
Operating and information system Dec 2006 11,2 9,7 5,3 54,6 % MS
Total 26 projects audited 7 586,50 4 103,30 1 598,23 39,6 %
1 Amounts for Polish projects were converted using an average exchange rate of 1 EUR= 4 PLN.2 These two projects were operational by the end of 2012.3 Figures in italics correspond to amounts approved at the project application stage.4 COM = Commission; MS = Member State.
Ann
ex II

28
Executive summary
II (a)The Commission welcomes the Court’s assessment that the implementation of most projects was in accordance with the project specifications.
The Commission welcomes that 15 out of the 21 projects analysed were operational on time or with a delay of 9 months or less, which the Commission considers to be slight for this type of project. Some delays in major infrastructure projects are often unavoidable.
The Commission considers that the delays in the four projects quoted were due to specific reasons out of the control of the project promoter and the Commission.
The Commission points out that the EU budget is not affected since cost overruns have to be covered by the national budget. It considers that many of the cost overruns were due to technical difficulties beyond the control of the project promoters.
II (b)The Commission welcomes the results of the audit concerning the users’ need.
There was significant underutilisation of infrastruc‑ture in five of the audited projects, with a utilisation rate of under 35 % of the expected data. For the other audited projects the utilisation rate is above 60 % of expected users.
Delays in the implementation of projects might lead also to delays in the achievement of targets concerning utilisation.
Public transport is the backbone of sustainable urban transport and contributes to a high degree of social inclusion. As such, support from public authorities is often an intended necessity.
Reply of the Commission
II (c)The Commission acknowledges the identified causes of underutilisation. However, transport is a derived demand and has a strong link with the economic situation. The possible impacts of the international economic and financial crisis were not predictable when analyses have been carried out at the design and planning phase. One of these impacts is on the mobility needs, which may have contributed to the underutilisation, as the signifi‑cant slowdown of demand in urban mobility could not have been foreseen during the project prepar‑ation phase.
Furthermore, the crisis has impacted the financial situation of the cities and possibly their ability to maintain and subsidise public services with a negative impact on the utilisation. In any case, all projects were audited early in their lifetime and additional measures can still be taken to increase utilisation in the future.
III (a)In relation to recommendations 1 to 4, the Com‑mission underlines that the appraisal and adoption procedure for major projects for the 2014–20 pro‑gramming period will allow for an early, upstream review of the projects by experts specialising in project management, CBA analysis and technical/engineering issues. The Commission is preparing delegated and implementing acts that will define various quality elements that need to be respected by all major projects. In addition, CBA guidance will be issued that will include practical recommenda‑tions for specific sectors and case studies to allow the beneficiaries to orientate their projects towards the best EU added value.
All the projects subject to the approval of the Commission have to go through a quality review, which will be carried out on the basis of a set of cri‑teria, either by the Commission or by independent experts (Jaspers paid from the technical assistance of the Commission or other entities nominated by Member States and agreed by the Commission).

Reply of the Commission 29
The Commission agrees with the Court that moni‑toring of the contribution of projects is essential for verifying the correct implementation of the programme. The managing authorities need to undertake evaluation (in line with evaluation plans) of the impact of the EU‑funded projects on the achievement of targets of the priority axis, but not in the grant agreement. Subsequently, the results achieved will be included and assessed in the annual and final implementation reports due to be submitted by Member States for each operational programme, when these elements are included as result indicators for the operational programme.
III (c)The Commission will ensure through the quality review of the proposals that the main alterna‑tives have been analysed and the best option was selected for the implementation, including justifica‑tion of the option chosen.
It will also ensure that the demand analysis (or business plan in case of productive investment), was based on reliable estimates and in line with the main demographic trends and developments in the respective sector to justify the need for the project and the overall capacity of the project facilities.
III (d)All major projects will have to demonstrate their contribution to objectives set at programme level to promote sustainable multimodal urban mobility as set out in Article 5(4)(e) of Regula‑tion (EU) No 1301/2013 (the ERDF regulation) and Article 4(a)(v) of Regulation (EU) No 1300/2013 (the Cohesion Fund regulation).
III (e)The Commission agrees that these aspects should be addressed by the managing authorities and will promote this practice.
The new cohesion policy framework is geared towards result orientation, and this also has an impact on the way major projects are appraised by the Commission. In the application form (which will be issued in the form of a Commission implement‑ing act), there will be a separate section where the projects need to present expected contributions to results and output indicators in the priority axis.
The Commission will propose, in the delegated act for quality review, conditions that Member States have to fulfil and confirm in the quality review report. This also includes feasibility and reliability of the demand analysis, justifying the need for the project and the overall capacity of the project facilities.
In line with the regulatory framework for the new programming period, all projects will include, where relevant, common output indicators. Result indicators will be agreed during the negotiation process of the programmes and will be set at the priority axis level, and then subsequently moni‑tored during the implementation period. However, the specific modalities of the evaluation and moni‑toring system, and in particular the contracting arrangements between the managing authorities and the operators, will be among the competences of the managing authority, as stated in Article 125(3)(c) of Regulation (EU) No 1303/2013. Where appropriate, the Commission will recommend that major projects have a minimum set of indica‑tors and perform ance‑based remuneration for the operator.
Where relevant to the project objectives, the Com‑mission will recommend that project promoters carry out user satisfaction surveys.
III (b)Through the quality review of the projects the Commission will ensure that projects subject to its approval will clearly present their contribution to the result indicators for monitoring progress.
The utilisation rate is not part of the common indicators requested to be monitored by Member States. However, the Commission will insist during the negotiations on the programmes on the inclu‑sion, where relevant, of ‘utilisation rate of public transport’ in the operational programmes dealing with public transport and consequently in their monitoring system done by Member States.

Reply of the Commission 30
28The Commission welcomes the finding that services offered by the projects were, in 18 out of 21 audited cases, monitored and in line with the related tar‑gets set.
Box 3 — first indentThe finding on the metro line in Italy referred to by the Court can be explained by the fact that the metro line and the complementary information system have not yet been completed. By 2015 the current insulated section will be part of the greater metro network.
Box 3 — second indentFor the finding on the train project in Poland referred to by the Court, the Commission acknow‑ledges that the frequency of trains does not cor‑respond to the assumptions used for the design of the project. The Commission will bring the mat‑ter to the Polish authorities in the framework of programme monitoring and will enquire as to the reasons for this modification.
Box 4The Commission welcomes the identification of good practices by the Court. The Commission will prepare guidance on cost–benefit analysis for the 2014–20 programmes that will include a case study on urban transport.
32The Commission welcomes that all available surveys showed a high level of satisfaction with the services provided.
Common reply to paragraphs 33 and 34 The Commission welcomes the positive finding.
Observations
20The Commission welcomes the Court’s assessment that most projects’ implementation was in accord‑ance with the project specifications.
21The Commission welcomes that 15 out of the 21 projects analysed were operational on time or with a delay of 9 months or less, which the Commission considers to be slight for this type of project. Some delays in major infrastructure projects are often unavoidable.
The Commission considers that significant delays were due to specific, unavoidable circumstances related to the individual projects, such as archae‑ological findings, the need for additional soil consolidation or a change in political leadership. Neither the project promoter nor the Commission services could have foreseen such causes.
Box 1 — second indentThe original track design of the Italian tram project referred to by the Court had been approved after public consultation. The political changes in the municipality and the following referendum in 2010 resulted in the modification of the original design for lines 2 and 3. Neither the project promoter nor Commission services could have foreseen this circumstance.
24The Commission is always concerned about cost overruns since they might affect the economy of a project. However, in large infrastructure projects additional costs are often difficult to avoid, despite accurate planning, surveys and soil inspections (see examples in Box 2).
25The Commission points out that the EU budget is not affected since cost overruns have to be covered by the national budget.

Reply of the Commission 31
Box 7 — third indentThe Commission acknowledges that better align‑ment of the bus services should have taken place together with a reduction of the parking places after the completion of the projects in France. Corrective measures are announced by the French public authorities in the end of 2013. They foresee to put in place new lines of public transport in order to expand the public network and to reduce parking places in the centre.
47Public transport is the backbone of sustainable urban transport and contributes to a high degree of social inclusion. As such, support from public authorities is often an intended necessity.
Conclusions and recommendations
49The Commission welcomes the overall audit result that projects generally meet user needs.
The Commission acknowledges the identified causes of underutilisation. However, transport is a derived demand and has a strong link with the economic situation. The possible impacts of the international economic and financial crisis were not predictable when analyses were carried out at the design and planning phase. One of these impacts is on the mobility needs, which may have contributed to the underutilisation, as the significant slowdown of demand in urban mobility could not have been foreseen during the project prepar ation phase. Furthermore, the crisis has impacted the financial situation of the cities and possibly their ability to maintain and subsidise public services, with a nega‑tive impact on utilisation. In any case, all projects were audited early in their lifetime, and additional measures can still be taken to increase utilisation in the future.
37The Commission is of the opinion that the bene‑ficiaries should give greater importance on the def inition of key performance indicators.
There was significant underutilisation of infrastruc‑ture in five of the audited projects, with a utilisation rate of under 35 % of the expected data. For the Italian project, the situation should improve at the end of 2015 once the line is incorporated into the network as planned.
For the other audited projects the utilisation rate is above 60 % of expected users.
Delays in the implementation of projects might also lead to delays in the achievement of targets concerning utilisation.
See reply to paragraphs 39 and 40.
Common reply to paragraphs 39 and 40The Commission acknowledges the identified causes of underutilisation. However, the possible impacts of the international economic and finan‑cial crisis were not predictable when analyses were carried out at the design and planning phase. One of these impacts is on the mobility needs, which may have contributed to the underutilisation, as the significant slowdown of demand in urban mobility could not have been foreseen during the project preparation phase. Furthermore, the crisis has impacted the financial situation of the cities and possibly their ability to maintain and subsidise pub‑lic services, with a negative impact on utilisation. In any case, all projects were audited early in their lifetime, and additional measures can still be taken to increase utilisation in the future.
See reply to paragraph 37.
41See reply to paragraphs 39 and 40.

Reply of the Commission 32
For the other audited projects the utilisation rate is above 60 % of expected users.
Delays in the implementation of projects might also lead to delays in the achievement of targets concerning utilisation.
56See Commission reply to paragraph 49.
57Public transport is the backbone of sustainable urban transport and contributes to a high degree of social inclusion. As such, support from public authorities is often an intended necessity.
Recommendation 1In relation to recommendations 1 to 4, the Com‑mission underlines that the appraisal and adoption procedure for major projects for the 2014–20 pro‑gramming period will allow for an early, upstream review of the projects by experts specialising in project management, CBA analysis and technical/engineering issues. The Commission is preparing delegated and implementing acts that will define various quality elements that need to be respected by all major projects. In addition, CBA guidance will be issued that will include practical recommenda‑tions for specific sectors and case studies to allow the beneficiaries to orientate their projects towards the best EU added value.
All the projects subject to the approval of the Commission have to go through a quality review, which will be carried out on the basis of a set of cri‑teria, either by the Commission or by independent experts (Jaspers paid from the technical assistance of the Commission or other entities nominated by Member States and agreed by the Commission).
The new cohesion policy framework is geared towards result orientation, and this also has an impact on the way major projects are appraised by the Commission. In the application form (which will be issued in the form of a Commission implement‑ing act), there will be a separate section where the projects need to present expected contributions to results and output indicators in the priority axis.
50The Commission welcomes the Court’s assessment that the implementation of most projects was in accordance with the project specifications.
51The Commission welcomes that 15 out of the 21 projects analysed were operational on time or with a delay of 9 months or less, which the Commission considers to be slight for this type of project. Some delays in major infrastructure projects are often unavoidable.
The Commission considers that the delays in the four projects quoted were due to specific reasons out of the control of the project promoter and the Commission.
52The Commission points out that the EU budget is not affected since cost overruns have to be covered by the national budget. It considers that many of the cost overruns were due to technical difficulties beyond the control of the project promoters (see paragraph 24).
53The Commission welcomes the finding that services offered by the projects were, in 18 out of 21 audited cases, monitored and in line with the related tar‑gets set, that all available surveys showed a high level of satisfaction with the services provided and that facilities and services provided by the projects were generally easily accessible.
54The Commission agrees that the beneficiaries should give greater importance to the definition of key performance indicators.
55There was significant underutilisation of infrastruc‑ture in five of the audited projects, with a utilisation rate of under 35 % of the expected data. For one project, the situation should improve at the end of 2015 once the line is incorporated in the network as planned.

Reply of the Commission 33
Recommendation 2 (b)The Commission agrees with the Court that monitoring of contribution of projects is essential for verifying the correct implementation of the programme. The managing authorities need to undertake evaluation (in line with evaluation plans) of the impact of the EU‑funded projects on the achievement of targets of the priority axis, but not in the grant agreement. Subsequently, the results achieved will be included and assessed in the annual and final implementation reports due to be submitted by Member States for each operational programme, when these elements are included as result indicators for the operational programme.
Recommendation 3The Commission will ensure through the quality review of the proposals that the main alterna‑tives have been analysed and the best option was selected for the implementation, including justifica‑tion of the option chosen.
It will also ensure that the demand analysis (or business plan in case of productive investment), was based on reliable estimates and in line with main demographic trends and developments in the respective sector to justify the need of the project and the overall capacity of the project facilities.
Recommendation 4All major projects will have to demonstrate their contribution to objectives set at programme level to promote sustainable multimodal urban mobil‑ity as set out in Article 5(4)(e) of Regulation (EU) No 1301/2013 (the ERDF regulation) and Article 4(a)(v) of Regulation (EU) No 1300/2013 (the Cohesion Fund regulation).
Recommendation 5The Commission agrees that these aspects should be addressed by the managing authorities and will promote this practice.
The Commission will propose, in the delegated act for quality review, conditions that Member States have to fulfil and confirm in the quality review report. This also includes feasibility and reliability of the demand analysis, justifying the need for the project and the overall capacity of the project facilities.
Recommendation 1 (a)In line with the regulatory framework for the new programming period, all projects will include, where relevant, common output indicators. Result indicators will be agreed during the negotiation process of the programmes and will be set at the priority axis level, and then subsequently moni‑tored during the implementation period. However, the specific modalities of the evaluation and moni‑toring system, and in particular the contracting arrangements between the managing authorities and the operators, will be in the competences of the managing authority, as stated in Article 125(3)(c) of Regulation (EU) No 1303/2013. Where appro‑priate, the Commission will recommend for major projects to have a minimum set of indicators and performance‑based remuneration for the operator.
Recommendation 1 (b)Where relevant to the project objectives, the Com‑mission will recommend that project promoters carry out user satisfaction surveys.
Recommendation 2Through the quality review of the projects the Commission will ensure that projects subject to its approval will clearly present their contribution to the result indicators for monitoring progress.
Recommendation 2 (a)The utilisation rate is not part of the common indicators requested to be monitored by Member States. However, the Commission will insist during the negotiations on the programmes on the inclu‑sion, where relevant, of ‘utilisation rate of public transport’ in the operational programmes dealing with public transport and consequently in their monitoring system done by Member States.


HOW TO OBTAIN EU PUBLICATIONS
Free publications:
• onecopy: via EU Bookshop (http://bookshop.europa.eu);
• morethanonecopyorposters/maps: from the European Union’s representations (http://ec.europa.eu/represent_en.htm); from the delegations in non‑EU countries (http://eeas.europa.eu/delegations/index_en.htm); by contacting the Europe Direct service (http://europa.eu/europedirect/index_en.htm) or calling 00 800 6 7 8 9 10 11 (freephone number from anywhere in the EU) (*).(*) The information given is free, as are most calls (though some operators, phone boxes or hotels may charge you).
Priced publications:
• viaEUBookshop(http://bookshop.europa.eu).
Priced subscriptions:
• viaoneofthesalesagentsofthePublicationsOfficeoftheEuropeanUnion (http://publications.europa.eu/others/agents/index_en.htm).nts/index_en.htm).

QJ‑A
B‑14‑001‑EN‑C
ISSN 1831‑0834
The EU allocated 10,7 billion euro between 2000 and 2013 to co-finance projects helping cities to implement urban transport such as metros, trams and buses. In this report, the Court assessed whether projects were implemented as planned, provided services that meet user needs and were used as much as expected.
EUROPEANCOURTOF AUDITORS