effectiveness of selected diesel particulate matter ... · and analysis ... 21. size distribution...
TRANSCRIPT
TM
RI 9667
REPORT OF INVESTIGATIONS/2006
Effectiveness of Selected
Diesel Particulate Matter Control
Technologies for Underground Mining
Applications: Isolated Zone Study, 2003
Department of Health and Human Services Centers for Disease Control and Prevention National Institute for Occupational Safety and Health
Report of Investigations 9667 Effectiveness of Selected Diesel Particulate Matter Control Technologies for Underground Mining Applications: Isolated Zone Study, 2003
By Aleksandar D. Bugarski, Ph.D., George H. Schnakenberg, Jr., Ph.D., James D. Noll, Ph.D., Steven E. Mischler, Larry D. Patts, Jon A. Hummer, and Shawn E. Vanderslice
DEPARTMENT OF HEALTH AND HUMAN SERVICES Centers for Disease Control and Prevention
National Institute for Occupational Safety and Health Pittsburgh Research Laboratory
Pittsburgh, PA
May 2006

ORDERING INFORMATION
Copies of National Institute for Occupational Safety and Health (NIOSH) documents and information
about occupational safety and health are available from
NIOSH–Publications Dissemination 4676 Columbia Parkway
Cincinnati, OH 45226–1998
FAX: 513–533–8573 Telephone: 1–800–35–NIOSH
(1–800–356–4674) e-mail: [email protected]
Website: www.cdc.gov/niosh
This document is in the public domain and may be freely copied or reprinted.
—————————————————————
Disclaimer: Mention of any company or product does not constitute endorsement by the National Institute for Occupational Safety and Health (NIOSH). In addition, citations to Web sites external to NIOSH do not constitute NIOSH endorsement of the sponsoring organizations or their programs or products. Furthermore, NIOSH is not responsible for the content of these Web sites.
DHHS (NIOSH) Publication No. 2006–126
CONTENTS Page Abstract ............................................................................................................................... 1 Introduction......................................................................................................................... 2 Objectives ........................................................................................................................... 3 Methodology....................................................................................................................... 3
Tested vehicles and emissions control technologies....................................................... 4 Vehicles and engines................................................................................................... 4 Preparation of vehicles for the study……..…….……………………………….……4 Control technologies ................................................................................................... 5 Fuel formulations ...................................................................................................... 14
Isolated zone testing...................................................................................................... 18 The test site ............................................................................................................... 19 Duty cycles................................................................................................................ 23 Ventilation................................................................................................................. 24
Equipment, instrumentation, and methods for ambient sampling, measurements, and analysis................................................................................................................. 25 Standard sampling method for elemental carbon (EC)............................................. 25 High-volume sampling for EC.................................................................................. 25 DPM concentration measurements with a TEOM series 1400a ambient particulate monitor ................................................................................................. 27 Measurement of size distribution and particle number concentrations using a scanning mobility particle sizer ............................................................................. 27 Concentration of CO, NO and NO2 measured by an Industrial Scientific iTX multigas monitor .................................................................................................... 28 Downstream concentrations of CO and CO2 measured by an Innova 1312 photoacoustic multigas monitor............................................................................. 29 Measurements of exhaust temperature and engine back pressure ............................ 29 Measurement of ambient temperature and barometric pressure ............................... 29 Measurements of ventilation rates ............................................................................ 30 Analysis of samples collected using standard and high-volume methods................ 31 Sampling and measurement methodology ................................................................ 32 Sampling strategy...................................................................................................... 34 Calculation of the effects of control technologies .................................................... 35
Exhaust emission testing............................................................................................... 37 Engine operating conditions ..................................................................................... 37 Equipment, instrumentation, and methods for measurement of exhaust pipe
emissions………………………………………………………………………….38 Results and discussion ...................................................................................................... 40
Results of isolated zone tests ........................................................................................ 40 Ventilation rates ........................................................................................................ 40 Effects of control technologies on EC concentrations.............................................. 45 Effects of control technologies on TPM ................................................................... 47 Effects of control technologies on particle size distribution and number
concentration.......................................................................................................... 48

Effects of control technologies on ambient concentrations of CO, CO2, NO, and NO2.................................................................................................................. 55
Effects of filtration systems on exhaust temperature and engine back pressure....... 63 Results of tailpipe emissions measurements................................................................. 66
Particulate matter emissions: EC .............................................................................. 66 Particulate matter emissions: Bacharach smoke number.......................................... 68 Emissions of CO, CO2, NO, and NO2....................................................................... 69
Summary ........................................................................................................................... 74 References......................................................................................................................... 77
ILLUSTRATIONS
1. Engelhard DPX DPF system on truck #92128 ............................................................ 9 2. CleanAIR Systems DPF system on truck #92133 ..................................................... 10 3. DCL BlueSky DPF system on LHD #92506 ............................................................. 11 4. Mac’s Mining Repair filtration system on LHD #92506 used for testing
Donaldson P604516 and Filter Services DFEs....................................................... 12 5. ECS Cattrap DPF system on LHD #92526................................................................ 13 6. DCL MINE–X Sootfilter DPF system on haul truck #99942.................................... 14 7. Mixing and storage vessels for B20 and B50 biodiesel #2 diesel fuel blends........... 15 8. Fueling station in isolated zone.................................................................................. 17 9. Isolated zone at the SMC Nye Mine .......................................................................... 20
10. The isolated zone and duty cycles for trucks #92128 and #92133 ............................ 21 11. The isolated zone and duty cycles for LHDs #92506, #92526, and #99942 ............. 22 12. The high-volume DPM sampling train ...................................................................... 26 13. Downstream sampling station showing instrumentation and grid supporting DPM samplers, anemometer, and iTX gas monitor................................................ 31 14. Distribution of samplers across sampling station showing the locations of the high-volume sampling heads and three standard samplers..................................... 33 15. Ventilation rates for the tests involving #92128 ........................................................ 40 16. Ventilation rates for the tests involving #92133 ........................................................ 41 17. Ventilation rates for the tests involving #92506 ........................................................ 41 18. Ventilation rates for the tests involving #92526 ........................................................ 42 19. Ventilation rates for the tests involving #99942 ........................................................ 42 20. TPM concentrations at the downstream sampling station for the baseline test on LHD #99942 ........................................................................................................... 48 21. Size distribution of aerosols in mine air for truck #92128: the baseline case and and Engelhard DPX DPF case (three measurements for each test) .......................... 51 22. Size distribution of aerosols in mine air for LHD #99942: the baseline case DCL MINE–X DPF case (three measurements for each)....................................... 51 23. Size distribution of aerosols in mine air for truck #92506: the baseline 1 case (two measurements) and baseline 2 case (three measurements)............................. 52 24. Size distribution of aerosols in mine air for LHD #92526: the baseline case and Engelhard PTX DOC + muffler case (two measurements each) ............................ 53
ii
25. Size distribution of aerosols in mine air for LHD #92526 equipped with Engelhard PTX DOC and muffler: #2 diesel, biodiesel B20, and biodiesel B50 (two measurements each) ................................................................................................ 54 26. Size distribution of aerosols in mine air for LHD #99942 equipped with muffler: #1 diesel and #2 diesel (three measurements each) ................................................ 55 27. Normalized CO2 concentrations for the tests with LHD #92506 .............................. 57 28. Normalized CO2 concentrations for the tests with LHD #92526 .............................. 58 29. Normalized CO2 concentrations for the tests with LHD #99942 .............................. 58 30. Normalized NO concentrations for the tests with LHD #92526................................ 59 31. Normalized NO concentrations for the tests with LHD #99942................................ 60 32. Normalized NO2 concentrations at the downstream sampling station for the tests with haul truck #92128 ........................................................................................... 61 33. Normalized NO2 concentrations at the downstream sampling station for the tests with LHD #99942 ................................................................................................... 61 34. Normalized NO2 concentrations at the downstream and vehicle sampling stations for the baseline (#1 diesel) and DCL MINE–X DPF system tests with LHD
#99942……………………………………………………………………………..62 35. Temperature frequency distribution and cumulative frequency distribution used to determine T30 for haul truck #92133 during CleanAIR DPF system test ............... 63 36. Exhaust temperature and engine back pressure trace recorded during the isolated zone test of the CleanAIR DPF system................................................................... 65 37. Reduction of EC emissions at TCS............................................................................ 68
TABLES
1. Vehicles from the SMC Nye Mine inventory equipped with DPF systems prior to the study.................................................................................................................... 6 2. Vehicles from the SMC Nye Mine inventory that were retrofitted with DPF
systems as part of the study ...................................................................................... 7 3. Results of fuel analysis .............................................................................................. 16 4. Fuel used in this study................................................................................................ 18 5. Tests performed in the isolated zone ......................................................................... 19 6. Ventilation rate coefficients and normalized contributions of the test vehicles/
configurations to CO2 concentrations ..................................................................... 43 7. Effects of control technologies on VR-normalized net EC concentrations ............... 45 8. Effects of control technologies on CO2-normalized net EC concentrations.............. 46 9. Concentrations of TPM under 0.8 µm at the downstream sampling station.............. 47
10. Effects of control technologies on concentration of aerosols in mine air.................. 50 11. Concentrations of CO, CO2, NO, and NO2 at the downstream sampling station normalized to the MSHA ventilation rate for the test engine used......................... 56 12. Results of analysis of exhaust temperatures and engine back pressures ................... 64 13. Effects of control technologies on elemental carbon emissions ................................ 67 14. Effects of control technologies on DPM emissions: Bacharach smoke number ....... 69 15. CO tailpipe emissions ................................................................................................ 70 16. CO2 tailpipe emissions............................................................................................... 71 17. NO tailpipe emissions ................................................................................................ 72 18. NO2 tailpipe emissions............................................................................................... 73
iii
ACRONYMS AND ABBREVIATIONS USED IN THIS REPORT
ACGIH American Conference of Governmental Industrial Hygienists ASTM American Society for Testing and Materials B20 biodiesel blend, 20% biodiesel and 80% #2 diesel B50 biodiesel blend, 50% biodiesel and 50% #2 diesel BL baseline CAT Caterpillar, Inc. CDT Clean Diesel Technologies, Inc. (Stamford, CT) Ce-Pt cerium-platinum CFR Code of Federal Regulations CH4 methane CCO2 net contribution of the tested vehicle to air concentrations of
carbon monoxide CECCO2 net contribution of the tested vehicle to air concentrations of
elemental carbon per carbon monoxide concentrations C[ECCO2]CT net CO2-normalized concentrations of elemental carbon for control
technology (CT) case C[ECCO2]BL net CO2-normalized concentrations of elemental carbon for
baseline (BL) case Ci net contribution of the tested vehicle to air concentrations of
pollutant for control technology case Ci BL net contribution of the tested vehicle to air concentrations of
pollutant for baseline case ci measured concentration ci,VR ventilation-adjusted concentrations ci VR,DOWN ventilation-adjusted concentrations at the downstream sampling
station ci,UP measured concentration at the upstream sampling station CO carbon monoxide CO2 carbon dioxide CPC condensation particle counter CT control technology CV coefficient of variation D_p particle diameter DFE disposable filter element dN/(d log D_p) normalized particle number concentration DOC diesel oxidation catalyst DPF diesel particulate filter DPM diesel particulate matter EC elemental carbon GMD geometric mean diameter GSD geometric standard deviation HC hydrocarbon He helium
iv

v
HEPA high-efficiency particulate air (filter) hh:mm:ss hours : minutes : seconds (absolute time) HI high idle HV high-volume IMA–NA Industrial Minerals Association–North America ISO International Organization for Standardization LHD load-haul-dump LI low idle LOQ limit of quantification MARG Methane Advisory Research Group MSHA Mine Safety and Health Administration MTI Mining Technologies International (Sudbury, Ontario, Canada) N/A not available NIOSH National Institute for Occupational Safety and Health NMA National Mining Association NO nitric oxide NO2 nitrogen dioxide NPT national pipe thread NSSGA National Stone, Sand and Gravel Association O2 oxygen OC organic carbon PC personal computer PRL Pittsburgh Research Laboratory (NIOSH) Pt platinum SMC Stillwater Mining Co. SMPS scanning mobility particle sizer SS stainless steel STEL short-term exposure limit (ACGIH) SwRI Southwest Research Institute (San Antonio, TX) T30 exhaust temperature exceeded 30% of the time TCS torque converter stall TEOM tapered-element oscillating microbalance TLV threshold limit value (ACGIH) TPM total particulate matter TWA time-weighted average (ACGIH) USBM U.S. Bureau of Mines USWA United Steelworkers of America VR ventilation rate VRj, MSHA MSHA-prescribed ventilation rate VRC ventilation rate coefficient

UNIT OF MEASURE ABBREVIATIONS USED IN THIS REPORT
cm centimeter cm2 square centimeter ft foot ft3/min cubic foot per minute g/m3 gram per cubic meter g/mL gram per milliliter gal gallon hp horsepower hr hour in inch in H2O inches of water kg kilogram kJ/kg kilojoule per kilogram kPa kilopascal kW kilowatt L liter L/min liter per minute lb pound m meter m3 cubic meter m3/min cubic meter per minute m3/s cubic meter per second min minute mm millimeter mm2/s square millimeter per second nm nanometer oz ounce ppm part per million s second V ac volt, alternating current yd3 cubic yard µg/m3 microgram per cubic meter µg/m3/ppm microgram per cubic meter per parts per million µm micrometer % vol percent by volume % wt percent by weight #/cm3 particle number per cubic centimeter °C degree Celsius °F degree Fahrenheit
vi
EFFECTIVENESS OF SELECTED
DIESEL PARTICULATE MATTER CONTROL TECHNOLOGIES FOR UNDERGROUND MINING APPLICATIONS:
ISOLATED ZONE STUDY, 2003
By Aleksandar D. Bugarski, Ph.D.,1
1Mechanical engineer.
George H. Schnakenberg, Jr., Ph.D.,2
2Research physicist.
James D. Noll, Ph.D.,3
3Research chemist.
Steven E. Mischler,4 Larry D. Patts,4
4Physical scientist.
Jon A. Hummer,5 and Shawn E. Vanderslice5
5Engineering technician. Pittsburgh Research Laboratory, National Institute for Occupational Safety and Health, Pittsburgh, PA.
ABSTRACT The National Institute for Occupational Safety and Health designed and conducted a study in an underground metal mine to assess the effects of selected diesel emissions control technologies on the concentrations of diesel particulate matter and gases in underground mine air. The control technologies studied included diesel particulate filter (DPF) systems, filtration system with disposable filter elements, diesel oxidation catalytic converter, and biodiesel blends. Each technology was tested on a mining vehicle operated in an isolated area of an underground mine supplied with fresh air. These isolated zone tests allowed for the operation of vehicles under conditions and over duty cycles that closely mimic actual duty cycles of production equipment. The DPF systems reduced the elemental carbon (EC) concentrations in mine air between 88% and 99%. The same systems reduced total particulate matter (TPM) concentrations in mine air by approximately 75%. The biodiesel blends B20 and B50 caused a reduction in the EC concentrations of 26% and 48%, respectively. Those blends also reduced TPM concentrations by 9% and 24%, respectively. The use of #1 diesel fuel reduced EC concentration by 13% compared to #2 diesel fuel. An increase in nitrogen dioxide concentration of up to two times was seen when platinum-catalyzed DPF systems were tested.

INTRODUCTION
The National Institute for Occupational Safety and Health (NIOSH) designed and conducted a study in an isolated area of an underground metal mine to assess the effects of selected diesel emissions control technologies on the concentrations of diesel particulate matter (DPM) and gases in underground mine air. The study was organized under the auspices of the Metal/Nonmetal Diesel Partnership formed by NIOSH, the National Mining Association (NMA), the National Stone, Sand and Gravel Association (NSSGA), the United Steelworkers of America (USWA), the MARG Diesel Coalition, and the Industrial Minerals Association–North America (IMA–NA). The objective of the study was to provide real-world information on the performance of selected control technologies. This information is critical to making an informed selection of technically and economically feasible controls to curtail particulate matter emissions from existing and new diesel-powered vehicles in underground metal and nonmetal mines. This study is one facet toward the ultimate goal of reducing the exposures of underground mine workers to DPM and other diesel emissions, which have been recognized as an occupational health concern. This study was needed because most of the current knowledge on the performance of diesel particulate filter (DPF) systems and other diesel emissions control technologies was obtained through laboratory and in-use evaluations of technologies designed primarily for on-highway applications. According to our best knowledge, only two comprehensive studies have offered insight into the problems associated with the use of modern DPF systems on underground mining vehicles. One study was conducted at Noranda, Inc.’s Brunswick Mining and Smelting Mine near Bathurst, New Brunswick, Canada, the other at Inco, Ltd.’s Stobie Mine in Sudbury, Ontario, Canada [McGinn 2001; Bugarski and Schnakenberg 2001, 2002]. Both studies were conducted under the sponsorship of the Diesel Emissions Evaluation Program.6
6The Diesel Emissions Evaluation Program (DEEP) is a research consortium aimed at reducing exposure to diesel exhaust in underground mining (www.deep.org).
The U.S. mining industry expressed concern that this rather limited knowledge is not sufficient to help select, with confidence, the appropriate emissions control technology needed to comply with the rule limiting exposure of underground metal and nonmetal miners to DPM (30 CFR7
7Code of Federal Regulations. See CFR in references.
57.5060). The partnership agreed that a series of comprehensive field evaluations of DPFs in several underground mines was needed to establish confidence in the performance of DPF systems and other DPM-reducing controls and to determine their viability. NIOSH and Stillwater Mining Co. (SMC) personnel developed a test protocol and selected the control technologies for the isolated zone study. The series of tests comprising the study was conducted at the SMC Nye Mine in southern Montana from May 19, 2003, to May 30, 2003. The 2-week study was conducted by a team consisting of NIOSH researchers and SMC personnel from the industrial hygiene, maintenance, and operations departments. Representatives of the partnership and the Mine Safety and Health Administration (MSHA) were present during some portions of the effort. This document is a comprehensive report of this study.
2

OBJECTIVES The objective of this study was to determine the in situ effectiveness of the selected technologies available to the underground mining industry for reducing particulate matter and gaseous emissions from diesel-powered equipment. Each technology was tested on a mining vehicle, operated under conditions that closely resembled actual production scenarios, in an isolated area of an underground mine supplied with fresh air (isolated zone). The study was designed to provide SMC and the general mining community with better insights into the performance of control technologies and enable them to identify the appropriate technology for reducing emissions from diesel-powered equipment. The focus of this study was on technologies that offer solutions for reducing DPM emissions. The following control technologies were studied: DPFs, disposable DPM filters, diesel oxidation catalytic converter, and reformulated fuels. This short-term study addressed some issues related to the selection and installation of filtration systems, but was not able to address the other important issues related to the implementation and operation of DPFs, namely, equipment-specific installation problems, regeneration of DPF systems during the production cycle, maintenance, reliability, and durability. Addressing these issues will require more comprehensive and complex long-term studies that address the multiplicity of issues concerning implementation. The primary technical objective of this study was to assess the effects of selected control technologies on concentrations of DPM and gases in the mine air. Most of this effort was dedicated to evaluating the performance of selected state-of-the-art DPF systems that were designed and supplied by several major manufacturers. Additional efforts were made to assess the effect of two different biodiesel blends (B20 and B50), #1 and #2 diesel, and selected diesel oxidation catalyst (DOC) on air quality and emissions.
METHODOLOGY A limited set of vehicles representative of those from the Nye Mine production fleet were selected to test selected control technologies. With the assistance of the vehicle operators, the study team developed a typical duty cycle for each of the two types of production vehicles selected. Each test consisted of operating the test vehicle in the isolated zone repeatedly over the appropriate duty cycle while a set of measurements of DPM and gases was conducted upwind, downwind, and on the vehicle. The ventilation air quantity was measured and controlled for each test. The isolated zone measurements were complemented with measurements of DPM and gas concentrations in the exhaust system of the tested vehicles obtained while the vehicles were parked in the Nye Mine surface shop and their engines operated at three steady-state conditions.
3

TESTED VEHICLES AND EMISSIONS CONTROL TECHNOLOGIES
Vehicles and Engines
4
SMC selected the diesel equipment to represent typical vehicles and power packages from the SMC Nye Mine production fleet. The selected vehicles—two trucks and three load-haul-dump (LHD) vehicles—are classified as heavy-duty production machines. These vehicles were representative of (1) the mine fleet, (2) the duty cycle for that type of vehicle, and (3) their effect on mine air quality. The engines powering these vehicles are also representative of the fleet. Some of the selected vehicles represent those of the fleet that routinely heavily load their engines, while others are assumed to represent those that perform tasks that produce less of a load on the engines. A short description of the vehicles used in this study follows. MTI DT–1604 Trucks #92128 and #92133 MTI DT–1604 (Mining Technologies International, Sudbury, Ontario, Canada) is a truck with rated load of 14,545 kg (32,000 lb) and box capacity of 8.2 m3 (10.8 yd3). Truck #92128 is powered by a Deutz BF6M 1013FC, and truck #92133 is powered by a BF6M 1013ECP. MTI LT–350 LHD #92506 MTI LT–350 LHD has a rated load of 3,409 kg (7,500 lb) and bucket capacity of 1.9 m3 (2.5 yd3). This model is powered by a Deutz BF4M 1013C. Caterpillar Elphinstone R1300 LHD #92526 Caterpillar Elphinstone R1300 (Caterpillar Elphinstone Pty. Ltd., Burnie, Tasmania, Australia) LHD has a rated load of 6,500 kg (14,333 lb) and bucket capacity of 2.8 m3 (3.7 yd3). This particular vehicle is powered by a Caterpillar CAT 3306 DITA engine rated at 123 kW (165 hp). At the SMC Nye Mine, the #92526 and similar vehicles are typically used at a draw point for loading MTI DT 1604 trucks. Caterpillar Elphinstone R1500 LHD #99942 Caterpillar Elphinstone R1500 LHD has a rated load of 10,200 kg (22,491 lb) and bucket capacity of 4.8 m3 (6.3 yd3). This unit is powered by a Caterpillar CAT 3306 DITA engine rated at 164 kW (220 hp). At the SMC Nye Mine, the #99942 and similar vehicles are typically used at a draw point for loading MTI DT 1604 trucks.
Preparation of Vehicles for the Study
The major modifications to the vehicles/engines were those related to the temporary installation of various exhaust system configurations. The DPF systems on vehicles #92128 and #99942 were permanently installed on those vehicles as replacements to the
5
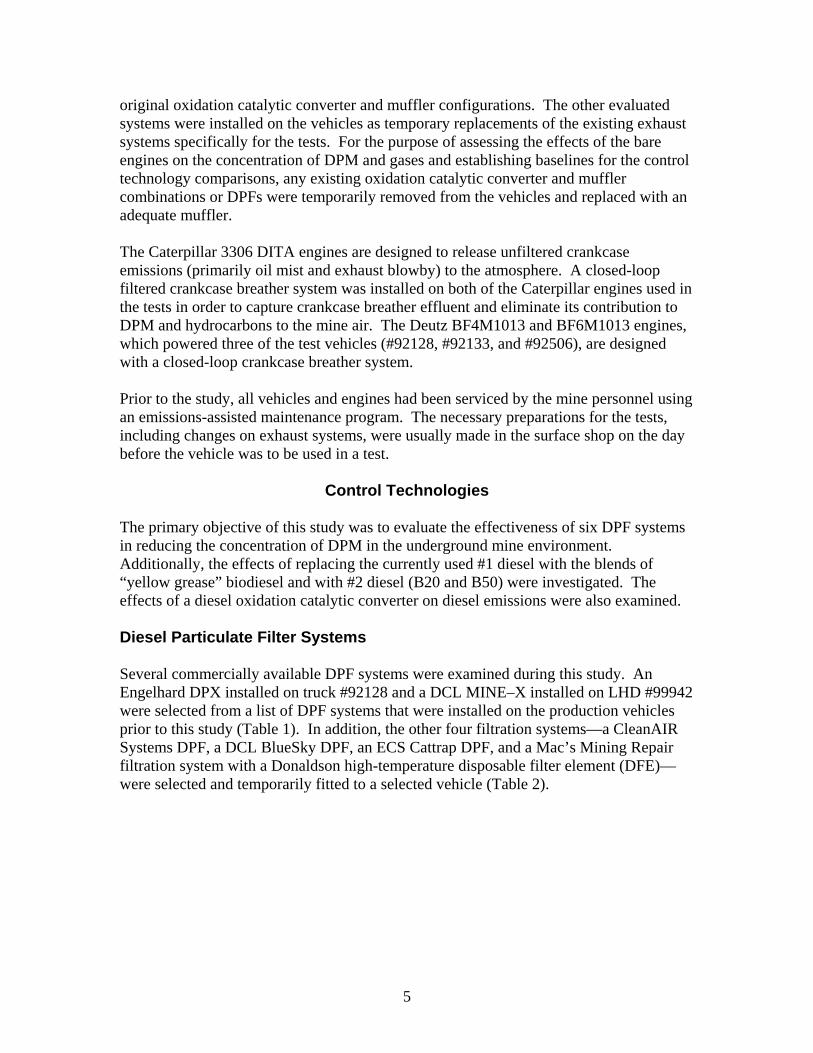
original oxidation catalytic converter and muffler configurations. The other evaluated systems were installed on the vehicles as temporary replacements of the existing exhaust systems specifically for the tests. For the purpose of assessing the effects of the bare engines on the concentration of DPM and gases and establishing baselines for the control technology comparisons, any existing oxidation catalytic converter and muffler combinations or DPFs were temporarily removed from the vehicles and replaced with an adequate muffler. The Caterpillar 3306 DITA engines are designed to release unfiltered crankcase emissions (primarily oil mist and exhaust blowby) to the atmosphere. A closed-loop filtered crankcase breather system was installed on both of the Caterpillar engines used in the tests in order to capture crankcase breather effluent and eliminate its contribution to DPM and hydrocarbons to the mine air. The Deutz BF4M1013 and BF6M1013 engines, which powered three of the test vehicles (#92128, #92133, and #92506), are designed with a closed-loop crankcase breather system. Prior to the study, all vehicles and engines had been serviced by the mine personnel using an emissions-assisted maintenance program. The necessary preparations for the tests, including changes on exhaust systems, were usually made in the surface shop on the day before the vehicle was to be used in a test.
Control Technologies
The primary objective of this study was to evaluate the effectiveness of six DPF systems in reducing the concentration of DPM in the underground mine environment. Additionally, the effects of replacing the currently used #1 diesel with the blends of “yellow grease” biodiesel and with #2 diesel (B20 and B50) were investigated. The effects of a diesel oxidation catalytic converter on diesel emissions were also examined. Diesel Particulate Filter Systems Several commercially available DPF systems were examined during this study. An Engelhard DPX installed on truck #92128 and a DCL MINE–X installed on LHD #99942 were selected from a list of DPF systems that were installed on the production vehicles prior to this study (Table 1). In addition, the other four filtration systems—a CleanAIR Systems DPF, a DCL BlueSky DPF, an ECS Cattrap DPF, and a Mac’s Mining Repair filtration system with a Donaldson high-temperature disposable filter element (DFE)— were selected and temporarily fitted to a selected vehicle (Table 2).

Table 1.—Vehicles from the SMC Nye Mine inventory equipped with DPF systems prior to the study
Vehicle #
Vehicle Type
Engine Manu facturer
Engine Model
Vent. Rate, m3/s
(ft3/min)
DPF Manu facturer
DPF Model
DPF Brand
Name
DPF Media Type
DPF Media Size,
cm × cm (in × in)
DPF Regener
ation
91580 Locomotive Deutz BF6M
1013FC 5.66
(12,000) Engelhard 9308 DPX Cordierite
26.7× 30.5
(10.5× 12.0)
platinum washcoat
91582 Locomotive Deutz BF6M
1013ECP 5.66
(12,000) Engelhard 9308 DPX Cordierite
26.7× 30.5
(10.5× 12.0)
platinum washcoat
92054 Wagner
ST–2D LHD
Deutz BF4M 1013FC
3.77 (8,000) DCL 5C57
11 MINE–
X Cordierite
22.9× 30.5 (9.0×
12.0)
platinum washcoat
92122 MTI DT–
1604 haul truck
Deutz BF4M 1013FC N/A Engelhard 9308 DPX Cordierite
26.7× 30.5
(10.5× 12.0)
platinum washcoat
92128 MTI DT–
1604 haul truck
Deutz BF6M 1013FC
5.66 (12,000) Engelhard 9308 DPX Cordierite
26.7× 30.5
(10.5× 12.0)
platinum washcoat
92130 MTI DT–
1604 haul truck
Deutz BF6M 1013ECP
5.66 (12,000) Engelhard 9308 DPX Cordierite
26.7× 30.5
(10.5× 12.0)
platinum washcoat
92131 MTI DT–
1604 haul truck
Deutz BF6M 1013ECP
5.66 (12,000) Engelhard 9308 DPX Cordierite
26.7× 30.5
(10.5× 12.0)
platinum washcoat
92135 MTI DT–
1604 haul truck
Deutz BF6M 1013ECP
5.66 (12,000) Engelhard 9308 DPX Cordierite
26.7× 30.5
(10.5× 12.0)
platinum washcoat
92140 EJC 515 haul truck Deutz BF6M
1013ECP 5.66
(12,000) Engelhard 9308 DPX Cordierite
26.7× 30.5
(10.5× 12.0)
platinum washcoat
92535
Elphinstone
R–1300 LHD
CAT 3306 DITA
4.72 (10,000) DCL 5C57
11 MINE–
X Cordierite
22.9× 30.5 (9.0× 12.0)
platinum washcoat
92608 MTI LT– 270 LHD Deutz BF4M
1012C 3.07
(6,500) DCL 5C57 11
MINE– X Cordierite
22.9× 30.5 (9.0× 12.0)
platinum washcoat
6
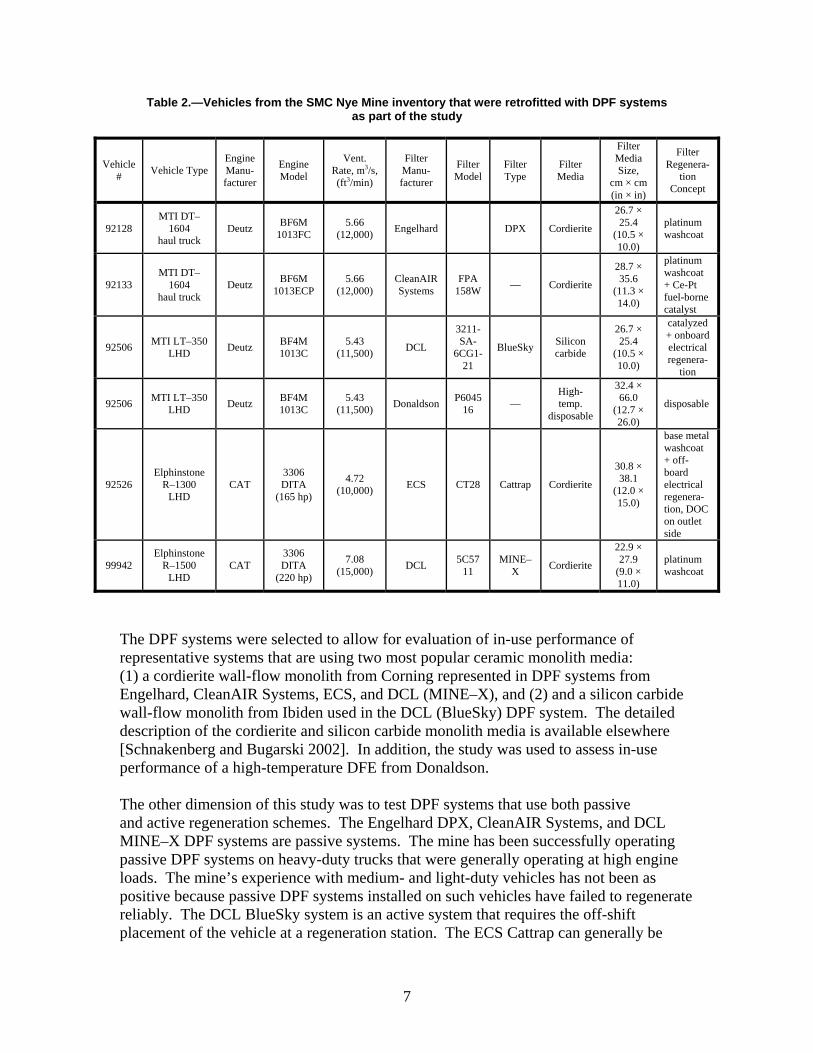
Table 2.—Vehicles from the SMC Nye Mine inventory that were retrofitted with DPF systems as part of the study
Vehicle # Vehicle Type
Engine Manufacturer
Engine Model
Vent. Rate, m3/s, (ft3/min)
Filter Manufacturer
Filter Model
Filter Type
Filter Media
Filter Media Size,
cm × cm (in × in)
Filter Regenera
tion Concept
92128 MTI DT–
1604 haul truck
Deutz BF6M 1013FC
5.66 (12,000) Engelhard DPX Cordierite
26.7 × 25.4
(10.5 × 10.0)
platinum washcoat
92133 MTI DT–
1604 haul truck
Deutz BF6M 1013ECP
5.66 (12,000)
CleanAIR Systems
FPA 158W — Cordierite
28.7 × 35.6
(11.3 × 14.0)
platinum washcoat + Ce-Pt fuel-borne catalyst
92506 MTI LT–350 LHD Deutz BF4M
1013C 5.43
(11,500) DCL
3211SA
6CG121
BlueSky Silicon carbide
26.7 × 25.4
(10.5 × 10.0)
catalyzed + onboard electrical
regeneration
92506 MTI LT–350 LHD Deutz BF4M
1013C 5.43
(11,500) Donaldson P6045 16 —
High-temp.
disposable
32.4 × 66.0
(12.7 × 26.0)
disposable
92526 Elphinstone
R–1300 LHD
CAT 3306 DITA
(165 hp)
4.72 (10,000) ECS CT28 Cattrap Cordierite
30.8 × 38.1
(12.0 × 15.0)
base metal washcoat + off-
board electrical regeneration, DOC on outlet side
99942 Elphinstone
R–1500 LHD
CAT 3306 DITA
(220 hp)
7.08 (15,000) DCL 5C57
11 MINE–
X Cordierite
22.9 × 27.9
(9.0 × 11.0)
platinum washcoat
The DPF systems were selected to allow for evaluation of in-use performance of representative systems that are using two most popular ceramic monolith media: (1) a cordierite wall-flow monolith from Corning represented in DPF systems from Engelhard, CleanAIR Systems, ECS, and DCL (MINE–X), and (2) and a silicon carbide wall-flow monolith from Ibiden used in the DCL (BlueSky) DPF system. The detailed description of the cordierite and silicon carbide monolith media is available elsewhere [Schnakenberg and Bugarski 2002]. In addition, the study was used to assess in-use performance of a high-temperature DFE from Donaldson. The other dimension of this study was to test DPF systems that use both passive and active regeneration schemes. The Engelhard DPX, CleanAIR Systems, and DCL MINE–X DPF systems are passive systems. The mine has been successfully operating passive DPF systems on heavy-duty trucks that were generally operating at high engine loads. The mine’s experience with medium- and light-duty vehicles has not been as positive because passive DPF systems installed on such vehicles have failed to regenerate reliably. The DCL BlueSky system is an active system that requires the off-shift placement of the vehicle at a regeneration station. The ECS Cattrap can generally be
7

classified as an active/passive system because it is primarily regenerated passively, and although it requires periodic active cleaning and regeneration, the period between those corresponds to regular engine maintenance and thus poses little operational burden. The Donaldson filter element is disposable, and it is designed to be replaced with a fresh one each time engine back pressure caused by the DPM loaded element exceeds that specified by engine manufacturers for each individual engine model. The newly introduced DPF systems were installed on the vehicles and used in production for at least 2 days prior to testing in the isolated zone. This time was used to (1) verify the performance of the system with respect to DPF regeneration, (2) examine various operational issues, and (3) condition the DPF medium. The Donaldson filters were new and had virtually no running time on them prior to testing. A detailed description of the tested filtration systems follows. Engelhard DPX DPF System The Engelhard DPX DPF (Engelhard Corp., Iselin, NJ) (Figure 1) uses a Corning cordierite wall-flow monolith filter element that has been “washcoated” with a proprietary platinum-based catalyst. Theoretically, the DPF should passively (spontaneously during the course of vehicle operation) regenerate (burn off the accumulated DPM) during an engine’s duty cycle if the exhaust temperature exceeds 350 °C for an extended period (at least 30% of the engine’s operating time). Although the system is designed primarily for control of DPM emissions, significant reductions in emissions of carbon monoxide (CO) and unburned hydrocarbons are expected owing to the platinum-based catalyst. Recent studies [Schnakenberg and Bugarski 2001] showed that some platinum washcoated filters promoted the oxidation of nitric oxide (NO) to nitrogen dioxide (NO2). Although several similar systems were used on production vehicles at the Nye Mine for extended periods of time, NO2 emissions were not quantified by mine personnel. This DPF had accumulated approximately 4,600 hr in production before being tested in this study.
8

Figure 1.—Engelhard DPX DPF system on truck #92128.
CleanAIR Systems DPF System The CleanAIR Systems DPF system (CleanAIR Systems, Inc., Santa Fe, NM) (Figure 2) uses a Corning cordierite wall-flow monolith filter element washcoated with a proprietary platinum-based catalyst. The system is used in conjunction with a fuel additive from Clean Diesel Technologies, Inc., Stamford, CT, called Platinum Plus. This bimetallic catalyst that contains both platinum and cerium can be used effectively at a dosage level substantially lower than other fuel-borne catalysts. Theoretically, the DPF system, with this fuel-borne catalyst, should passively regenerate during the duty cycle, which results in exhaust temperatures over 330 °C for extended periods (at least 30% of the operating time) of the cycle. According to the manufacturer, this system does not promote conversion of NO to NO2. The system is perceived as a viable alternative to platinum-catalyzed DPF systems such as Engelhard DPX and DCL MINE–X that are known for their tendency to increase secondary emissions of NO2. The fuel additive was mixed into the fuel tank of the test vehicle during fueling. The recommended dosage of 30 oz for 125 gal of fuel was used. The system was delivered several weeks before the study, installed on truck #92133, and had accumulated approximate 200 hr of run time prior to testing.
9

Figure 2.—CleanAIR Systems DPF system on truck #92133.
DCL BlueSky DPF System The DCL BlueSky (DCL International, Inc., Concord, Ontario, Canada) system (Figure 3) is designed as an active system that partially regenerates during the regular duty cycle and requires periodic regeneration using heat supplied by an onboard electrical heater. The heating coils are placed at the inlet end of the filter element. During the regeneration, the vehicle needs to be parked next to the offboard regeneration station that provides the power and combustion air needed for the electrical regeneration process. The system uses a silicon carbide wall-flow monolith filter element with thermal properties that allow regeneration in less than 2 hr. The frequency and duration of regeneration sessions are primarily affected by engine DPM emissions and therefore by engine design, mechanical condition, and nature of the duty cycle. This particular system was made available for the study by the SMC East Boulder Mine. The system was decommissioned from the original application prior to this study because the heating element had failed and the vehicle operators were not able to regenerate the DPF. SMC personnel had replaced the heating element, and the system was installed on LHD #92506 (see Figure 3). Owing to the limited space available on the vehicle, the system was installed as a temporary arrangement and was used only in this study. The system was removed following the tests and not placed into production because, in part, the mine was unable to provide the necessary infrastructure in production zones to support an onboard electrically regenerated system.
10

Figure 3.—DCL BlueSky DPF system on LHD #92506.
Donaldson P604516 DFE in Mac’s Mining Repair Filtration System At the time of study, the Donaldson P604516 high-temperature DFE from Donaldson Co., Inc., Minneapolis, MN, was in the developmental stage. Since this DFE was designed to handle between 8.5 and 11.3 m3/min (300 and 400 ft3/min) of exhaust, two DFEs in parallel were needed to handle the exhaust flow rate of the Deutz BF4L1013C engine (Figure 4). DFEs were used as part of a filtration system that was designed and built by Mac’s Mining Repair, Huntington, UT. Owing to the limited space available on the vehicle, the system was temporarily installed on LHD #92506. This DFE uses a deep-bed filter that collects particulate matter throughout its depth and generates relatively low exhaust back pressure when new. The filter medium is resistant to water and/or other combustion byproducts. It has been designed for exhaust temperatures up to 343 °C (650 °F). The filtration system was removed from the test vehicle shortly after the trial. The filter was run for approximately 2 hr prior to the test. The filtration efficiency of such a DFE can be expected to increase during the first several hours of operation. Shortly after the study, this high-temperature DFE became commercially available and listed on the MSHA DPM control technology table [MSHA 2005].
11

Figure 4.—Mac’s Mining Repair filtration system on LHD #92506 used for testing Donaldson P604516 and Filter Services DFEs.
ECS Cattrap DPF System Engine Control Systems Ltd. (ECS), Newmarket, Ontario, Canada, supplied the Cattrap DPF system (Figure 5) as a retrofit to LHD #92526. It is a passive system that uses a cordierite wall-flow monolith coated with a base-metal catalyst. Theoretically, the system should passively regenerate during vehicle operation if the exhaust temperature is over 390° C for a significant portion (at least 30%) of the time. The system also requires periodic removal from the vehicle for cleaning and regeneration using the ECS CombiClean station. The frequency of the periodic cleaning and regeneration is dependent on the degree to which the system regenerates during equipment operation. The exhaust temperature traces obtained for LHD #92526 during the preselection period indicated that available exhaust heat is theoretically sufficient to support almost complete regeneration of the DPF. The manufacturer predicted that cleaning would be needed approximately every 250 hr, the same period as scheduled preventive maintenance sessions. However, the actual frequency of the regeneration sessions was supposed to be established empirically after the filter was installed and the vehicle was operated over an extended period of time. The ECS DPF system included a DOC mounted downstream of the DPF. The DOC is designed to reduce emissions of CO and unburned hydrocarbons. The ECS CombiClean cleaning station consists of a vacuum cleaner with HEPA filter, electrical heater, and compressed air supply. The DPF is removed from the vehicle and placed on the station for cleaning and complete regeneration. The three-step process
12

starts with removal of loose soot and ash from the filter using reverse flow of air provided by the vacuum cleaner attached to the inlet end of the filter. The vacuuming is followed by a controlled thermal regeneration. The heat for thermal regeneration is provided by electric heaters, while the combustion air is provided by a compressor. The thermal regeneration process is designed to be relatively slow in order to minimize the thermal stress on the cordierite DPF element. At the last stage of the process, the vacuum is used to remove remaining ash from the filter. The complete cleaning process takes approximately 8 hr. The system was delivered and installed during the first week of testing. Therefore, the system was in service for only about 2 days prior to testing. The system was decommissioned shortly after the trial.
Figure 5.—ECS Cattrap DPF system on LHD #92526.
DCL MINE–X Sootfilter DPF System The DCL MINE–X Sootfilter DPF system (DCL International, Concord, Ontario, Canada) (Figure 6), tested on LHD #99942, uses a platinum-catalyzed cordierite filter element. This system is conceptually very similar to the Engelhard DPX DPF described earlier.
13
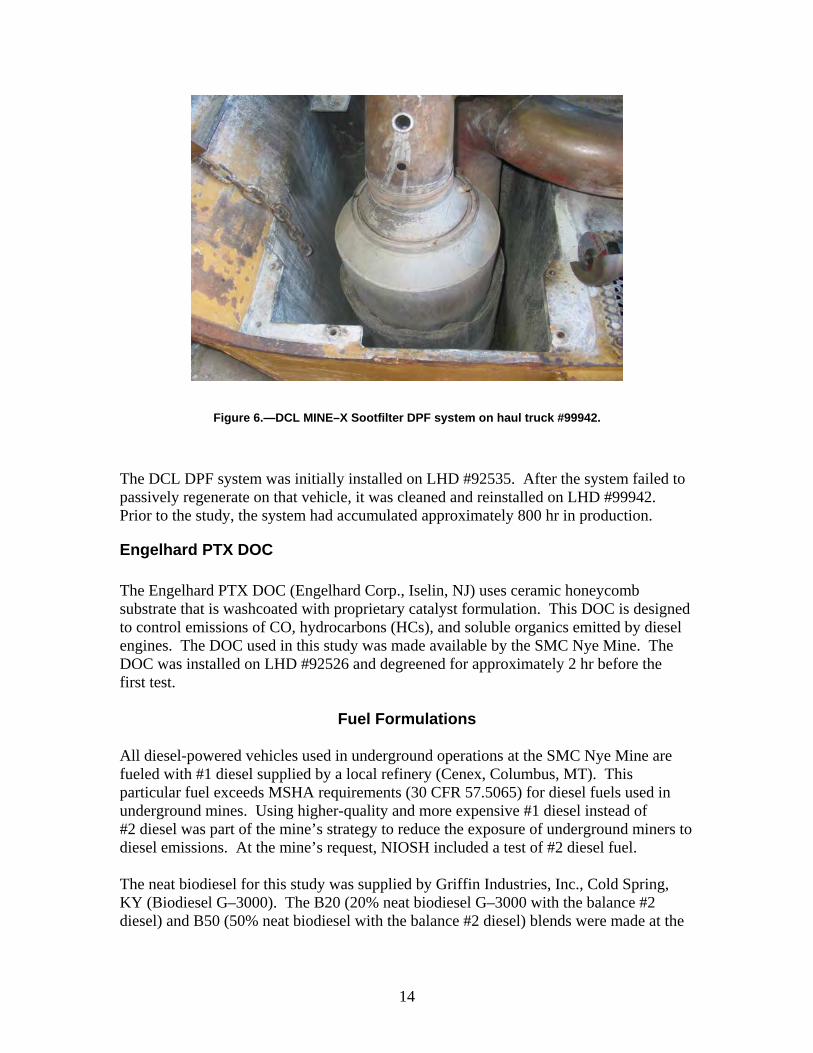
Figure 6.—DCL MINE–X Sootfilter DPF system on haul truck #99942.
The DCL DPF system was initially installed on LHD #92535. After the system failed to passively regenerate on that vehicle, it was cleaned and reinstalled on LHD #99942. Prior to the study, the system had accumulated approximately 800 hr in production.
Engelhard PTX DOC The Engelhard PTX DOC (Engelhard Corp., Iselin, NJ) uses ceramic honeycomb substrate that is washcoated with proprietary catalyst formulation. This DOC is designed to control emissions of CO, hydrocarbons (HCs), and soluble organics emitted by diesel engines. The DOC used in this study was made available by the SMC Nye Mine. The DOC was installed on LHD #92526 and degreened for approximately 2 hr before the first test.
Fuel Formulations All diesel-powered vehicles used in underground operations at the SMC Nye Mine are fueled with #1 diesel supplied by a local refinery (Cenex, Columbus, MT). This particular fuel exceeds MSHA requirements (30 CFR 57.5065) for diesel fuels used in underground mines. Using higher-quality and more expensive #1 diesel instead of #2 diesel was part of the mine’s strategy to reduce the exposure of underground miners to diesel emissions. At the mine’s request, NIOSH included a test of #2 diesel fuel. The neat biodiesel for this study was supplied by Griffin Industries, Inc., Cold Spring, KY (Biodiesel G–3000). The B20 (20% neat biodiesel G–3000 with the balance #2 diesel) and B50 (50% neat biodiesel with the balance #2 diesel) blends were made at the
14

15
surface shop at Nye Mine (Figure 7). The quantities of #2 diesel and neat biodiesel in the blends were determined volumetrically. The #2 diesel that is used by diesel-powered vehicles for surface operations at the SMC Nye Mine was supplied from the same refinery as the #1 diesel. The samples of #2 diesel, B20, and B50 were sent for detailed analysis to Southwest Research Institute (SwRI), San Antonio, TX. The selected properties of the fuels are summarized in columns 4–6 in Table 3. The Cenex refinery provided some limited data on the properties of the fuels supplied to the Nye Mine (see Table 3, columns 7–8). Griffin Industries also provided a certificate of the analysis for the biodiesel G–3000. Some of the information from the certificate is included in Table 3 (see column 9).
Figure 7.—Mixing and storage vessels for B20 and B50 biodiesel #2 diesel fuel blends.

Table 3.—Results of fuel analysis
Type of analysis Method
Unit of
measure
SwRI Cenex Griffin
#2 diesel B20 B50 #1
diesel #2
diesel B100
1 2 3 4 5 6 7 8 9
Cetane Number ASTM D613 N/A 43.2 47.6 51.5 42.8 43.2 53.5
HC Type Aromatics ASTM
D1319 % vol 30.9 N/A N/A N/A N/A N/A
Olefins — % vol 2.1 N/A N/A N/A N/A N/A Saturates — % vol 67.0 N/A N/A N/A N/A N/A
Density ASTM D4052 g/mL 0.85 N/A N/A 0.82 0.85 N/A
Sulfur Content ASTM D5453 ppm 299 238 159 125 366 25
Nitrogen Content ASTM D4629 ppm 28.0 36.3 43.4 N/A N/A N/A
Oxygen By differ. % wt N/A 2.49 5.56 N/A N/A N/A
Heat of Combustion ASTM D240 kJ/kg 42,647 41,526 39,923 N/A N/A N/A
Flash Point ASTM D93 °C 71.1 73.3 78.9 57.2 66.1 >120
Viscosity, 40 oC ASTM D445 mm 2/s N/A 2.61 3.25 N/A N/A 4.65
A 500-gal tank (Figure 8) with the fuel for use in this study was temporarily located in the isolated zone in a sealed-off crosscut about halfway along the test course section of 52E drift. A hand pump was used to transfer fuel to the fuel tanks of the test vehicles. The volume of the transferred fuel was measured using an electronic fuel meter (Great Plains Industries, Inc., Wichita, KS). The fuel tank of the test vehicle was filled to the same level before and after each test. The measured fuel volumes were used to estimate fuel consumed during the test. The fuel consumption of the engine powering LHD #92526 was measured using a portable fuel metering system (Max Machinery, Inc., Series 710, Model 213). The capacity of the fuel metering system was not sufficient to measure the fuel consumption of Deutz engines powering #92128, #92133, and #92506 because the Deutz fuel system also supplies a high volume of fuel for engine cooling. The electrical components of the fuel metering system failed during the test on #99442 with #2 diesel fuel. The fuel consumption data are not included in this report.
16

Figure 8.—Fueling station in isolated zone.
The initial plan was to fill the 500-gal tank in the isolated zone with #1 diesel and use it as the baseline fuel for this study. Unfortunately, the tank was filled with #2 diesel from the large surface reservoir designated for use by surface vehicles. The percentages of #1 and #2 diesel fuel in the fuel used in each test were estimated from the fuel sulfur analysis and are shown in Table 4. The fuel tanks of the vehicles used for tests with biodiesel blends and #2 diesel were drained prior to the tests and fueled from the verified sources. The fuel comparison tests involving LHD #99942 were run after the mistake with filling the supply tank with #2 diesel was discovered. The proper fuels were dispensed to the fuel tank of LHD #99942. For the tests intended to show the difference between #1 and #2 diesel fuels with LHD #92506, the fuel actually differed very little (89.6% vs. 100% #2 diesel); these tests can serve to demonstrate the repeatability of the isolated zone test method.
17
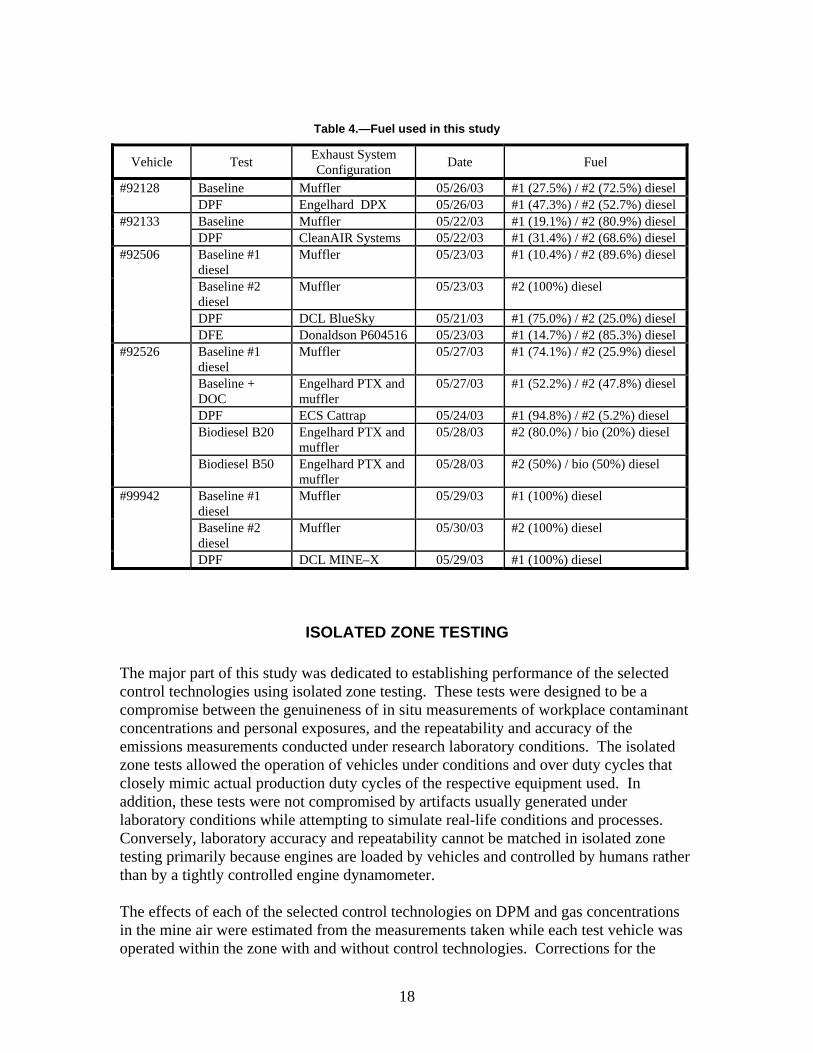
Table 4.—Fuel used in this study
Vehicle Test Exhaust System Configuration Date Fuel
#92128 Baseline Muffler 05/26/03 #1 (27.5%) / #2 (72.5%) diesel DPF Engelhard DPX 05/26/03 #1 (47.3%) / #2 (52.7%) diesel
#92133 Baseline Muffler 05/22/03 #1 (19.1%) / #2 (80.9%) diesel DPF CleanAIR Systems 05/22/03 #1 (31.4%) / #2 (68.6%) diesel
#92506 Baseline #1 diesel
Muffler 05/23/03 #1 (10.4%) / #2 (89.6%) diesel
Baseline #2 diesel
Muffler 05/23/03 #2 (100%) diesel
DPF DCL BlueSky 05/21/03 #1 (75.0%) / #2 (25.0%) diesel DFE Donaldson P604516 05/23/03 #1 (14.7%) / #2 (85.3%) diesel
#92526 Baseline #1 diesel
Muffler 05/27/03 #1 (74.1%) / #2 (25.9%) diesel
Baseline + DOC
Engelhard PTX and muffler
05/27/03 #1 (52.2%) / #2 (47.8%) diesel
DPF ECS Cattrap 05/24/03 #1 (94.8%) / #2 (5.2%) diesel Biodiesel B20 Engelhard PTX and
muffler 05/28/03 #2 (80.0%) / bio (20%) diesel
Biodiesel B50 Engelhard PTX and muffler
05/28/03 #2 (50%) / bio (50%) diesel
#99942 Baseline #1 diesel
Muffler 05/29/03 #1 (100%) diesel
Baseline #2 diesel
Muffler 05/30/03 #2 (100%) diesel
DPF DCL MINE–X 05/29/03 #1 (100%) diesel
ISOLATED ZONE TESTING The major part of this study was dedicated to establishing performance of the selected control technologies using isolated zone testing. These tests were designed to be a compromise between the genuineness of in situ measurements of workplace contaminant concentrations and personal exposures, and the repeatability and accuracy of the emissions measurements conducted under research laboratory conditions. The isolated zone tests allowed the operation of vehicles under conditions and over duty cycles that closely mimic actual production duty cycles of the respective equipment used. In addition, these tests were not compromised by artifacts usually generated under laboratory conditions while attempting to simulate real-life conditions and processes. Conversely, laboratory accuracy and repeatability cannot be matched in isolated zone testing primarily because engines are loaded by vehicles and controlled by humans rather than by a tightly controlled engine dynamometer. The effects of each of the selected control technologies on DPM and gas concentrations in the mine air were estimated from the measurements taken while each test vehicle was operated within the zone with and without control technologies. Corrections for the
18

background concentrations of the pollutants were made by subtracting the results of measurements performed at the upstream end of the zone from the corresponding results obtained at the downstream end of the isolated zone. The efficiency of each aftertreatment system was determined by comparing the pollutant concentrations obtained with the system installed to those concentrations resulting from operating the same vehicle over the same duty cycle with only a muffler. In the tests designed for the assessment of the effects of fuel formulations, the emissions from the vehicles fueled with alternative fuels were compared to those from the same vehicle when fueled with baseline diesel fuel. All tests performed in the isolated zone over this 10-day study are listed in Table 5.
Table 5.—Tests performed in the isolated zone
Vehicle Test Type Exhaust System Configuration Date Operator
#92128 Baseline for DPF Muffler 05/26/03 Jim DPF Engelhard DPX 05/26/03 Jim
#92133 Baseline Muffler 05/22/03 Ed DPF CleanAIR Systems 05/22/03 Ed
#92506 Baseline for DPFs with fuel 1
Muffler 05/23/03 Chad
Baseline for DPFs with fuel 2
Muffler 05/23/03 Chad
DPF DCL BlueSky 05/21/03 Charlie Disposable DPF Donaldson P604516 05/23/03 Chad
#92526 Baseline for DPF and DOC
Muffler 05/27/03 Chad
Baseline for biodiesel/ DOC
Engelhard PTX and muffler
05/27/03 Chad
DPF ECS Cattrap 05/24/03 Chad Biodiesel B20 Engelhard PTX and
muffler 05/28/03 Chad
Biodiesel B50 Engelhard PTX and muffler
05/28/03 Chad
#99942 Baseline for DPF / #1 diesel
Muffler 05/29/03 John
Baseline for DPF / #2 diesel
Muffler 05/30/03 John
DPF DCL MINE–X 05/29/03 John
The Test Site
The 530-m (1,739-ft) long isolated zone was located in 52E ramp in the east section of the SMC Nye Mine. The upstream end of the zone was situated approximately 150 m (492 ft) from the portal. The elevation of the portal is approximately 1,525 m (5,003 ft) above sea level. The location of the isolated zone relative to the portal is shown in Figure 9. The average cross-sectional dimensions of the isolated zone opening were approximately 2.75 by 3.5 m (9 by 11.5 ft). The ramp has a 9% rise toward the downstream end.
19

Figure 9.—Isolated zone at the SMC Nye Mine.
The site selected for the isolated zone met the following requirements:
1. It was isolated from the other parts of the mine where diesel-powered equipment is used.
2. It was ventilated with fresh air directly from the mine portal. 3. The quality and quantity of the air were not compromised by portal traffic. 4. The zone was sufficiently long and its cross-section was relatively small to ensure
thorough mixing of the vehicle exhaust with the mine air at the planned ventilation rates and to ensure uniform contaminant distribution across the drift at the downstream sampling station.
5. The ventilation controls allowed relatively uniform air quantity adjustment and control during the tests.
6. Power to operate 110 V ac instruments was available at the downstream and upstream sampling stations.
The schematic of the isolated zone is shown in Figures 10–11. For each test, the test vehicle was operated over the simulated duty cycle at and between the upstream and downstream load/dump points, which were approximately 300 m (984 ft) apart. The upstream sampling station was located approximately 90 m (295 ft) upstream of the upstream load/dump point. The downstream sampling station was located approximately 140 m (459 ft) downstream of the downstream load/dump point. A third sampling point was located on the vehicle. The ventilation control doors were located approximately 60 m (197 ft) downstream of the downstream sampling station. The stopes at the upstream and downstream load/dump points were approximately 8 m (26.2 ft) deep. Significant quantities of waste rock, sufficient to support the duty cycle for LHD vehicles, were available at upstream and downstream load/dump points. The refueling station was located in one of the sealed stopes about halfway between the upstream and downstream load/dump points.
20

Figure 10.—The isolated zone and duty cycles for trucks #92128 and #92133 (not to scale).
21
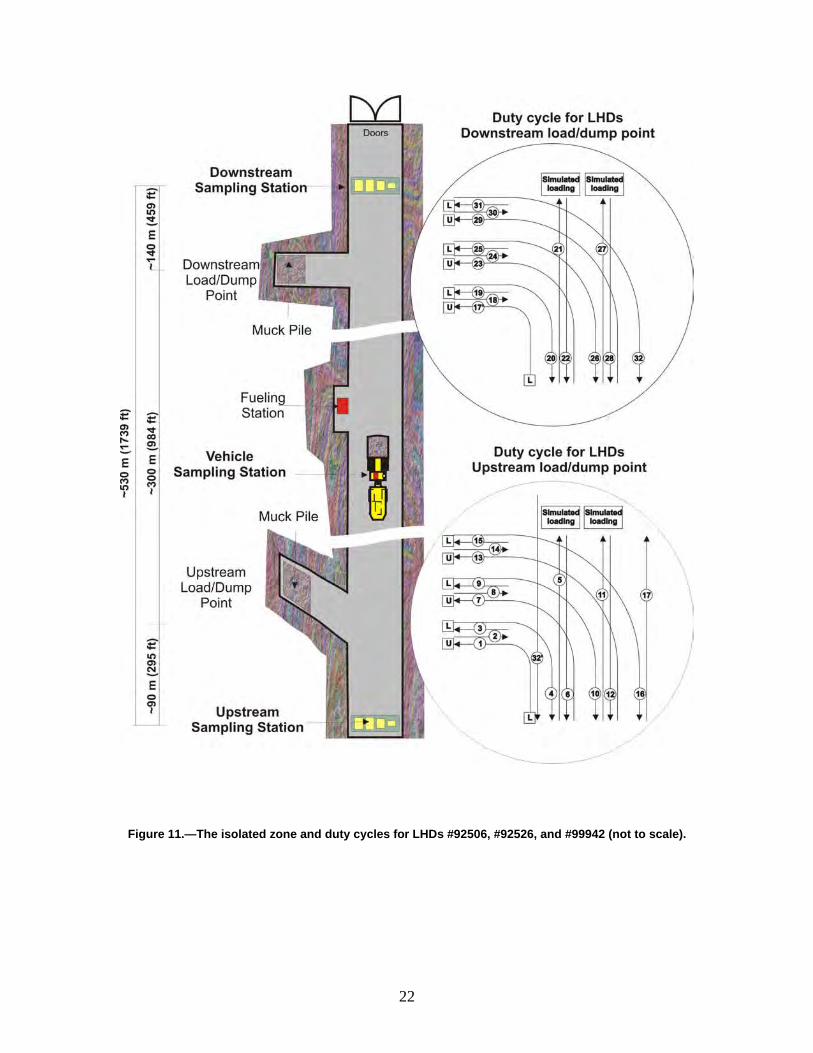
Figure 11.—The isolated zone and duty cycles for LHDs #92506, #92526, and #99942 (not to scale).
22

Duty Cycles
NIOSH and SMC Nye Mine personnel, including experienced vehicle operators, developed two well-defined, conservative, simple, and repeatable duty cycles, one for the haul trucks and one for the LHDs. Both test cycles simulated a typical production cycle for the respective equipment. The Duty Cycle for Trucks The duty cycle for trucks #92128 and #92133 is shown in Figure 10. It consisted of two major tasks simulating loading, one at the loading point and one at the dumping point, and two tramming tasks occurring between those points. The trucks were operated with their box loaded with ore for the entire cycle to keep the cycle simple and reduce variability. For safety reasons, the cycle was designed to keep the operator facing the direction of travel when the trucks were tramming up or down the ramp. The trucks started the cycle at the upstream dumping point by hauling a full box of ore up the ramp to the loading point. At the loading point, the operators simulated a loading cycle by repositioning the trucks for loading by an imaginary LHD. It was assumed that three buckets were required to load each of the trucks. Tramming down the ramp toward the dumping point followed the loading cycle. At the dumping point, the operator simulated unloading the box by engaging the hydraulics and loading the engine. After completion of this last task, a new cycle would start. Two full cycles, designated as warmup cycles, were executed during each test prior to the start of sampling at each of the three stations. The warmup cycles allowed the driver to become familiar with the cycle and to allow an initial buildup of exhaust contaminants prior to initiation of sampling. The tests were usually terminated after completing a number of full cycles. The average duration of a complete duty cycle for trucks was about 8 min. The duration of each test was dictated by the time required to acquire an adequate DPM sample for EC analysis and depended on the DPM reduction efficiency of the control technology being tested. Both the operator and test vehicle were kept the same for each pair of efficiency comparison tests (see Table 5). This practice reduced potential error created by different driving habits and other human factors. The Duty Cycle for LHDs The duty cycle for LHDs #92506, #92526, and #99942 is shown in Figure 11. It consisted of two very similar major load/dump tasks, one occurring at each of the load/dump points and two tramming tasks occurring between those points. The LHDs started their cycles at the upstream load/dump point with the bucket loaded with ore. The operator would first take the vehicle into the upstream stope and unload the bucket, retreat for the length of the vehicle, then advance forward and load the bucket again. The next step was to back the vehicle out of the stope and advance for two vehicle lengths up the ramp. At that location, the operator would engage the hydraulics to simulate
23

loading of an imaginary truck and then back the vehicle to the starting point. This loading operation would be repeated three times. After the third execution, the loaded LHD vehicle would tram up the ramp to the downstream load/dump point. The LHD would execute three load/dump tasks similar to those performed at the upstream location. At the end of the load/dump session at the downstream point, the vehicle would tram loaded down the ramp to the upstream starting point to complete the cycle. It would then initiate a new cycle.
At the start of each test, two full warmup cycles were executed prior to the start of sampling. The tests were usually terminated after completing a number of full cycles. The average duration of the duty cycle for LHDs was about 13 min. The duration of a test was dictated by the time required for collecting a sufficient DPM sample.
LHDs #92526 and #99942 were operated by the same operator throughout all tests involving those vehicles (see Table 5). LHD #92506 was operated by the same operator for three out of four tests. A different miner operated the vehicle during the test with the DCL BlueSky DPF system.
Ventilation
The isolated zone was ventilated with fresh air from the portal (see Figure 9). Since no diesel-powered activity occurred upstream of the test zone just prior to or during a test, the level of diesel contamination in the ventilation air entering the test zone was very low. The initial intent was to maintain the ventilation rate (VR) in the main drift during each of the tests close to the VR determined by MSHA for the specific engine used in the test vehicle (see Table 2). That amount of air was assumed to provide enough protection to the operator and researchers, yet allow collecting adequate particulate samples in a reasonably short test period. In order to compensate for a potential increase in NO2 emissions, the VR was set to substantially exceed the MSHA VR during the tests involving the platinum-catalyzed DPF systems. The intent was to run tests involving the exhaust filters for a much longer period than for baseline or fuel tests to ensure the collection of sufficient sample material for the analysis.
The analysis of the ventilation data collected during the tests conducted during the first week of the study showed an unacceptable variability for those tests when the VR was set close to the MSHA VR. Therefore, for the remainder of the tests, the VR was maintained at much higher levels, which were more easily controlled.
Auxiliary ventilation was not supplied to the stopes at the upstream and downstream load/dump points.
24

EQUIPMENT, INSTRUMENTATION, AND METHODS FOR AMBIENT SAMPLING, MEASUREMENTS, AND ANALYSIS
This section describes the various equipment, instrumentation, and methods used in this study to collect particulate matter samples or directly measure concentrations of particulate matter and selected gases.
Standard Sampling Method for Elemental Carbon (EC)
The sampling train used for DPM sampling was identical to that used by MSHA for DPM compliance monitoring (30 CFR 57.5061). It consisted of a flow-controlled MSA Escort ELF Sampling Pump from Mine Safety Appliances Co., Pittsburgh, PA; and a 10-mm Dorr-Oliver Cyclone and SKC DPM Cassette, both from SKC, Inc., Eighty Four, PA. The SKC DPM Cassette contains a single-stage impactor with a nominal cut point of 0.8 µm [Olson 2001], followed by two stacked 37-mm tissue quartz-fiber filters. The pumps were operated at 1.7 L/min. The pumps were calibrated at the mine at the beginning of the study. The flow rate for each of the sampling pumps was measured and recorded daily using a Gilibrator–2 bubble flow meter from Sensidyne, Clearwater, FL. If a measured flow rate deviated by more than 5%, the pump was recalibrated. The exposed SKC DPM Cassettes were shipped to the NIOSH Pittsburgh Research Laboratory (PRL) and analyzed by the PRL analytical laboratory for EC content using NIOSH Analytical Method 5040.
High-volume Sampling for EC
The preliminary estimates of the DPM concentrations for several control devices based upon laboratory data indicated that the standard sampling procedure would require extremely long sampling times to collect sufficient material to obtain accurate carbon analysis using NIOSH Analytical Method 5040. Therefore, NIOSH designed a high-volume (HV) sampling train (Figure 12) to accelerate the collection of adequate sample mass while maintaining the 0.8-µm cut point to separate diesel aerosol from the larger mine dust aerosols. This sample concentration objective was accomplished by increasing the sampling flow rate and decreasing the area of the collection filter. The sampling flow rate was increased by merging into a single stream the flows from five preclassifiers, each consisting of a 10-mm Dorr-Oliver Cyclone followed by a U.S. Bureau of Mines (USBM) single-stage diesel impactor with an approximately 0.8-µm cut point [Olson 2001]. The proper flow rate of 1.7 L/min through each preclassifier was achieved by using identical preclassifiers and designing and using a symmetrical plenum to distribute the total flow rate of 8.5 L/min among the five streams. Each preclassifier assembly was connected to the plenum chamber by a 3-ft-long section of conductive tubing. The outlet of the plenum was directly connected to a stainless steel (SS) 25-mm filter holder containing two stacked 25-mm tissue quartz-fiber filters (Tissuquartz 2500 QAT–UP, Pall Corp., Ann Arbor, MI).
25

The sampling flow rate of 8.5 L/min through the 25-mm filter was controlled by a Model HFC 302 mass flow controller from Teledyne, Hampton, VA. The sampling system incorporated a three-way valve and bypass line that allowed steady operation of the mass flow controller and pump while facilitating prompt starting and stopping of sampling.
Since the sampling was done in triplicate, three identical HV sampling systems were used. All three flow controllers were attached to a common manifold connected to the suction side of a Model 0523–101Q high-volume rotary vane pump from Gast Manufacturing, Inc., Benton Harbor, MI. The mass flow controllers were calibrated by the manufacturer and checked using a Gilibrator. Identical triplicate HV sampling systems were used at the upstream and downstream sampling locations.
26
Figure 12.—The high-volume DPM sampling train.

Immediately after completion of the HV sampling for a test, each of the stacked 25-mm filters was removed from its holder and placed in a 47-mm polystyrene petri dish (Analyslide® from Pall Corp.) and identified using a self-adhesive label. These were shipped to NIOSH PRL and analyzed by the PRL analytical laboratory for EC content using NIOSH Analytical Method 5040.
DPM Concentration Measurements With a TEOM Series 1400a Ambient Particulate Monitor
Two TEOM Series 1400a ambient particulate monitors from Rupprecht & Patashnick Co., Albany, NY, were used to provide continual data on concentrations of total particulate matter (TPM) under 0.8 µm. As with the HV samplers, a 10-mm Dorr-Oliver Cyclone and USBM diesel impactor with a 0.8-µm cutoff were used as preclassifiers. The flow rate was set to 1.7 L/min. One TEOM was located at the upstream station, the other at the downstream sampling station.
The TEOM measures the mass of material collected on a filter element mounted on a hollow tapered vibrating pedestal. As the air containing particles is drawn through a filter at a constant flow rate, the frequency of the oscillating pedestal decreases as the mass accumulates on the filter. Using frequent periodic measurements of the tapered-element frequency, the TEOM calculates the increase in mass of the sample that has accumulated on the filter. The concentration of TPM is calculated by dividing the accumulated mass by the volume of airflow across the filter during the time period over which the frequency change is measured.
The flow through the instrument is maintained at a constant volumetric rate by a mass flow controller. The flow is corrected for temperature and barometric pressure. Internal temperatures in the instrument are controlled in order to minimize the effects of ambient temperature. In order to prevent condensation and ensure that the sample filter always collects particulates under similar conditions, the intake to the tapered element is heated and the sampling stream through the filter is maintained at 50 °C.
The TEOM filter mass and average ambient concentrations of TPM were recorded every 10 s. The reported TPM concentration for each test was obtained from the net gain in mass that occurred over the same time period as that of the HV sampling for that test.
Measurement of Size Distribution and Particle Number Concentrations Using a Scanning Mobility Particle Sizer
The scanning mobility particle sizer (SMPS) Model 3936 from TSI, Inc., St. Paul, MN, consisting of a Model 3080L electrostatic classifier and a Model 3025A condensation particle counter (CPC), was used periodically at the downstream sampling station to measure the size distribution and number of particles in the size range of 10–392 nm.
The SMPS classifier was set up with a sheath airflow of 6.0 L/min and a sample flow rate of 0.6 L/min. At the established flow rate used, the inlet impactor had a cutoff point of
27

0.46 µm. After the classifier, the monodispersed aerosol went to the CPC. The CPC was operated in high-flow mode to minimize diffusion losses. The sampling was performed using a 90-s up-scan and a 15-s down-scan. The instrument was operated using a dedicated laptop computer and Aerosol Instrument Manager Software (TSI, Inc., St. Paul, MN).
Although the vehicle duty cycles used were transient, the resulting aerosol distributions in the mine air were made quasisteady by the nature of the duty cycle and movement of the vehicles relative to the ventilation air. For the purpose of assessing the effects of a control technology on size distribution and particle number concentrations of aerosols in mine air, the aerosol analysis was performed only on a set of SMPS measurements that were obtained during one element in the duty cycle, i.e., while the test vehicle was performing the portion of the duty cycle at the downstream load/dump point—a point closest to the downstream sampling station and the SMPS.
The distributions and particle number concentrations obtained during other portions of the duty cycle were found to be extremely dependent on the position of the vehicles relative to the instrument.
Concentration of CO, NO, and NO2 Measured by an Industrial Scientific iTX Multigas Monitor
The ambient concentrations of CO, NO, and NO2 were measured at the upstream, downstream, and on-vehicle sampling locations using three iTX multigas monitors from Industrial Scientific, Oakdale, PA. One of the iTX multigas monitors was dedicated to each sampling location for the duration of the isolated zone testing. The iTX is a diffusion gas monitor using electrochemical cell technology. The instrument continuously monitors and simultaneously displays all gases sampled. The monitor’s logging function was used to store the 10-s average ambient concentration of each gas over the test period. These data were used to obtain the average concentration for each gas over the HV sampling period.
The iTX gas monitors were calibrated with certified concentrations of Industrial Scientific-branded calibration gases prior to and upon completion of isolated zone testing. Each iTX was checked between the tests by coupling it to the iTX DS1000 Docking Station. The iTX DS1000 Docking Station is an automated instrument management system that consists of a master control and PC interface station. The Docking Station provides automatic calibration and instrument diagnostics and maintains instrument database records.
The iTX gas monitors were the only instruments removed from the isolated zone at the end of each test. On surface, the logged data were downloaded to a laptop computer after each test.
28

Downstream Concentrations of CO and CO2 Measured by an Innova 1312 Photoacoustic Multigas Monitor
The ambient concentrations of CO and CO2 at the downstream sampling station were measured by an Innova 1312 Photoacoustic Multigas Monitor (Innova AirTech Instruments A/S, Nærum, Denmark). The Innova 1312 uses a photoacoustic infrared detection method and has a limit of detection in the parts-per-billion range. During a gas concentration measurement, a sample of air is drawn into the analysis cell within the instrument. The cell is then sealed off, and a pulsating (chopped) beam of infrared light is sent into the cell after passing through an optical filter that passes only that portion of the infrared spectrum specific to one of the gases of interest. If that gas is in the cell, it absorbs the infrared energy and heats up, creating a pressure pulse in step with the pulsing infrared light. The intensity of the pressure pulses increases with increasing gas concentration. The pulses are measured by microphones mounted within the cell and electronically processed into a gas concentration. Several filters are mounted on a wheel and used in turn to analyze for the different gases, including water vapor, which provides needed water vapor correction to the other gases.
The instrument was calibrated by the manufacturer, and the calibration was checked before the study. The prevailing background CO2 concentration was determined using a 12-hr measurement taken overnight when there were no diesel-powered vehicles in the zone. During each of the tests, the concentrations of CO and CO2 were measured at the downstream sampling station and stored into the instrument’s memory approximately every 62 s. The stored values were downloaded to a laptop computer at the conclusion of every test. The reported values for each test are the average of the logged data over the time period of the HV sampling for that test.
Measurements of Exhaust Temperature and Engine Back Pressure
A MiniLogger portable data logging system from Logic Beach, Inc., La Mesa, CA, was temporarily attached to a test vehicle to gather exhaust temperatures and exhaust back pressures during the test run. The exhaust temperature was measured using a Model KMQSS–125G–6, K-type thermocouple from Omega Engineering, Inc., Stamford, CT. The engine back pressure was measured using a Kavlico Model P356 differential pressure sensor from Kavlico Corp., Moorpark, CA. The output from the thermocouples and pressure sensors were sampled every 2 s and the average logged every 10 s. The data logger was programmed using HyperWare software supplied with the logger.
Measurement of Ambient Temperature and Barometric Pressure
The ambient temperature and barometric pressure were measured and recorded by the TEOM 1400a.
29
Measurements of Ventilation Rates
Air velocities in the isolated zone were measured continuously during the tests at the approximate center of the drift at the downstream sampling station (Figure 13) using an Anemosonic UA6 digital ultrasonic anemometer from Airflow Developments Ltd., High Wycombe, United Kingdom. The anemometer sensor was located in the center of the steel grid supporting the DPM samplers. A MiniLogger was programmed to sample the output of the anemometer every 2 s, calculate a five-sample average, and store the result into memory. The memory was downloaded to a laptop computer at the conclusion of a test. The average air velocity for a test was computed by averaging the logged data over the HV sampling times for that test. The average velocity was converted to air quantity by multiplying it by the cross-sectional area at the anemometer location.
Since the ventilation quantity was different for each test, the contaminant concentrations measured for each test had to be corrected to a common air quantity in order to determine the effects of the control technology by inter-test comparison. Since no comparison was to be made when different test engines were used, the common VR chosen for a set of tests using a particular engine was the MSHA nameplate VR assigned to that engine. The MSHA nameplate VR is the quantity of ventilation air needed to maintain a concentration of CO, CO2, NO, or NO2 in mine air below its corresponding 1973 ACGIH TLV values. This ventilation rate is calculated from the emissions of the aforementioned gases determined while the engine is operated over eight modes of ISO 8178 test cycle for off-road diesel engines. Normalizing the results with respect to MSHA VR provides some context for interpreting the contaminant concentrations, although metal mines, including the SMC Nye Mine, are not required to provide this quantity of ventilation air in their workings.
30

Figure 13.—Downstream sampling station showing instrumentation and grid supporting DPM samplers, anemometer, and iTX gas monitor.
Analysis of Samples Collected Using Standard and High-volume Methods
The samples that were collected on quartz-fiber filters, using standard and HV sampling procedures, were analyzed by the NIOSH PRL analytical laboratory for EC content using NIOSH Analytical Method 5040 [Schlecht and O’Connor 2003; Birch and Cary 1996]. The analysis was performed following the procedure described for the carbon analyzer from Sunset Laboratories, Forest Grove, OR. A blank (heat-treated quartz-fiber filter) and sugar standard were run daily before analysis of the samples.
Calibrated punches were used to remove a section from the exposed area of a filter. The punch with a cutout area of 0.72 cm2 was used for heavily loaded samples, while a punch with an area of 1.5 cm2 was used for other samples. The cutout is placed into the oven of the carbon analyzer and analyzed following the procedure described in the NIOSH Manual of Analytical Methods [Schlecht and O’Connor 2003] and by Birch and Cary [1996].
NIOSH Analytical Method 5040 analyzes for OC and EC in two different stages. In the first stage, the OC evolves as the instrument ramps the oven temperature up over four progressively higher temperature steps in a pure helium (He) atmosphere. The temperature steps for the OC portion were set to 200, 450, 650, and 870 °C. The duration at each temperature step was longer than used typically so that the carbon peaks could be
31

fully resolved at each temperature step. The EC does not evolve in the pure He atmosphere. The evolved OC is oxidized to CO2, reduced to methane (CH4), and finally measured using a flame ionization detector.
In the second stage, the EC is measured by reducing the oven temperature to about 600 °C and then raising the temperature to around 900 °C in a He/O2 atmosphere where the oxygen, now present, reacts quantitatively with the EC to form CO2. The EC is then measured in the same way as the OC. NIOSH Analytical Method 5040 also corrects for pyrolysis of OC and carbonates.
Sampling and Measurement Methodology
Three sampling locations were established for this isolated zone study. The upstream sampling station was located approximately 90 m (295 ft) upstream of the upstream load/dump point. The downstream sampling station was established approximately 140 m (459 ft) downstream of the downstream load/dump point and 60 m (197 ft) upstream of the ventilation doors. The third sampling location was located on the test vehicle. Upstream Sampling Station The following methods were used to determine contaminant concentrations at the upstream station:
1. A standard sampling procedure was used to collect DPM samples for EC. 2. An HV sampling procedure was used to collect DPM samples for EC. 3. A TEOM Series 1400a was used for real-time measurements of TPM under
0.8-µm aerodynamic size. 4. An iTX multigas monitor logged 10-s average concentrations of CO, NO, and
NO2. Downstream Sampling Station The following methods were used to determine concentrations of the particulate matter at the downstream station:
1. The standard sampling procedure was used to collect DPM samples for EC. 2. The HV sampling procedure was used to collect DPM samples for EC. 3. The TEOM Series 1400a was used for real-time measurements of TPM under
0.8-µm aerodynamic size. 4. The SMPS was used to measure size distribution and particle number concentra
tions of aerosols.
32

The following instrumentation was used to measure concentrations of the selected gases at the downstream station:
1. The iTX Multigas Monitor was used for real-time display and logging of concentrations of CO, NO, and NO2.
2. The Innova 1312 Photoacoustic Multigas Monitor was used for real-time measurements of concentrations of carbon, CO, and CO2.
The distribution of the standard and HV samplers across the upstream and downstream stations is shown in Figure 14.
33
Figure 14.—Distribution of samplers across sampling station showing the locations of the high-volume sampling heads (light) and three standard samplers (dark) (not to scale).
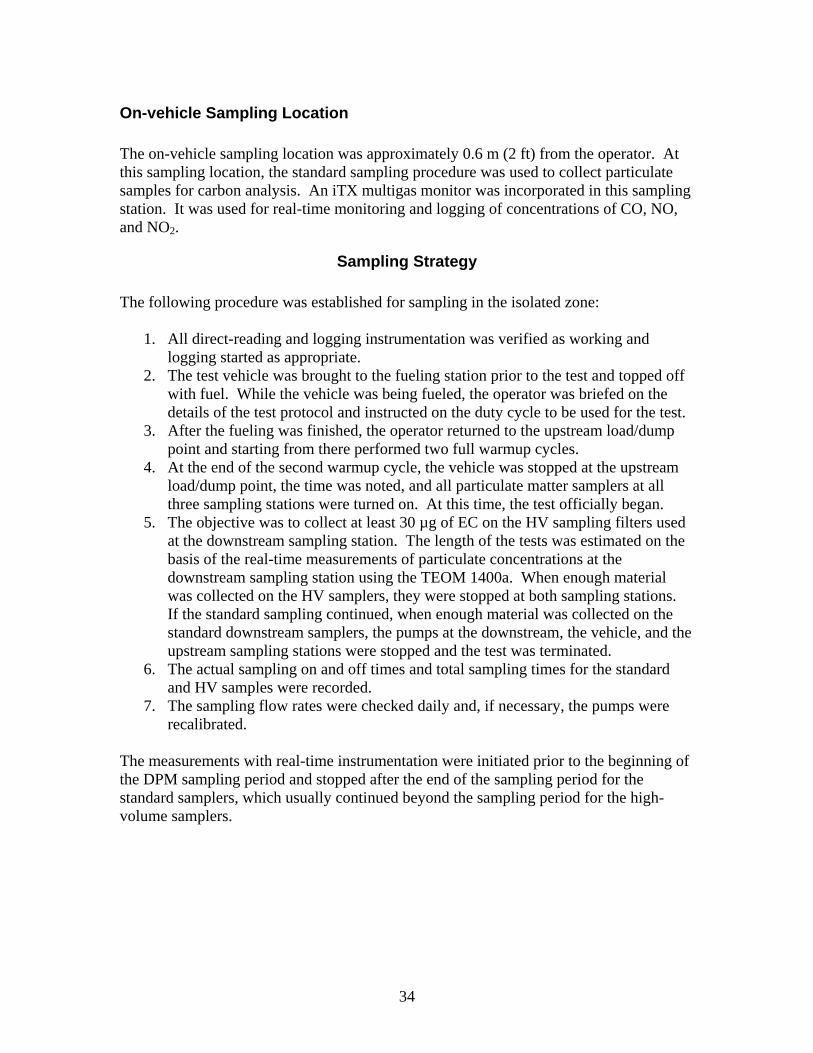
On-vehicle Sampling Location
The on-vehicle sampling location was approximately 0.6 m (2 ft) from the operator. At this sampling location, the standard sampling procedure was used to collect particulate samples for carbon analysis. An iTX multigas monitor was incorporated in this sampling station. It was used for real-time monitoring and logging of concentrations of CO, NO, and NO2.
Sampling Strategy
The following procedure was established for sampling in the isolated zone:
1. All direct-reading and logging instrumentation was verified as working and logging started as appropriate.
2. The test vehicle was brought to the fueling station prior to the test and topped off with fuel. While the vehicle was being fueled, the operator was briefed on the details of the test protocol and instructed on the duty cycle to be used for the test.
3. After the fueling was finished, the operator returned to the upstream load/dump point and starting from there performed two full warmup cycles.
4. At the end of the second warmup cycle, the vehicle was stopped at the upstream load/dump point, the time was noted, and all particulate matter samplers at all three sampling stations were turned on. At this time, the test officially began.
5. The objective was to collect at least 30 µg of EC on the HV sampling filters used at the downstream sampling station. The length of the tests was estimated on the basis of the real-time measurements of particulate concentrations at the downstream sampling station using the TEOM 1400a. When enough material was collected on the HV samplers, they were stopped at both sampling stations. If the standard sampling continued, when enough material was collected on the standard downstream samplers, the pumps at the downstream, the vehicle, and the upstream sampling stations were stopped and the test was terminated.
6. The actual sampling on and off times and total sampling times for the standard and HV samples were recorded.
7. The sampling flow rates were checked daily and, if necessary, the pumps were recalibrated.
The measurements with real-time instrumentation were initiated prior to the beginning of the DPM sampling period and stopped after the end of the sampling period for the standard samplers, which usually continued beyond the sampling period for the high-volume samplers.
34

Calculation of the Effects of Control Technologies
The effects of each of the tested control technologies were determined by comparing the results of tests with and without control technologies. The contributions of the test vehicles to the concentration of each contaminant were calculated assuming that the mass of contaminant at the downstream sampling station is equal to the sum of the mass of contaminant emitted by the engine and the corresponding mass of contaminant that entered the isolated zone upstream of the test zone. In order to allow a direct comparison of the results between the tests within each test group, the measured concentrations were corrected for variations that occurred between tests due to the nature of the test environment and methods. Differences in ventilation rates and ability of the operator to replicate the duty cycle over several tests being compared were assumed to be major factors influencing the results. The results of gas and DPM measurements were corrected for the effects of ventilation rates by adjusting them to a common average VR. The EC results were also adjusted for the combined effects of VRs and duty cycles by normalizing those to an average level of CO2. These methods are discussed below.
Net Contributions and Relative Effects of the Tested Control Technologies: The VR Adjustment Procedure
The average VR was calculated for each test using results of VR measurements made for each test run at the downwind sampling station. The measured concentrations were adjusted to a common VR, which was the nameplate VR established by MSHA for the particular test engine.
One should note that concentrations of contaminants at the downstream sampling station were VR-dependent, while concentrations of contaminants at the upstream sampling station were VR-independent.
The measured concentrations (ci) were corrected to the VR-adjusted concentrations (ci,VR) using as reference MSHA VR (VRj, MSHA) for the engine used in that particular group of tests. This relation is given in Equation 1,
3mVR [ ]g g i s gci,VR [ 3 ] = ci [ 3 ]× 3 = ci [ 3 ] ×VRC Equation 1 m m m mVRj ,MSHA[ ]
s
where VRC is the VR coefficient, which is defined as the ratio of the average VRi for the test and the MSHA nameplate ventilation for the test engine used.
The net contribution of the tested vehicle/technology configuration to the air concentrations of pollutants (Ci) was calculated by subtracting the concentrations measured at the upstream sampling station (ci,UP) from the VR-adjusted concentrations at the downstream sampling station (ci, VR,DOWN):
35

g g gCi [ 3 ] = ci,VR,DOWN [ 3 ] − c 2 m m i,UP [ ] Equation
m 3
Similarly, the net contribution of the tested configuration to the exposure of the operator was estimated by subtracting the upstream concentrations from the ventilation-adjusted concentrations measured at the vehicle. In cases where the analysis of the upstream data showed that the upstream concentrations of the measured pollutant were below the detection limit of the method or instrumentation, the background concentrations were assumed to be negligible. The net contributions were then used to calculate the relative effects of the tested control technologies on the concentrations of the monitored pollutants:
⎛ g ⎞⎜ Ci [
Effect (%) = ⎜3 ] ⎟
1 m ControlTechnology − ⎟ × 100 Equation 3 ⎜ g ⎟⎜ C ⎟⎝ i BL [ 3 ]
m ⎠ where Ci is the net contribution of the vehicle to the air concentrations of pollutant for the control technology case and Ci BL is the net contribution of the vehicle to the air concentrations of pollutant for the baseline case. Net Contributions and Relative Effects of the Tested Control Technologies: the CO2 Adjustment Procedure Under established test conditions, quantifying actual work done by the vehicle/engine over the duty cycle would be rather complicated. Therefore, the alternative approach based on measuring the average net CO2 emissions over the test cycle was used to assess the relative work performed by vehicles. This concept originated in contract work by Michigan Technological University for the USBM in the early 1980s [Schnakenberg et al. 1986; Johnson and Carlson 1985, 1986]. The assumption is that the emissions of a particular contaminant (gases or DPM), when divided by the average fuel used, would be relatively constant over a particular duty cycle for minor variations in that cycle. Since CO2 emissions are directly proportional to the amount of fuel used, the ratio of the average gas or DPM emissions to the average CO2 emissions can be assumed to be reasonably constant. Furthermore, this ratio holds for the resulting concentrations of diesel pollutants in the ambient air and is wholly independent of the prevailing ventilation rate since the contaminant and CO2 are diluted equally. On the other hand, when the average CO2 concentrations between two tests to be compared are significantly different and this difference is not attributable to ventilation, one should suspect that the duty cycles were executed differently. The relationship can be used only in the cases where the control technology does not alter the concentration of CO2 in exhaust. Aftertreatment devices such as DPFs and DOCs are designed to affect the emissions of CO, HCs, EC, and particulate matter, but they do not significantly affect CO2 emissions. Those devices
36

also do not significantly affect total emissions of nitric oxides, but they affect the ratio between NO and NO2 emissions.
The concentrations of CO2 were measured and recorded in real time at the downstream sampling location. In this study, the average net CO2 concentrations (measured CO2 minus the background CO2) over the sampling periods were used to normalize the corresponding average concentrations of EC collected using HV and standard sampling methods.
Equation 4 defines a relative EC concentration (CECCO2 ) per concentration of CO2 (CCO2 ). This ratio is engine-specific and duty cycle-specific.
µg µgC [ ]3 EC 3m mC ECCO [ ] = Equation 4 2 ppm CCO [ ppm]
2
The effects of control technologies on net concentrations of EC were calculated using corresponding net CO2-normalized concentrations measured for the control technology (CT) case (C[ECCO2]CT ) and the baseline (BL) case (C[ECCO2]BL ):
⎛⎜⎜Control Technology Effect (%) = 1 −
C[ECCO ]CT2 ⎞⎟⎟ × 100% Equation 5
C[ECCO ]BL2⎝ ⎠
EXHAUST EMISSION TESTING
The isolated zone tests were complemented with a series of DPM and gaseous emissions measurements performed directly from the exhaust systems of the tested vehicles. The objective of the exhaust pipe emission measurements was to verify the performance of the tested engines and control technologies used in the isolated zone study. The measurements were made for the majority of evaluated configurations. This part of the study was a joint effort between NIOSH and the SMC maintenance department. The tests took place in the main surface repair facility at Nye Mine.
Engine Operating Conditions
The exhaust pipe emissions were obtained while each test vehicle was parked in the shop, and the engine was operated under three steady-state conditions:
1. Torque converter stall (TCS), stall engine speed at full throttle; 2. High idle (HI), rated engine speed/full throttle, no load; and 3. Low idle (LI), idle engine speed, no load.
37

These conditions were selected as the only repeatable and safe conditions suitable for testing an engine without using a chassis dynamometer.
TCS was assumed to be the most suitable method to significantly load engines that are coupled with an automatic transmission through a torque converter. This mode can be achieved by applying the vehicle’s brakes and loading the engine by making the torque converter work against a transmission that is engaged in the highest gear. Under such conditions, the energy produced by the engine is converted into heat and dissipated in the torque converter system. The duration of the TCS test is limited by the fact that the torque converter cooling system is usually not capable of dissipating the energy generated for an extended period of time. Permanent damage of the torque converter was avoided by stopping any TCS test before the torque converter temperature exceeded a maximum allowed temperature. Because the TCS condition is quite reproducible and results in the highest engine load and consequently the highest DPM and gaseous emissions of the three possible repeatable conditions for testing vehicles under field conditions, it was considered to be the most representative for engine and control technology effects testing.
At HI mode, brakes were applied, the transmission was placed in neutral, and the engine speed was maintained at rated speed. Typically, DPM emissions for this mode are substantially lower than those found at TCS conditions.
At LI mode, brakes were applied, the transmission was placed in neutral, and the engine speed was maintained at idle. Again, DPM emissions for this mode typically are substantially lower than those at TCS and HI mode.
Equipment, Instrumentation, and Methods for Measurement of Exhaust Pipe Emissions
The effects of the aftertreatment technologies on the particulate matter and gaseous emissions were determined by comparing emissions obtained from a sampling port located upstream to those obtained from either a sampling port downstream of the system or tailpipe outlet. In the case of tests involving fuel formulations, the emissions were obtained upstream of any aftertreatment device. The effects were determined by comparing results of the similar tests conducted with different fuel formulations.
The inlet side of each of the tested DPF systems was equipped with at least two 13-mm (0.5-in) NPT ports made with SS pipe couplings that were welded over a 13-mm (0.5-in) or 19-mm (0.75-in) hole in the exhaust pipe.
The tailpipe emissions were measured independently by NIOSH researchers and by SMC Nye Mine maintenance personnel. All emissions measured by NIOSH were repeated at least three times for each test condition. The test procedures remained uniform across all engine/vehicle configurations. NIOSH used the following methods and instrumentation for measuring DPM and gaseous emissions in the exhaust systems of the test vehicles:
38

1. An ECOM Model KL portable emissions analyzer from ECOM America Ltd., Norcross, GA, was used to measure exhaust pipe concentrations of O2, CO, NO, and NO2.
2. The same portable emissions analyzer was used to collect a smoke sample from
exhaust pipe for Bacharach smoke number analysis and used as a means to obtain DPM samples on tissue quartz for carbon analysis.
SMC Nye Mine maintenance personnel used an Enerac 400 EMS Micro Emissions Monitoring System from Enerac, Inc., Westbury, NY, to measure tailpipe concentrations of O2, CO, NO, and NO2 following their own test protocol for collecting data continuously through three consecutive steady-state test conditions (LI, HI, and TCS) and the transient conditions in between. Both the ECOM KL and the Enerac 400 used electrochemical sensors to measure concentrations of O2, CO, NO, and NO2. The instruments calculated the CO2 emissions from the measured O2 concentration and the fuel type used. The ECOM combustion analyzer also performs a smoke analysis. A special filter paper is inserted into a slot in the exhaust probe through which the ECOM draws a 1.6-L sample of exhaust. The particulate matter collected on the paper filter generates a dark spot. The darkness of the spot is compared with the 0-to-9 gray scale provided by the manufacturer. The number assigned to the darkness of the sample is also known as the Bacharach smoke number. The ECOM smoke sampling procedure was used to obtain a DPM sample on tissue quartz for carbon analysis using NIOSH Analytical Method 5040.
39

RESULTS AND DISCUSSION
RESULTS OF ISOLATED ZONE TESTS
Ventilation Rates
The VR was measured continuously during each test at the downstream sampling station using a digital ultrasonic anemometer fixed to the center of the grid holding the DPM samplers. The charts of the ventilation logs are presented in Figures 15–19.
40
18
16
14
]
12
m^3
/s
10
tion
rate
[
8
6
Vent
ila
4
2
0 0 2000 4000 6000 8000 10000 12000
Time [s]
Baseline Engelhard DPX
Figure 15.—Ventilation rates for the tests involving #92128.
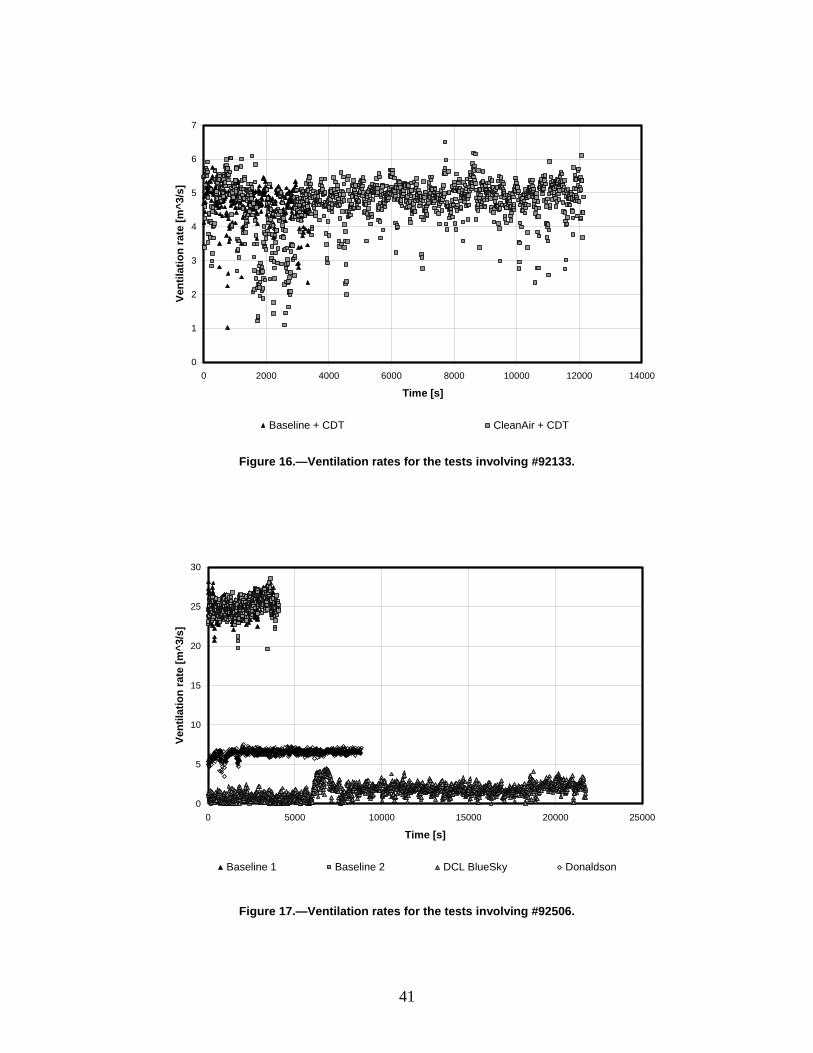
7
6
5
4
3
2
1
0 0 2000 4000 6000 8000 10000 12000 14000
Time [s]
Baseline + CDT CleanAir + CDT
Figure 16.—Ventilation rates for the tests involving #92133.
Vent
ilatio
n ra
te [m
^3/s
]
Vent
ilatio
n ra
te [m
^3/s
]
30
25
20
15
10
5
0 0 5000 10000 15000 20000 25000
Time [s]
Baseline 1 Baseline 2 DCL BlueSky Donaldson
Figure 17.—Ventilation rates for the tests involving #92506.
41

18
16
14
12
10
8
6
4
2
0
0 1000 2000 3000 4000 5000 6000
Time [s]
Baseline Baseline + PTX ECS Cattrap Biodiesel B20 + PTX Biodiesel B50 + PTX
Vent
ilatio
n ra
te [m
^3/s
]
Figure 18.—Ventilation rates for the tests involving #92526.
30
25
20
15
10
5
0
0 1000 2000 3000 4000 5000 6000 7000 8000
Time [s]
Baseline, #1 diesel Baseline, #2 diesel DCL MineX
Vent
ilatio
n ra
te [m
^3/s
]
Figure 19.—Ventilation rates for the tests involving #99942.
42

As noted previously, all ventilation data (downstream) and gaseous concentration data (upstream and downstream) used for each test (i.e., the test data) are averages of the logged data over the time period for the sampling of the HV samplers or standard samplers for that test. The ventilation rate coefficient (VRC) and the normalized net test vehicle contribution to the CO2 concentration for each test are summarized in Table 6.
43
Table 6.—Ventilation rate coefficients and normalized contributions of the test vehicles/configurations to CO2 concentrations
Test type Date
Ventilation rate coefficient (VRC)
Contribution of the vehicles to CO2
concentrations, ppm
High-volume sampling
period
Standard sampling
period Maximum
Average Standard Period
#92128 Haul Truck, MSHA VR = 5.66 m 3/s (12,000 ft3/min)
Baseline 5/26/2003 2.77 2.77 3,432 2,504
Engelhard DPX 5/26/2003 2.71 2.71 3,391 2,314
#92133 Haul Truck, MSHA VR = 5.66 m 3/s (12,000 ft3/min)
Baseline + CDT 5/22/2003 0.82 0.82 1,361 1,232
CleanAIR + CDT 5/22/2003 0.82 0.82 1,487 1,334
#92506 LHD, MSHA VR = 5.43 m 3/s (11,500 ft3/min)
Baseline 1 5/23/2003 4.56 4.62 5,866 1,694
Baseline 2 5/23/2003 4.55 4.61 5,472 1,652
DCL BlueSky 5/21/2003 0.31 0.31 715 553
Donaldson 5/23/2003 1.19 1.19 1,677 1,417
#92526 LHD, MSHA VR = 4.72 m 3/s (10,000 ft3/min)
Baseline 5/27/2003 2.89 2.91 7,418 3,289
Baseline + PTX 5/27/2003 2.93 2.95 7,220 3,515
ECS Cattrap 5/24/2003 1.27 1.27 3,291 2,404
Biodiesel B20 + PTX 5/28/2003 2.84 2.87 7,048 3,414
Biodiesel B50 +PTX 5/28/2003 2.93 2.95 7,220 3,467
#99942 LHD, MSHA VR = 7.08 m 3/s (15,000 ft3/min)
Baseline, #1 diesel 5/29/2003 3.41 3.46 8,338 2,539
Baseline, #2 diesel 5/30/2003 3.34 3.35 8,626 2,546
DCL MINE–X 5/29/2003 3.33 3.33 8,387 2,482

44
The data presented in Table 6 suggest that isolated zone tests can be divided into two groups with respect to the VR that prevailed during the tests. The first group consists of five tests conducted during the first 4 days of the study (5/21/2003 through 5/24/2003) in which the VR was maintained below or in the neighborhood of the MSHA VR for the particular test engine (see Figures 16–18 and Table 6 where VRC is about 1 or below). The VRs for the rest of the tests were significantly higher than the MSHA engine nameplate VRs for the test engines (see Figures 15, 17, 18, and 19, and Table 6). As alluded to earlier, it can be expected that the net contribution to CO2 concentrations for several tests using the same engine over the same duty cycle should be about equal when normalized for VR and when CO2 is unaffected by the control technology. It should be noted that the tailpipe emission results verified that none of the tested control technologies had a significant effect on the CO2 emissions. Thus, one can use this knowledge to check on the validity of any particular test. An examination of the vehicle contribution to the normalized CO2 concentrations shown in Table 6 reveals that the VR-normalized CO2 concentrations for the tests conducted while the VR was maintained in the neighborhood of the MSHA VR or below (VRC about 1 or below in Table 6) are significantly lower than those for the rest of the tests. One would expect that the VR-normalized CO2 contributions for the tests involving the DCL BlueSky and the Donaldson filtration systems on LHD #92506 would be equal to those of the other tests using LHD #92506. Similar expectations apply for the test involving the ECS Cattrap DPF system on LHD #92626. Likewise, similar VR-normalized CO2 levels would be expected for the baselines for haul trucks #92128 and #92133 because their tailpipe CO2 emissions (see Table 16) were almost identical at each test condition and because they were powered with similar engines (Deutz BF6M1013FC and BF6M1013ECP). However, the VR-normalized CO2 concentrations during the tests for those vehicles were significantly different. The observed concentrations were twice as high for #92128 compared to #92133 (see Table 6). Although the reason for these discrepancies was not clear at the time, the protocol was altered to increase the ventilation rate for the second week of testing primarily to reduce the ventilation rate fluctuations observed during the earlier tests with low ventilation rates.8
8At the time, the researchers suspected that ventilation air was leaking from the isolated zone midway between the load/dump points. The leak was verified the following year during another isolated zone study. Opening the ventilation doors both reduced the differential pressure driving the leak, reducing its volume flow, and increased the main airflow so that the effect of the remaining leak on contaminant concentrations was not significant.
Since neither a clear explanation nor method for correcting the data obtained at the low ventilation rates was at hand, only the results of the tests in which the VR was maintained significantly above the MSHA VRs are presented. The exception is the two tests conducted with haul truck #92133. Since the ventilation rates (Figure 16) and CO2
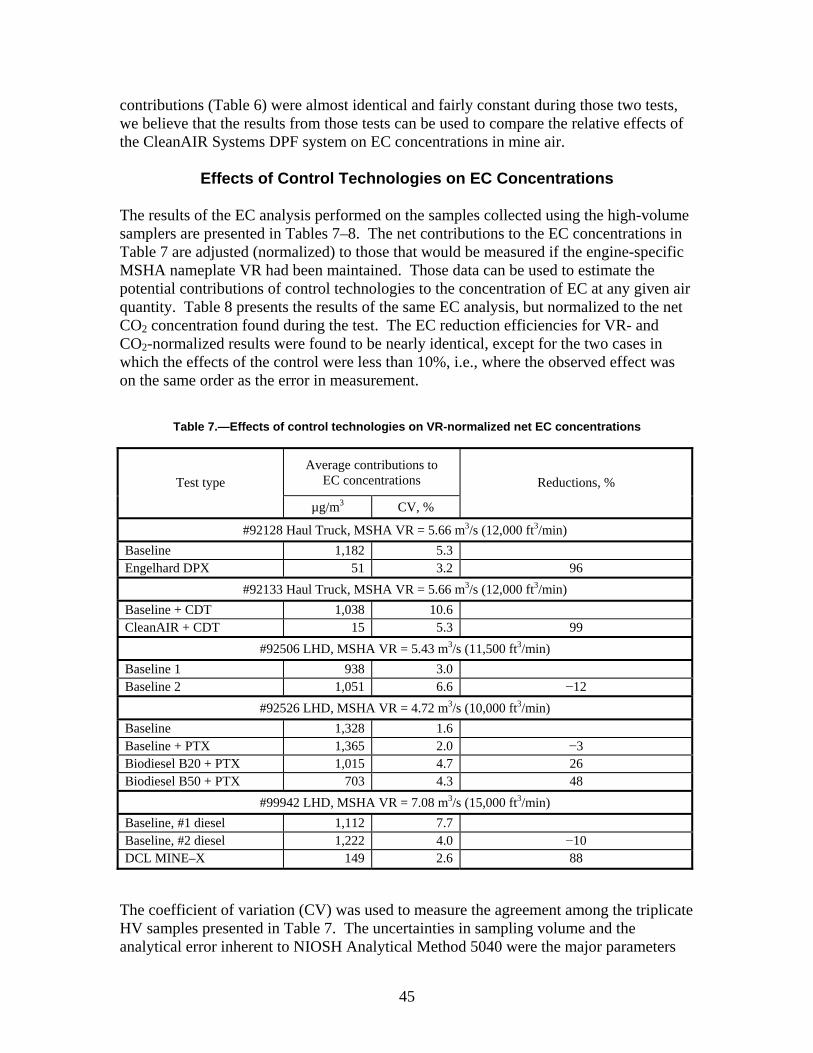
contributions (Table 6) were almost identical and fairly constant during those two tests, we believe that the results from those tests can be used to compare the relative effects of the CleanAIR Systems DPF system on EC concentrations in mine air.
Effects of Control Technologies on EC Concentrations
The results of the EC analysis performed on the samples collected using the high-volume samplers are presented in Tables 7–8. The net contributions to the EC concentrations in Table 7 are adjusted (normalized) to those that would be measured if the engine-specific MSHA nameplate VR had been maintained. Those data can be used to estimate the potential contributions of control technologies to the concentration of EC at any given air quantity. Table 8 presents the results of the same EC analysis, but normalized to the net CO2 concentration found during the test. The EC reduction efficiencies for VR- and CO2-normalized results were found to be nearly identical, except for the two cases in which the effects of the control were less than 10%, i.e., where the observed effect was on the same order as the error in measurement.
Table 7.—Effects of control technologies on VR-normalized net EC concentrations
Test type Average contributions to
EC concentrations Reductions, %
µg/m3 CV, %
#92128 Haul Truck, MSHA VR = 5.66 m 3/s (12,000 ft3/min) Baseline 1,182 5.3 Engelhard DPX 51 3.2 96
#92133 Haul Truck, MSHA VR = 5.66 m 3/s (12,000 ft3/min) Baseline + CDT 1,038 10.6 CleanAIR + CDT 15 5.3 99
#92506 LHD, MSHA VR = 5.43 m 3/s (11,500 ft3/min) Baseline 1 938 3.0 Baseline 2 1,051 6.6 −12
#92526 LHD, MSHA VR = 4.72 m 3/s (10,000 ft3/min) Baseline 1,328 1.6 Baseline + PTX 1,365 2.0 −3 Biodiesel B20 + PTX 1,015 4.7 26 Biodiesel B50 + PTX 703 4.3 48
#99942 LHD, MSHA VR = 7.08 m 3/s (15,000 ft3/min) Baseline, #1 diesel 1,112 7.7 Baseline, #2 diesel 1,222 4.0 −10
DCL MINE–X 149 2.6 88
The coefficient of variation (CV) was used to measure the agreement among the triplicate HV samples presented in Table 7. The uncertainties in sampling volume and the analytical error inherent to NIOSH Analytical Method 5040 were the major parameters
45

that contributed to the CV. The CVs for the elemental carbon results for the high-volume samplers obtained in this study ranged from 1.6% to 10.6%, with a median of 4.3% and a mean of 4.7%.
As mentioned previously, results of several of the tests were not further analyzed because of unexplainably low vehicle contributions to CO2 concentrations found for the tests conducted at low VRs. However, for the two tests on vehicle #92133, although the VRs were low, they were nearly identical, resulting in identical CO2 levels for both baseline and tests run with the DPF system. As a result of this consistency, the data for these tests were included in this report.
Table 8.—Effects of control technologies on CO2-normalized net EC concentrations
Test type
Average contributions to
EC concentrations,
µg/m3
Average contributions to
CO2 concentrations,
ppm
CECCO2 µg/m3/ppm
Reductions, %
#92128 Haul Truck, MSHA VR = 5.66 m3/s (12,000 ft3/min) Baseline 427 878 0.486 Engelhard DPX 18 855 0.021 96
#92133 Haul Truck, MSHA VR = 5.66 m3/s (12,000 ft3/min) Baseline + CDT 1,265 1,501 0.843 CleanAIR + CDT 18 1,618 0.011 99
#92506 LHD, MSHA VR = 5.43 m3/s (11,500 ft3/min) Baseline 1 206 370 0.555 Baseline 2 230 368 0.625 −13
#92526 LHD, MSHA VR = 4.72 m3/s (10,000 ft3/min) Baseline 459 1,082 0.424 Baseline + PTX 465 1,153 0.403 5 Biodiesel B20 + PTX
357 1,126 0.317 21
Biodiesel B50 + PTX
239 1,133 0.211 48
#99942 LHD, MSHA VR = 7.08 m3/s (15,000 ft3/min) Baseline, #1 diesel 325 752 0.432 Baseline, #2 diesel 366 814 0.449 −4 DCL MINE–X 44 745 0.059 87
Due to an unfortunate mistake in supplying fuel for a number of the tests, the two tests using LHD #92506, which were designed specifically to show the effects of the fuel formulation (#1 vs. #2 diesel) on the emissions, actually used nearly the same blend of diesel fuel (see Table 4), 90% #2 and 100% #2, respectively. These tests can be considered as an opportunity to examine repeatability of the test method. As can be determined from the preceding tables, the ability to replicate a test was about ±6%–7%.
46

Effects of Control Technologies on TPM
This section summarizes the results of the TPM measurements conducted at the upstream and downstream sampling stations using two TEOM 1400a ambient particulate monitors. A submicron preclassifier described earlier eliminated all particles with an average aerodynamic diameter larger than approximately 0.8 µm. The preclassifier was identical to that used for the HV samplers for EC, allowing a comparison of EC with TPM.
The observed concentrations of TPM measured at the upstream sampling station were negligible and therefore not used in this analysis. The VR-normalized TPM concentrations measured at the downstream monitoring station are presented in Table 9.
Table 9.—Concentrations of TPM under 0.8 µm at the downstream sampling station
Test Type Concentrations of TPM,
µg/m3 Reductions, %
Avg. Max. Avg.
#92128 Haul Truck, MSHA VR = 5.66 m 3/s (12,000 ft3/min)
Baseline 1,343.9 1,536.3 — Engelhard DPX 341.7 411.6 75%
#92506 LHD, MSHA VR = 5.43 m 3/s (11,500 ft3/min)
Baseline 1 3,964.1 7,313.2 — Baseline 2 N/A N/A —
#92526 LHD, MSHA VR = 4.72 m 3/s (10,000 ft3/min)
Baseline 1,631.9 2,083.0 — Baseline + PTX 1,874.6 2,324.6 — Biodiesel B20 + PTX 1,698.8 2,084.8 9% Biodiesel B50 + PTX 1,416.6 1,800.7 24%
#99942 LHD, MSHA VR = 7.08 m 3/s (15,000 ft3/min)
Baseline, #1 diesel 1,433.6 2,140.2 — Baseline, #2 diesel 1,735.1 2,739.2 −21%
DCL MINE–X
369.6 588.1 74%
The effects of the control technologies on TPM concentrations were expressed in terms of the percent reductions that were calculated using VR-normalized average values. These results show that both the Engelhard DPX and DCL MINE–X DPF systems reduced the TPM in the mine air by approximately 75%. These reductions were lower than those for EC shown in Table 7 (96% and 88%, respectively). A similar statement can be made for the tests of the biodiesel blends, which incorporated an Engelhard PTX DOC. However, the differences can be attributed to the fact that the TEOM measures total particulate mass while carbon analysis accounts only for the EC fraction of total particulate mass.
The plot shown in Figure 20 presents the time trace of concentrations measured by the TEOM during the baseline test of LHD #99942. The peaks and valleys shown on this
47

plot are due in part to the varying emission rates of the vehicle over the duty cycle, in part to fluctuations in VR, and in part to the relative position of the vehicle to the downstream sampling location. The time traces of the other measured emissions show similar trends. The near real-time TEOM TPM concentration data were used during the test to estimate the mass of DPM collected on the filters used in the HV and standard sampling methods for carbon analysis and thus to ensure that the sampling continued long enough to collect sufficient sample mass for accurate analysis without unduly prolonging the test.
0
500
1000
1500
2000
2500
Con
cent
ratio
n [u
g/m
^3]
0 1000 2000 3000 4000 5000 6000 7000 8000
Time [s]
Figure 20.—TPM concentrations at the downstream sampling station for the baseline test on LHD #99942.
Effects of Control Technologies on Particle Size Distribution and Number Concentration
This section summarizes the results of the measurements of size distributions and number concentrations of aerosols at the downstream sampling station. The measurements were performed using a Model 3936 scanning mobility particle sizer (SMPS) as described earlier. Only the results of the measurements made while vehicles were performing their duties at the downstream load/dump point in the isolated zone are presented in this report.
The results are presented in Table 10 and Figures 21–26. The statistical parameters and plots for two or three typical measurements are also shown for each of the test cases. The geometric mean diameter (GMD) and geometric standard deviation (GSD) are supplied for each of those distributions. The average GMD and average total particulate number concentration are calculated for each set of data, with the latter normalized with respect
48
to the MSHA VR specific for each test engine. Whereas previously the effect of a tested control technology has been expressed as its efficiency in reducing a contaminant concentration, here the effect of a tested control technology is expressed as the percentage of change in total particulate number concentrations with respect to the appropriate baselines. For most of the cases, the tests in which vehicles were operated with mufflers and standard fuel were considered to be the baseline cases. The exceptions were the tests that were conducted to assess the effects of the biodiesel blends. In these cases, the test conducted with the LHD #92526 equipped with a diesel oxidation catalytic converter and muffler was considered to be the baseline.
Since both of the tested DPFs—the Engelhard DPX and the DCL MINE–X—show dramatic reductions in the number of larger particles (see Figures 21–22), it can be concluded that the size distribution measurements qualitatively agree with the EC and TPM results for those systems. The size distributions of the particles that are observed for the tests with filtered exhaust are characterized with significantly lower GMDs and higher peak number concentrations than the size distributions observed during the tests with unfiltered exhaust. The distributions of particles generated by vehicles equipped with a muffler were characterized by GMDs ranging from 64 to 87 nm (see Table 10). In contrast, the distributions of particles generated by vehicles equipped with DPFs were characterized by a GMD ranging from 35 to 45 nm (see Table 10). Additionally, a significant increase in the total number of particles, approximately 60%–80%, was evident for both cases when mufflers were replaced with DPFs (see Table 10). Since carbon analysis shows very low mass concentrations of EC in the samples collected during the same tests with filtered exhaust, it can be stipulated that those particles contain primarily other known constituents of DPM such as organic carbons, sulfates, and water. Unfortunately, since appropriate samples were not gathered, a chemical analysis of the DPM samples is not available to confirm this hypothesis.
49

Table 10.—Effects of control technologies on concentration of aerosols in mine air
Test Type GMD, nm GSD
Average Geometric
Mean, nm
Average Total Particle Conc. at MSHA VR,
#/cm³
Change in Total Particle Conc., %
#92128 Haul Truck, MSHA VR = 5.66 m 3/s (12,000 ft3/min)
Baseline 71.64 1.83
67.28 4.49E+06 —65.84 1.83
64.35 1.90
Engelhard DPX
45.14 1.44
43.74 8.07E+06 79.6 43.46 1.47
42.63 1.44
#92506 LHD, MSHA VR = 5.43 m 3/s (11,500 ft3/min)
Baseline 1 83.75 1.63
78.18 1.43E+07 — 72.61 1.68
Baseline 2
81.34 1.66
79.91 1.29E+07 −9.9 82.02 1.66
76.39 1.80
#92526 LHD, MSHA VR = 4.72 m 3/s (10,000 ft3/min)
Baseline 85.05 1.68
85.74 8.56E+06 — 86.43 1.67
Baseline + PTX 72.22 1.75
72.40 1.01E+07 18.2 72.59 1.74
Biodiesel B20 + PTX
65.83 1.66 65.92 1.22E+07 20.4
66.01 1.65
Biodiesel B50 + PTX
63.32 1.60 61.76 1.15E+07 14.1
60.21 1.61
#99942 LHD, MSHA VR = 7.08 m 3/s (15,000 ft3/min)
Baseline, #1 diesel
74.41 1.64 75.42 1.63E+07 —76.60 1.65
75.24 1.65
Baseline, #2 diesel
81.57 1.65 81.93 1.71E+07 4.9 81.68 1.63
82.53 1.63
DCL MINE–X 40.70 1.58
38.06 2.61E+07 60.6 35.49 1.57
37.99 1.59
It is important to note that the size distributions and number concentrations of aerosols in the observed size range are highly dependent on the ambient conditions. The formation of aerosols could be significantly affected by the natural cooling process occurring in the isolated zone and the high relative humidity that prevailed during the tests. Averageambient temperatures of approximately 25 °C (77 °F) were recorded at the upstreamsampling station, and average ambient temperatures of approximately 10 °C (50 °F) were recorded at the downstream sampling station. The average relative humidity measured at the downstream station during the tests was approximately 90%.
50

dN/(d
log
D_p
) [#/
cm^3
]
2.50E+07
2.00E+07
1.50E+07
1.00E+07
5.00E+06
0.00E+00
Baseline, #1 Baseline, #2 Baseline, #3
Engelhard, #1 Engelhard, #2 Engelhard, #3
10 100 1000
D_p [nm]
Figure 21.—Size distribution of aerosols in mine air for truck #92128: the baseline case and Engelhard DPX DPF case (three measurements for each test).
dN/(d
log
D_p
) [#/
cm^3
]
6.00E+07
5.00E+07
10 100 1000
D_p [nm]
4.00E+07
3.00E+07
2.00E+07
1.00E+07
0.00E+00
Baseline, #1 Baseline, #2 Baseline, #3
DCL MineX, #1 DCL MineX, #2 DCL MineX, #3
Figure 22.—Size distribution of aerosols in mine air for LHD #99942: the baseline case
and DCL MINE–X DPF case (three measurements for each).
51

As mentioned previously, owing to an unfortunate mistake in supplying fuel for a number of the tests, the tests using LHD #92506 used similar blends of #2 and #1 fuel (see Table 4) and provided an opportunity to examine repeatability of the test method. The size distribution and number concentration results for these two tests showed relatively good agreement (see Figure 23). The results of the size distribution measurements (average GMD) summarized in Table 10 agree with the other particulate matter results obtained in this study, showing relatively good inter-test agreement.
0.00E+00
5.00E+06
1.00E+07
1.50E+07
2.00E+07
2.50E+07
3.00E+07
3.50E+07
dN/(d
log
D_p
) [#/
cm^3
]
10 100 1000
D_p [nm]
Baseline 1, #1 Baseline 1, #2 Baseline 2, #1 Baseline 2, #2 Baseline 2, #3
Figure 23.—Size distribution of aerosols in mine air for truck #92506: the baseline 1 case (two measurements) and baseline 2 case (three measurements).
The effects of the Engelhard PTX DOC on the size distribution of aerosols are apparent from Figure 24. The size distributions of the particles that are observed for the tests with the DOC are characterized with a somewhat lower GMD (72.40 vs. 85.74 nm) and higher peak number concentrations (1.01 × 10⁷ vs. 8.56 × 10⁶ #/cm3) than the size distributions observed during tests with the muffler alone (see Table 10 and Figure 24). An approximately 18% increase in the number of particles was found when the muffler was replaced with a DOC and muffler combination (see Table 10).
52

0.00E+00
2.00E+06
4.00E+06
6.00E+06
8.00E+06
1.00E+07
1.20E+07
1.40E+07
1.60E+07
1.80E+07
2.00E+07
dN/(d
log
D_p
) [#/
cm^3
]
10 100 1000
D_p [nm]
Baseline, #1 Baseline, #2 Baseline + PTX, #1 Baseline + PTX, #2
Figure 24.—Size distribution of aerosols in mine air for LHD #92526: the baseline case and Engelhard PTX DOC + muffler case (two measurements each).
Figure 25 illustrates the effects of B20 and B50 biodiesel blends on the size distribution of aerosols in the mine air. The results indicate that the size distributions of the particles for these particular biodiesel blends were characterized with somewhat lower GMDs and higher peak concentrations than the size distributions observed during the tests with #1 diesel (see Table 10 and Figure 25). The average geometric means for B50 (GMD = 61.76 nm) and B20 (GMD = 65.92 nm) indicate that increasing the biodiesel fraction of a blend might result in decreasing the GMDs for the size distributions. In addition, a significant increase in the number of particles was found when biodiesel blends were used (see Table 4). These results do not indicate a potential trend in the relationship between the biodiesel fraction in a blend and total number of particles emitted.
53

0.00E+00
5.00E+06
1.00E+07
1.50E+07
2.00E+07
2.50E+07
dN/(d
log
D_p
) [#/
cm^3
]
10 100 1000
D_p [nm]
Baseline + PTX, #1 Baseline + PTX, #2 Biodiesel B20 + PTX, #1
Biodiesel B20 + PTX, #2 Biodiesel B50 + PTX, #1 Biodiesel B50 + PTX, #2
Figure 25.—Size distribution of aerosols in mine air for LHD #92526 equipped with Engelhard PTX DOC and muffler: #2 diesel, biodiesel B20, and biodiesel B50 (two measurements each).
The effect of diesel fuel formulation (#1 vs. #2 diesel) on the size distribution of aerosols is shown in Figure 26. The size distributions of the particles that were observed during the tests with #2 diesel showed, on average, higher GMDs (81.93 vs. 75.42 nm) and higher peak number concentrations (1.71 × 10⁷ vs. 1.63 × 10⁷ #/cm3) than the size distributions observed for the tests with #1 diesel (see Table 10 and Figure 26). An approximately 5% increase in the number of the particles was found when #2 diesel was used instead of #1 (see Table 10). This finding is corroborated by the TEOM results, which also showed more than a 20% increase in the TPM concentration when #2 instead of #1 diesel was used.
54

0.00E+00
5.00E+06
1.00E+07
1.50E+07
2.00E+07
2.50E+07
3.00E+07
3.50E+07
dN/(d
log
D_p
) [#/
cm^3
]
10 100
D_p [nm] 1000
#1 diesel, #1
#2 diesel, #1
#1 diesel, #2
#2 diesel, #2
#1 diesel, #3
#2 diesel, #3
Figure 26.—Size distribution of aerosols in mine air for LHD #99942 equipped with muffler: #1 diesel and #2 diesel (three measurements each).
Effects of Control Technologies on Ambient Concentrations of CO, CO2, NO, and NO2
The average and maximum normalized concentrations of CO, CO2, NO, and NO2 measured at the downstream sampling station are shown in Table 11. The concentrations of CO2 were measured using an Innova 1312, and concentrations of CO, NO, and NO2 were measured using iTX multigas monitors. The obtained concentrations were normalized with respect to the MSHA VR specific to the test engine used. The observed background concentrations of CO, NO, and NO2 at the upstream sampling station were negligible and therefore not used to correct the downstream concentrations. The CO2 concentrations shown in Table 11 include the background CO2 concentrations, which averaged 402 ppm. This was done to facilitate the comparison of the measured CO2 values with the 1973 ACGIH time-weighted average (TWA) threshold limit values (TLVs) adopted by MSHA for underground metal/nonmetal mining regulations (30 CFR 57.5001).
It is important to note that the peak gaseous concentrations were recorded while the vehicle was performing the part of the duty cycle inside and in front of the stope at the downstream load/dump point.
55
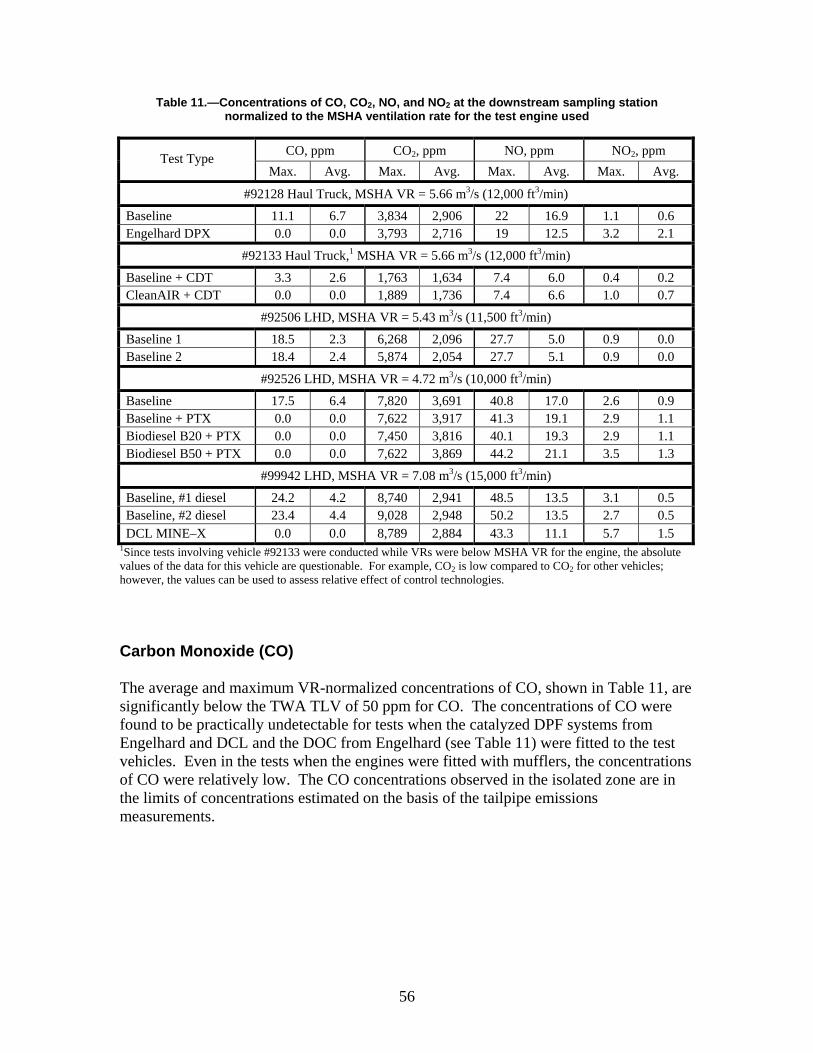
Carbon Monoxide (CO) The average and maximum VR-normalized concentrations of CO, shown in Table 11, are significantly below the TWA TLV of 50 ppm for CO. The concentrations of CO were found to be practically undetectable for tests when the catalyzed DPF systems from Engelhard and DCL and the DOC from Engelhard (see Table 11) were fitted to the test vehicles. Even in the tests when the engines were fitted with mufflers, the concentrations of CO were relatively low. The CO concentrations observed in the isolated zone are in the limits of concentrations estimated on the basis of the tailpipe emissions measurements.
56
Table 11.—Concentrations of CO, CO2, NO, and NO2 at the downstream sampling station normalized to the MSHA ventilation rate for the test engine used
Test Type CO, ppm CO2, ppm NO, ppm NO2, ppm Max. Avg. Max. Avg. Max. Avg. Max. Avg.
#92128 Haul Truck, MSHA VR = 5.66 m 3/s (12,000 ft3/min)
Baseline 11.1 6.7 3,834 2,906 22 16.9 1.1 0.6 Engelhard DPX 0.0 0.0 3,793 2,716 19 12.5 3.2 2.1
#92133 Haul Truck,1 MSHA VR = 5.66 m3/s (12,000 ft3/min)
Baseline + CDT 3.3 2.6 1,763 1,634 7.4 6.0 0.4 0.2 CleanAIR + CDT 0.0 0.0 1,889 1,736 7.4 6.6 1.0 0.7
#92506 LHD, MSHA VR = 5.43 m 3/s (11,500 ft3/min)
Baseline 1 18.5 2.3 6,268 2,096 27.7 5.0 0.9 0.0 Baseline 2 18.4 2.4 5,874 2,054 27.7 5.1 0.9 0.0
#92526 LHD, MSHA VR = 4.72 m 3/s (10,000 ft3/min)
Baseline 17.5 6.4 7,820 3,691 40.8 17.0 2.6 0.9 Baseline + PTX 0.0 0.0 7,622 3,917 41.3 19.1 2.9 1.1 Biodiesel B20 + PTX 0.0 0.0 7,450 3,816 40.1 19.3 2.9 1.1 Biodiesel B50 + PTX 0.0 0.0 7,622 3,869 44.2 21.1 3.5 1.3
#99942 LHD, MSHA VR = 7.08 m 3/s (15,000 ft3/min)
Baseline, #1 diesel 24.2 4.2 8,740 2,941 48.5 13.5 3.1 0.5 Baseline, #2 diesel 23.4 4.4 9,028 2,948 50.2 13.5 2.7 0.5
DCL MINE–X
0.0 0.0 8,789 2,884 43.3 11.1 5.7 1.5 1Since tests involving vehicle #92133 were conducted while VRs were below MSHA VR for the engine, the absolute values of the data for this vehicle are questionable. For example, CO2 is low compared to CO2 for other vehicles; however, the values can be used to assess relative effect of control technologies.

Carbon Dioxide (CO2)
The traces of VR-normalized concentrations of CO2 observed for the tests conducted during the study are shown in Figures 27–29. The averages and maximums are also presented in Table 11. Both average and maximum CO2 concentrations at the downstream station were below the TWA TLV level of 5,000 ppm for CO2 during the tests with haul truck #92128. For the tests involving the other tested vehicles, the average normalized concentrations of CO2 were found to be under the TWA TLV for CO2, but the peak concentrations were found to be significantly over the TWA TLV (see Table 11 and Figures 27–29).
The concentrations of CO2 were found to be unaffected by the tested DPF systems from Engelhard and DCL and the Engelhard PTX DOC (see Table 11). The concentrations observed in the isolated zone are in the limits of concentrations estimated on the basis of the tailpipe emissions measurements.
57
7000.0
6000.0
5000.0
4000.0
3000.0
2000.0
1000.0
0.0
Con
cent
ratio
ns [p
pm]
0 500 1000 1500 2000 2500 3000 3500 4000 4500 5000
Time [s]
Baseline, #1 diesel Baseline, #2 diesel
Figure 27.—Normalized CO2 concentrations for the tests with LHD #92506.
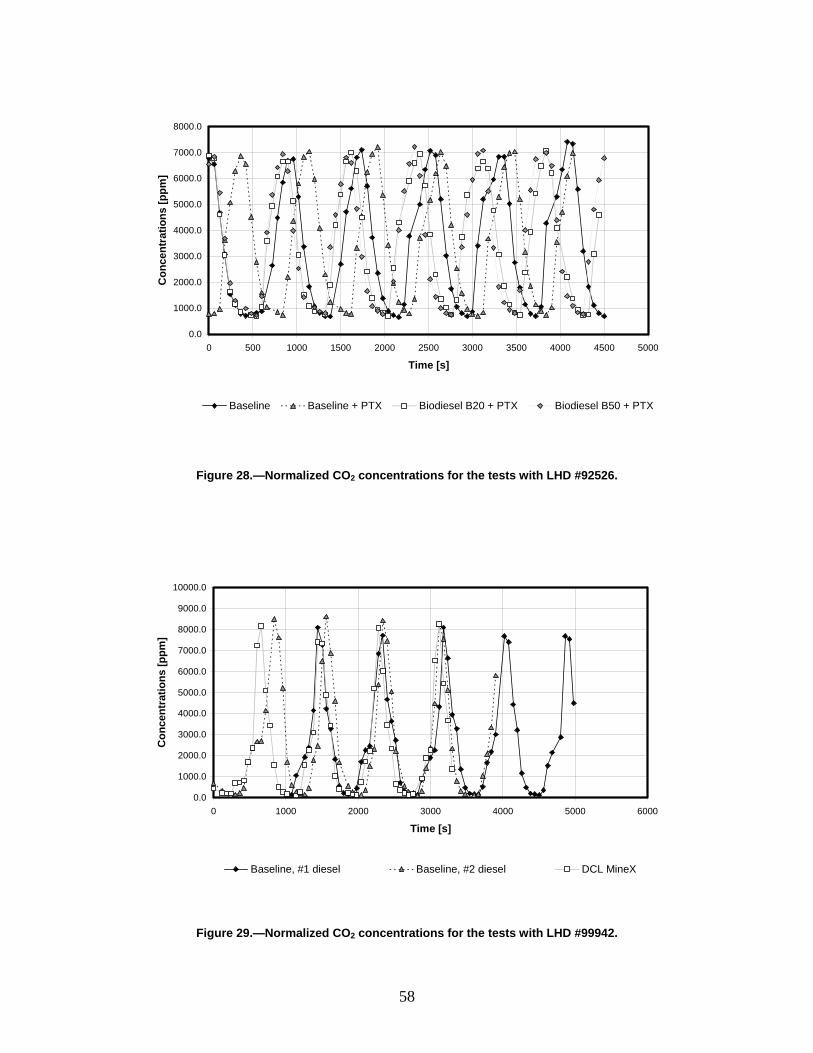
Con
cent
ratio
ns [p
pm]
8000.0
7000.0
6000.0
5000.0
4000.0
3000.0
2000.0
1000.0
0.0 0 500 1000 1500 2000 2500 3000 3500 4000 4500 5000
Time [s]
Baseline Baseline + PTX Biodiesel B20 + PTX Biodiesel B50 + PTX
Figure 28.—Normalized CO2 concentrations for the tests with LHD #92526.
Con
cent
ratio
ns [p
pm]
10000.0
9000.0
8000.0
7000.0
6000.0
5000.0
4000.0
3000.0
2000.0
1000.0
0.0 0 1000 2000 3000 4000 5000 6000
Time [s]
Baseline, #1 diesel Baseline, #2 diesel DCL MineX
Figure 29.—Normalized CO2 concentrations for the tests with LHD #99942.
58

Nitric Oxide (NO) For all tests, the average normalized concentrations of NO shown in Table 11 were found to be lower than the TWA TLV level for NO of 25 ppm. In the case of LHDs #92526 (see Table 11 and Figure 30) and #99942 (see Table 11 and Figure 31), the peak normalized concentrations were found to be significantly above the TWA TLV. An analysis of the results shown in Table 11 revealed that the average and peak concentrations of NO were slightly lower for the tests when the vehicles were equipped with DPF systems rather than with mufflers. The analysis also showed that the biodiesel blends slightly increased the concentrations of NO over the baseline established with #1 diesel fuel.
59
50.0
45.0
40.0
35.0
[ppm
]
30.0
ns
25.0atio
20.0entr
15.0
Con
c
10.0
5.0
0.0 0 1000 2000 3000 4000 5000 6000
Time [s]
Baseline Baseline + PTX Biodiesel B20 + PTX Biodiesel B50 + PTX
Figure 30.—Normalized NO concentrations for the tests with LHD #92526.

Con
cent
ratio
ns [p
pm]
60.0
50.0
40.0
30.0
20.0
10.0
0.0 0 1000 2000 3000 4000 5000 6000 7000 8000
Time [s]
Baseline, #1 diesel Baseline, #2 diesel DCL MineX
Figure 31.—Normalized NO concentrations for the tests with LHD #99942.
Nitrogen Dioxide (NO2) Assessing the effects of the DPF systems, particularly those that were washcoated with a platinum catalyst, on concentrations of NO2 in mine air was one of the major objectives of this study. The results of the NO2 measurements, summarized in Table 11, show that the average normalized concentrations of NO2 increased approximately twofold (1.3 vs. 0.6 ppm) when haul truck #92128 was equipped with the Engelhard DPX DPF system instead of a muffler (see Figure 32). Comparable increases (2.1 vs. 0.9 ppm) in NO2 concentration was observed for the DCL MINE–X DPF system and also for the CleanAIR DPF system (0.7 vs. 0.2 ppm) (see Table 11). It is important to note that if the required MSHA VRs were maintained during the tests, the average concentration of NO2 over the test periods would not have exceeded 3 ppm, the 1973 ACGIH TWA TLV limit for NO2. It is also important to note that, on several occasions while #99942 equipped with DCL MINE–X was operated within and in front of the downstream stope, the VR-normalized peak concentrations exceeded 5 ppm, the 1973 ACGIH short-term exposure limit (STEL) for NO2 currently used by MSHA as a ceiling limit to regulate exposure of underground metal and nonmetal miners to NO2 (30 CFR 57.5001) (see Figure 33). An analysis of the data showed that the average and peak concentrations of NO2 were only slightly higher in the tests when LHD #92526 was fueled with biodiesel blends instead of regular diesel fuel. The results of the test when LHD #92526 was fitted with the Engelhard PTX DOC and a muffler showed insignificantly higher NO2 emissions than when only the muffler was fitted to the vehicle.
60

Con
cent
ratio
ns [p
pm]
3.5
3.0
2.5
2.0
1.5
1.0
0.5
0.0 0 2000 4000 6000 8000 10000 12000
Time [s]
Baseline Engelhard DPX
Figure 32.—Normalized NO2 concentrations at the downstream sampling station for the tests with haul truck #92128.
6.0
5.0
Con
cent
ratio
ns [p
pm]
4.0
3.0
2.0
1.0
0.0 0 1000 2000 3000 4000
Time [s] 5000 6000 7000 8000
Baseline, #1 diesel Baseline, #2 diesel DCL MineX
Figure 33.—Normalized NO2 concentrations at the downstream sampling station for the tests with LHD #99942.
61
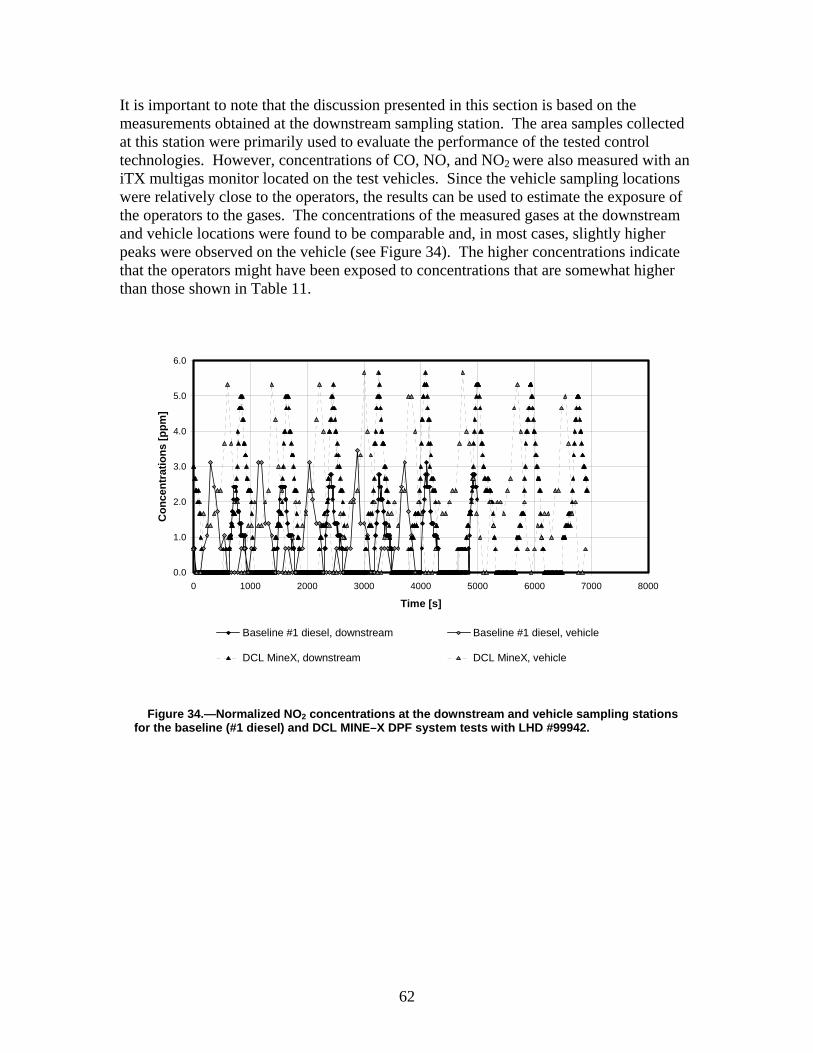
It is important to note that the discussion presented in this section is based on the measurements obtained at the downstream sampling station. The area samples collected at this station were primarily used to evaluate the performance of the tested control technologies. However, concentrations of CO, NO, and NO2 were also measured with an iTX multigas monitor located on the test vehicles. Since the vehicle sampling locations were relatively close to the operators, the results can be used to estimate the exposure of the operators to the gases. The concentrations of the measured gases at the downstream and vehicle locations were found to be comparable and, in most cases, slightly higher peaks were observed on the vehicle (see Figure 34). The higher concentrations indicate that the operators might have been exposed to concentrations that are somewhat higher than those shown in Table 11.
62
6.0
5.0
4.0
3.0
2.0
1.0
0.0 0 1000 2000 3000 4000
Time [s] 5000 6000 7000 8000
Baseline #1 diesel, downstream Baseline #1 diesel, vehicle
DCL MineX, downstream DCL MineX, vehicle
Figure 34.—Normalized NO2 concentrations at the downstream and vehicle sampling stations for the baseline (#1 diesel) and DCL MINE–X DPF system tests with LHD #99942.
Con
cent
ratio
ns [p
pm]
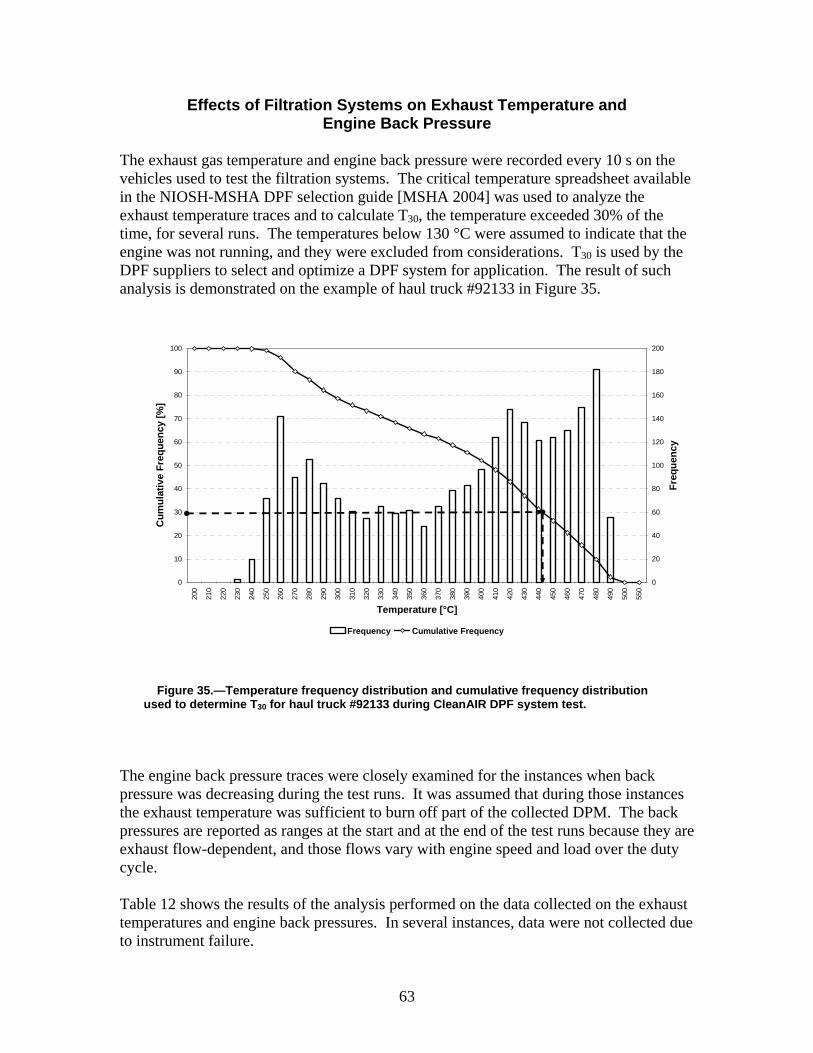
Effects of Filtration Systems on Exhaust Temperature and Engine Back Pressure
The exhaust gas temperature and engine back pressure were recorded every 10 s on the vehicles used to test the filtration systems. The critical temperature spreadsheet available in the NIOSH-MSHA DPF selection guide [MSHA 2004] was used to analyze the exhaust temperature traces and to calculate T30, the temperature exceeded 30% of the time, for several runs. The temperatures below 130 °C were assumed to indicate that the engine was not running, and they were excluded from considerations. T30 is used by the DPF suppliers to select and optimize a DPF system for application. The result of such analysis is demonstrated on the example of haul truck #92133 in Figure 35.
100 200
90 180
80 160
Cum
ulat
ive
Freq
uenc
y [%
]
70
60
50
40
30
20
10
0
140
120
100
80
60
40
20
0
Freq
uenc
y
200
210
220
230
240
250
260
270
280
290
300
310
320
330
340
350
360
370
380
390
400
410
420
430
440
450
460
470
480
490
500
550
Temperature [°C]
Frequency Cumulative Frequency
Figure 35.—Temperature frequency distribution and cumulative frequency distribution used to determine T30 for haul truck #92133 during CleanAIR DPF system test.
The engine back pressure traces were closely examined for the instances when back pressure was decreasing during the test runs. It was assumed that during those instances the exhaust temperature was sufficient to burn off part of the collected DPM. The back pressures are reported as ranges at the start and at the end of the test runs because they are exhaust flow-dependent, and those flows vary with engine speed and load over the duty cycle.
Table 12 shows the results of the analysis performed on the data collected on the exhaust temperatures and engine back pressures. In several instances, data were not collected due to instrument failure.
63

Table 12.—Results of analysis of exhaust temperatures and engine back pressures
Back Pressure
Test Type T30 Temperature, °C
Ranges, kPa (in H2O)
Did DPF regenerate over duty
cycle? Start of test: min-max
End of test: min-max
#92128 Haul Truck Baseline 260 0.5–3.7 (2–15) — Engelhard DPX 265 8.7–25 (35–100) 8.7–25 (35–100) No
#92133 Haul Truck Baseline + CDT 410 N/A CleanAIR + CDT 440 4.0–15.4 (16–62) 0.62–2.2 (2.5–9) Yes
#92506 LHD Baseline 1 455 N/A Baseline 2 455 N/A
DCL BlueSky 490 3.0–7.0 (12–28) 8.7–20 (35–80) No Donaldson 370 0.07–0.57 (0.25–2.3) 0.07–0.57 (0.25–2.3)
#92526 LHD Baseline 460 0.5–2.7 (2–11) Baseline + PTX 440 1.1–2.86 (4.5–11.5) ECS Cattrap Faulted 2.5–8.2 (10–33) 2.5–8.2 (10–33) No Biodiesel B20+PTX 440 1.5–2.86 (6–11.5) Biodiesel B50+PTX Faulted 1.2–2.86 (5–11.5)
#99942 LHD Baseline, #1 diesel Faulted Faulted
Baseline, #2 diesel 500 3.0–6.2 (12–25) DCL MINE–X Faulted Faulted Faulted Unknown
DPF Regeneration
An example of exhaust temperature and engine back pressure traces recorded during this study is shown in Figure 36. The data presented in this figure indicate that the CleanAIR DPF system, which was used with a CDT fuel additive, had been regenerating during the test cycle. Similar measurements performed on the other tested vehicles indicate that the Engelhard, DCL BlueSky, and ECS DPF systems did not regenerate during the test runs. In addition, there is no indication that the relatively clean Donaldson high-temperature DFE was regenerating during the short duration of the test. There are not enough data to verify whether the DCL MINE–X DPF system regenerated over the test cycle.
64

14
600 18
16
500 Exhaust Temperature
[°C]
Back Pressure [kPa]
8:38:24 9:50:24 11:02:24 12:14:24 13:26:24 14:38:24
Local Time [hh:mm:ss]
Exha
ust T
empe
ratu
re [°
C]
400 12
10
300
8
200 6 Bac
k Pr
essu
re [k
Pa]
100
2
0 0
Figure 36.—Exhaust temperature and engine back pressure trace recorded during the isolated zone test of the CleanAIR DPF system.
4
Exhaust Temperature The exhaust temperatures were found to be affected by the type of tested vehicle/engine and by the configuration of the exhaust system. In the case of haul truck #92128 and LHDs #92506, #92526, #99942, temperatures were relatively high (see Table 12), with T30 temperatures higher than 400 °C. In contrast, the temperatures were relatively low for the two tests with haul truck #92128; the T30 temperatures were around 260 °C. These temperatures are surprisingly low when one takes in consideration that haul trucks #92128 and #92133 are similar in design and powered by similar engines. The measurements on haul truck #92133 showed that T30 increased by 30 °C when the muffler was replaced with the CleanAIR DPF system. A similar increase in T30 (35 °C) was observed when the muffler on #92506 was replaced by the DCL BlueSky DPF system. The increase in exhaust temperature corresponds to an observed increase in engine back pressure, which typically occurs when the muffler is replaced with a DPF system. T30 for the Donaldson DFE was found to be lower than T30 for the muffler (370 vs. 455 °C). It is important to note that the exhaust temperatures at the inlet filter face of the DFE often exceeded 260 °C (500 °F), the maximum temperature recommended by the manufacturer.
65

Engine Back Pressure
With the CleanAIR DPF system installed, the peak engine back pressure varied from 4.0 to 15.4 kPa (16 to 62 in H2O) at the start of the test and decreased to 0.62–2.2 kPa (2.5–9 in H2O) at the end of the 3-hr 22-min test (see Figure 36). The engine back pressures with the Engelhard DPX and DCL BlueSky DPF systems were excessive, with peaks ranging from 8.7 to 25 kPa (35 to 100 in H2O) and from 8.7 to 20 kPa (35 to 80 in H2O), respectively. The peak values caused by the high load parts of the duty cycle did not decrease over the test runs, indicating that DPF regeneration did not occur during those test runs. On the contrary, in the case of the Donaldson DFE, the engine back pressure remained low throughout the test, ranging from 0.07 to 0.57 kPa (0.25 to 2.3 in H2O) over the course of the test.
RESULTS OF TAILPIPE EMISSIONS MEASUREMENTS
This section presents and discusses the results of particulate matter and gaseous emissions measurements. Particulate samples were collected at high-idle (HI) and torque converter stall (TCS) modes. Gaseous emissions were measured at HI, TCS, and low-idle (LI) modes. All but three of the control technologies tested involve DPFs. The results of the measurements are presented below.
Particulate Matter Emissions: EC
The EC results from the exhaust pipe measurements for the tested control technologies are summarized in Table 13. The reduction in EC was calculated by comparing the measurement taken upstream (untreated or raw exhaust) to that taken downstream of the DPF or DOC. For biodiesel tests, reductions were computed by comparing engine-out emissions upstream of the Engelhard PTX DOC for the baseline fuel and for the biodiesel blends. The EC reductions, obtained by comparing measurements taken downstream of the DOC, are somewhat lower.
66

Table 13.—Effects of control technologies on elemental carbon emissions
Test Type
EC, µg/m3
HI EC, µg/m3
TCS Reduction of EC,
%
Upstream Down- stream Upstream Down
stream HI TCS
#92128 Haul Truck Engelhard DPX 2,369 <920 18,230 <920 >61 >95
#92133 Haul Truck CleanAIR 6,043 <920 33,537 <920 >85 >97
#92506 LHD DCL BlueSky 5,282 1,055 23,316 <920 80 >96
Donaldson 3,353 <920 18,230 1,748 >72 90 #92526 LHD
ECS Cattrap 8,898 <920 8,254 <920 >90 >89 Baseline + PTX 16,049 11,529 8,230 6,712 28 18 Biodiesel B20 + PTX 13,798 12,532 5,641 4,858 14 31 Biodiesel B50 + PTX 9,890 8,690 4,537 4,217 38 45
#99942 LHD DCL MINE–X
40,838 <920 16,417 <920 >98 >94
For all but two instances, the EC found on the sample collected downstream of the DPFs was below the limit of detection of NIOSH Analytical Method 5040. For these samples, the limit of quantification (LOQ) of the method was used as the sample EC value. The method has an LOQ of approximately 1.5 µg per filter for EC and is about three times the nominal limit of detection. The LOQ, which is greater than the actual EC on the sample, was converted into an equivalent EC concentration (920 µg/m3) for the exhaust volume sampled and was used to compute the EC reduction efficiency of the DPF. This procedure results in an estimate of the control efficiency, which becomes increasingly conservative as the upstream EC concentrations become less than a factor of 10 greater than the LOQ equivalent concentration. For all but one (the DCL MINE–X) of the DPFs tested at HI, the upstream EC was so low that the necessary use of the LOQ-equivalent EC concentration for the downstream measurement resulted in an underestimation of the EC reduction for that DPF (see Table 13).
Most of the upstream EC concentrations at TCS were high enough relative to the LOQ equivalent used for the downstream samples to allow an estimation of the EC reduction efficiencies of the DPFs tested. At TCS, the emissions measurements showed that the tested DPF systems were over 90% efficient in removal of EC (see Table 13 and Figure 37). Figure 37 shows the reduction of EC emissions obtained for all of the control technologies tested with the engine at TCS. The darker bars in the figure represent the EC reductions calculated when EC could be quantified, while the lighter bars show the minimum EC reductions estimated using the LOQ.
67

0.00
10.00
20.00
30.00
40.00
50.00
60.00
70.00
80.00
90.00
100.00
Red
uctio
n in
EC
[%]
Biodiesel Biodiesel Donaldson ECS Cattrap DCL MineX Engelhard DCL CleanAir B20 + PTX B50 + PTX DPX BlueSky
Type of Control Technology
Figure 37.—Reduction of EC emissions at TCS.
An examination of the EC results for LHD #92526 in Table 13 shows that in every emissions test with the DOC, the EC concentration downstream of the DOC was lower than the upstream concentration, a finding consistent with the EC reduction results obtained for the same DOC in the isolated zone.
Particulate Matter Emissions: Bacharach Smoke Number
In this study, the Bacharach smoke number was used to provide a qualitative estimate of the effectiveness of a DPF to reduce DPM and to avoid testing a defective DPF. The smoke numbers that were obtained upstream and downstream of the DPFs or DOC are presented in Table 14. No smoke number data were gathered for LHD #92506 because of a scheduling constraint. For the DPFs measured, the upstream smoke number ranged from 3 to 9, while all of the downstream smoke numbers measured zero. Values for the smoke number of untreated exhaust can range anywhere from 3 to 9 (totally black). This study showed that the smoke number method can be used to track the filtering ability of a DPF during use and untreated engine emissions if they are less than 9.
68

Table 14.—Effects of control technologies on DPM emissions: Bacharach smoke number
Test Type Bacharach smoke number
HI Bacharach smoke number
TCS Upstream Downstream Upstream Downstream
#92128 Haul Truck Engelhard DPX 3.0 0.0 7.0 0.0
#92133 Haul Truck CleanAIR 3.0 0.0 4.0 0.0
#92526 LHD Biodiesel B20 + PTX 8.0 8.0 7.5 6.0 Biodiesel B50 + PTX 7.5 7.5 7.5 6.0
#99942 LHD DCL MINE–X
9.0 0.0 8.0 0.0
The smoke numbers for the tested DPF systems from Engelhard, CleanAIR, and DCL (MINE–X) confirm that these systems were quite effective in reducing DPM emissions. A comparison of the smoke numbers obtained upstream and downstream of the tested Engelhard PTX DOC indicated a reduction in DPM.
The smoke numbers presented in Table 14 do not show significant reductions of DPM concentrations in the exhaust for the biodiesel blends. A comparison of the B20 and B50 smoke numbers obtained under the same engine test mode or sampling location shows little or no difference between the two blends. This finding is contrary to the relatively large difference in isolated zone and tailpipe EC concentrations for these two blends. Additionally, the DOC, which had a discernable effect on smoke number, showed only a small difference in tailpipe or EC concentration in the isolated zone test. Thus, the smoke number can be considered only as a rough estimate of DPM emissions and is most useful for tracking relative changes in DPM emissions from an engine or out of a DPF system.
Emissions of CO, CO2, NO, and NO2
The effects of the tested control technologies on tailpipe emissions of CO, CO2, NO, and NO2 were estimated from the measurements made upstream and downstream of the tested control technologies. The gases were measured for three engine operating conditions— LI, HI, and TCS—using ECOM KL (NIOSH) and Enerac 400 (SMC) combustion analyzers.
The effects of the biodiesel blends on gaseous emissions were obtained by comparing the results of emissions measurements obtained upstream of the Engelhard PTX DOC on the LHD #92526 fueled with the biodiesel blend to the results upstream of the ECS Cattrap when the LHD was fueled with #1 diesel fuel. The effects of the Engelhard PTX DOC on the gaseous emissions were evaluated by comparing the upstream to the downstream measurements conducted during the tests on the LHD fueled with biodiesel blends.
69

The agreement between the ECOM KL and Enerac 400 was found to be within experimental error in most instances. Some discrepancies in the readings can be explained by differences in the protocols used by the instruments; in other instances, the discrepancies have no explanation. This is certainly the case for the NO measurements performed downstream of the Engelhard DPF on truck #92128 at LI.
The results of the CO concentration measurements are shown in Table 15. The DPF systems and DOC tested in this study drastically reduced the concentrations of CO. The reductions can be attributed to the platinum catalyst used in each of the systems. The Donaldson disposable filter also (surprisingly) reduced CO emissions. The extremely high concentrations of CO in the exhaust of LHD #92506 at HI conditions indicate serious problems with the engine fueling system. The CO emissions from the other vehicles were within the manufacturer’s specifications.
Table 15.—CO tailpipe emissions
Test Type
CO, ppm HI
CO, ppm LI
CO, ppm TCS Instrument Up-
stream Down-
stream Up-
stream Down-
stream Up-
stream Down-
stream #92128 Haul Truck
Engelhard DPX 217.0 0.0 197.0 0.0 136.0 0.0 ECOM 204.0 0.0 170.0 0.0 131.0 0.0 Enerac
#92133 Haul Truck CleanAIR Systems 314.0 2.0 100.0 0.0 114.0 0.0 ECOM
301.0 0.0 110.0 0.0 109.0 11.0 Enerac #92506 LHD
DCL BlueSky 2,437.0 1,329.0 168.0 3.0 386.0 3.0 ECOM 2,207.0 910.0 208.0 0.0 460.0 0.0 Enerac
Donaldson N/A N/A N/A N/A N/A N/A ECOM 2,960.0 1,359.0 248.0 79.0 268.0 210.0 Enerac
#92526 LHD ECS Cattrap 278.0 2.0 N/A N/A 106.0 0.7 ECOM
238.0 0.0 168.0 0.0 98.0 0.0 Enerac Biodiesel B20 + PTX
18.7 17.5 158.0 1.0 70.7 1.0 ECOM 167.0 16.0 173.0 0.0 74.0 4.0 Enerac
Biodiesel B50 + PTX
203.0 22.0 N/A N/A 75.0 6.0 ECOM 174.0 21.0 159.0 0.0 76.0 13.0 Enerac
#99942 LHD DCL MINE–X 375.7 0.0 N/A N/A 228.5 0.0 ECOM
343.0 0.0 125.0 0.0 215.0 0.0 Enerac
The instrument-calculated concentrations of CO2 in the exhaust of the tested vehicles/ configurations are shown in Table 16. The CO2 emissions were not significantly affected by any of the control technologies.
70
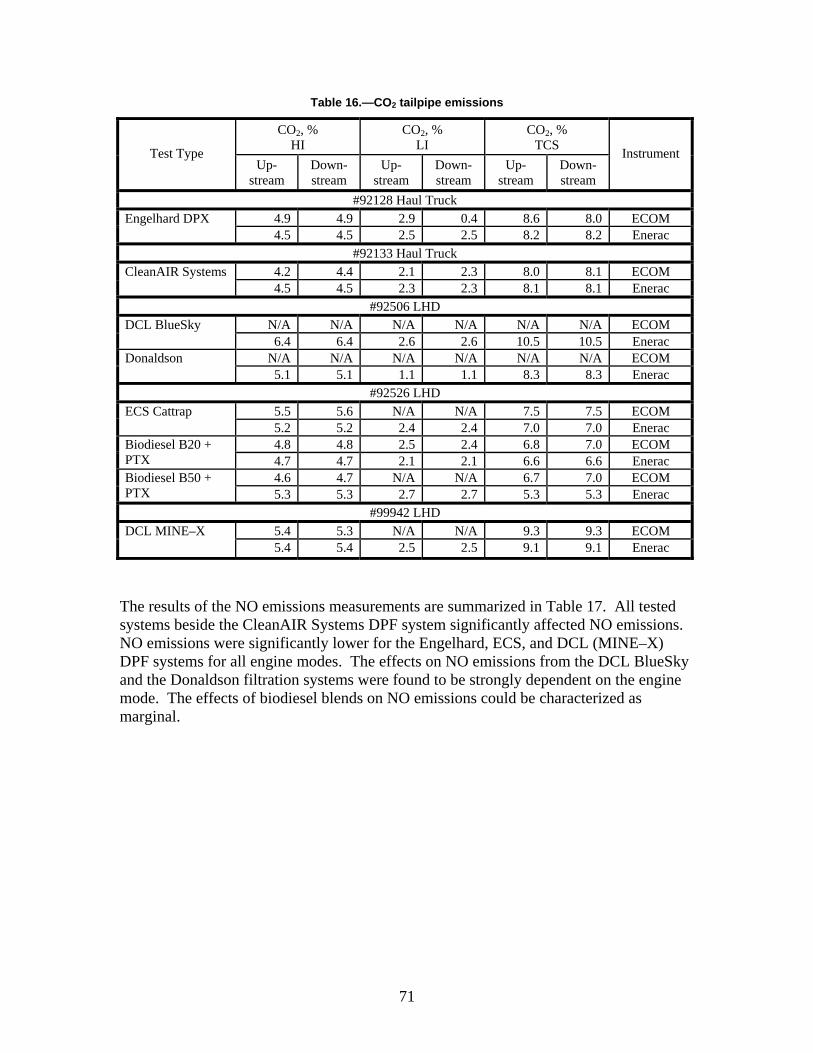
Table 16.—CO2 tailpipe emissions
Test Type
CO2, % HI
CO2, % LI
CO2, % TCS Instrument
Up- stream
Down- stream
Up- stream
Down- stream
Up- stream
Down- stream
#92128 Haul Truck Engelhard DPX 4.9 4.9 2.9 0.4 8.6 8.0 ECOM
4.5 4.5 2.5 2.5 8.2 8.2 Enerac #92133 Haul Truck
CleanAIR Systems 4.2 4.4 2.1 2.3 8.0 8.1 ECOM 4.5 4.5 2.3 2.3 8.1 8.1 Enerac
#92506 LHD DCL BlueSky N/A N/A N/A N/A N/A N/A ECOM
6.4 6.4 2.6 2.6 10.5 10.5 Enerac Donaldson N/A N/A N/A N/A N/A N/A ECOM
5.1 5.1 1.1 1.1 8.3 8.3 Enerac #92526 LHD
ECS Cattrap 5.5 5.6 N/A N/A 7.5 7.5 ECOM 5.2 5.2 2.4 2.4 7.0 7.0 Enerac
Biodiesel B20 + PTX
4.8 4.8 2.5 2.4 6.8 7.0 ECOM 4.7 4.7 2.1 2.1 6.6 6.6 Enerac
Biodiesel B50 + PTX
4.6 4.7 N/A N/A 6.7 7.0 ECOM 5.3 5.3 2.7 2.7 5.3 5.3 Enerac
#99942 LHD DCL MINE–X 5.4 5.3 N/A N/A 9.3 9.3 ECOM
5.4 5.4 2.5 2.5 9.1 9.1 Enerac
The results of the NO emissions measurements are summarized in Table 17. All tested systems beside the CleanAIR Systems DPF system significantly affected NO emissions. NO emissions were significantly lower for the Engelhard, ECS, and DCL (MINE–X) DPF systems for all engine modes. The effects on NO emissions from the DCL BlueSky and the Donaldson filtration systems were found to be strongly dependent on the engine mode. The effects of biodiesel blends on NO emissions could be characterized as marginal.
71

Table 17.—NO tailpipe emissions
Test Type
NO, ppm HI
NO, ppm LI
NO, ppm TCS Instru
ment Up- stream
Down- stream
Up- stream
Down- stream
Up- stream
Down- stream
#92128 Haul Truck Engelhard DPX 439.5 360.0 414.0 3.0 500.0 341.0 ECOM
434.0 389.0 412.0 292.0 506.0 427.0 Enerac #92133 Haul Truck
CleanAIR Systems 240.0 281.0 176.0 161.0 407.0 374.0 ECOM 260.0 283.0 188.0 188.0 435.0 415.0 Enerac
#92506 LHD DCL BlueSky 124.0 203.0 284.0 278.0 476.0 355.0 ECOM
172.0 214.0 300.0 303.0 491.0 443.0 Enerac Donaldson 213.0 N/A N/A N/A 423.5 N/A ECOM
163.0 287.0 373.0 151.0 529.0 474.0 Enerac #92526 LHD
ECS Cattrap 186.5 143.0 245.0 N/A 427.0 301.7 ECOM 204.0 146.0 240.0 85.0 452.0 259.0 Enerac
Biodiesel B20 + PTX 189.3 192.0 240.0 215.0 491.7 483.0 ECOM 209.0 208.0 211.0 213.0 492.0 492.0 Enerac
Biodiesel B50 + PTX 161.0 159.0 225.0 N/A 449.0 426.0 ECOM 205.0 196.0 226.0 176.0 487.0 440.0 Enerac
#99942 LHD DCL MINE–X 206.0 150.5 N/A N/A 547.0 438.5 ECOM
250.0 159.0 329.0 113.0 607.0 523.0 Enerac
The results of the NO2 emission measurements are summarized in Table 18. Significantly higher NO2 concentrations were observed downstream than upstream of the platinum-catalyzed DPFs tested in this study (Engelhard DPX and DCL MINE–X). Fourfold increases in NO2 emissions were observed at TCS conditions. Significant increases in NO2 emissions were also observed for the ECS Cattrap system, which by itself should not have an effect on NO2 emissions owing to using a base-metal catalyst. However, a new platinum-catalyzed ECS DOC had been installed after the DPF. Thus, that system, probably because of the DOC, increased NO2 emissions almost sixfold at TCS conditions. The results of the measurements show no significant increase in NO2 emissions for the biodiesel blends relative to the #1 diesel baseline.
72

Table 18.—NO2 tailpipe emissions
Test Type
NO2, ppm HI
NO2, ppm LI
NO2, ppm TCS
Instrument Up-
stream Down-
stream Up-
stream Down-
stream Up-
stream Down-
stream #92128 Haul Truck
Engelhard DPX 58.0 98.0 73.0 3.0 25.0 89.0 ECOM 87.0 121.0 72.0 170.0 23.0 101.0 Enerac
#92133 Haul Truck CleanAIR Systems 51.0 12.0 21.0 43.0 25.0 39.0 ECOM
51.0 8.0 10.0 38.0 11.0 7.0 Enerac #92506 LHD
DCL BlueSky 83.0 6.0 40.0 50.0 16.0 16.0 ECOM 48.0 0.0 51.0 65.0 2.0 14.0 Enerac
Donaldson — — — — — — ECOM 28.0 1.0 61.0 0.0 0.0 1.0 Enerac
#92526 LHD ECS Cattrap 34.0 59.0 55.0 — 17.0 121.0 ECOM
31.0 81.0 68.0 177.0 31.0 163.0 Enerac Biodiesel B20 + 22.0 16.0 34.0 36.0 16.0 36.0 ECOM PTX 215.0 213.0 257.0 251.0 501.0 509.0 Enerac Biodiesel B50 + 21.0 21.0 18.0 — 12.0 40.0 ECOM PTX 6.0 3.0 43.0 41.0 6.0 8.0 Enerac
#99942 LHD DCL MINE–X 28.3 68.0 — — 17.5 89.5 ECOM
10.0 85.0 29.0 190.0 10.0 45.0 Enerac
These results show that NO2 concentrations need to be closely monitored in underground work areas where vehicles equipped with aftertreatment components that have a high potential of converting NO to NO2 are used.
73
SUMMARY
The effects of selected diesel emissions control technologies on the airborne concentrations of particulate matter and selected gases were assessed using results of tests conducted in an isolated zone in an underground metal mine. Although six DPF systems were tested, results for only two of the systems were not compromised by ventilation problems: the Engelhard DPX and the DCL MINE–X. However, ventilation rates for the baseline test and the test of the CleanAIR DPF system on truck #92133 were equal, allowing a comparison to be made. The results of the tests conducted with LHD #92526 were used to quantify the effects of the biodiesel blends B20 and B50 and an Engelhard model PTX DOC. The Engelhard DPX, DCL MINE–X, and CleanAIR DPF systems reduced mass concentrations of EC by approximately 96%, 88%, and 99%, respectively. However, the Engel-hard PTX DOC did not exhibit quantifiable effects on concentrations of EC. The analysis showed reductions in EC concentrations of 26% and 48% for B20 and B50 yellow grease biodiesel blends, respectively. Only a minor difference in the effects of #1 diesel and #2 diesel on EC concentrations was found. The analysis also showed that the Engelhard DPX and DCL MINE–X DPF systems reduced TPM concentrations in mine air by approximately 75%. These reductions were lower than those observed for EC. A similar statement can be made for the B20 and B50 biodiesel blends, which reduced TPM concentrations by 9% and 24%, respectively. However, the differences in the EC and TPM reductions can be attributed to the fact that those aerosols that are transparent to the EC analysis can contribute significantly to the TPM measured by the TEOM. The TPM concentrations were 21% higher when #2 diesel was used in place of #1 diesel. The results of size-selective measurements qualitatively agree with the EC and TPM results. The measurements showed dramatic reductions in the number of larger particles when the Engelhard DPX and DCL MINE–X DPF systems were used instead of a muffler. The size distributions of the particles that are observed for the DPF tests are characterized with substantially lower GMDs and higher peak number concentrations than the size distributions observed for the baseline tests. A significant increase in the total number of particles, approximately 60%–80%, was evident for both cases where mufflers were replaced with DPF systems. The size distributions of the particles that were observed for the tests with the Engelhard PTX DOC are characterized with somewhat lower GMDs (72.40 vs. 85.74 nm) and higher peak number concentrations (1.01 × 10⁷ vs. 8.56 × 10⁶ #/cm3) than the size distributions observed during tests with the muffler alone. An approximately 18% increase in the number of particles was found when the muffler was replaced with a DOC and muffler combination. The results of the tests with B20 and B50 biodiesel blends indicate that the size distributions of the particles for those particular biodiesel blends were characterized with somewhat lower GMDs and higher peak concentrations than the size distributions observed during the tests with #1 diesel. The average geometric means for B50
74

(GMD = 61.76 nm) and B20 (GMD = 65.92 nm) indicated that increasing the biodiesel fraction of a blend might result in smaller GMDs for the aerosol size distributions. In addition, a significant increase in the number of particles was found when the B20 and B50 biodiesel blends were used (20.4% and 14.1%, respectively). The size distributions of the particles that were observed during the tests with #2 diesel showed, on average, higher GMDs (81.93 vs. 75.42 nm) and higher peak number concentrations (1.71 × 10⁷ vs. 1.63 × 10⁷ #/cm3) than the size distributions observed for the tests with #1 diesel. An approximately 5% increase in the number of particles was found when #2 instead of #1 diesel was used. Catalyzed DPF systems (Engelhard DPX and DCL MINE–X) and the Engelhard PTX DOC rendered the concentrations of CO practically undetectable. It should be noted that the concentrations of CO were relatively low even during the tests when the engines were fitted with mufflers. The concentrations of CO2 were found to be unaffected by the tested DPF systems from Engelhard and DCL and the Engelhard PTX DOC. An analysis of the results also revealed that the average and peak concentrations of NO were slightly lower for the tests when the vehicles were equipped with DPF systems rather than mufflers. In addition, the analysis showed that the biodiesel blends slightly increased the concentrations of NO over the baseline established with #1 diesel fuel. Assessing the effects of the DPF systems, particularly those that were washcoated with a platinum catalyst, on concentrations of NO2 in mine air was one of the major objectives of this study. The results of the NO2 measurements showed that the average normalized concentrations of NO2 increased approximately twofold (1.3 vs. 0.6 ppm) when the muffler was replaced with the Engelhard DPX DPF system. Comparable increases (2.1 vs. 0.9 ppm) in NO2 concentration were observed for the DCL MINE–X DPF system and the CleanAIR DPF system (0.7 vs. 0.2 ppm). An analysis of the data showed that the average and peak concentrations of NO2 were only slightly higher in the tests when LHD #92526 was fueled with biodiesel blends instead of regular diesel fuel. The results also showed that use of the Engelhard PTX DOC resulted in an insignificant increase in NO2 concentrations. The exhaust temperature and engine back pressure measurements showed that the CleanAIR DPF system, which uses a CDT fuel-borne catalyst, had been regenerating during the test cycle. Similar measurements indicate that the Engelhard DPX, DCL BlueSky, and ECS Cattrap DPF systems did not regenerate during the test runs. In addition, there was no indication that the relatively clean Donaldson high-temperature DFE was regenerating during the short duration of the test. There were not enough data to verify whether the DCL MINE–X DPF system regenerated over the test cycle. It is important to note that the exhaust temperatures at the inlet filter face of the DFE often exceeded 260 °C (500 °F), the maximum temperature recommended by the manufacturer. The engine back pressure was a concern only for the Engelhard DPX and DCL BlueSky DPF systems. For these two systems, peak back pressures ranged from 8.7 to 25.0 kPa (35 to 100 in H2O) and from 8.7 to 20 kPa (35 to 80 in H2O), respectively. In the case of
75

the Donaldson DFE, the engine back pressure remained low throughout the test, ranging from 0.07 to 0.57 kPa (0.25 to 2.3 in H2O) over the course of the test.
In general, the results of tailpipe emissions tests were found to be in good agreement with findings from the isolated zone tests. The study showed that limited tailpipe emissions measurements similar to those used in this study can be used by mine operators to identify potential issues related to engine-out emissions and implementation of various control strategies and technologies.
In addition, this short-term study revealed several other important technical issues affecting implementation and operation of DPF systems in underground mines. Regeneration, reliability, and durability of DPF systems in underground operations are recognized as the major areas that need to be addressed.
76
REFERENCES
Birch ME, Cary RA [1996]. Elemental carbon-based method for monitoring occupational exposures to particulate diesel exhaust. Aerosol Sci Tech 25(3):221–241. Bugarski AD, Schnakenberg GH Jr. [2001]. Field evaluation of diesel particulate filters: size-selective measurements of aerosols in mine air and engine exhaust. Presented at the Mining Diesel Emissions Conference (MDEC), Markham (Toronto), Ontario, Canada, November 6–8, 2001. Bugarski AD, Schnakenberg GH Jr. [2002]. Evaluation of diesel particulate filter systems at Inco Stobie mine. Presented at the Mining Diesel Emissions Conference (MDEC), Markham (Toronto), Ontario, Canada, October 29–30, 2002. CFR. Code of federal regulations. Washington, DC: U.S. Government Printing Office, Office of the Federal Register. Johnson JH, Carlson DH [1985]. Monitoring and control of mine air diesel pollutants: summary of Michigan Technological University research. Houghton, MI: Michigan Technological University. U.S. Bureau of Mines contract No. J0199125. NTIS No. PB 86–204104. Johnson JG, Carlson DH [1986]. The application of advanced measurement and control technology to diesel-powered vehicles in an underground salt mine. In: Mitchell EW, ed. Heavy-duty diesel emission control: a review of technology. CIM Special Volume 36. Montreal, Quebec, Canada: Canadian Institute of Mining, Metallurgy and Petroleum, pp. 206–237. McGinn S [2001]. Brunswick mine particulate trap project: performance evaluation. Presented at the Mining Diesel Emissions Conference (MDEC), Markham (Toronto), Ontario, Canada, November 6–8, 2001. MSHA [2004]. Metal and nonmetal diesel particulate filter selection guide; critical temperature spreadsheet. Arlington, VA: U.S. Department of Labor, Mine Safety and Health Administration. [http://www.msha.gov/nioshmnmfilterselectionguide/ temp_analysis.htm]. Date accessed: March 2006. MSHA [2005]. Diesel particulate matter (DPM) control technologies. Arlington, VA: U.S. Department of Labor, Mine Safety and Health Administration. [http:// www.msha.gov/01-995/Coal/DPM-FilterEfflist.pdf]. Date accessed: March 2006. Olson B [2001]. Particle calibration of the disposable personal diesel aerosol sampler (PDAS). Minneapolis, MN: University of Minnesota, Particle Calibration Laboratory. Report submitted to the National Institute for Occupational Safety and Health.
77
Schlecht PC, O’Connor PF, eds. [2003]. Elemental carbon (diesel particulate): method 5040, issue 3. In: NIOSH manual of analytical methods (NMAM). 4th ed. Cincinnati, OH: U.S. Department of Health and Human Services, Public Health Service, Centers for Disease Control and Prevention, National Institute for Occupational Safety and Health, DHHS (NIOSH) Publication No. 2003–154. [http://www.cdc.gov/niosh/nmam/pdfs/ 5040f3.pdf].
Schnakenberg GH Jr., Bugarski AD [2002]. Review of technology available to the underground mining industry for control of diesel emissions. Pittsburgh, PA: U.S. Department of Health and Human Services, Public Health Service, Centers for Disease Control and Prevention, National Institute for Occupational Safety and Health, DHHS (NIOSH) Publication No. 2002–154, IC 9462.
Schnakenberg GH Jr., Johnson JH, Schaefer P [1986]. Use of CO2 measurements in monitoring air quality in dead-end drifts. In: Mitchell EW, ed. Heavy-duty diesel emission control: a review of technology. CIM Special Volume 36. Montreal, Quebec, Canada: Canadian Institute of Mining, Metallurgy and Petroleum, pp. 291–297.
78

Delivering on the Nation’s promise: Safety and health at work for all people
through research and prevention
For information about occupational safety and health topics contact NIOSH at:
1–800–35–NIOSH (1–800–356–4674) Fax: 513–533–8573 E-ma il: pubstaft@ cdc.gov www.cdc.gov/niosh
S AFE R • H E ALT H IE R • P E OP L ET M
DHHS (NIOSH) Publication No. 2006 126–