effects of 8th grade algebra on high school course-taking and
TRANSCRIPT

SREE Spring 2014 Conference Abstract Template
Abstract Title Page Not included in page count.
Title: Effects of 8th Grade Algebra on High School Course-Taking and Math Achievement: Evidence from Changing Practices in a Large Urban District Authors and Affiliations: Jordan Rickles, American Institutes for Research Meredith Phillips, University of California, Los Angeles Kyo Yamashiro, Los Angeles Education Research Institute

SREE Spring 2014 Conference Abstract Template 1
Abstract Body Limit 4 pages single-spaced.
Background / Context: Between 1990 and 2012, the percentage of 13-year-olds (most of whom are 8th graders) taking algebra more than doubled, from 15% to 34% (National Center for Education Statistics, 2013). Yet recent education policy changes suggest that this movement to encourage algebra-taking in 8th grade has begun to reverse course. In early 2013, for example, the California State Board of Education voted to replace the Algebra I standards for 8th grade mathematics with more flexible content options consistent with the Common Core, thereby dismantling the state’s decade-long policy of incentivizing schools to enroll students in Algebra I in 8th grade (Torlakson, 2013). This move toward allowing more students to wait until 9th grade to take algebra mirrors the flexible algebra recommendations in the Common Core Mathematics Standards, allowing for both “regular” math course pathways, in which students take Algebra I in 9th grade, and “compacted” math course pathways, in which students take Algebra I in 8th grade (Common Core State Standards Initiative, 2010). Existing research suggests that taking more advanced math courses has positive effects on academic achievement, college enrollment, and adult earnings (Attewell & Domina, 2008; Aughinbaugh, 2012; Gamoran & Hannigan, 2000; Lee, Croninger, & Smith, 1997; Long, Conger, & Iatarola, 2012; Joensen & Nielsen, 2009; Rose & Betts, 2004). Studies that look specifically at the effects of algebra timing, however, yield mixed results (Stein, Kaufman, Sherman, & Hillen, 2011). In particular, studies based on policy shifts in Chicago (Allensworth, Nomi, Montgomery & Lee, 2009) and North Carolina (Clotfelter, Ladd & Vigdor, 2012; 2013) suggest that negative effects of accelerating algebra access may outweigh any positive effects. Purpose / Objective / Research Question / Focus of Study: This paper builds on existing research on algebra acceleration by using data from the second largest school district in the country, the Los Angeles Unified School District (LAUSD), to examine two policy-relevant questions: 1. If a student is not proficient in math at the end of 7th grade, would that student be better off
taking Algebra I in 8th grade or should that student wait to take Algebra I until 9th grade? Specifically, we investigate the extent to which taking Algebra I in 8th grade affects lower-achieving students’ high school math grades and test scores, their higher-level mathematics course-taking, and their high school persistence.
2. Should schools that serve large proportions of 7th graders who are not yet proficient in math enroll most of those students in Algebra I in 8th grade or should they enroll most such students in a lower-level math course? Specifically, we examine the extent to which instituting a “universal” 8th grade algebra policy in middle schools that serve large fractions of lower-achieving students affects low- and high-performing students’ high school math grades and test scores, higher-level mathematics course-taking, and high school persistence.

SREE Spring 2014 Conference Abstract Template 2
This paper is part of a larger research project focused on algebra pathways being conducted through a partnership between LAUSD and the Los Angeles Education Research Institute. Setting: The analyses focus on 8th grade students from LAUSD during the 2003-04 to 2006-07 school years. Population / Participants / Subjects: For research question one, our sample includes 111,249 LAUSD students who entered 8th grade in one of four cohorts, from 2003-04 to 2006-07, took their first formal algebra course (Algebra I) in either 8th grade or 9th grade, and scored below the state proficiency level on the 7th grade math California Standards Test (CST). This sample is described in Table 1. For research question two, our sample includes 32,087 LAUSD students in the 2003-04 to 2005-06 8th grade cohorts who attended one of 23 schools in the fall semester of their 8th grade year. Fourteen of the schools adopted an algebra-for-all placement practice following the 2003-04 year (AA schools) and 9 of the schools maintained selective placement practices throughout the three-year period (NA schools). This sample is described in Table 2. Intervention / Program / Practice: In LAUSD, the vast majority of students take their first formal Algebra I math course in either 8th or 9th grade, but 8th grade algebra enrollment rates fluctuated dramatically from 2002-03 to 2006-07, first increasing and then decreasing. The increase occurred partially in response to state and federal policies implemented at the time (see Figure 1), along with a shift in direction by LAUSD instructional leaders away from remedial 8th grade mathematics courses toward algebra. The overall changes in the percentage of students enrolled in 8th grade algebra mask even greater changes experienced by students who were not proficient in 7th grade math according to the state’s tests (see Figure 2). Our analyses examine the effects of these shifting 8th grade algebra enrollment practices. Research Design: To address the research questions, we use two identification strategies that take advantage of the within-school cohort-by-cohort fluctuation in 8th grade algebra enrollment: one based on an instrumental variable (IV) approach for our first research question, and another based on a difference-in-difference (DiD) approach for our second research question. Data Collection and Analysis: Data for this analysis come from district longitudinal administrative files covering student demographics, course-taking, and state test results.

SREE Spring 2014 Conference Abstract Template 3
For the IV analysis, we used the percentage of students enrolled in 8th grade algebra in a given school and cohort (PCTALG) as an IV for a student’s own algebra enrollment (G8ALG) and estimated the following two-stage model for outcome effects: (1) !8#$!%&' = )* + ),-./#$!&' + )01%&' + )2!8&' + 3& + 4' + 5%&' (2) 6%&' = 7* + 7,!8#$8 !%&' + 701%&' + 72!8&' + 9& + :' + ;%&' where Y is an outcome such as passing Algebra I by the end of the 9th grade or a score on the Algebra I state standardized test for student < in cohort = in school >; !8#$!8 is the predicted 8th grade algebra enrollment for student <, as instrumented in the first-stage equation by the percentage of students enrolled in 8th grade algebra in that school in that cohort; X is a vector of the student characteristics measured prior to the 8th grade school year presented in Table 1; G8 is a vector of the school characteristics shown in Table 1 for the 8th grade class in each cohort in each school; 4 and : capture school fixed effects; 3 and 9 capture cohort fixed effects; and 5and ? are random error terms in their respective equations. Our primary parameter of interest is 7,, which represents the effect of taking algebra in 8th grade for students placed in algebra as a result of a change in school enrollment practices from one year to the next. Because 8th grade algebra enrollment rates within schools changed substantially over a short period of time, we argue that such variation, conditional on the other covariates, is plausibly uncorrelated with unmeasured student and family characteristics. If so, in conjunction with other assumptions we discuss in the paper, this allows us to interpret estimates of 7, as causal effects (or more precisely, local average causal effects). We estimate separate models for each of the three non-proficient 7th grade math student subgroups to examine heterogeneity in effects across prior math achievement levels. For the DiD analysis, we used the following two-level hierarchical model specification for average effect estimation:
( )( )
0 1 3 .
.0 00 01 02 0
1 10 11 1
(3)
8 8
is s s is is s is
s s s s
s s s
Y Post X X e
AA G G u
AA u
β β β
β γ γ γ
β γ γ
= + + − +
= + + − +
= + +
where Y is a given outcome for student i nested in middle school s, Post is a binary indicator for whether a student was in a cohort during algebra acceleration (Post=1; 2003-04) or a cohort prior to algebra acceleration (Post=0; 2004-05 & 2005-06), and X is the same vector of pre-8th grade student covariates included in the IV model (centered around the covariate school means). The model also includes a school-level indicator for whether the school adopted algebra-for-all practices in the 2005 and 2006 school years (AA=1) and the same vector of school-level 8th grade cohort characteristics (G8) that were included in the IV model (centered around the grand-mean of each characteristic). In this specification, γ11 is the primary parameter of interest because it captures the degree to which within-school, between-cohort differences, β1s, differed between schools that adopted algebra-for-all and schools that maintained selective algebra placement. We

SREE Spring 2014 Conference Abstract Template 4
estimate separate models for four 7th grade math student achievement, including both non-proficient and proficient students. Outcomes examined are listed in Table 3. Findings / Results: IV estimated effects for the three student performance subgroups are presented in Table 4. These preliminary results indicate that, on average, students who took 8th grade algebra were more likely to pass Algebra I by the end of 9th grade and Below Basic and Basic students were also more likely to pass Algebra II and take a math course above Algebra II. We also find positive effects on students’ test scores for Far Below Basic and Below Basic students, but negative effects for Basic students. DiD estimated effects for all students and for the four student performance subgroups are presented in Table 5. These preliminary results indicate that, on average, students who attended a school that adopted a universal algebra policy were more likely to pass Algebra I by the end of 9th grade and Basic students were also more likely to take a math course above Algebra II. We found no effects on math test performance, however. We also found no effects on higher achieving students who were proficient in 7th grade math. In the paper, we discuss the limitations of our analysis, key assumptions that must hold to interpret our results as causal, and some sensitivity checks on the robustness of our findings. Conclusions: Our preliminary results suggest that exposure to 8th grade algebra may improve math course-taking and completion but that these effects do not translate into statistically significant improvements in high school graduation rates or satisfying college eligibility course requirements. Given concerns that placing unprepared students in algebra could lead to academic discouragement and dropping out, the null effect on high school graduation for low-achieving students is encouraging. Early access to algebra does not appear, however, to be a sufficient policy lever for significantly improving college eligibility. This concern will become more pressing as districts like LAUSD align high school graduation requirements with college eligibility requirements. Compared with similar studies conducted in North Carolina (Clotfelter, Ladd & Vigdor, 2012; 2013) and Chicago (Allensworth, Nomi, Montgomery & Lee, 2009), our analysis finds fewer negative effects regarding 8th grade algebra and adoption of “universal” algebra. While we are not able to adequately probe the reasons for our divergent findings in this study, our results suggest that researchers, policymakers, and practitioners should pause before generalizing findings from one study to other settings or situations. For example, each study’s results may be sensitive to the particular population targeted by the study design, to the particular instructional context of each setting’s 8th grade algebra classrooms, and to the math courses available as alternatives to 8th grade algebra.

SREE Spring 2014 Conference Abstract Template A-1
Appendices Not included in page count.
Appendix A. References References are to be in APA version 6 format. Allensworth, E., Nomi, T., Montgomery, N., & Lee, V. E. (2009). College Preparatory
Curriculum for All: Academic Consequences of Requiring Algebra and English I for Ninth Graders in Chicago. Educational Evaluation and Policy Analysis, 31(4), 367–391.
Attewell, P., & Domina, T. (2008). Raising the Bar: Curricular Intensity and Academic
Performance. Educational Evaluation and Policy Analysis, 30(1), 51 –71. Aughinbaugh, A. (2012). The effects of high school math curriculum on college attendance:
Evidence from the NLSY97. Economics of Education Review, 31(6), 861–870. Common Core State Standards Initiative. (2010). Common Core State Standards for
Mathematics. Washington, DC: National Governors Association Center for Best Practices and the Council of Chief State School Officers.
Clotfelter, C. T., Ladd, H. F., & Vigdor, J. L. (2012). The Aftermath of Accelerating Algebra:
Evidence from a District Policy Initiative (No. 69). Washington, DC: CALDER. Clotfelter, C. T., Ladd, H. F., & Vigdor, J. L. (2013). Algebra for 8th Graders: Evidence on its
Effects from Ten North Carolina Districts. District Policy Initiative (No. 87). Washington, DC: CALDER.
Gamoran, A., & Hannigan, E. C. (2000). Algebra for Everyone? Benefits of College-Preparatory
Mathematics for Students with Diverse Abilities in Early Secondary School. Educational Evaluation and Policy Analysis, 22(3), 241–254.
Joensen, J. S., & Nielsen, H. S. (2009). Is there a Causal Effect of High School Math on Labor
Market Outcomes? Journal of Human Resources, 44(1), 171–198. Lee, V. E., Croninger, R. G., & Smith, J. B. (1997). Course-Taking, Equity, and Mathematics
Learning: Testing the Constrained Curriculum Hypothesis in U.S. Secondary Schools. Educational Evaluation and Policy Analysis, 19(2), 99–121.
Long, M. C., Conger, D., & Iatarola, P. (2012). Effects of High School Course-Taking on
Secondary and Postsecondary Success. American Educational Research Journal, 49(2), 285–322.
Loveless, T. (2013). How Well are American Students Learning? The 2013 Brown Center Report
on American Education, 3(2), pp. 1-32.
SREE Spring 2014 Conference Abstract Template A-2
National Center for Education Statistics (2013). The Nation's Report Card: Trends in Academic Progress 2012 (NCES 2013 456). Institute of Education Sciences, U.S. Department of Education, Washington, D.C.
Rose, H., & Betts, J. R. (2004). The Effect of High School Courses on Earnings. Review of
Economics and Statistics, 86(2), 497–513. Stein, M. K., Kaufman, J. H., Sherman, M., & Hillen, A. F. (2011). Algebra: a challenge at the
crossroads of policy and practice. Review of Educational Research, 81(4), 453 –492. Torlakson, T. (2013). California Adopts Modified Math Standards to Restore Local Decision
Making. News Release #13-11. California Department of Education.

SREE Spring 2014 Conference Abstract Template B-3
Appendix B. Tables and Figures Not included in page count.
Figure 1. Changes in 8th grade algebra (or higher) enrollment from 1999 to 2012. Notes: All years reflect the end-year of a school year. LAUSD and California rates represent the percent of 8th graders who took the Algebra I CST or higher math CST test based on test taking counts reported on the California Department of Education website. The U.S. rates represent the percent of 8th grade NAEP test takers who were enrolled in an Algebra I or higher math course, as reported in Loveless (2013). The U.S. rates include students enrolled in a 2-year algebra course, while the LAUSD and California rates do not.

SREE Spring 2014 Conference Abstract Template B-4
Figure 2. Changes in 8th grade algebra (or higher) enrollment from 2004 to 2012, by 7th grade mathematics performance level. Source: authors’ calculations from district student course marks records. Notes: All years reflect the end-year of a school year. Enrollment percentages based on 8th grade students enrolled in a math course that counts toward the UC/CSU eligibility requirement as determined by district course enrollment data for the fall semester of each year. The percentages were only calculated for students who had 7th grade state mathematics assessment data in the previous year, and should not be directly compared to the Figure 1 percentages based on publicly available aggregate data.

SREE Spring 2014 Conference Abstract Template B-5
Table 1. Student and school characteristics for IV analysis sample (all cohorts combined) N Mean Std. Dev.
Student Characteristics
% Took Algebra I in 8th Grade 111,249 58% 49%
% Female 111,249 50% 50%
Race/Ethnicity (%): Asian/Pac. Isl. 111,249 4% 18% Black/Afr. Am. 111,249 10% 30% Hispanic 111,249 81% 39% White 111,249 5% 22%
Language Classification (%): EL 111,136 39% 49% RFEP 111,136 32% 47% IFEP 111,136 6% 24% English Only 111,136 23% 42%
Parent Education (%): Unknown 111,249 42% 49% Less Than HS 111,249 25% 43% HS Grad 111,249 16% 37% Some College 111,249 9% 28% College Grad 111,249 8% 27%
% Free/Reduced Lunch 111,249 58% 49%
% Gifted/Talented 111,249 3% 18%
% Students with Disabilities 111,249 9% 28%
Mean 7th Grade GPA 111,173 2.12 0.83
Mean 7th Grade Work Habits Mark 111,165 2.06 0.47
Mean 7th Grade Cooperation Mark 111,165 2.26 0.43
Mean CST Scale Score 7th Grade ELA 109,757 300.46 39.57 7th Grade Math 111,249 286.32 32.93
7th Grade Math CST Performance Level (%): Far Below Basic 111,249 19% 40% Below Basic 111,249 45% 50% Basic 111,249 36% 48%
School Characteristics
Number of 8th Graders 111,249 492.10 185.02
Percent Non-White/Non-Asian in 8th Grade 111,249 89% 15%
Percent English Learners in 8th Grade 111,249 34% 14%
7th Grade CST Math Scale Score Mean for 8th Grade 111,249 302.25 17.47
Interquartile Range for 8th Grade 111,249 62.52 12.74
SREE Spring 2014 Conference Abstract Template B-6
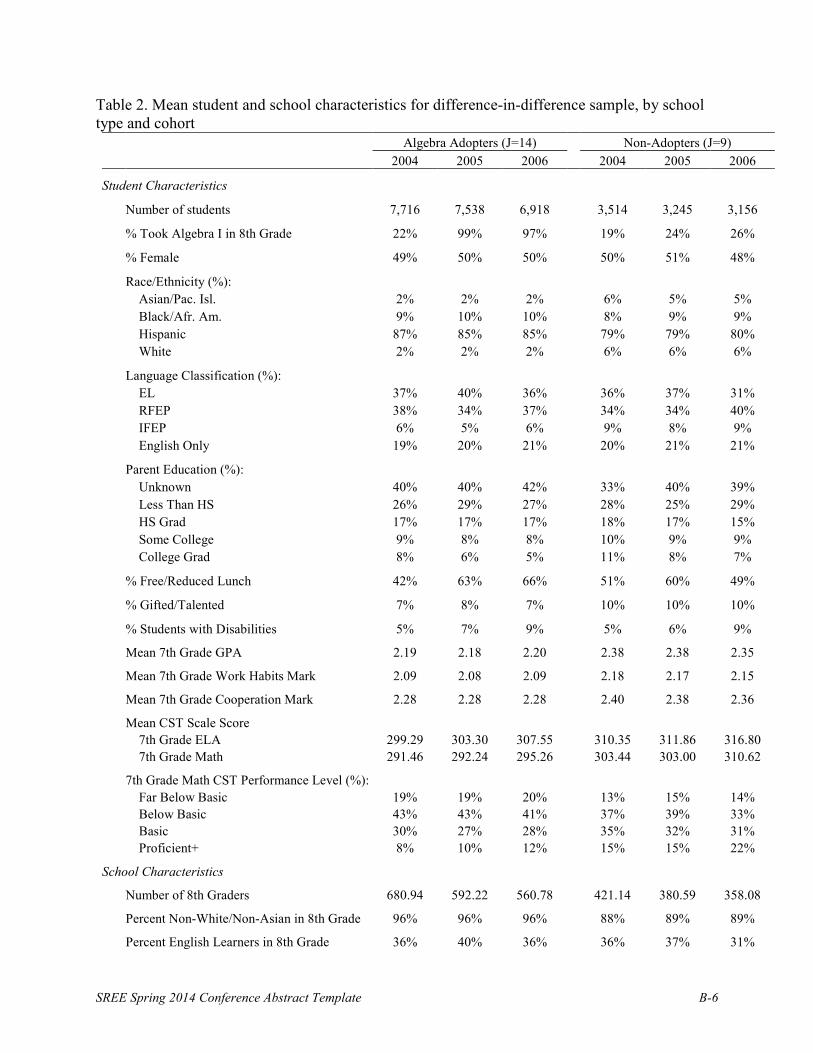
Table 2. Mean student and school characteristics for difference-in-difference sample, by school type and cohort
Algebra Adopters (J=14) Non-Adopters (J=9) 2004 2005 2006 2004 2005 2006
Student Characteristics
Number of students 7,716 7,538 6,918 3,514 3,245 3,156
% Took Algebra I in 8th Grade 22% 99% 97% 19% 24% 26%
% Female 49% 50% 50% 50% 51% 48%
Race/Ethnicity (%): Asian/Pac. Isl. 2% 2% 2% 6% 5% 5% Black/Afr. Am. 9% 10% 10% 8% 9% 9% Hispanic 87% 85% 85% 79% 79% 80% White 2% 2% 2% 6% 6% 6%
Language Classification (%): EL 37% 40% 36% 36% 37% 31% RFEP 38% 34% 37% 34% 34% 40% IFEP 6% 5% 6% 9% 8% 9% English Only 19% 20% 21% 20% 21% 21%
Parent Education (%): Unknown 40% 40% 42% 33% 40% 39% Less Than HS 26% 29% 27% 28% 25% 29% HS Grad 17% 17% 17% 18% 17% 15% Some College 9% 8% 8% 10% 9% 9% College Grad 8% 6% 5% 11% 8% 7%
% Free/Reduced Lunch 42% 63% 66% 51% 60% 49%
% Gifted/Talented 7% 8% 7% 10% 10% 10%
% Students with Disabilities 5% 7% 9% 5% 6% 9%
Mean 7th Grade GPA 2.19 2.18 2.20 2.38 2.38 2.35
Mean 7th Grade Work Habits Mark 2.09 2.08 2.09 2.18 2.17 2.15
Mean 7th Grade Cooperation Mark 2.28 2.28 2.28 2.40 2.38 2.36
Mean CST Scale Score 7th Grade ELA 299.29 303.30 307.55 310.35 311.86 316.80 7th Grade Math 291.46 292.24 295.26 303.44 303.00 310.62
7th Grade Math CST Performance Level (%): Far Below Basic 19% 19% 20% 13% 15% 14% Below Basic 43% 43% 41% 37% 39% 33% Basic 30% 27% 28% 35% 32% 31% Proficient+ 8% 10% 12% 15% 15% 22%
School Characteristics
Number of 8th Graders 680.94 592.22 560.78 421.14 380.59 358.08
Percent Non-White/Non-Asian in 8th Grade 96% 96% 96% 88% 89% 89%
Percent English Learners in 8th Grade 36% 40% 36% 36% 37% 31%

SREE Spring 2014 Conference Abstract Template B-7
7th Grade CST Math Scale Score Mean for 8th Grade 291.46 292.24 295.26 303.44 303.00 310.62 Interquartile Range for 8th Grade 50.12 56.31 60.38 58.21 63.18 70.86
Table 3. Summary statistics for outcomes of interest for IV sample (all cohorts) and DiD sample (by school type and cohort) Algebra Algebra-for-All Sample
Enrollment Algebra Adopters (J=14) Non-Adopters (J=9) Sample 2004 2005 2006 2004 2005 2006
Math Course-taking & Completion: Passed Alg 1 w/D or better by end of 9th grade 57% 50% 68% 64% 49% 45% 55% Passed Alg 1 w/C or better by end of 9th grade 39% 34% 49% 46% 36% 32% 41% Took Alg 2 49% 49% 55% 57% 43% 45% 51% Passed Alg 2 w/D or better 31% 32% 35% 40% 27% 28% 34% Passed Alg 2 w/C or better 20% 23% 23% 28% 20% 19% 25% Took math course above Alg 2 17% 19% 23% 26% 17% 17% 20%
Math Test Performance Mean Alg 1 CST score on first attempt 275.84 282.98 279.26 280.42 296.60 291.68 294.60 (Std. Dev.) (35.50) (39.68) (38.29) (44.51) (46.71) (46.87) (52.08) Mean Alg 1 CST score on best attempt 285.75 288.82 289.16 290.88 303.91 301.99 304.03 (Std. Dev.) (36.14) (40.64) (38.93) (44.31) (46.38) (47.25) (52.01) Mean CAHSEE score on first attempt 358.43 359.76 361.17 365.23 369.46 369.76 373.73 (Std. Dev.) (27.15) (30.40) (31.85) (31.81) (32.19) (33.33) (33.73)
High School Completion and College-Eligibility: Graduated from HS in 4 yrs 49% 46% 49% 57% 50% 52% 62% Met math UC/CSU eligibility requirement (passed 3 math courses w/C or better) 22% 24% 27% 30% 22% 20% 25% Met science UC/CSU eligibility requirement (passed 2 science courses w/C or better) 24% 26% 28% 31% 27% 25% 29% Met all UC/CSU course-taking eligibility requirements 7% 9% 9% 12% 8% 8% 10%

SREE Spring 2014 Conference Abstract Template B-8
Table 4. Two-stage least squares IV effects estimates for 8th grade algebra, by 7th grade math performance level Far Below Basic Below Basic Basic Effect (SE) Effect (SE) Effect (SE)
Math Coursetaking & Completion (%) Passed Alg 1 w/D or better by end of 9th grade 0.193 (0.021) ** 0.226 (0.018) ** 0.159 (0.025) ** Passed Alg 1 w/C or better by end of 9th grade 0.115 (0.014) ** 0.156 (0.021) ** 0.155 (0.027) ** Took Alg 2 0.032 (0.020) 0.038 (0.021) 0.061 (0.026) * Passed Alg 2 w/D or better 0.009 (0.015) 0.028 (0.013) * 0.050 (0.022) * Passed Alg 2 w/C or better 0.001 (0.010) 0.010 (0.011) 0.013 (0.019) Took math course above Alg 2 0.015 (0.007) * 0.026 (0.009) ** 0.064 (0.018) **
Math Test Performance (z-score) Alg 1 CST score on first attempt -0.003 (0.019) -0.086 (0.022) ** -0.284 (0.050) ** Alg 1 CST score on best attempt 0.135 (0.018) ** 0.061 (0.021) ** -0.135 (0.051) ** CAHSEE score on first attempt 0.052 (0.023) * -0.021 (0.017) -0.040 (0.037)
High School Completion and College-Eligibility (%) HS Graduate 0.011 (0.020) 0.017 (0.017) 0.026 (0.024) Met math UC/CSU eligibility requirement 0.011 (0.010) 0.017 (0.011) 0.035 (0.022) Met science UC/CSU eligibility requirement -0.008 (0.013) -0.003 (0.014) 0.007 (0.024) Met all UC/CSU course requirements 0.004 (0.004) 0.000 (0.006) 0.007 (0.014)
Notes: effect estimates and standard errors based on 2-stage least-squares model. * p < 0.05; ** p < 0.01; † p < 0.05 based on linear model, but > 0.05 based on probit mode

SREE Spring 2014 Conference Abstract Template B-9
Table 5. Difference-in-difference effect estimates for algebra-for-all adoption, by 7th grade math performance level All Students Far Below Basic Below Basic Basic Proficient+ Effect (SE) Effect (SE) Effect (SE) Effect (SE) Effect (SE)
Math Coursetaking & Completion (%) Passed Alg 1 w/D or better by end of 9th grade 0.154 (0.030) ** 0.212 (0.047) ** 0.230 (0.039) ** 0.091 (0.045) * 0.000 (0.026) Passed Alg 1 w/C or better by end of 9th grade 0.136 (0.029) ** 0.139 (0.029) ** 0.172 (0.039) ** 0.122 (0.036) ** 0.039 (0.046) Took Alg 2 0.026 (0.019) 0.045 (0.033) 0.021 (0.025) 0.021 (0.030) 0.017 (0.027) Passed Alg 2 w/C or better 0.030 (0.019) -0.005 (0.020) 0.017 (0.018) 0.021 (0.020) 0.076 (0.047) Passed Alg 2 w/D or better 0.032 (0.018) 0.000 (0.023) 0.029 (0.020) 0.030 (0.027) 0.045 (0.042) Took math course above Alg 2 0.044 (0.021) † 0.003 (0.015) 0.025 (0.016) 0.069 (0.023) ** 0.072 (0.052)
Math Test Performance (z-score) Alg 1 CST score on first attempt 0.014 (0.060) 0.026 (0.045) -0.004 (0.044) 0.018 (0.073) 0.208 (0.185) Alg 1 CST score on best attempt 0.056 (0.061) 0.066 (0.046) 0.065 (0.054) 0.042 (0.072) 0.129 (0.171) CAHSEE score on first attempt 0.054 (0.047) 0.048 (0.047) 0.069 (0.035) * 0.015 (0.062) 0.033 (0.069)
High School Completion and College-Eligibility (%) HS Graduate 0.022 (0.019) 0.000 (0.032) 0.009 (0.026) 0.005 (0.029) -0.003 (0.032) Met math UC/CSU eligibility requirement 0.043 (0.013) ** 0.000 (0.020) 0.032 (0.015) † 0.066 (0.020) ** 0.074 (0.046) Met science UC/CSU eligibility requirement 0.033 (0.017) * 0.000 (0.024) 0.026 (0.022) 0.068 (0.026) * 0.030 (0.036) Met all UC/CSU course requirements 0.012 (0.009) 0.004 (0.009) 0.003 (0.011) 0.035 (0.016) † 0.031 (0.051)
Notes: effect estimates and standard errors based on 2-level hierarchical linear model. * p < 0.05; ** p < 0.01; † p < 0.05 based on linear model, but > 0.05 based on logit model.