effects of climate change on the yield of winter wheat in ... · pdf fileconstantinidou et...
TRANSCRIPT

CLIMATE RESEARCHClim Res
Vol. 69: 129–141, 2016doi: 10.3354/cr01395
Published online June 27
1. INTRODUCTION
The region of the eastern Mediterranean and theMiddle East (EMME) is home to more than 350 mil-lion people in an area with a 2000 km radius, includ-ing large sea and desert areas. After many years ofindustrialization, rapid population growth and exten-sive land use changes that have shaped the region, ithas additionally become a global climate change ‘hotspot’; trends in climate conditions, documented byobservations in the EMME, indicate a strong temper-ature increase and precipitation decrease during thelast decades of the 20th century (Tanarhte et al.2012). This warming and drying is projected to inten-sify in the 21st century and may have major conse-quences for society and natural ecosystems (Lelie -
veld et al. 2012). One of the sectors that could beadversely impacted is agriculture, and the potentialim plications for food security may be critical for thisregion with increasing population, limited adaptivecapacity (determined by economic resources, tech-nology, information and skills, infrastructure, institu-tions, and equity; see e.g. Grasso & Feola 2012) andgeopolitical sensitivities.
The EMME encompasses sub-regions that are verysuitable for agriculture. Current climate conditions inthe region allow for a large variety of crops, includingC3 and C4 cereals, legumes and root crops (Leff et al.2004, Lelieveld et al. 2012).
Wheat is among the ‘big 3’ cereal crops, with over600 Mt harvested annually in the world (Shewry etal. 2009). In 2009, 226 million ha were sown to wheat;
© Inter-Research 2016 · www.int-res.com*Corresponding author: [email protected]
Effects of climate change on the yield of winterwheat in the eastern Mediterranean and Middle East
K. Constantinidou1,*, P. Hadjinicolaou1, G. Zittis1, J. Lelieveld1,2
1Energy Environment and Water Research Center, The Cyprus Institute, 1645 Nicosia, Cyprus2Department of Atmospheric Chemistry, Max Plank Institute for Chemistry, 55020 Mainz, Germany
ABSTRACT: Warming and drying in the eastern Mediterranean and the Middle East (EMME)associated with climate change may have consequences for humans and ecosystems, includingagriculture. Agriculture can be directly affected through meteorological conditions that influencecrop growth and yield. Here we explored changes in the yield of durum (winter) wheat Triticumtirgidum in the EMME region caused by projected changes in thermal and hydrological condi-tions, employing the agro-ecological zones (AEZ) methodology. The climate input was obtainedfrom simulations by the PRECIS regional climate model over the EMME domain at 25 km resolu-tion, driven by a range of IPCC emissions scenarios for the 21st century. For the crop yield calcu-lation, we used 2 steps of the biomass calculation from the AEZ methodology by calculating cropyield potentials with regard to temperature, solar radiation and evapotranspiration regimes. Ourresults showed that for the recent past, the highest wheat yields are found in the Fertile Crescentand the coastal areas of eastern Mediterranean Europe. The former region is projected to be neg-atively affected by the additional heat due to climate warming, while in the latter region yieldgains may be expected. Our implementation of the AEZ methodology can be based on a range ofclimate data and can be applied to a number of crops, contributing to yield studies relevant forregional assessments of food security.
KEY WORDS: Triticum tirgidum · Yield · Agro-ecological zones methodology · Regional climatechange · Eastern Mediterranean − Middle East
Resale or republication not permitted without written consent of the publisher
Clim Res 69: 129–141, 2016
yielding 685 Mt of grain from about 3 t ha−1 (Assenget al. 2012; also see http://faostat.fao.org/). Wheat is acool-season crop originating in the Fertile Crescentin the EMME while it is now widely spread aroundthe world. It can be grown in a range of climatic con-ditions, from arctic and humid regions to tropicalhighlands and from below sea level in the DutchPolders to 4500 m altitude. The growing conditionsare very diverse, not only because of the variable cli-matic regions and altitudes, but also because of dif-ferences in soil types and crop management.
Durum wheat Triticum tirgidum is regarded as oneof the oldest cultivars of winter wheat. Durum origi-nates in the eastern Mediterranean and has been cul-tivated in this region for the last 12 millennia (Key2005). Whilst farming has spread globally, the durumwheat grown in the Mediterranean basin is of pre-mium quality and accounts for ~60% of the globaltotal production (Lidon et al. 2014). Products ofdurum wheat are key components of the staple dietin countries located in the Mediterranean basin. It isusually processed into semolina, which is used tomake couscous, pasta, flat breads, bulgur and otherproducts. Durum is one of the highest-priced grainstraded on the world market, mostly as bread wheatand pasta (ICARDA 2001). The main environmentalconstraints limiting the production of durum wheat inthis region are drought and temperature extremes,with productivity ranging from 0 to 6 t ha−1 (Nachit &Elouafi 2004). In relatively dry countries like Syria,the average yield is about 2.7 to 3 t ha−1 (which canvary in the range of 1 to 7 t ha−1 in some locations;ICARDA 2001).
Weather variations and climate variability have animpact on crop yields (Ciais et al. 2005, Iizumi et al.2014), while long-term climate change also affectsthe quantity and quality of crop production throughprocesses driven by sunlight, temperature, water andcarbon dioxide levels (Olesen & Bindi 2002). Severalstudies have projected crop yields under changingmean and extreme climate conditions with a varietyof climate models, emission scenarios and crop simu-lation models (e.g. Iglesias et al. 2000, Moriondo et al.2011, Sen et al. 2012, Naresh Kumar et al. 2014, Van -uytrecht et al. 2014). These particular studies pro-jected crop yield vulnerability at the country level byfocusing on specific locations, representative of max-imum production, and applying crop simulationmodels with detailed soil and management data.
Assessments of climate change impacts on agricul-ture and analysis of yield gap, (the difference be -tween the potential yield of a crop and its actual pro-duction), offer useful knowledge towards sustainable
intensification or/and diversification of agriculturefor the optimization of food supply, but require calcu-lations over climatically homogeneous zones (VanIttersum et al. 2013, Van Wart et al. 2013). The Agri-cultural Model Intercomparison and ImprovementProject seeks, among its several objectives, to de -velop methods to allow site/point analyses to bescaled up to larger regions (Rosenzweig et al. 2013).Recently, Rosenzweig et al. (2014) presented theresults from 7 global gridded crop models (site-based, ecosystem and agro-ecological zone models)where crop yields of wheat were projected to in -crease in south-east Europe and decrease in NorthAfrica and the Levant by the end of this century.
We focus on the EMME, a climate change hot spotfacing multiple challenges where wheat is an impor-tant staple food, and follow a framework of the analy-sis of large-scale shifts in cropping zones by imple-menting the agro-ecological zones (AEZ) methodo -logy developed by the Food and Agriculture Organi-zation of the United Nations (FAO) and the Interna-tional Institute for Applied Systems Analysis (IIASA)(Fischer et al. 2002, Teixeira et al. 2013). It providesa spatial inventory and database of land resourcesand crop production potentials. This land resourcesinventory is used for specified management condi-tions and climate input, to assess the suitability ofcrops and to quantify expected production of crop-ping activities relevant in the specific agro-ecologicalcontext.
Here we adopted the AEZ methodology and com-bined it with projections, for the first time as far as weknow, from a regional climate model (RCM), theHadley Centre PRECIS RCM, to derive yield poten-tials of winter wheat in the EMME region, spatiallygridded at a resolution of 25 × 25 km. For the wintertype of wheat that we address, we assumed a growthcycle duration of 180 d (sowing date 1 November andharvesting day 30 April). This crop calendar wasselected because in the EMME region, wheat is usu-ally cultivated during this period of the year, thebeginning of which also coincides with the start ofthe wet season (Sacks et al. 2010).
2. CLIMATE DATA
The biomass model used for calculation of potentialyield requires as climatic input mean temperatureand incoming shortwave solar radiation data. Mini-mum and maximum daily temperature, mean dailyrelative humidity and wind speed are needed for cal-culations of the second step in this model, which
130

Constantinidou et al.: Climate change effects on wheat yield 131
results in water-limited yields. These areobtained from simulations performed bythe PRECIS (‘Providing REgional Cli-mates for Impacts Studies’) regional cli-mate model, developed by the UK MetOffice Hadley Centre. This RCM usesthe same formulation of the climate sys-tem as its parent global model HadCM3(Collins et al. 2006), which also providesboundary conditions from simulationsdriven by the ‘optimistic’ B2 scenario, theintermediate A1B scenario and the ‘pes-simistic’ A2 scenario, based on the IPCC SpecialReport on Emissions Scenarios (SRES) (Nakicenovicet al. 2000).
PRECIS was applied from 1950−2099, forced by theA1B scenario over a domain covering the EMMEregion at a horizontal resolution of 0.22° (~25 km)and 19 vertical levels. The domain boundaries are22− 44° N and 13−55° E. The results from the simula-tion presented here have been evaluated extensivelyand used in EMME climate change impact studiesand previous assessments (Chenoweth et al. 2011,Le lie veld et al. 2012, Zittis et al. 2014). We also in -cluded results from three 30 yr PRECIS simulationsdriven by a slightly different global model HadCM3version, i.e. 1 baseline simulation for 1961−1990 and2 future simulations for 2071−2099 (for the B2 and A2emission scenarios, see Zittis et al. 2015 for details).
The data used are daily time series generated bythe above simulations divided into 2 periods repre-senting climate conditions of the 20th century pastand future, i.e. end of the 21st century. The baseline(BL) period used as a reference is 1961−1990 and thefuture period (P3) is 2071−2099.
3. METHODOLOGY
Calculations of potential yields of winter wheat aremade using the first step of the biomass and yield cal-culation model of the global AEZ (GAEZ) methodo -logy developed by FAO and IIASA (Fischer et al. 2002,2012; see http://webarchive.iiasa.ac.at/ Research/ LUC/GAEZv3.0/). It calculates the constraint-free cropyields, which reflect yield potentials with regard totemperature and radiation regimes prevailing in therelevant grid cells and are based on the eco- physiological model developed by Kassam (1977).
Firstly, a thermal suitability test is ap plied. This testis performed using the temperature profile require-ments (Table 1 for winter wheat), i.e. crop-specificrules that take into account the crop growth cycle
duration in different classes of mean daily tempera-tures. Temperature profiles are defined in terms of 9classes of ‘temperature ranges’ (denoted by ‘L(1−9)’in Table A1 in Appendix 1) for days with averagetemperatures <−5°C, −5 to 0°C, …, 25 to 30°C and>30°C (at 5°C intervals) combined with the increas-ing (denoted by ‘a’) and decreasing (denoted by ‘b’)temperature trends within the growth cycle.
The potential crop calendar of each grid box of thedomain is tested for the match of crop temperatureprofile requirements and prevailing temperatureprofiles. Temperature profile conditions are testedagainst optimum and sub-optimum requirements ofwinter wheat (Table 1; more detailed description inAppendix 1). We identified the lowest and highesttemperatures, which can be characterized as lower(5°C) and upper (30°C) thresholds for the cultivationof winter wheat (L6, which corresponds to days withmean temperature of 5−10°C and L1 = 0, i.e. no dayswith average temperature above 30°C, as shown inTable 1). The calculation presented here is underrainfed conditions, because we consider only thegrowth cycle (L) for this type of wheat. When the con-ditions are satisfied, the grid box is considered suit-able for cultivation of winter wheat; otherwise, thegrid boxes are marked as non-suitable.
The suitability test is applied to each grid box ofthe domain for the 2 time periods in which the climate data have been subdivided. Subsequentpotential yield calculations are made only for suit-able grid boxes. The potential yield of the crop isaffected by the intensity of input and managementthat is as sumed to be applied. In the EMME region,intermediate level of input is the most appropriatechoice. The farming system is partly market ori-ented; thus, production for subsistence and com-mercial sale is a management objective. Productionis based on im proved varieties, on manual labourbased on hand tools and/or animal traction andsome mechanization. It is of medium intensity, withsome fertilizer ap plication and chemical pest disease
Sub-optimum conditions Optimum conditions
L6a < 0.667 × Lb L6a < 0.5 × LbL2a + L2b < 0.333×Lb L2a + L2b < 0.333×LbL1 = 0 L1 = 0L2b + L3b + L4b + L5b < 0.5 × Lb L2b + L3b + L4b + L5b < 0.5 × LbL3b + L4b + L5b + L6b > La L3b + L4b + L5b + L6b > La
Table 1. Optimum and sub-optimum conditions for wheat Triticum tirgidum(Fischer et al. 2012). La and Lb are lengths of the pre- and post-dormancyperiod, respectively, L6a/b to L1a/b are temperature intervals (increasing/
decreasing trends) 5−10, 10−15, 15−20, 20−25, 25−30, >30°C
Clim Res 69: 129–141, 2016
and weed control, adequate fallows and some con-servation measures.
All equations of the biomass and yield calculationmodel (AEZ methodology; Kassam 1977, Fischer etal. 2012) are transferred into a script in R2 program-ming language (www.r-project.org/) in order to per-form the calculations. A more detailed description ispresented in Appendix 2.
Potential yield (Yp) is estimated from net biomass(Bn) (dry matter) using the equation:
Yp = Hi × Bn (1)
where Hi is the harvest index, i.e. proportion of thenet biomass of a crop that is economically useful.
All crop-specific input parameters needed for cal-culations are the following: N: normal growth cycleduration (N = 180 d); LAI: leaf area index (LAI = 4);harvest index (Hi = 0.35) (Fischer et al. 2012); L:growth ratio of the maximum rate of gross biomassproduction (bgm) at actual LAI to bgm at LAI = 5 (L =0.91) (Oldeman & Frére 1982). Following sensitivitycalculations in order to assess the relative contribu-tion of temperature and solar radiation in the poten-tial yield (Yp) estimation, we found that the effect oftemperature is 2 orders of magnitude larger than thatof solar radiation.
Under rainfed conditions, water stress is a very im -portant limiting factor for the expected yields. Usingthe second step of the biomass and yield calculationmodel of the AEZ methodology (Fischer et al. 2002,2012), a water-stress limiting factor (fc2) is calculatednext. First, water requirements for each grid cell arecalculated by taking into account the specific waterbalance and actual evapotranspiration of each gridbox.
The total water requirement of a crop without anywater stress is assumed to be the crop-specific poten-tial evapotranspiration (ETm). ETm is calculated inproportion to reference potential evapotranspiration(ETo) (calculated by the Penman-Monteith equation),
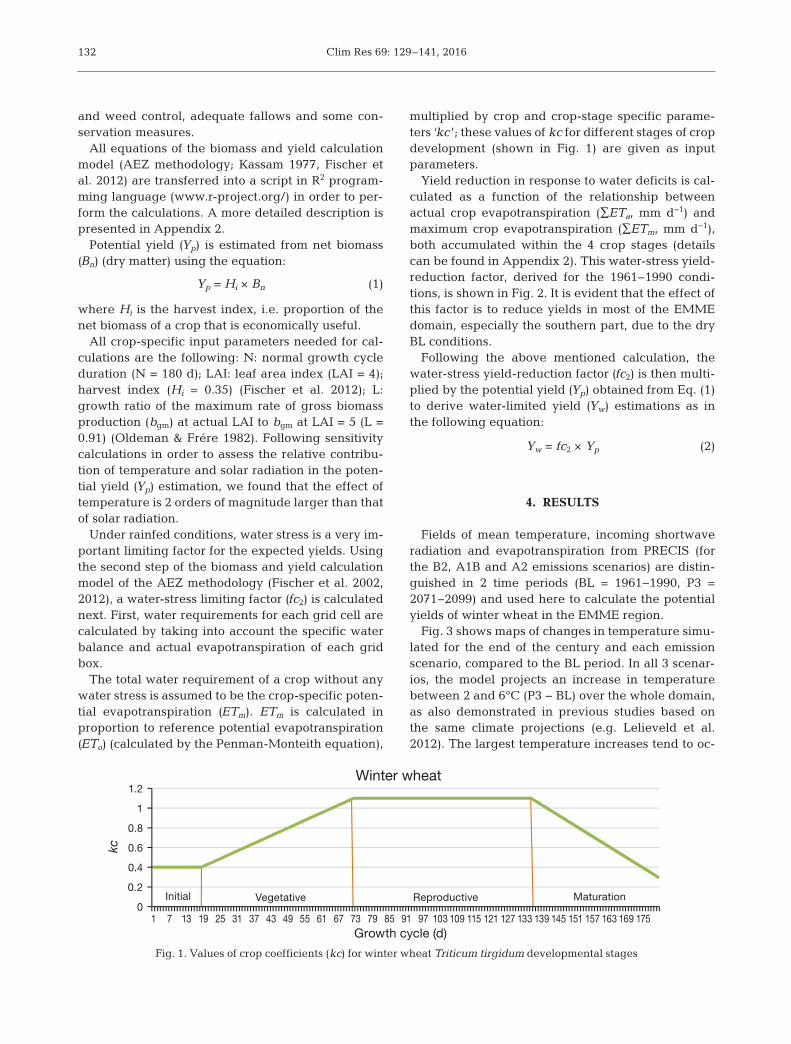
multiplied by crop and crop-stage specific parame-ters ‘kc ’; these values of kc for different stages of cropdevelopment (shown in Fig. 1) are given as inputparameters.
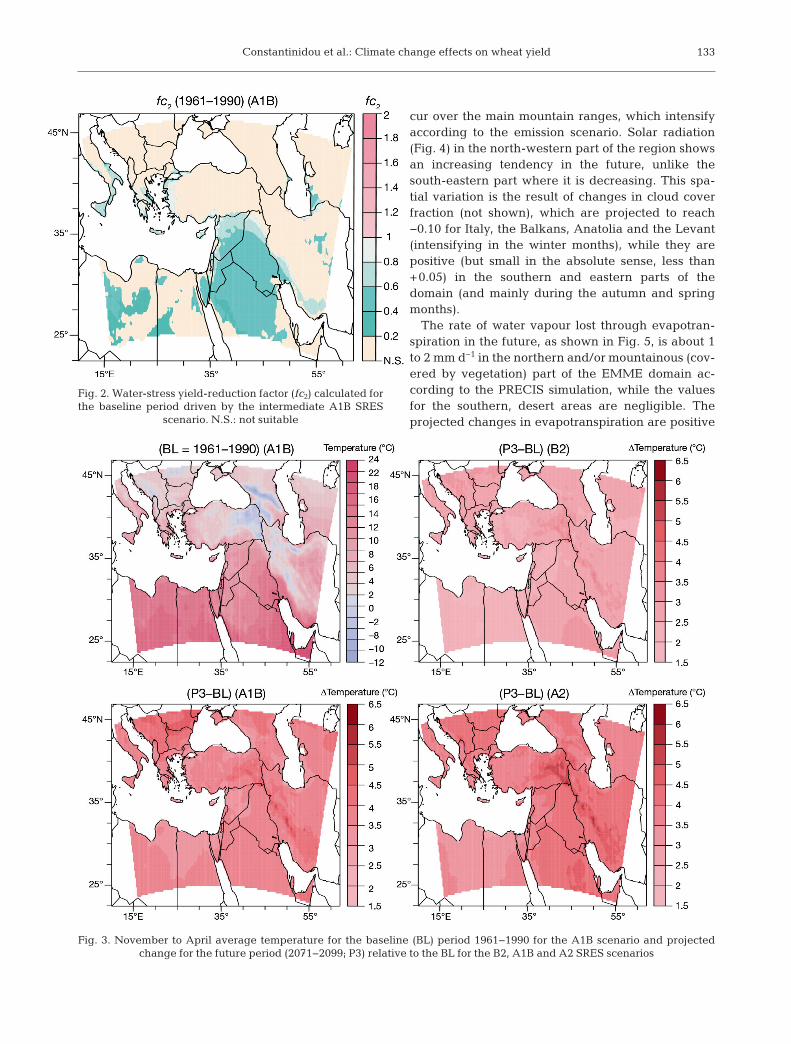
Yield reduction in response to water deficits is cal-culated as a function of the relationship betweenactual crop evapotranspiration (∑ETa, mm d−1) andmaximum crop evapotranspiration (∑ETm, mm d−1),both accumulated within the 4 crop stages (detailscan be found in Appendix 2). This water-stress yield-reduction factor, derived for the 1961−1990 condi-tions, is shown in Fig. 2. It is evident that the effect ofthis factor is to reduce yields in most of the EMMEdomain, especially the southern part, due to the dryBL conditions.
Following the above mentioned calculation, thewater-stress yield-reduction factor (fc2) is then multi-plied by the potential yield (Yp) obtained from Eq. (1)to derive water-limited yield (Yw) estimations as inthe following equation:
Yw = fc2 × Yp (2)
4. RESULTS
Fields of mean temperature, incoming shortwaveradiation and evapotranspiration from PRECIS (forthe B2, A1B and A2 emissions scenarios) are distin-guished in 2 time periods (BL = 1961−1990, P3 =2071− 2099) and used here to calculate the potentialyields of winter wheat in the EMME region.
Fig. 3 shows maps of changes in temperature simu-lated for the end of the century and each emissionscenario, compared to the BL period. In all 3 scenar-ios, the model projects an increase in temperaturebetween 2 and 6°C (P3 − BL) over the whole domain,as also demonstrated in previous studies based onthe same climate projections (e.g. Lelieveld et al.2012). The largest temperature increases tend to oc -
132
0
0.2
0.4
0.6
0.8
1
1.2
Growth cycle (d)
Winter wheat
Vegetative Reproductive Maturation Initial
kc
71 13 19 25 31 37 43 49 55 61 67 73 79 85 91 97 103 109 115 121 127 133 139 145 151 157 163 169 175
Fig. 1. Values of crop coefficients (kc) for winter wheat Triticum tirgidum developmental stages
Constantinidou et al.: Climate change effects on wheat yield
cur over the main mountain ranges, which intensifyaccording to the emission scenario. Solar radiation(Fig. 4) in the north-western part of the region showsan increasing tendency in the future, unlike thesouth-eastern part where it is decreasing. This spa-tial variation is the result of changes in cloud coverfraction (not shown), which are projected to reach−0.10 for Italy, the Balkans, Anatolia and the Levant(intensifying in the winter months), while they arepositive (but small in the absolute sense, less than+0.05) in the southern and eastern parts of thedomain (and mainly during the autumn and springmonths).
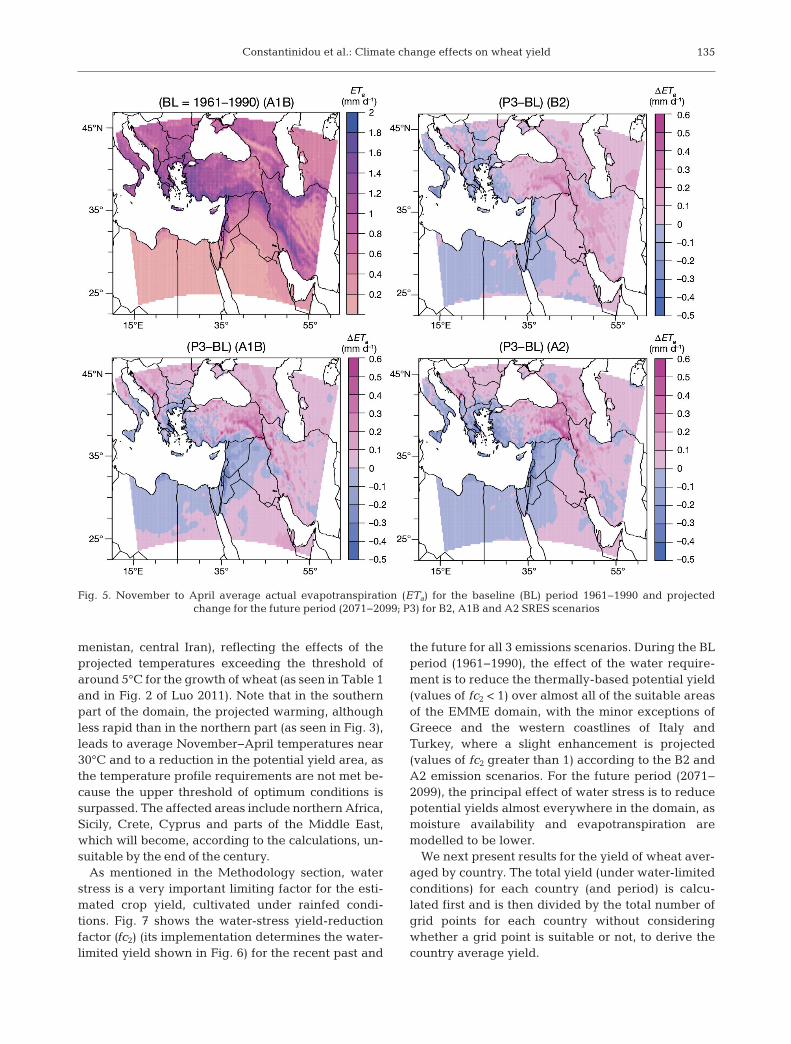
The rate of water vapour lost through evapotran-spiration in the future, as shown in Fig. 5, is about 1to 2 mm d−1 in the northern and/or mountainous (cov-ered by vegetation) part of the EMME domain ac -cording to the PRECIS simulation, while the valuesfor the southern, desert areas are negligible. Theprojected changes in evapotranspiration are positive
133
Fig. 2. Water-stress yield-reduction factor (fc2) calculated forthe baseline period driven by the intermediate A1B SRES
scenario. N.S.: not suitable
Fig. 3. November to April average temperature for the baseline (BL) period 1961−1990 for the A1B scenario and projected change for the future period (2071−2099; P3) relative to the BL for the B2, A1B and A2 SRES scenarios

Clim Res 69: 129–141, 2016
in the northern and eastern parts of the domain andnegative in the southern and western parts, drivenby the differential warming (Fig. 3) as well as theavailability of moisture (controlled by winter rainfall,see Fig. 3.2 in Zittis 2015).
Using the model fields of temperature and solarradiation, the whole domain is tested for suitability togrow winter wheat, i.e. if optimum and sub-optimumconditions (as shown in Table 1) are satisfied. This isdone by testing whether temperature profile require-ments and prevailing daily mean temperature re -gimes match in each grid box. Note that grid cellsexceeding the lower and upper temperature thresh-olds of 5 and 30°C, respectively, for the growth ofwinter wheat (Table 1) are marked as non-suitable.Only the subsequent suitable fields are then used forthe water-limited yield calculations, and the resultsare shown in Fig. 6.
The values calculated for the BL period can be com-pared with the literature and are within the indicated
limits of actual durum production; as mentioned in theIntroduction, the actual durum production in our areaof interest ranges from 0 to 6 t ha−1 (Nachit & Elouafi2004, Habash et al. 2009), and our calculations indi-cate a range for the whole domain of 2000 to 6500 kgha−1 during the baseline period. Note also that despitethe somewhat different absolute values for the yieldbetween A1B and B2/A2 (due to non-identical climatedata, as mentioned before), the spatial distribution ofsuitability among the 3 scenarios for the recent past isconsistent. For 1961−1990, only the Fertile Crescent,the northern Arabian Pen insula and parts of Egyptand Libya appear to be suitable, with over 5000 kgha−1 potential yield, and the coastal areas below 40°lati tude with smaller yields be tween 3000 and5000 kg ha−1. The continental areas in the Balkans,Ana tolia, Iran and the Caucasus do not appear suit-able. In the future period, there is evidence of ex-panding suitability in the northern part of the region(mainland Italy, Greece, Anatolia, Azerbaijan, Turk-
134
Fig. 4. November to April average shortwave radiation (SWR) for the baseline (BL) period 1961−1990 and projected change for the future period (2071−2099; P3) for B2, A1B and A2 SRES scenarios
Constantinidou et al.: Climate change effects on wheat yield
menistan, central Iran), reflecting the effects of theprojected temperatures exceeding the threshold ofaround 5°C for the growth of wheat (as seen in Table 1and in Fig. 2 of Luo 2011). Note that in the southernpart of the domain, the projected warming, althoughless rapid than in the northern part (as seen in Fig. 3),leads to average November− April temperatures near30°C and to a reduction in the potential yield area, asthe temperature profile requirements are not met be-cause the upper threshold of optimum conditions issurpassed. The affected areas include northern Africa,Sicily, Crete, Cyprus and parts of the Middle East,which will become, according to the calculations, un-suitable by the end of the century.
As mentioned in the Methodology section, waterstress is a very important limiting factor for the esti-mated crop yield, cultivated under rainfed condi-tions. Fig. 7 shows the water-stress yield-reductionfactor (fc2) (its implementation determines the water-limited yield shown in Fig. 6) for the recent past and
the future for all 3 emissions scenarios. During the BLperiod (1961−1990), the effect of the water require-ment is to reduce the thermally-based potential yield(values of fc2 < 1) over almost all of the suitable areasof the EMME domain, with the minor exceptions ofGreece and the western coastlines of Italy andTurkey, where a slight enhancement is projected(values of fc2 greater than 1) according to the B2 andA2 emission scenarios. For the future period (2071−2099), the principal effect of water stress is to reducepotential yields almost everywhere in the domain, asmoisture availability and evapotranspiration aremodelled to be lower.
We next present results for the yield of wheat aver-aged by country. The total yield (under water-limitedconditions) for each country (and period) is calcu-lated first and is then divided by the total number ofgrid points for each country without consideringwhether a grid point is suitable or not, to derive thecountry average yield.
135
Fig. 5. November to April average actual evapotranspiration (ETa) for the baseline (BL) period 1961−1990 and projected change for the future period (2071−2099; P3) for B2, A1B and A2 SRES scenarios

Clim Res 69: 129–141, 2016136
Table 2 shows the actual yields for the period of1961−1990 as provided by the FAO (for the countriesof the EMME region where these are available) aswell the derived water-limited yield for durum wheatfor the same BL period based on the intermediateA1B scenario. An appropriate conversion factor of0.875 for winter wheat (provided by GAEZ, 9.2Model Documentation, Fischer et al. 2012) is appliedto the modelled yield estimations, to ac count for theweight of the modelled product compared to theweight given by FAOSTAT. Even though this factor isapplied, a strict comparison between the two, formodel evaluation purposes, is not appropriate since:(1) the potential yield calculation assumes that thewhole area for each country is available, while theactual yield is documented from the observed pro-duction in the fields where it is cultivated; (2) theactual yield numbers may include more types ofwheat (not specified in the FAOSTAT records), while
in the table we show only the results for durumwheat as the most common type grown in the region;(3) other factors that determine actual production,such as management practices, are not varied (forexample we use a fixed crop calendar); (4) the RCMdata have not undergone bias correction (due to thelack of long-term, daily observed data for all gridpoints in the study domain, discussed by Tanarhte etal. 2012). Nevertheless, we derive the differencebetween the simulated and the actual yields, labelledin the table as ‘yield gap’, which, according to theabove, predominantly depends on the modelled cli-mate. This metric provides insight in the crop yield‘climatic potential’ of the region also with regards tothe projected climate change, as detailed next.
From inspection of the values in Table 2, we seewhich countries with favourable climate conditionsallow high potential yields, much larger than the ac-tual production (i.e. with high yield gaps). Cyprus,
Fig. 6. Water-limited yields (Yw) of winter (durum) wheat Triticum tirgidum in the baseline (BL) period 1961−1990 and in2071−2099, and projected change (ΔYw) for the 3 emission scenarios (B2, A1B, A2). N.S.: areas not suitable for durum wheat
cultivation

Constantinidou et al.: Climate change effects on wheat yield
Lebanon, Syria, Jordan and Iraq climatically have alarge potential for higher yields, which could be lim-ited by the projected warming, as by the end of the21st century, their potential yield is projected to de-crease (with the exception of Lebanon and Syria). For
the other selected countries (Libya, Israel, Italy, Alba-nia, Bulgaria, Greece, Turkey and Iran) the yield gapis small or negative, indicating optimal production(i.e. high exploitation under the respective climateconditions) with little room for further growth, or per-haps inability of the model climate and metho do logyassumptions to capture the real conditions. Interest-ingly, these countries may still have a margin forhigher production in the future, as the climate projec-tions suggest gains in the potential yield. Egypt andSaudi Arabia, which also have negative yield gaps(mainly due to irrigation), may face pressures in theachieved yields in the future due to negative changesin potential yield as a result of climate change.
The model projections of water-limited yieldchange for 2071−2099 are also presented in Fig. 8, foreach country under the 3 emission scenarios. Cyprus,Iraq, Libya and Saudi Arabia show negative changesfor all 3 scenarios, with the largest reductions simu-lated under the high-emission scenario A2. Reducedyields for the end of the century are also calculatedfor Israel, Jordan and Lebanon with the B2 and A2scenarios, but for the same countries, the moderateA1B scenario indicates higher yields. Egypt andSyria are also projected to have lower yields. Thenorthern part of the study domain, i.e. Albania, Bul-garia, Greece, Iran and Turkey, is projected to have
137
Fig. 7. Water-stress yield-limiting factor fc2 (calculated as water-limited yield / potential yield, Yw/Yp) for the 3 emission sce-narios (B2, A1B, A2) and the periods 1961−1990 and 2071−2099. N.S.: not suitable
Country Ya_BL Yw_BL Ygap_BL ΔYw
Albania 2127 1030 −1097 908Bulgaria 3293 0 −3293 775Cyprus 1233 2825 1592 −2522Egypt 3335 413 −2922 −454Greece 2152 1593 −559 1123Iran 930 529 −401 691Iraq 809 2409 1600 −1056Israel 2004 2044 40 −2227Italy 2500 952 −1548 502Jordan 692 2447 1755 −743Lebanon 1209 2632 1423 873Libya 487 509 23 −582S. Arabia 2403 1340 −1063 −1161Syria 1039 2932 1893 60Turkey 1564 565 −999 843
Table 2. Average yield per country in kg ha−1 for the base-line (BL) period 1961−1990: actual Ya_BL (FAO), modelledwater-limited yield Yw_BL (PRECIS) and their differenceYgap_BL. Also shown is the future period 2071−2099: mod-elled change from 1961−1990 (ΔYw). The PRECIS values are
based on the A1B emission scenario

Clim Res 69: 129–141, 2016
higher yields, especially under the A1B and A2 emis-sion scenarios, where the increasing temperaturesbring winter average conditions above the lower coldthreshold, as mentioned in the discussion of Fig. 6.On the other hand, it seems that although the B2 sce-nario is the least severe of the 3 (i.e. with the smallestprojected warming), it still induces negative changesto almost all countries in the southern part of thestudy domain (with the warmest climatic BL). Eventhe small projected warming in these countries shiftsthe prevailing temperatures above the upper thresh-old for optimum growth for winter wheat.
5. DISCUSSION AND CONCLUSIONS
In this study we project changes of potential cropyields of wheat in the EMME region by taking intoaccount changes in temperature, incoming solarradiation and evapotranspiration. Our work comple-ments the GAEZ web portal (www.gaez.iiasa.ac.at/)developed and maintained by FAO and IIASA, sinceit allows the use of additional gridded climate data -sets as input for the crop yield calculations, providedhere by simulations with the PRECIS RCM. The cropstudied in this paper is winter (durum) wheat, themost important cereal for the region.
Considering the recent 20th century temperatureand solar radiation conditions simulated by PRECIS,durum is indeed a high yielding (>4000 kg ha−1) andwidespread cultivar in the EMME region, particularlyfavoured in the Fertile Crescent (from Iraq to Egypt)
and the coastal areas of eastern Mediterranean Eu-rope. Future climate conditions, modelled on thebasis of 3 IPCC emission scenarios, will cause durumwheat to become less suitable in Libya, Egypt, SaudiArabia and southern Iraq, as the additional projectedheat negatively affects the upper temperature thresh-olds for optimum crop growth. On the other hand, thefuture warming in the Balkans and Anatolia withtemperatures above the lower optimum thresholdsfor durum results in higher potential yields.
An analysis of the area average per country revealsthat for durum wheat, the high potential for yield im -provement (as suggested by our positive yield gapestimates) in Cyprus, Israel, Lebanon, Syria, Jordanand Iraq may be reduced by the end of the centurydue to climate warming (even under the least intenseB2 emission scenario), while the low (or negative)yield gap countries could experience increases in po-tential yield, mainly under the A1B and A2 scenarios.
The implementation of the GAEZ methodology inthis paper lies, in terms of accuracy, in between sim-ple linear relations of yield and temperature and themore complex process-based crop models (Semenovet al. 2012). The assumptions of the applied methodo -logy as well as the specific climate model output mayalso have affected the calculated yield gaps. Never-theless, this AEZ approach applied here on RCM dataallows the straightforward input of any climate modeldataset and demonstrates its utility for regional as-sessments of climate change impacts on crop yieldsand food security. Our current analysis does not in-clude the CO2 fertilization (i.e. the direct effect on
138
Fig. 8. Country average changes in water-limited yield (Yw) of winter wheat Triticum tirgidum projected in 2071−2099 (P3) compared to the baseline (BL) period 1961−1990 for the 3 emission scenarios (B2: green, A1B: blue, A2: red)

Constantinidou et al.: Climate change effects on wheat yield
photosynthetic rates; for example, see Kimball et al.2002, Sakurai et al. 2014) due to the uncertainties ofthe actual effects (Ainsworth et al. 2008, Koehler et al.2013). We have also relied on mean climatic condi-tions; therefore, the potentially important role of cli-mate extremes (Teixeira et al. 2013) is not taken intoaccount. These additional factors associated with cli-mate change will be investigated in a follow-upstudy, including investigation of adaptation optionsby adjusting the growth cycle through changes in thecrop calendar (i.e. by altering sowing dates).
Acknowledgements. We are grateful to the editor and 2anonymous reviewers for their comments and suggestions.We acknowledge Harry van Velthuizen at the InternationalInstitute for Applied Systems Analysis (IIASA) for his valu-able help with the GAEZ manual; and IIASA and FAO forproviding the Global Agro-ecological Zones methodology.Material was produced using PRECIS Software provided bythe Hadley Centre of the UK Met Office. The research lead-ing to these results has received funding from the EuropeanResearch Council under the European Union’s SeventhFramework Programme (FP7/2007-2013) / ERC grant agree-ment no. 226144 (C8 Project).
LITERATURE CITED
Ainsworth EA, Leakey ADB, Ort DR, Long SP (2008) FACE-ing the facts: inconsistencies and interdependenceamong field, chamber and modeling studies of elevated[CO2] impacts on crop yield and food supply. New Phytol179: 5−9
Asseng S, Thomas D, McIntosh P, Alves O, Khimashia N(2012) Managing mixed wheat-sheep farms with a sea-sonal forecast. Agri Sys 113: 50–-56
Chenoweth J, Hadjinicolaou P, Bruggeman A, Lelieveld J andothers (2011) Impact of climate change on the waterresources of the eastern Mediterranean and Middle Eastregion: modeled 21st century changes and implications.Water Resour Res 47: W06506, doi: 10. 1029/ 2010 WR 010269
Ciais P, Reichstein M, Viovy N, Granier A and others (2005)Europe-wide reduction in primary productivity causedby the heat and drought in 2003. Nature 437: 529−533
Collins M, Booth B, Harris G, Murphy J, Sexton D, Webb M(2006) Towards quantifying uncertainty in transient cli-mate change. Clim Dyn 27: 127−147
de Wit CT (1965) Photosynthesis of leaf canopies. Agricul-tural Research Reports 663. Pudoc, Wageningen
Fischer G, van Velthuizen H, Shah M, Nachtergaele F (2002)Global agro-ecological assessment for agriculture in the21st century: methodology and results. IIASA ResearchReport RR-02. International Institute for Applied SystemsAnalysis, Laxenburg
Fischer G, Nachtergaele FO, Prieler S, Teixeira E and others(2012) Global Agro-Ecological Zones (GAEZ v3.0) − modeldocumentation. IIASA, Laxenburg, and FAO, Rome.Available at www.gaez.iiasa.ac.at/docs/ GAEZ_ Model _Documentation.pdf
Grasso M, Feola G (2012) Mediterranean agriculture underclimate change: adaptive capacity, adaptation, andethics. Reg Environ Change 12: 607−618
Habash DZ, Kehel Z, Nachit M (2009) Genomic approachesfor designing durum wheat ready for climate changewith a focus on drought. J Exp Bot 60: 2805–2815
ICARDA (International Center for Agricultural Research inthe Dry Areas) (2001) Spain and ICARDA. Ties that bind,No. 14. ICARDA, Aleppo
Iglesias A, Rosenzweig C, Pereira D (2000) Agriculturalimpacts of climate change in Spain: developing tools fora spatial analysis. Glob Environ Change 10: 69−80
Iizumi T, Luo JJ, Challinor AJ, Sakurai G and others (2014)Impacts of El Niño Southern Oscillation on the globalyields of major crops. Nat Commun 5: 3712
Kassam AH (1977) Net biomass production and yield ofcrops. FAO, Rome
Key JM (2005) Wheat: its concept, evolution, and taxonomy.In: Royo C, Nachit MM, Di Fonzo N, Araus JL, PfeifferWH, Slafer GA (eds) Durum wheat breeding: currentapproaches and future strategies, Vol 1. Food ProductsPress, an imprint of the Haworth Press Inc, New York,NY, p 3−61
Kimball B, Kobayashi AK, Bindi M (2002) Responses of agri-cultural crops to free-air CO2 enrichment. Adv Agron 77: 293−368
Koehler AK, Challinor AJ, Hawkins E, Asseng S (2013)Influences of increasing temperature on Indian wheat: quantifying limits to predictability. Environ Res Lett 8: 034016, doi: 10.1088/1748-9326/8/3/034016
Leff B, Ramankutty N, Foley J (2004) Geographic distribu-tion of major crops across the world. Global BiogeochemCycles 18: GB1009, doi: 10.1029/2003GB002108
Lelieveld J, Hadjinicolaou P, Kostopoulou E, Chenoweth Jand others (2012) Climate change and impacts in theeastern Mediterranean and the Middle East. ClimChange 114: 667−687
Lidon FC, Almeida AS, Leitao AL, Silva MM, Pinheiro N,Macas B, Costa R (2014) A synoptic overview of durumwheat production in the Mediterranean region and pro-cessing following the European Union requirements.Emir J Food Agric 26: 693–705
Luo Q (2011) Temperature thresholds and crop production: areview. Clim Change 109: 583−598
Moriondo M, Giannakopoulos C, Bindi M (2011) Climatechange impact assessment: the role of climate extremesin crop yield simulation. Clim Change 104: 679−701
Nachit MM, Elouafi I (2004) Durum adaptation in the Medi-terranean dryland: breeding, stress physiology, andmolecular markers. In: Rao SC, Ryan J (eds) Challengesand strategies for dryland agriculture. CSSA SpecialPublication 32. Crop Science Society of America Inc.,American Society of Agronomy Inc, Madison, WI,p 203−218
Nakicenovic N, Davidson O, Davis G, Grübler A and others(2000) Special report on emissions scenarios. A specialreport of Working Group III of the IntergovernmentalPanel on Climate Change. Cambridge University Press,Cambridge
Naresh Kumar S, Aggarwal PK, Swaroopa Rani DN, SaxenaR, Chauhan N, Jain S (2014) Vulnerability of wheat pro-duction to climate change in India. Clim Res 59: 173−187
Oldeman LR, Frére M (1982) A study of the agroclimatologyof the humid tropics of South-East Asia. Tech Note 179.WMO, Geneva
Olesen JE, Bindi M (2002) Consequences of climate changefor European agricultural productivity, land use and pol-icy. Eur J Agron 16: 239−262
139

Clim Res 69: 129–141, 2016
Rivero Vega RE (2008) Workbook of climate change impactassessment in agriculture. Basic knowledge, methodologyand tools. Camagüey Meteorological Centre. Available athttp: //www.agrometeorology.org/files-folder/ repository/INSAMRogerWorkbookadaptclimchange.pdf
Rosenzweig C, Jones JW, Hatfield JL, Ruane AC and others(2013) The Agricultural Model Intercomparison andImprovement Project (AgMIP): protocols and pilot stud-ies. Agric For Meteorol 170: 166−182
Rosenzweig C, Elliott J, Deryng D, Ruane AC and others(2014) Assessing agricultural risks of climate change inthe 21st century in a global gridded crop model inter-comparison. Proc Natl Acad Sci USA 111: 3268−3273
Sacks JW, Deryng D, Foley J, Ramankutty N (2010) Cropplanting dates: an analysis of global patterns. Glob EcolBiogeogr 19: 607−620
Sakurai G, Iizumi T, Nishimori M, Yokozawa M (2014) Howmuch has the increase in atmospheric CO2 directlyaffected past soybean production? Sci Rep 4: 4978, doi: 10.1038/srep04978
Semenov MA, Mitchell RAC, Whitmore AP, HawkesfordMJ, Parry MAJ, Shewry PR (2012) Shortcomings inwheat yield predictions. Nat Clim Change 2: 380−382
Sen B, Topcu S, Türke M, Sen B, Warner JF (2012) Project-ing climate change, drought conditions and crop produc-tivity in Turkey. Clim Res 52: 175−191
Shewry PM, Underwood C, Wan Y, Lovegrove A and others(2009) Storage product synthesis and accumulation indeveloping grains of wheat. J Cereal Sci 50: 106−112
Tanarhte M, Hadjinicolaou P, Lelieveld J (2012) Intercompar-ison of temperature and precipitation data sets based onobservations in the Mediterranean and the Middle East. JGeophys Res 117:D12102, doi: 10.1029/2011JD 017293
Teixeira EI, Fischer G, van Velthuizen H, Walter C, Ewert F(2013) Global hot-spots of heat stress on agricultural cropsdue to climate change. Agric For Meteorol 170: 206−215
Van Ittersum M, Cassman KG, Grassini P, Wolf J, Tittonell P,Hochman Z (2013) Yield gap analysis with local to globalrelevance — a review. Field Crops Res 143: 4−17
Van Wart J, van Bussel LGJ, Wolf J, Licker R and others(2013) Use of agro-climatic zones to upscale simulatedcrop yield potential. Field Crops Res 143: 44−45
Vanuytrecht E, Raes D, Willems P, Semenov MA (2014)Comparing climate change impacts on cereals based onCMIP3 and EU-ENSEMBLES climate scenarios. AgricFor Meteorol 195−196: 12−23
Zittis G (2015) Regional climate modelling in the easternMediterranean and the Middle East: aspects of summerwarming and related feedbacks under a changing cli-mate. PhD thesis, The Cyprus Institute, Nicosia. doi: 10.13140/RG.2.1.4698.3845
Zittis G, Hadjinicolaou P, Lelieveld J (2014) Role of soil mois-ture in the amplification of climate warming in the easternMediterranean and the Middle East. Clim Res 59: 27−37
Zittis G, Hadjinicolaou P, Fnais M, Lelieveld J (2015) Pro-jected changes in heat wave characteristics in the east-ern Mediterranean and the Middle East. Reg EnvironChange 1−14, doi: 10.1007/s10113-014-0753-2
140
Temperature profiles are defined in terms of 9 classes of‘temperature ranges’, listed in Table A1 for days with aver-age (mean) temperature <−5°C to >30°C, at 5°C intervals,in combination with distinguishing increasing anddecreasing temperature trends within the averaged 30 yrperiod.
Temperature profiling is firstly performed on the prevail-ing average temperature conditions of each grid box.These prevailing temperature profile conditions are thentested against the crop temperature requirements (foundin Table 1 of the main text) for matching.
Temperature profile requirements are crop-specificrules that take into account the temperature profile classesshown in Table A1. GAEZ has defined in detail the tem-perature profile requirements for each crop; Table 1 showsthe corresponding requirements for winter wheat. Theseare the 2 data sets for optimum and sub-optimum condi-tions that are needed to be satisfied in order for a grid boxto be considered suitable for cultivation of winter wheat;otherwise the grid boxes are marked as non-suitable.
Appendix 1. Temperature profiles and requirements
Average Growth cycle Temperature trendtemperature duration Increasing Decreasing(°C) (d)
>30 L1 L1a L1b30−25 L2 L2a L2b25−20 L3 L3a L3b20−15 L4 L4a L4b15−10 L5 L5a L5b10−5 L6 L6a L6b5−0 L7 L7a L7b0 to −5 L8 L8a L8b< −5 L9 L9a L9b
Table A1. Temperature profile classes
➤
➤
➤
➤
➤
➤
➤
➤
➤
➤
➤

Constantinidou et al.: Climate change effects on wheat yield 141
All equations of the biomass and yield calculation model(AEZ methodology) (Kassam 1977, Fischer et al. 2012) aredescribed in detail in the following paragraphs.
The maximum rate of gross biomass production (bgm) isrelated to the maximum net rate of CO2 exchange of leaves(Pm), which is dependent on temperature, the photosyn-thesis pathway of the crop and the level of atmosphericCO2 concentration.
bgm = F × b0 + (1 − F) (A1)
where F is the fraction of daytime during which the sky isclouded and is related to the maximum active incomingshortwave radiation on clear days (Ac or photosyntheticallyactive radiation, PAR; de Wit 1965) and the incomingshortwave radiation (SWR) which is provided by the PRE-CIS RCM (units for both is [cal cm−2 d−1]). b0 is the grossdry matter production rate of a standard crop for a givenlocation and time of the year on a completely overcast day,and bc is the gross dry matter production rate of a standardcrop for a given location and time of the year on a perfectlyclear day, both measured in kg ha−1 d−1 (de Wit 1965). Ac,b0 and bc are interpolated from Vega (2008).
The net biomass production Bn for a crop of N days,where half of the maximum rate of net biomass (dry mat-ter) production is the seasonal average rate of net biomassproduction, can be derived from:
(A2)
where bgm is the maximum rate of gross biomass produc-tion and is calculated by Eq. (A1), L is the growth ratio ofbgm at the actual leaf area index (LAI) to bgm at an LAI of 5,N is the duration of the normal growth cycle, and ct is themaintenance respiration, dependent on both crop andtemperature.
Finally, potential yield (Yp) is estimated from net biomass(Bn) using the equation:
Yp = Hi × Bn (A3)
where Hi is the harvest index, i.e. the proportion of the netbiomass of a crop that is economically useful.
Yield reduction in response to water deficits is then cal-culated as a function of the relationship between actualcrop evapotranspiration (ΣETa, mm d−1) and maximumcrop evapotranspiration (ΣETm, mm d−1), both accumu-lated within the 4 crop stages. Result of this calculation is awater stress yield reduction factor (fc2), using the followingequations:
(A4)
is the effect of overall deficit, ky0 is an average value ofthe water stress coefficient for the overall crop growthcycle, which expresses the sensitivity of specific crop towater stress, ETa is the actual crop evapotranspiration, andETm is the maximum crop evapotranspiration (mm d−1).
(A5)
represents the weighted effect of crop-stage specificwater stress, ky is the crop-specific value of the waterstress coefficient for each crop development stage (j = 1−4;initial, vegetative, reproductive, maturation). TETa andTETm are respectively total actual evapotranspiration andtotal maximum crop evapotranspiration for days duringeach crop growth stage. λj are weighting coefficients, thesum of which equals 1, and are taken as the relative lengthof each crop development stage.
(A6)
where fc2 is the water-stress reduction factor.Water-limited yield (Yw) is then calculated as potential
yield (Yp) multiplied by the water-stress reduction factorfc2 by the following equation:
Yw = Yp × fc2 (A7)
∑∑
⎛
⎝⎜
⎞
⎠⎟= − × −1 0 12
1
1
fc kET
ET
Ty
TCLa
TCLm
2fcT
1 12
1
4
∏ ⎛⎝⎜
⎞⎠⎟
⎛⎝⎜
⎞⎠⎟
= − × −=
λ
fc kyTETa
TETmCS
j
jj
j
j
2fcCS
( )= min ,2 2 2fc fc fcCS T
=×
+
0.361
0.25
gmB
b L
Nc
n
t
Appendix 2. Biomass and yield calculation
Editorial responsibility: Toshichika Iizumi, Tsukuba, Japan
Submitted: October 16, 2014; Accepted: April 7, 2016Proofs received from author(s): June 3, 2016