effects of cobalt supplementation and vitamin b12
TRANSCRIPT

EFFECTS OF COBALT SUPPLEMENTATION AND VITAMIN B12 INJECTIONS ON
LACTATION PERFORMANCE AND METABOLISM OF HOLSTEIN DAIRY COWS
by
Matthew S. Akins
A dissertation submitted in partial fulfillment of
the requirements for the degree of
Doctor of Philosophy
(Dairy Science)
at the
UNIVERSITY OF WISCONSIN-MADISON
2012
Date of final oral examination: 5/22/2012
The dissertation is approved by the following members of the Final Oral Committee:
Randy Shaver, Professor, Dairy Science
Dave Combs, Professor, Dairy Science
Ric Grummer, Professor Emeritus, Dairy Science
Mark Cook, Professor, Animal Science
Dan Schaefer, Professor, Animal Science

© Copyright by Matthew S. Akins 2012
All Rights Reserved

i
ACKNOWLEDGEMENTS
First, I would like to thank God for guidance during the past 5 years.
I would like to especially thank Dr. Randy Shaver for his patience and guidance
throughout my PhD program. He has provided me with insight and opportunities that I would
not have had. Also, I would like to thank my committee members including Dr. Dave Combs,
Dr. Ric Grummer, Dr. Mark Cook, and Dr. Dan Schaefer for their time, input, and
encouragement during my PhD program. I would like to extend a special thank you to Sandy
Bertics for her laboratory analysis expertise and organization of this project before I arrived. To
Sandy Trower, Jerry Guenther, and all the herd staff I would like to thank you for the time and
effort you put into my research project and for being a great friend to all researchers. Also, I
need to thank Dr. Christian Girard for being of assistance with the vitamin analysis methods.
Thank you to all the UW-Madison graduate students for the time you have put into my project
and for the great times we spent together. I have met many amazing people from different
cultures and I am thankful for these experiences.
To my parents I thank you for always pushing me to do my best and encouraging me at
every turn. Most importantly, I thank my wife Tiffany, son William, and daughter Madeline for
the love and support you have given me the past 5 years. Your encouragement drives me to
continue on the path ahead. I look forward to the next adventure with you.
ii
TABLE OF CONTENTS
Page
ACKNOWLEDGEMENTS…………………………………………………………………….... i
TABLE OF CONTENTS…………………………………………………………………………ii
ABSTRACT……………………………………………………………………………………...iii
LIST OF FIGURES…………………………………………………………………………….... v
LIST OF TABLES……………………………………………………………………………….vii
CHAPTER 1. Literature Review…………………………………………………………………. 1
Introduction………………………………………………………………………………………. 1
Vitamin B12 Structure and Functions…………………………………………………………….. 3
Deficiency Symptoms of Vitamin B12……………………………………………………………. 5
Cobalt and Vitamin B12 Requirements………………………………………………………….... 8
Cobalt Content of Feeds………………………………………………………………………….10
Dietary Factors Impacting Vitamin B12 Synthesis………………………………………………. 10
Ruminal Destruction/Conversion of Vitamin B12………………………………………………..19
Vitamin B12 Absorption…………………………………………………………………...……. .22
Vitamin B12 Transport……………………………………………………………………………25
Interaction of Vitamin B12 and Folate…………………………………………………………… 25
Effects of Supplemental Cobalt in Dairy Cattle………………………………………………… 27
Effects of Supplemental Vitamin B12 in Dairy Cattle……………………………………………29
Summary and Objectives of Thesis Research…………………………………………………… 31
References ………………………………………………………………………………………..33
iii
TABLE OF CONTENTS (CONTINUED)
Page
CHAPTER 2. Effects of Cobalt Supplementation and Vitamin B12 injections on
Lactation Performance and Metabolism of Holstein Dairy Cows………………………………. 41
Abstract…………………………………………………………………………………………. .42
Introduction ………………………………………………………………………………………43
Materials and Methods...…………………………………………………………………………45
Results and Discussion …………………………………………………………………………..50
Summary and Conclusions……………………………………………………………………….58
Acknowledgements ………………………………………………………………………………59
References ………………………………………………………………………………………..59
CHAPTER 3. Thesis Conclusions and Potential Research Projects ……………………………..82
Thesis Conclusions ………………………………………………………………………………82
Future Research…………………………………………………………………………………..83
References ………………………………………………………………………………………..89

iv
ABSTRACT
EFFECTS OF COBALT SUPPLEMENTATION AND VITAMIN B12 INJECTIONS ON
LACTATION PERFORMANCE AND METABOLISM OF HOLSTEIN DAIRY COWS
Matthew S. Akins
Under supervision of Professor Randy D. Shaver
At the University of Wisconsin-Madison
A literature review and a research study were performed to examine cobalt and vitamin
B12 nutrition in dairy cattle. The literature review revealed that cobalt supplementation increases
ruminal vitamin B12 synthesis and the current cobalt requirement stated for dairy cattle (0.11
mg/kg DM) is inadequate based on beef cattle research showing improvements in performance
and vitamin B12 status at 0.25 mg Co/kg DM. Cobalt supplementation for dairy cattle above
requirements has had varied lactation performance results with little improvement of vitamin B12
status measures. Dairy cattle given vitamin B12 injections have shown improvements in milk
production when fed folic acid and rumen-protected methionine.
The objective of this study was to determine lactation performance and metabolism
parameters of dairy cows fed different levels and sources (inorganic and organic) of cobalt or
given weekly vitamin B12 injections. Forty-five primi- and multiparous cows starting at 60 d
before parturition were assigned to 1 of 5 treatments: 1) no supplemental Co (Control), 2) 25
mg/d supplemental Co from cobalt carbonate (CoCarb), 3) 25 mg/d supplemental Co from cobalt
v
glucoheptonate (LCoGH), 4) 75 mg/d supplemental Co from cobalt glucoheptonate (HCoGH),
and 5) Control diet plus weekly 10 mg vitamin B12 injections (IB12). Cows remained on their
respective treatment until 150 DIM. Cobalt (mg/kg DM) in the lactating diets was 1.0, 1.9, 2.3,
and 5.1 for Control/IB12, CoCarb, LCoGH, and HCoGH, respectively. Dry matter intake, body
weight, and body condition score were unaffected by treatment. LCoGH tended to have greater
milk yield than CoCarb, but Control had similar milk yields to the mean of LCoGH and HCoGH.
Treatments did not influence plasma or liver measures of energy metabolism. Vitamin B12
injections increased plasma, liver, and milk vitamin B12 concentrations. Cobalt supplementation
did not affect plasma vitamin B12 concentration; but increased milk vitamin B12 concentrations
throughout lactation and liver vitamin B12 concentration at calving. Folate status of cows in the
study was low and possibly limited the effect of improved vitamin B12 status on lactation
performance. Overall, cobalt supplementation or vitamin B12 injections improved certain
measures of vitamin B12 status, but not lactation performance compared to Control.
vi
LIST OF FIGURES
Page
CHAPTER 1
Figure 1. Figure 1. Cobalamin structure…………………………….…………………………….3
Figure 2. Conversion of propionyl-CoA to succinyl-CoA………………………………………...4
Figure 3. Folate and methionine cycles .......................................................................................... 4
Figure 4. Plasma methylmalonic acid concentrations of beef steers fed diets differing in cobalt
concentration (Stangl et al., 2000). ................................................................................................. 7
Figure 5. Plasma and liver vitamin B12 concentrations of beef steers fed diets with differing coalt
concentrations (Stangl et al., 2000)................................................................................................. 9
Figure 6. Ruminal vitamin B12 production by sheep after removal of cobalt from diet (Smith and
Marston, 1970). ............................................................................................................................. 12
Figure 7. Serum vitamin B12 of primiparous and multiparous cows over time (Girard and Matte,
1999) ............................................................................................................................................. 26
CHAPTER 2
Figure 1. Effect of treatment and time on milk yield .................................................................... 71
Figure 2. Effect of treatment by time interaction on milk vitamin B12 yield ................................ 74
Figure 3. Effect of treatment by time interaction on plasma cobalt concentration ....................... 76
Figure 4. Effect of treatment and time on plasma vitamin B12 concentration. ............................. 77
Figure 5. Effect of the number of days after injection of vitamin B12 on plasma vitamin B12
concentrations of cows on IB12 on d 1 of lactation...................................................................... 78
vii
LIST OF FIGURES (CONTINUED)
Page
Figure 6. Effect of parity and time on plasma folates ................................................................... 79
Figure 7. Effect of treatment and time on liver cobalt. ................................................................. 80
Figure 8. Effect of treatment and time on liver vitamin B12.. ....................................................... 81
viii
LIST OF TABLES
Page
CHAPTER 1
Table 1. Vitamin B12 concentrations over time of continuous-flow fermentors fed diets with
differing cobalt concentrations (Tiffany et al., 2006)…………………………………………...15
Table 2. Apparent vitamin B12 synthesis of dairy cattle fed diets with differing forage and NFC
concentrations (Schwab et al., 2006)………………………………………………………… …18
Table 3. Milk cobalt concentrations and milk and colostrum vitamin B12 concentrations of dairy
cows fed diets with differing cobalt (Kincaid and Socha, 2007)………………………………..28
CHAPTER 2
Table 1. Ingredient and nutrient composition of diets fed to dry and lactating cows…………...63
Table 2. Cobalt concentration of ingredients from two laboratories...…………………………..65
Table 3. Cobalt concentration of treatment diets from two laboratories………………………...66
Table 4. Mineral concentrations of the diets…………………………………………………....67
Table 5. Incidence of health events……………………………………………………………..68
Table 6. Treatment effects on least square means of prepartum BW, BCS, DMI, and energy
balance………………………………………………………………………………...................69
Table 7. Effect of treatments on least square means for lactation performance…………………70
Table 8. Effects of treatments on least square means of selected measures in colostrum and
milk……………………………………………………………………………………………...72
Table 9. Effect of treatment by parity by time on milk vitamin B12 concentration……………...73
Table 10. Effects of treatments on least square means of plasma and liver parameters………..75

1
CHAPTER 1
REVIEW OF LITERATURE
Introduction
Vitamins are defined as complex organic compounds found in minute amounts in the diet
that are necessary for fundamental body metabolism. Before the early 1900s, nutritional
research focused on energy, protein, and minerals with no scientific evidence for other necessary
nutrients. In 1890, the origin of vitamin research occurred when Eijkman observed that the
condition known as polyneuritis in chickens (beriberi in humans) fed a polished rice diet could
be cured when rice polishings were added back to the diet. Funk (1911) proposed the “vitamin
theory” after reviewing literature related to curing beriberi using rice by-products and concluded
that beriberi could be prevented and cured by a nutritional factor. McCollum from the
University of Wisconsin also concluded from a review of literature from 1873 to 1906 that
feeding purified carbohydrates, proteins, and fats led to unhealthy animals and the discovery of
the lacking nutrients was an important problem and discovered vitamin A and thiamin by 1915
(McDowell, 2000). Vitamin discovery was at a peak during the 1930s and 1940s when a
majority of the currently known vitamins were found and purified. In 1948, the last vitamin;
vitamin B12, was discovered simultaneously by Rickes and coworkers in the US and Smith from
Great Britain.
In 1824 Combe described the disease pernicious anemia in humans and suggested it to be
related to a digestive tract disorder. Then Whipple in 1920 and Minot and Murphy in 1926
recognized that a factor in liver cured pernicious anemia by giving doses of 120 to 240 g/day of
liver. However, the disorder they were curing was not pernicious anemia but an iron deficiency
2
anemia. In 1929, Castle suggested that pernicious anemia was caused by an interaction of a
factor in the animal’s stomach (intrinsic factor) and a factor in the diet (extrinsic factor/vitamin
B12). Castle showed this by mixing beef muscle with gastric juice then feeding it to patients with
pernicious anemia. He went to the extent of using his stomach to process the food, then
regurgitate the digested food, and add the supplement to his patient’s meal.
An important discovery in 1947 by Shorb of the University of Maryland recognized that
the liver extract factor known as LLD factor required by the bacteria Lactobacillus lactis Dorner
was in a linear relationship to the anti-pernicious anemia (APA) factor activity in the liver
extract. Using this bacteria, Rickes and coworkers isolated the APA factor from liver in 1948
and named it vitamin B12. The complete structure of vitamin B12 was determined in 1956 by
Hodgkin using x-ray crystallography and found that cobalt was part of vitamin B12.
Before the discovery of vitamin B12, cobalt was found to be an essential nutrient for
ruminants when in 1935 Underwood and others in Australia concluded that the sheep diseases
known as “coast disease” or “wasting disease” could be cured by supplementing cobalt
(Underwood, 1977). This was also the case in Florida when Becker and coworkers in 1937
reported that a cobalt deficiency lead to “wasting disease”. Then in 1951, Smith and coworkers
at Cornell University showed that vitamin B12 injections prevented cobalt deficiency symptoms
in sheep. Much ruminant research on vitamin B12 during the 1950s to 1970s focused on diet
effects on ruminal synthesis and impacts of supplemental vitamin B12 on performance and
ruminal degradation of the vitamin. More recent research has focused on lactation and metabolic
responses to supplemental Co or vitamin B12.

3
Vitamin B12 Structure and Functions
Vitamin B12 or cobalamin is a part of a group of molecules called corrinoids due to the
corrin structure of vitamin B12. Cobalamin refers only to corrinoids that have cobalt at the center
of the corrin structure. Vitamin B12 has the most complex structure of the vitamins with a corrin
or “core ring” structure consisting of a tetrapyrrole structure with the nitrogen atom of each
pyrrole molecule attached to a single cobalt atom. The corrin structure is a planar structure with
the nucleotide 5,6-dimethylbenzimidazole and ribose-3-phosphate group attached below the
cobalt atom and to a propionic acid group of one of the pyrrole rings to increase stability
(McDowell, 2000). The β-ligand determines
whether the molecule is vitamin B12 or an
analogue. The R-group or α-ligand (Figure 1)
is attached above the cobalt atom and can be
different groups including CN
(cyanocobalamin), CH3 (methylcobalamin),
5’-deoxyadenosyl group (adenosylcobalamin),
H2O (aquacobalamin), OH
(hydroxycobalamin), and NO2
(nitrocobalamin). The α-ligand determines the biological processes vitamin B12 is involved with.
Cyanocobalamin is not a naturally occurring form but an artifact from the original isolation of
the vitamin. Cyanocobalamin must be transformed to the coenzyme form of adenosylcobalamin
or methylcobalamin before having activity. Adenosylcobalamin and methylcobalamin are the
forms found in animal tissues and function as coenzymes for two specific reactions.
Figure 1. Cobalamin structure

4
Adenosylcobalamin is needed in the metabolism of propionate produced by rumen fermentation,
amino acids (leucine, methionine, threonine, and valine), and branched-chain fatty acids to
succinyl-CoA (Figure 2) which enters the Kreb’s cycle and possibly gluconeogenesis.
Specifically, methylmalonyl-CoA mutase needs adenosylcobalamin for converting L-
methylmalonyl-CoA to succinyl-CoA. Methylcobalamin is involved in both the folate and
methionine cycle by regenerating methionine from homocysteine and tetrahydrofolate from 5-
methyl tetrahydrofolate (THF) as shown in Figure 3. This function is important for regenerating
methyl donors (methionine) for methylation reactions and regenerating THF for synthesis of
DNA precursors.
Figure 2. Conversion of propionyl-CoA to succinyl-CoA
Figure 3. Folate and methionine cycles
5
In addition to being needed as a cofactor for mammalian enzymes, vitamin B12 is
necessary for fermentation in microbes, which are the sole producers of the vitamin in nature.
Bacteria need vitamin B12 for production of propionate, methane, methionine and the recycling
of folate.
Vitamin B12 not only has active forms as discussed previously, but several inactive
analogues that are intermediates of vitamin B12 synthesis. These analogues have various
structural changes such as no R-group, ribose, and phosphate group, or the replacement of 5,6-
dimethylbenzimidazole with several different variants (Girard et al., 2009a). There are several
sources of the analogues including sewage, manure, rumen contents, and fermentation residues
(McDowell, 2000).
Deficiency Symptoms of Vitamin B12
A majority of the information referenced in this section is from McDowell (2000).
In humans, a vitamin B12 deficiency results in megaloblastic or pernicious anemia and
neurological lesions that are caused by either a deficiency of intrinsic factor needed for vitamin
B12 absorption or people on a strict vegetarian diet. Megaloblastic anemia is characterized by
large, fragile, immature red blood cells with normal hemoglobin concentration; however there
are lower red blood cell numbers. This is caused by reduced DNA synthesis due to a deficiency
of folate and/or vitamin B12. Vitamin B12 is needed by the enzyme methionine synthase to
regenerate 5-methyl THF to THF which is needed for DNA precursor synthesis. Red blood cells
thus do not have adequate DNA precursors, divide slower, andare immature. The neurological
lesions associated with vitamin B12 deficiency are also proposed to be caused by reduced activity
6
of methionine synthase. Methionine synthase regenerates methionine from homocysteine which
is converted to S-adenosyl methionine (SAM) and used for methylation reactions. Low SAM
levels are linked to abnormal myelin formation and nervous system disorders.
Ruminants seldom show symptoms of megaloblastic anemia or nerve degeneration from
a vitamin B12 deficiency except for young ruminants that do not yet have a developed rumen
microflora needed for vitamin B12 synthesis. However, ruminants show clinical signs such as
lack of appetite, anemia due to reduced red blood cell concentrations (normal size and normal
hemoglobin concentration), emaciation, and white liver disease (fatty liver) in sheep. These
conditions are primarily seen in sheep and occasionally in goats (Suttle, 2010). Low vitamin B12
status in ruminants is caused by a dietary cobalt deficiency since cobalt is needed for rumen
microbial production of vitamin B12. Cobalt deficiency is largely due to low soil cobalt levels
and thus low forage cobalt levels. This is especially apparent with grazing livestock without
supplemental cobalt. Animals can graze marginal pastures if they were occasionally moved to
pastures with adequate cobalt levels. Tokarnia et al. (1971) showed an example of this when
cattle developed cobalt deficiency symptoms when kept on certain pastures for 60 to 180 days,
but recover if moved to pastures where the disease did not occur.
Cobalt and vitamin B12 status is typically determined using serum or plasma, milk, and
liver concentrations of vitamin B12 and liver cobalt concentrations. Liver is the main storage site
and analysis provides an estimate of vitamin B12 reserves. Early radioisotope assays for vitamin
B12 had higher values due to inclusion of non-specific binding proteins that bind analogues.
However, current radioimmunoassay methods include only intrinsic factor as the binder which is
specific to active forms of vitamin B12. According to Suttle (2010), marginal deficiency levels of

7
vitamin B12 in bovine plasma and liver are 100 to 200 pg/ml and 450 to 700 ng/g fresh liver,
respectively. Liver cobalt concentrations of 0.04 to 0.06 mg/kg DM indicate cobalt deficiency
and 0.08 to 0.12 mg/kg DM indicate sufficient cobalt intake (Suttle, 2010). Milk vitamin B12
concentrations below 400 pg/ml signify low vitamin status (Suttle, 2010).
In ruminants, metabolic indicators of vitamin B12 deficiency such as methylmalonic acid
(MMA), homocysteine, and folates are useful measures of status. When vitamin B12 is deficient,
the conversion of methylmalonyl-CoA
to succinyl-CoA is reduced and
methylmalonyl-CoA is metabolized to
methylmalonic acid (MMA).
Methylmalonic acid in plasma is
sensitive to cobalt status as shown in
Figure 5 (Stangl et al., 2000). Normal
plasma MMA concentration are less
than 2 µmol/L, subclinical cobalt
deficiency range from 2 to 4 µmol/L,
and clinical cobalt deficiency is above
4 µmol/L (McDowell, 2000). Plasma homocysteine concentration increases in response to
cobalt deficiency (Stangl et al., 2000) due to reduced conversion of homocysteine to methionine.
Interpretation of plasma homocysteine can be difficult due to its relationship to folate,
methionine, and vitamin B12 that affect its concentration (Suttle, 2010) but cutoff values
indicating deficiency were not found in literature.
Figure 4. Plasma methylmalonic acid
concentrations of beef steers fed diets differing in
cobalt concentration (Stangl et al., 2000).
8
Cobalt and Vitamin B12 Requirements
According to the NRC (2001), the dietary cobalt requirement for dairy cattle is 0.11
mg/kg DM. This concentration maintains rumen cobalt concentration normally at 40 ng/ml
which is adequate for microbial synthesis of vitamin B12 (Miller et al., 1988) and tissue B12
vitamin levels of 0.3 µg/L (Marston, 1970). The NRC (2001) estimated a daily requirement for
vitamin B12 of 0.6 mg for lactating dairy cattle based on data from the lactating sow. Use of the
lactating sow as a model may not provide accurate estimates due to differences in metabolic uses
for vitamin B12 between cattle and swine such as the large amounts of ruminally produced
propionate being converted to succinate.
Recent studies in beef cattle suggest a higher cobalt requirement of between 0.15 and
0.25 mg/kg DM. Tiffany et al. (2003) fed beef steers diets with four levels of cobalt (0.04, 0.09,
0.14, and 1.04 mg Co/kg DM) with the basal diet being 0.04 mg Co/kg DM and using cobalt
carbonate or cobalt propionate as a supplement source to increase cobalt content. Average daily
gain and feed intake were greater for steers fed diets with supplemental cobalt. There was a
linear effect of cobalt on plasma vitamin B12 concentrations with control having the lowest
concentration and increasing vitamin B12 concentrations at each level of cobalt. However, liver
vitamin B12 concentrations were at a maximum for steers fed diets with 0.14 and 1.04 mg Co/ mg
DM with no difference between those treatments. This finding suggests that the liver has a
limited capacity for vitamin B12 storage and excess is excreted in bile or urine. Also, plasma
MMA concentrations were at a minimum with supplements of 0.14 and 1.04 mg Co/kg DM.
The authors concluded that a dietary cobalt concentration of 0.09 mg/kg DM did not allow for
9
maximal liver vitamin B12 and minimal plasma methylmalonic acid concentrations and
recommended a requirement of 0.15 mg Co/kg DM.
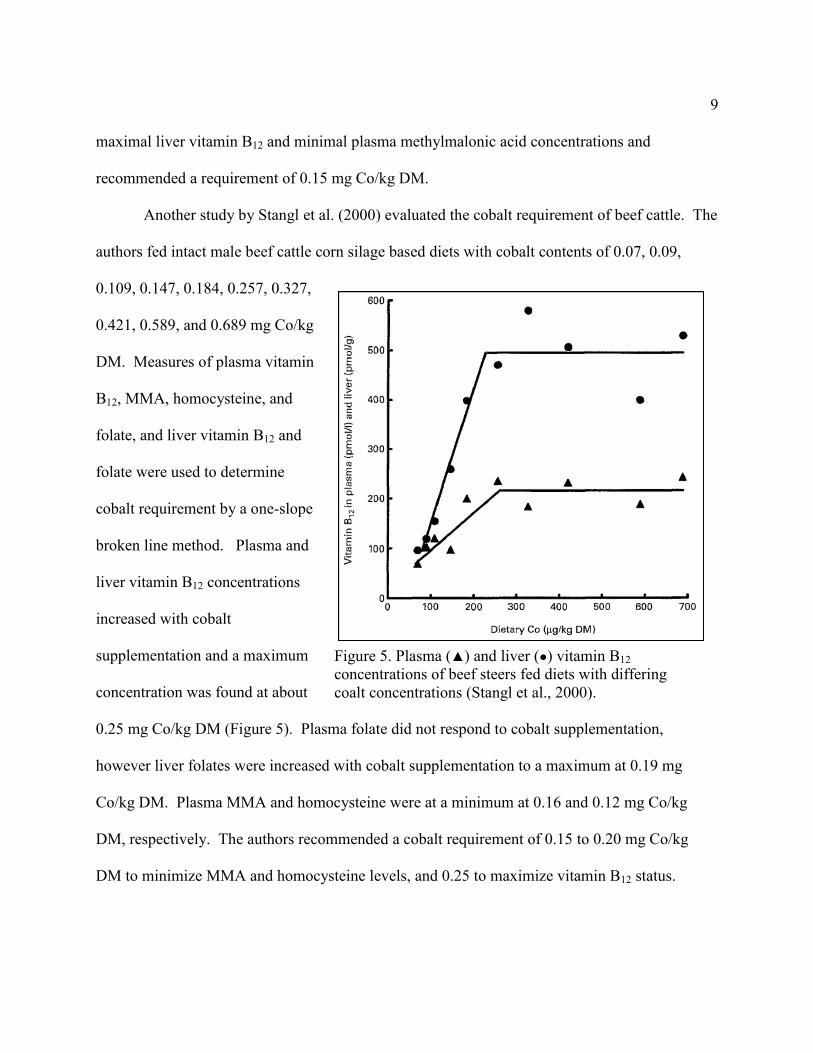
Another study by Stangl et al. (2000) evaluated the cobalt requirement of beef cattle. The
authors fed intact male beef cattle corn silage based diets with cobalt contents of 0.07, 0.09,
0.109, 0.147, 0.184, 0.257, 0.327,
0.421, 0.589, and 0.689 mg Co/kg
DM. Measures of plasma vitamin
B12, MMA, homocysteine, and
folate, and liver vitamin B12 and
folate were used to determine
cobalt requirement by a one-slope
broken line method. Plasma and
liver vitamin B12 concentrations
increased with cobalt
supplementation and a maximum
concentration was found at about
0.25 mg Co/kg DM (Figure 5). Plasma folate did not respond to cobalt supplementation,
however liver folates were increased with cobalt supplementation to a maximum at 0.19 mg
Co/kg DM. Plasma MMA and homocysteine were at a minimum at 0.16 and 0.12 mg Co/kg
DM, respectively. The authors recommended a cobalt requirement of 0.15 to 0.20 mg Co/kg
DM to minimize MMA and homocysteine levels, and 0.25 to maximize vitamin B12 status.
Figure 5. Plasma (▲) and liver (●) vitamin B12
concentrations of beef steers fed diets with differing
coalt concentrations (Stangl et al., 2000).
10
Cobalt Content of Feeds
The majority of variation in feeds is due to soil cobalt level and availability. Soil
conditions adversely affect cobalt concentrations and availability in the soil. Low soil cobalt
levels are most often observed in unfertilized well-drained soils such as volcanic pumice soils,
wind-blown sand soils, and soils derived from granite and ironstone gravels (Suttle, 2010). High
soil moisture causes the soil minerals that contain cobalt to be unstable and release cobalt into
the soil solution so forages grown on poorly drained soils have up to seven times higher cobalt
levels than if grown on well drained soils (Minson, 1990). In addition, manganese interacts with
cobalt uptake such that high soil manganese levels depresses plant uptake of cobalt (Minson,
1990).
Dietary Factors Impacting Vitamin B12 Synthesis
In nature, vitamin B12 is solely synthesized by microbes in an intricate pathway using at
least 25 different enzymes (Roth et al., 1996). Ruminants rely solely on the rumen bacteria for
vitamin B12 synthesis since their diet has little to no vitamin B12. Research has focused on the
effects of dietary cobalt content, level of intake, and nutrient composition. The earliest studies
measured fecal concentrations of vitamin B12, then ruminal concentrations of vitamin B12
followed, and apparent ruminal synthesis was the last measure of vitamin B12 synthesis.
Apparent ruminal synthesis is not true ruminal synthesis because only the amount of vitamin B12
intake and the flow of vitamin B12 to the duodenum are measured with the degradation of the
intake or microbial synthesized vitamin B12 neglected. Also, the ruminal absorption of vitamin
11
B12 is not used in the calculation but has been shown to be negligible in full fed ruminants (Rérat
et al., 1958) that are not supplemented with vitamin B12 (Girard and Rémond, 2003).
Dietary Cobalt Content
Rumen bacteria synthesize vitamin B12 if the animal’s diet contains sufficient Co.
Current dietary Co recommendation for dairy cattle is 0.11 ppm DM (NRC, 2001) which
maintains ruminal Co concentrations above 20 ng/ml and allows adequate vitamin B12 synthesis
by rumen bacteria. The impact of dietary cobalt content on ruminal vitamin B12 synthesis has
been studied extensively. Hale et al. (1950) from the University of Wisconsin investigated the
effect of supplemental cobalt on rumen synthesis of vitamin B12 using a chick assay. They fed
sheep diets either Co deficient (0.03 mg Co/d) or supplemented with Co (1.7 mg Co/d). Rumen
contents were removed and a ½ to 1 gallon sample was taken then dried. To determine the
presence or absence of vitamin B12 in the rumen digesta, the dried digesta was added at different
concentrations to diets of 1 day old chicks and growth was monitored for four weeks. As
positive and negative controls, vitamin B12 was or was not added to the diets, respectively.
Chicks fed the diets with rumen digesta from Co deficient sheep weighed less than ones fed
digesta from Co supplemented sheep. There was no difference between the chick’s growth when
fed the positive control diet or the diet with digesta from Co supplemented sheep. Also, when
vitamin B12 was added to the diet with digesta from Co deficient sheep, the chicks had similar
growth to chicks fed the positive control or diets with digesta from Co supplemented sheep. This
showed that the digesta from the Co deficient sheep lacked vitamin B12.
In 1952, Hoekstra et al. measured vitamin B12 concentrations of rumen contents from Co
deficient or supplemented (1 mg Co/d) lambs. Vitamin B12 concentrations in the rumen
12
contents were 0.09 µg/g and 1.2 µg/g DM for Co deficient and Co supplemented lambs,
respectively. In addition, blood and liver vitamin B12 concentrations were reduced for Co
deficient lambs.
During the 1970s, research moved from quantifying only concentrations in the rumen to
quantifying apparent ruminal synthesis and intestinal absorption of vitamin B12. Smith and
Marston (1970) used sheep to estimate ruminal vitamin B12 synthesis. They estimated synthesis
by multiplying the vitamin B12 to lignin ratio at 4 h after feeding by the daily intake of lignin.
Animals were fed diets of hay chaff (0.03 ppm Co and 11.1% lignin DM) with or without a
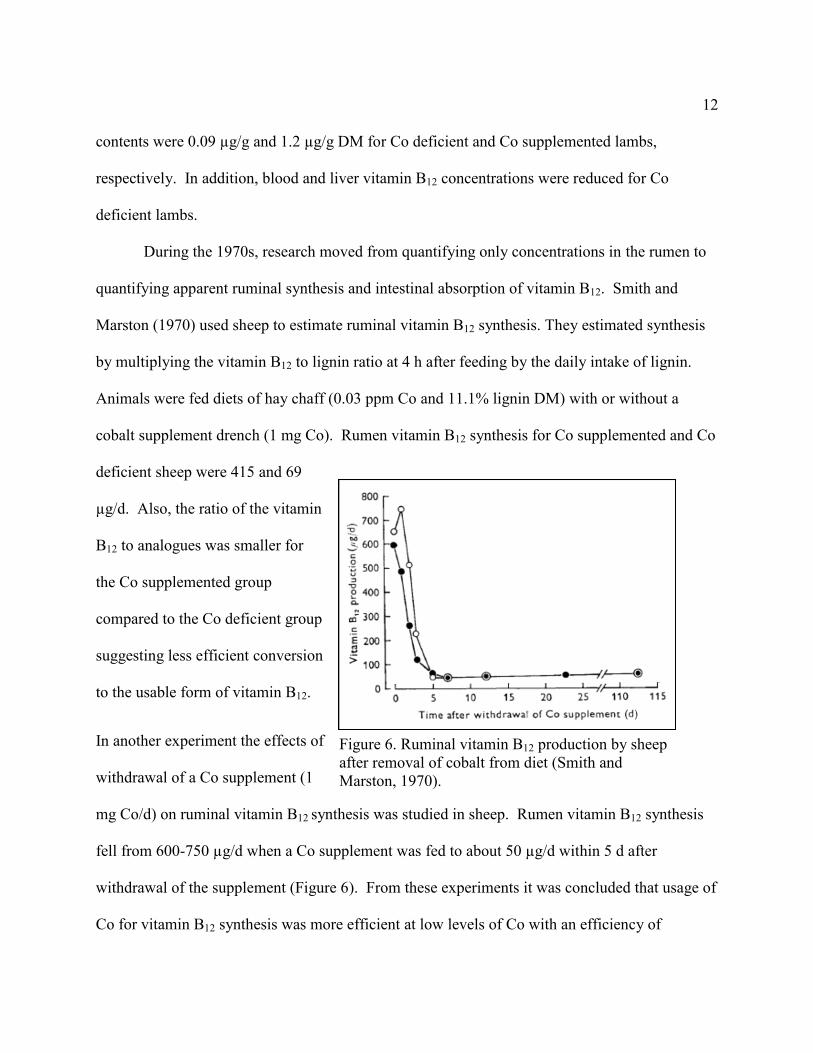
cobalt supplement drench (1 mg Co). Rumen vitamin B12 synthesis for Co supplemented and Co
deficient sheep were 415 and 69
µg/d. Also, the ratio of the vitamin
B12 to analogues was smaller for
the Co supplemented group
compared to the Co deficient group
suggesting less efficient conversion
to the usable form of vitamin B12.
In another experiment the effects of
withdrawal of a Co supplement (1
mg Co/d) on ruminal vitamin B12 synthesis was studied in sheep. Rumen vitamin B12 synthesis
fell from 600-750 µg/d when a Co supplement was fed to about 50 µg/d within 5 d after
withdrawal of the supplement (Figure 6). From these experiments it was concluded that usage of
Co for vitamin B12 synthesis was more efficient at low levels of Co with an efficiency of
Figure 6. Ruminal vitamin B12 production by sheep
after removal of cobalt from diet (Smith and
Marston, 1970).
13
conversion to vitamin B12 of 15% with no supplemental Co (0.03 mg/kg DM) and 3% with Co
supplementation of 1 mg Co/d.
Hedrich et al. (1973) used sheep to determine the influence of Co on vitamin B12
synthesis by feeding diets with three levels of Co which were 0.06, 0.50, and 1.02 mg/kg DM.
Diets of corn, timothy-alfalfa hay, and salt were ground and pelleted with Co added as CoCl2 to
the diets with 0.50 and 1.02 mg Co/kg DM. At 0.06, 0.50, and 1.02 mg Co/kg DM ruminal
vitamin B12 synthesis was 37, 1006, and 1553 µg/d, respectively. However, the authors found
that the ratio of vitamin B12 to analogues was greater for diets containing 0.50 and 1.02 mg
Co/kg DM compared to the diet with 0.06 mg Co/kg DM which contrasts the results of Smith
and Marston (1970). The difference may be explained by the different methods of analysis for
the analogues because Smith and Marston (1970) used a microbiological method and Hedrich et
al. (1973) used a radioisotope dilution method.
Stemme et al. (2008) performed the most recent study on the influence of dietary Co level
on ruminal vitamin B12 synthesis. The authors used ruminally and duodenally cannulated dairy
cows to measure flow of Co and vitamin B12 to the duodenum. The control and Co
supplemented diet contained 0.17 and 0.29 mg Co/kg DM. Flow of vitamin B12 was greater for
Co supplemented than control (3.7 mg vs 8.6 mg/d). Also, the efficiency of vitamin B12
synthesis from Co was greater for Co supplemented cows (7.1% vs 9.5% of Co used for vitamin
B12 synthesis).
In vitro fermentors have also been used to investigate the effect of Co level on vitamin
B12 synthesis. Kawashima et al. (1997) studied the effect of three cobalt levels of 0, 1, and 40
mg/kg DM and four sources of cobalt (sulfate, carbonate, glucoheptonate, and oxide) on vitamin
14
B12 and analogue concentrations using semi-continuous fermentors. The authors found a level
by source interaction for vitamin B12 such that fermentors supplemented with Co sulfate at 1
mg/kg DM had higher vitamin B12 levels than the other sources, but at 40 mg Co/kg DM the
sulfate, carbonate, and glucoheptonate had similar concentrations. Also, fermentors
supplemented with Co oxide had lower vitamin B12 concentrations than the other sources at both
1 and 40 mg Co/kg DM. The 1 mg Co/kg DM treatment had two-fold higher vitamin B12
concentrations than the 0 mg Co/kg DM treatment suggesting effectiveness as a ruminal pellet
for long term supplementation. A level by source interaction was also found for concentrations
of analogues. Concentrations of vitamin B12 analogue increased as the Co level increased for all
sources, but increased more for the sulfate form than the other three sources. Solubility of the
sources in neutral ammonium citrate explain differences in vitamin B12 concentrations with 97,
87, 44, and less than 1% solubility for sulfate, glucoheptonate, carbonate, and oxide.
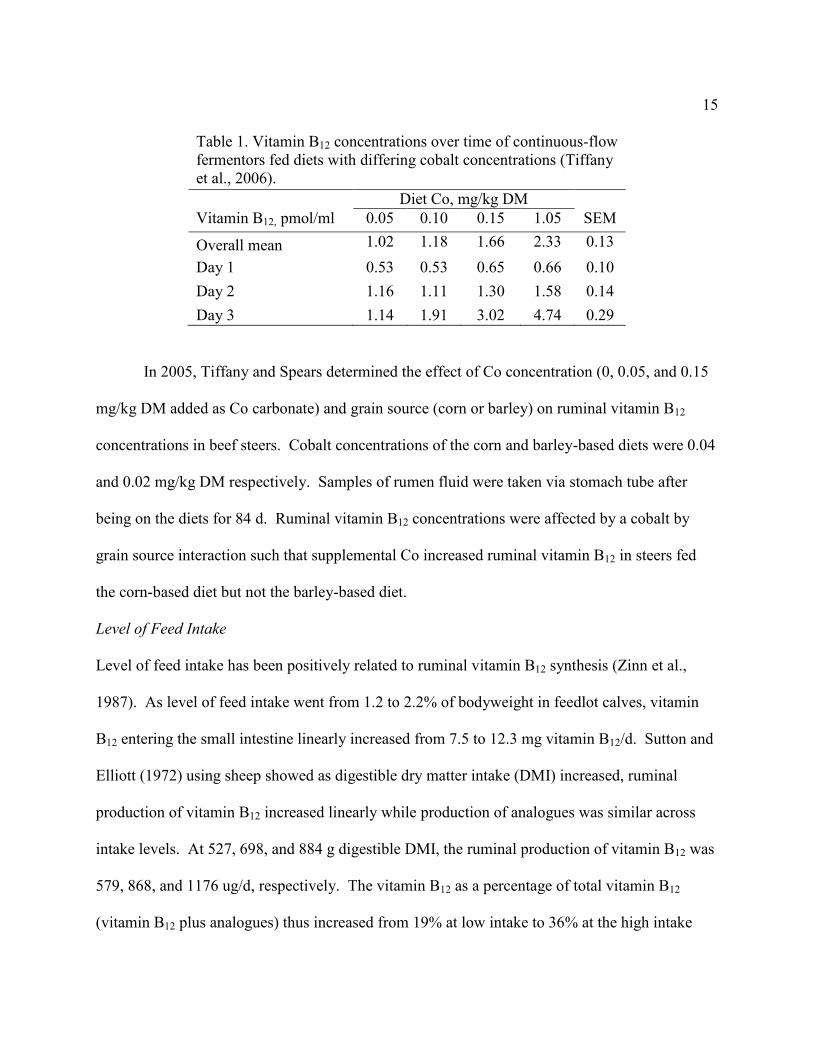
Using continuous flow-through fermentors Tiffany et al. (2006) tested the influence of
four dietary cobalt concentrations (0.05, 0.10, 0.15, and 1.05 mg Co/kg DM) on vitamin B12
concentration. The fermentors were fed a corn (80% of DM) and cottonseed hull (12% of DM)
based diet with the control having 0.05 mg Co/kg DM and the other three treatments having
0.05, 0.10, and 1.0 mg Co/kg DM added as cobalt carbonate. Samples of rumen fluid were taken
over three days after the fermentors stabilized. Cobalt supplementation did not affect vitamin
B12 on sampling day 1 or 2, however on day 3 the cobalt supplemented treatments had greater
vitamin B12 than the control (Table 1). Also, increasing Co content from 0.1 to 0.15 and from
0.15 to 1.05 mg/kg DM increased vitamin B12 concentrations on sample day 3.
15
Table 1. Vitamin B12 concentrations over time of continuous-flow
fermentors fed diets with differing cobalt concentrations (Tiffany
et al., 2006).
Diet Co, mg/kg DM
Vitamin B12, pmol/ml 0.05 0.10 0.15 1.05 SEM
Overall mean 1.02 1.18 1.66 2.33 0.13
Day 1 0.53 0.53 0.65 0.66 0.10
Day 2 1.16 1.11 1.30 1.58 0.14
Day 3 1.14 1.91 3.02 4.74 0.29
In 2005, Tiffany and Spears determined the effect of Co concentration (0, 0.05, and 0.15
mg/kg DM added as Co carbonate) and grain source (corn or barley) on ruminal vitamin B12
concentrations in beef steers. Cobalt concentrations of the corn and barley-based diets were 0.04
and 0.02 mg/kg DM respectively. Samples of rumen fluid were taken via stomach tube after
being on the diets for 84 d. Ruminal vitamin B12 concentrations were affected by a cobalt by
grain source interaction such that supplemental Co increased ruminal vitamin B12 in steers fed
the corn-based diet but not the barley-based diet.
Level of Feed Intake
Level of feed intake has been positively related to ruminal vitamin B12 synthesis (Zinn et al.,
1987). As level of feed intake went from 1.2 to 2.2% of bodyweight in feedlot calves, vitamin
B12 entering the small intestine linearly increased from 7.5 to 12.3 mg vitamin B12/d. Sutton and
Elliott (1972) using sheep showed as digestible dry matter intake (DMI) increased, ruminal
production of vitamin B12 increased linearly while production of analogues was similar across
intake levels. At 527, 698, and 884 g digestible DMI, the ruminal production of vitamin B12 was
579, 868, and 1176 ug/d, respectively. The vitamin B12 as a percentage of total vitamin B12
(vitamin B12 plus analogues) thus increased from 19% at low intake to 36% at the high intake
16
level. Schwab et al. (2006) investigated the impact of dietary forage and nonfiber carbohydrate
on B-vitamin ruminal apparent synthesis and also reported that vitamin B12 apparent synthesis
was positively associated with intake of dry matter (DM), organic matter (OM), and digestible
DM and OM.
Dietary Nutrient Composition
A majority of the studies investigated effects of forage and concentrate levels on vitamin
B12 synthesis. Teeri et al. (1955) measured fecal vitamin B12 concentrations of dairy heifers fed
either hay and oats or hay and corn. The physical form of the corn (flaked or ground) and oats
(crimped or ground) was also studied but no significant effects on fecal vitamin B12
concentrations were found so the data were averaged. The two rations did not significantly
affect fecal vitamin B12 concentrations but there was a numerical difference between the rations
containing oats (502 µg/d) or corn (665 µg/d). However, these data do not reflect ruminal
synthesis since appreciable amounts of vitamin B12 are synthesized in the lower gut.
Using beef steers Hayes et al. (1966) studied the effects of physical form and dietary
level of alfalfa hay and corn on ruminal vitamin B12 concentrations. Treatment diets were: 1)
flaked corn, 2) ground corn, 3) flaked corn and long hay, 4) ground corn and long hay, 5) flaked
corn and ground hay, and 6) ground corn and ground hay. Rumen fluid was collected via
stomach tube on day 1 and 56 of the experiment. Ruminal vitamin B12 concentrations were
higher for steers fed flaked corn, ground corn, and ground corn plus long hay than steers fed
diets containing ground hay possibly due to differences in rumen microbial populations.
Santschi et al. (2005b) studied the effect of forage to concentrate ratio on ruminal vitamin
B12 concentrations in lactating dairy cows. Two studies were done with study 1 examining the
17
effect of high forage (58% DM) or low forage (37% DM) diets on ruminal fluid vitamin B12
concentrations in primiparous and multiparous cows. No effect of forage content on vitamin B12
concentrations was found, however there was an effect of parity on proportion of total vitamin
B12 as analogues with primiparous cows having a greater percentage of analogues (72% vs 66%).
The parity effect was explained by the multiparous cows having greater DMI which decreases
the synthesis of analogues. A lack of diet effect can be explained by the small range in forage
content compared with other studies that showed an effect of forage on ruminal vitamin B12
concentrations. In study 2, multiparous cows were fed diets of high forage (60% DM) or low
forage (40% DM) and vitamin B12 concentrations in the particle-free fluid, and liquid and solid-
associated bacteria were measured. Vitamin B12 concentrations in both liquid- and solid-
associated bacteria were lower for cows fed low forage. Also, vitamin B12 was almost
exclusively found in the bacterial fractions of liquid and solid phases with 5000 times the
concentration of the particle-free fluid.
Instead of measuring concentrations of vitamin B12, Sutton and Elliot (1972) measured
apparent ruminal synthesis of vitamin B12 and analogues in sheep fed diets of roughage (timothy
hay) and concentrate (ground corn) in ratios of 100:0, 70:30, and 40:60. Intakes were adjusted
to get approximately equal digestible dry matter intakes. Cobalt was added to all diets at 0.5
mg/kg DM. Ruminal synthesis of vitamin B12 was lower for sheep fed a diet with roughage to
concentrate ratio of 40:60 (603 µg/d) than 100:0 (1195 µg/d) and 70:30 (1065 µg/d). Also, the
percentage of total vitamin B12 (vitamin B12 plus analogues) synthesis as vitamin B12 was lower
for sheep fed 40:60 (21%) forage to concentrate ratio diet than the 70:30 (29%) diet with the
100:0 (26%) diet being intermediate.
18
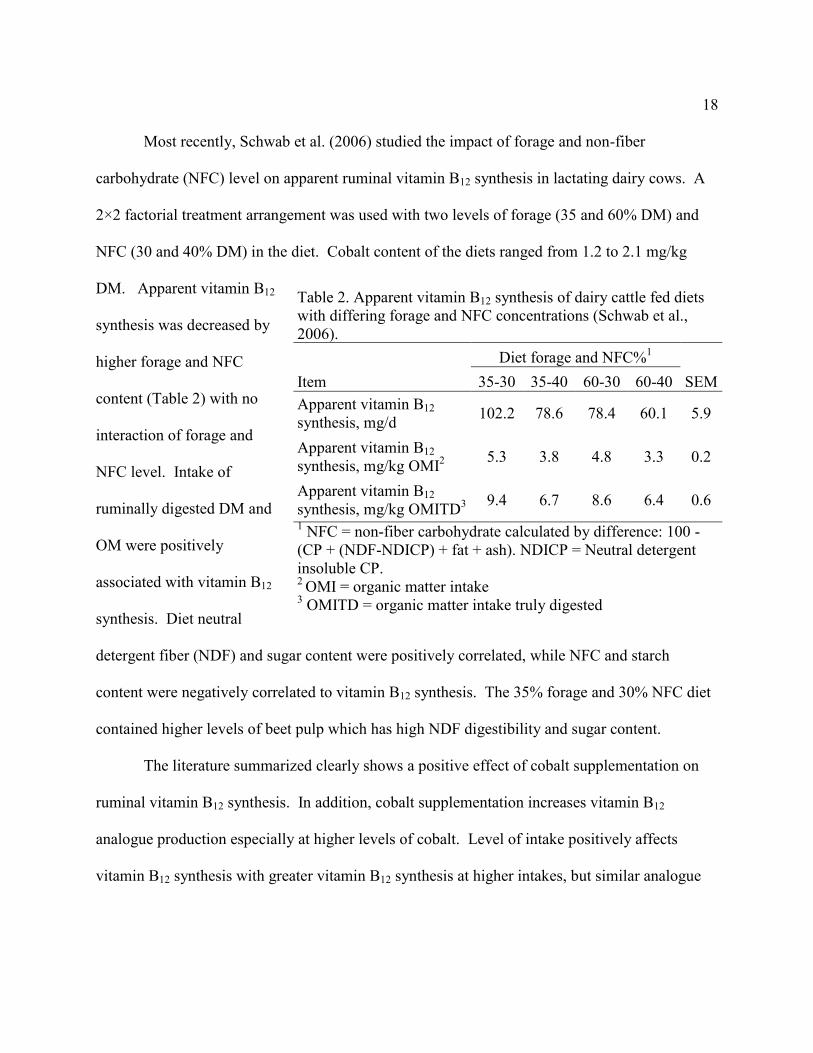
Most recently, Schwab et al. (2006) studied the impact of forage and non-fiber
carbohydrate (NFC) level on apparent ruminal vitamin B12 synthesis in lactating dairy cows. A
2×2 factorial treatment arrangement was used with two levels of forage (35 and 60% DM) and
NFC (30 and 40% DM) in the diet. Cobalt content of the diets ranged from 1.2 to 2.1 mg/kg
DM. Apparent vitamin B12
synthesis was decreased by
higher forage and NFC
content (Table 2) with no
interaction of forage and
NFC level. Intake of
ruminally digested DM and
OM were positively
associated with vitamin B12
synthesis. Diet neutral
detergent fiber (NDF) and sugar content were positively correlated, while NFC and starch
content were negatively correlated to vitamin B12 synthesis. The 35% forage and 30% NFC diet
contained higher levels of beet pulp which has high NDF digestibility and sugar content.
The literature summarized clearly shows a positive effect of cobalt supplementation on
ruminal vitamin B12 synthesis. In addition, cobalt supplementation increases vitamin B12
analogue production especially at higher levels of cobalt. Level of intake positively affects
vitamin B12 synthesis with greater vitamin B12 synthesis at higher intakes, but similar analogue
Table 2. Apparent vitamin B12 synthesis of dairy cattle fed diets
with differing forage and NFC concentrations (Schwab et al.,
2006).
Diet forage and NFC%1
Item 35-30 35-40 60-30 60-40 SEM
Apparent vitamin B12
synthesis, mg/d 102.2 78.6 78.4 60.1 5.9
Apparent vitamin B12
synthesis, mg/kg OMI2
5.3 3.8 4.8 3.3 0.2
Apparent vitamin B12
synthesis, mg/kg OMITD3
9.4 6.7 8.6 6.4 0.6
1 NFC = non-fiber carbohydrate calculated by difference: 100 -
(CP + (NDF-NDICP) + fat + ash). NDICP = Neutral detergent
insoluble CP.
2 OMI = organic matter intake
3 OMITD = organic matter intake truly digested

19
synthesis across intake levels. Diet composition also affects vitamin B12 synthesis with NDF and
sugar content positively and starch content negatively impacting vitamin B12 synthesis.
Ruminal Destruction/Conversion of Vitamin B12
When vitamin B12 is orally supplemented, rumen microbes degrade or convert vitamin
B12 to analogue forms which are not biologically usable by the host animal.
Zinn et al. (1987) determined the ruminal disappearance of vitamin B12 at two levels of
supplementation (0.2 and 2 mg/d) using ruminally and duodenally cannulated beef steers. The
authors calculated ruminal disappearance using the equation: 100 - (100 × (duodenal vitamin
flow with high supplementation – duodenal vitamin flow with no supplementation)/(vitamin
intake with high supplementation – vitamin intake with no supplementation)). Level of
supplementation did not affect passage of vitamin B12 to the duodenum and rumen escape of
vitamin B12 was estimated to be only 10%. These results may not be reliable due to the lack of
effect of vitamin supplementation on duodenal flow of vitamin B12 which would be needed to
calculate ruminal disappearance.
Santchi et al. (2005a) studied the ruminal disappearance of supplemental vitamin B12 (
500 mg/d) using ruminally and duodenally cannulated dairy cows. Supplementation of 500 mg
vitamin B12 increased flow to the duodenum compared to control. The ruminal disappearance of
vitamin B12 when given a 500 mg dose was 63% which is less than Zinn et al. (1987) found but
differences in methodology such as vitamin B12 analysis could explain these differences. Zinn et
al. (1987) used a microbiological assay and Santschi et al. (2005a) used radioimmunoassay for
vitamin B12.

20
Girard et al. (2009b) determined the ruminal synthesis of vitamin B12 and its analogues
in dairy cattle. During the control period, a diet with no supplemental vitamin B12 was fed. This
diet did contain 2.5 mg Co/kg DM. Following the control period, the diet was supplemented
with cobalt (2.5 mg/kg DM) and 500 mg vitamin B12/d. The ration contained 58% forage and
44% NFC. Total mixed ration (TMR), duodenal and ileal digesta samples were taken and
analyzed for vitamin B12 and 12 of its analogues. The TMR only contained vitamin B12 and
cobamide (a corrin ring without the base, ribose, and phosphate groups), while vitamin B12 and 7
analogues were detected in duodenal and ileal samples of both unsupplemented and
supplemented cows. The unsupplemented cows ruminally synthesized 50 mg vitamin B12/d
which is similar to data from Schwab et al.(2006) when the cows fed diets with 60% forage and
40% NFC had ruminal vitamin B12 synthesis of 60 mg/d. When supplemented with vitamin B12,
the ruminal destruction or conversion of the 500 mg vitamin B12 dose was 348 mg or about 80%
which is similar to the values that Zinn et al. (1987) found. Much of the vitamin B12 was
converted to cobamide, which was the only analogue to increase with vitamin B12
supplementation. Cobamide flow to the duodenum increased from 1.9 mg/d on the
unsupplemented diet to 185 mg/d when vitamin B12 was supplemented.
In another study, Girard et al. (2009a) investigated the changes in proportions of vitamin
B12 and analogues in the gastrointestinal tract of dairy cattle. Two trials were done with the first
determining the effect of different modes of conservation of timothy (harvested either as hay, or
silage inoculated with Lactobacillus plantarium LPH-1 and Pediococcus cerevisiae PCH-3 or
ensiled with formic acid) and the second determining the effect of metabolizable protein (1423 or
1957 g/d). Samples of rumen fluid, duodenal digesta, and feces were analyzed for vitamin B12

21
and 12 analogues. Ileal samples were also taken for the second study. Mode of conservation did
affect proportion of analogues, but a higher level of metabolizable protein increased the
proportion of analogues in duodenal digesta. There was an effect of sampling site on proportion
of analogues with the rumen fluid, duodenal digesta, ileal digesta and feces having 90, 60, and
90% analogues, respectively. The authors explained that the differences between rumen fluid
and duodenal digesta were due to the method of sampling with rumen fluid rather than whole
rumen contents. Particle-free rumen fluid is practically devoid of vitamin B12 and analogues
(Santschi et al., 2005b) with the liquid and solid-associated bacteria containing the vitamin B12
and analogues. The rumen fluid samples would have less vitamin B12 due to the lack of solid-
associated bacteria which make up 70-80% of microbial mass (Craig et al, 1987), while duodenal
digesta is a summation of vitamin B12 and analogues from undigested feed, liquid and solid-
associated bacteria leaving the rumen and would have greater concentrations of vitamin B12.
However, the data from Santschi et al. (2005b) do not support this theory since the liquid-
associated bacteria actually contained lower proportions of analogues (76 vs. 80%) than did
solid-associated bacteria. Another possible explanation for this decrease in analogue proportion
from the rumen to the duodenum may be digestion of the analogues which are not protected from
digestion by binding to intrinsic factor in the abomasum. The analogue OHBZA; a cobamide
with the substitution of 5, 6-dimethyl benzimidazole group by 5-OH-benzimidazole, increased in
concentration from the rumen fluid to the duodenal digesta possibly due to binding by intrinsic
factor. Also, OHBZA was the only analogue to decrease in concentrations from the duodenum
to the ileum which also suggests binding by intrinsic factor. Girard et al. (2009b) found that
OHBZA was the only analogue to have a positive intestinal disappearance. Intrinsic factor only

22
binds vitamin B12 and cobamides that contain benzimidazole (Schneider and Stroiński, 1987),
which may explain why vitamin B12 and OHBZA concentrations increased from the rumen fluid
to the duodenal digesta and decreased from the duodenal to ileal digesta samples.
Vitamin B12 Absorption
Absorption of vitamin B12 is well defined in monogastrics, however little information
about vitamin B12 absorption in ruminants is published. Due to its highly polar nature, vitamin
B12 is absorbed via a receptor-mediated process in which protein-bound or microbial sequestered
vitamin B12 is released in the glandular stomach under acidic and proteolytic conditions
(Seetharam, 1999). Vitamin B12 is then rapidly bound by high-affinity R-proteins present in
gastric juices forming a stable complex at an acid pH. After passing to the small intestine, R-
proteins are digested by pancreatic enzymes which releases vitamin B12 which is rapidly bound
to another high-affinity protein called intrinsic factor (IF) to form an IF:vitamin B12 complex.
Intrinsic factor is released from the parietal cells lining the glandular stomach and only has
affinity for vitamin B12 and analogues containing benzimidazole (Schneider and Stroiński, 1988).
This complex flows to the ileum where it binds to an ileal epithelial cell IF-receptor and is
absorbed by endocytosis (Seetharam, 1999). The terminal ileum is considered the major site of
vitamin B12 absorption (Girard and Rémond, 2003). Inside the intestinal epithelial cell, the
IF:vitamin B12 complex is processed by an endosomal lysosomal-pathway by an acidic pH and
proteolysis of the IF which releases vitamin B12 (Seetharam, 1999). Once released from IF,
vitamin B12 is bound by another high-affinity plasma transport protein called transcobalamin-II

23
(TC-II) in a TC-II:vitamin B12 complex. This complex is exported from the intestinal epithelial
cell and enters the bloodstream and is taken up by TC-II receptors of tissues.
At high doses of oral vitamin B12, passive diffusion has been demonstrated in dairy cattle.
Girard et al. (2001) observed a biphasic pattern of absorption when dairy cows were orally
supplemented with 500 mg vitamin B12. After supplementation, the authors measured net portal
flux of vitamin B12 over 24 h. They observed an increase in net flux from 4 to 10 h after
supplementation, a decrease from 10 to 20 h, and another increased in net flux from 20 to 24 h
after supplementation. The initial increase was attributed to absorption via passive diffusion,
while the second increase in net flux was the active transport using IF and TC-II. The absorption
efficiency of the 500 mg dose of vitamin B12 was calculated to be only 0.27%.
Ruminal Absorption
A few studies have determined ruminal absorption of vitamin B12 under certain
conditions. In emptied rumen sheep, Rerat et al. (1958) demonstrated ruminal absorption of
vitamin B12 but not in full fed sheep. In 2001, Girard et al. used dairy cattle to show that vitamin
B12 is ruminally absorbed when given ruminally infused vitamin B12. The authors used
ruminally cannulated dairy cattle with ultrasound flow probes around the right ruminal artery and
catheters placed in the right ruminal vein and auricular artery to measure net flux of vitamin B12
from the rumen. Feed was removed 6 h before a dose of 7.8 g of vitamin B12 was infused into
the rumen. There was no net flux of vitamin B12 across the rumen wall before infusion, but net
flux increased with infusion. A total of 165 ng of vitamin B12 were released from the rumen into
the portal circulation from the portion of the rumen wall drained by the right ruminal artery. The
24
authors calculated an absorption efficiency of 4 x 10⁻⁶
if both the right and left ruminal artery had
similar flows.
Intestinal Absorption
There are a number of studies on vitamin B12 absorption. Smith and Marston (1970)
estimated the absorption of a 1 mg oral dose of vitamin B12 to be between 1 and 3% of the dose,
but on a cobalt-deficient diet the absorption was 5%. The authors measured absorption
efficiencies by extrapolation from liver vitamin B12 storage of sheep given graded doses of
injected vitamin B12. This method may not accurately measure absorption since it is not a direct
measure of absorption. A more accurate method has been developed to measure vitamin B12
absorption that involves measuring the intestinal disappearance between the duodenum and
ileum using cannulated animals. Zinn and Owens (1987) using duodenally and ileally
cannulated beef steers reported a vitamin B12 intestinal disappearance of 48%, however the
microbiological assay using Lactobacillus leichmanii is not specific to vitamin B12 and also
measures analogues. Schwab (2005) calculated the disappearance efficiency to be 15% by using
data from Smith and Marston (1970) that indicated the Ochramonas microbiological assay;
which is specific for vitamin B12, estimates of vitamin B12 activity were 32% of the Lactobacillus
leichmanii assay. The calculated value of 15% was similar to Santschi et al. (2005a), who found
an intestinal disappearance of 11% for unsupplemented cows and 15% for supplemented cows.
Girard et al. (2009b) found higher intestinal disappearances with values of 45% for
unsupplemented cows and 25% for cows supplemented with 500 mg vitamin B12/d. In addition,
the authors found that OHBZA, an analogue containing benzimidazole, had a positive intestinal
disappearance. The authors determined vitamin B12 and analogues using liquid chromatography
25
mass spectrometry. There are obvious differences in intestinal disappearance efficiency between
studies with a range of 11 to 48% in cattle and are possibly due to differences in methodology
used.
Vitamin B12 Transport
Once vitamin B12 enters the portal blood it is bound to transport proteins called
transcobalamins (TC). There are three transcobalamins: TC-I, TC-II, and TC-III.
Transcobalamin-I is involved in the storage, while TC-II is primarily a transporter of vitamin B12
in the blood from the intestines to the tissues (McDowell, 2000). The TC-II:vitamin B12
complex is absorbed from the blood via receptor-mediated endocytosis of the complex.
Transcobalamin-III is needed for returning vitamin B12 from peripheral tissues to the liver for
secretion in bile. Also, TC-III has affinity for analogue forms of vitamin B12 which may
passively diffuse from the gastrointestinal tract into the blood (McDowell, 2000) which are also
excreted in the bile. Vitamin B12 secreted in bile has the potential for reabsorption into the
ileum.
Interaction of Vitamin B12 and Folate
Folate is needed for two critical functions: synthesis of nucleotides and methylation.
Tetrahydrofolate is converted to 5,10-methylene-THF or 10-formyl-THF which are both
necessary for nucleotide synthesis. Folate as 5-methyl THF donates a methyl group to
homocysteine to regenerate methionine and subsequent conversion of S-adenosylmethionine
which is the major methyl donor. This reaction requires the vitamin B12 dependent enzyme

26
methionine synthase and when cows are have suboptimal vitamin B12 status this reaction is
compromised (Girard and
Matte, 2005a). Interactions
between folate, methionine,
and vitamin B12 status have
been observed in dairy
cattle. It is thought that
supplementation with
methionine may decrease
requirements for folate and
vitamin B12 because it supplied preformed methyl groups that do not need to be provided by the
methionine synthase reaction. When dietary supplemental folic acid was fed to cows, a lactation
response was observed in multiparous cows but not primiparous cows (Girard and Matte,
1998,1999). Primiparous cows had lower serum vitamin B12 than multiparous cows; especially
during the first 8 wk of lactation (Figure 5), which may explain the lack of response to folate
supplementation (Girard and Matte, 1999). In contrast, Graulet et al. (2007) fed lactating dairy
cows a low methionine diet supplemented with either no vitamin supplements, folic acid, vitamin
B12, or both vitamins, found a positive lactation response only for cows fed dietary supplements
of folic acid, even with plasma vitamin B12 levels below 200 pg/ml. Vitamin B12
supplementation alone did not improve milk yield or components.
Preynat et al. (2009) determined if supplemental folic acid improved lactation
performance due to improved methyl group status and if supplemental vitamin B12 affected its
Primiparous -●-
Multiparous -□-
Figure 7. Serum vitamin B12 of primiparous and multiparous
cows over time (Girard and Matte, 1999)
27
response. Prepartum dairy cows were either fed diets with or without rumen-protected
methionine. Within methionine supplementation level, cows were either given no vitamin
injections, weekly folic acid injections alone, or weekly folic acid and vitamin B12 injections.
Rumen-protected methionine did not affect milk yield but increased milk protein content. Folic
acid injections alone did not improve lactation performance. Milk yield tended to increase when
folic acid and vitamin B12 were both given, especially during the first four weeks of lactation.
The authors concluded that the effect of folic acid and vitamin B12 supplementation was not due
to improve methyl group supply because rumen-protected methionine did not alter
responsiveness to vitamin supplementation. Unfortunately, it is not possible to conclude whether
the effects of the vitamins were from the combination of both vitamins or vitamin B12 alone. A
definite understanding of the interaction of folate and vitamin B12 has not been determined as
shown by varying results across studies.
Effects of Supplemental Cobalt in Dairy Cattle
There are few studies on the impact of cobalt supplementation of dairy cattle
performance. Most recently, Kincaid and Socha (2007) evaluated three concentrations of dietary
cobalt in pre and postpartum dairy cows. The cobalt concentrations of low, medium, and high
treatments were 0.15, 0.89, and 1.71 mg/kg DM for prepartum cows and 0.19, 0.57, and 0.93
mg/kg DM for postpartum cows, respectively. The low cobalt diet did not contain supplemental
cobalt. Cobalt level did not affect feed intake or lactation performance. Liver and serum
concentrations of cobalt and vitamin B12 were not affected by cobalt supplementation. However,
the concentration of cobalt was increased in milk for medium and high cobalt treatments
28
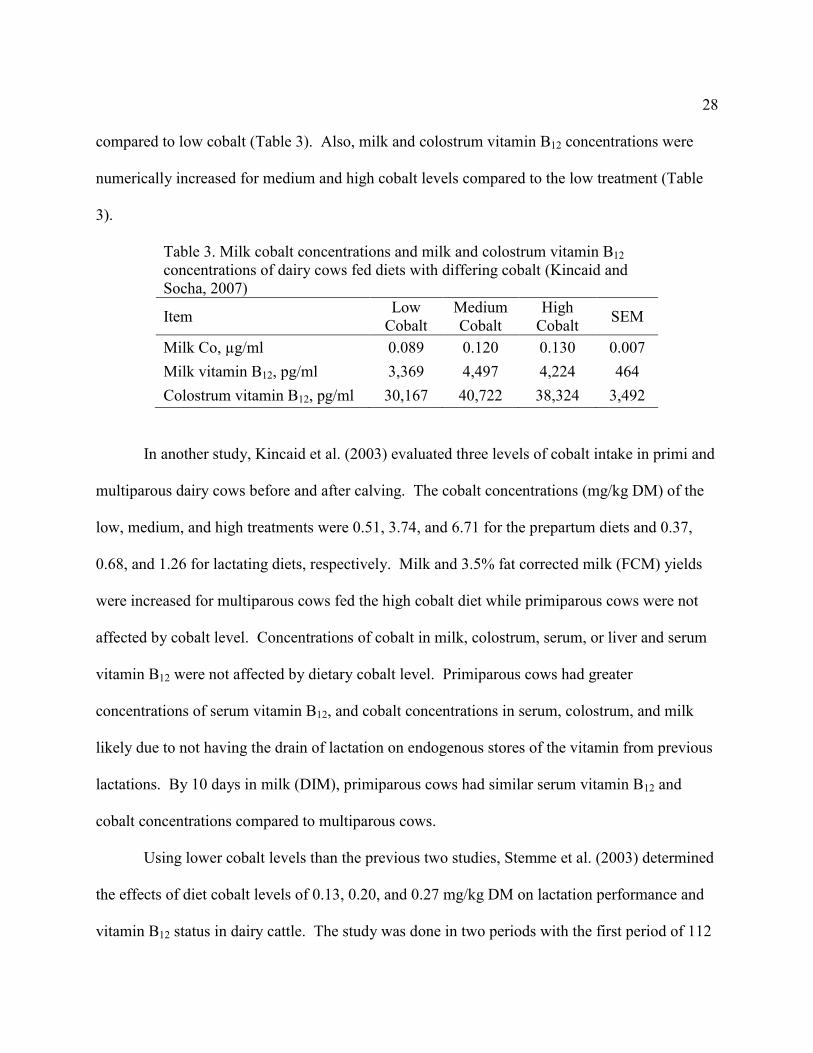
compared to low cobalt (Table 3). Also, milk and colostrum vitamin B12 concentrations were
numerically increased for medium and high cobalt levels compared to the low treatment (Table
3).
Table 3. Milk cobalt concentrations and milk and colostrum vitamin B12
concentrations of dairy cows fed diets with differing cobalt (Kincaid and
Socha, 2007)
Item Low
Cobalt
Medium
Cobalt
High
Cobalt SEM
Milk Co, µg/ml 0.089 0.120 0.130 0.007
Milk vitamin B12, pg/ml 3,369 4,497 4,224 464
Colostrum vitamin B12, pg/ml 30,167 40,722 38,324 3,492
In another study, Kincaid et al. (2003) evaluated three levels of cobalt intake in primi and
multiparous dairy cows before and after calving. The cobalt concentrations (mg/kg DM) of the
low, medium, and high treatments were 0.51, 3.74, and 6.71 for the prepartum diets and 0.37,
0.68, and 1.26 for lactating diets, respectively. Milk and 3.5% fat corrected milk (FCM) yields
were increased for multiparous cows fed the high cobalt diet while primiparous cows were not
affected by cobalt level. Concentrations of cobalt in milk, colostrum, serum, or liver and serum
vitamin B12 were not affected by dietary cobalt level. Primiparous cows had greater
concentrations of serum vitamin B12, and cobalt concentrations in serum, colostrum, and milk
likely due to not having the drain of lactation on endogenous stores of the vitamin from previous
lactations. By 10 days in milk (DIM), primiparous cows had similar serum vitamin B12 and
cobalt concentrations compared to multiparous cows.
Using lower cobalt levels than the previous two studies, Stemme et al. (2003) determined
the effects of diet cobalt levels of 0.13, 0.20, and 0.27 mg/kg DM on lactation performance and
vitamin B12 status in dairy cattle. The study was done in two periods with the first period of 112
29
d all the treatments were represented. After the first period was complete, the cows on the 0.13
and 0.27 mg Co/kg DM treatments were kept on their respective diets until calving. No effect of
cobalt was found for any lactation performance parameters or serum vitamin B12 concentration.
Liver vitamin B12 tended to be higher at d 100 and 200 of the experiment and was greater at
calving for cows fed 0.27 mg Co/kg DM compared to 0.13 mg Co/kg DM (Table 4). Serum
vitamin B12 increased as lactation progressed in the 0.13 and 0.27 mg Co/kg DM treatments. A
similar observation was also seen by Girard et al. (1999) with early lactation dairy cows having
low serum vitamin B12 from 4 to 12 wks into lactation but increased to a plateau by about 20 wks
into lactation. Supplemental dietary cobalt has varied effects on lactation performance, but
consistently improved different measures of vitamin B12 status.
Effects of Supplemental Vitamin B12 in Dairy Cattle
Research in the 1970s that focused on the relationship between vitamin B12 and milk fat
depression used vitamin B12 injections to improve status. The theory proposed by Frobish and
Davis (1977) indicated that vitamin B12 deficiency and high grain diets caused milk fat
depression. This was due to the increase in rumen propionate in cows on high grain and low
forage diets which also reduced production of vitamin B12. The propionate is converted to
methylmalonate, which during vitamin B12 deficiency is not efficiently converted to succinate.
Excess methylmalonate would then be incorporated into milk fatty acids which decreases milkfat
synthesis. This theory was tested in a number of trials involving giving vitamin B12
supplementation to cows that had milkfat depression. Frobish and Davis (1977) fed dairy cattle
diets with 2.3 kg alfalfa hay and 18 to 21 kg of concentrate (primarily ground corn (84%) and

30
soybean meal (13%)) until the cows produced milk with 35 to 50% lower milk fat content than
before the high concentrate diet was fed. The authors then gave treatments of cyanocobalamin
(diet and injections), cyanocobalamin plus folic acid, B complex vitamins, adenosylcobalamin,
and hydroxocobalamin. No milk fat responses were found except to large doses (50-150 mg) of
injected hydroxocobalamin. Milk fat percentage returned to about 85 to 90% of the normal milk
fat percentage with hydroxocobalamin injections.
Elliot et al. (1979) also tested the theory that vitamin B12 deficiency was involved with
milk fat depression. The authors injected 22 dairy cows twice weekly with either saline (10
cows) or 10 mg vitamin B12 (12 cows) from 4 wk prepartum to 8 wk postpartum. The cows were
fed a lactation diet of 80% concentrate, 10% haylage, and 10% corn silage on a DM basis. Milk
production data were taken until 15 wk postpartum. Milk fat percent was depressed to 2.76%.
Injections of vitamin B12 did not affect milk fat percent, however milk yield was non-
significantly higher for cows given vitamin B12 (30.0 kg/d) than saline (26.2 kg/d).
Croom et al. (1981) again tested the milk fat depression theory using 30 dairy cows.
From parturition to 28 DIM, cows were fed a normal fiber diet consisting of ad libitum alfalfa-
grass hay plus 1 kg of concentrate for every 3 kg of milk production. The cows were then fed a
low fiber diet (3.2 kg alfalfa-grass hay and 15 kg of concentrate) for a 28 d adjustment period.
The cows were then assigned to a treatment of vitamin B12 injections (150 mg
hydroxocobalamin) or no treatment in a reversal trial of 2 twenty-one day periods. Vitamin B12
injections were given on d 1, 7, and 14 of the period. Vitamin B12 did not affect milk yield, milk
fat percent, or milk fat yield as seen by Frobish and Davis (1977).
31
Previous studies showed that cows with low vitamin B12 status were not responsive to
folate supplementation. Girard and Matte (2005b), found no effect of folic acid or rumen-
protected methionine supplementation on milk yield, but observed an increase in milk protein
content when folic acid was fed without methionine and a decrease when folic acid was fed with
methionine. The authors concluded the lack of response in milk yield to folic acid
supplementation was likely due to low vitamin B12 status during early lactation. To determine if
low vitamin B12 status affected responsiveness to folic acid, Girard and Matte (2005a) fed early
lactation (3 wk postpartum) primiparous dairy cows a diet supplemented with both folic acid and
methionine. The cows were injected weekly with either saline or 10 mg vitamin B12.
Supplemental vitamin B12 increased energy-corrected milk yield by 3.2 kg/d compared to
control. Serum vitamin B12 levels increased progressively (350 to 500 pg vitamin B12/ml)
through the study for vitamin B12 supplemented cows while controls did not change. In addition,
serum methylmalonic acid concentration was decreased for vitamin B12 injected cows likely due
to an increase in the enzyme methylmalonyl-CoA mutase, which further supports suboptimal
vitamin B12 status during early lactation.
Summary and Objectives of Thesis Research
Cobalt supplementation has increased ruminal and in vitro synthesis of vitamin B12.
Research in beef cattle has shown a maximum vitamin B12 status when dietary cobalt
concentration are at 0.25 mg/kg DM. Dairy cows supplemented with cobalt above requirement
have had improved vitamin B12 status and lactation performance, but results have been
inconsistent. Injections of vitamin B12 has improved energy corrected milk production. In
addition, dairy cows have a reduced vitamin B12 status during early lactation due to increased
32
demands of lactation. Limited research has been performed in dairy cattle to determine the effect
of cobalt form on vitamin B12 status and lactation performance. Also, previous research on
cobalt supplementation has not used vitamin B12 injections as a positive control to compare the
cobalt supplement treatments with. The objective of this thesis research is to determine if cobalt
supplementation from inorganic or organic sources above NRC (2001) requirements or
intramuscular injections of vitamin B12 influences vitamin B12 status and lactation performance
of lactating primiparous and multiparous dairy cows.
33
REFERENCES
Becker, R.B., J.R. Henderson, and R.B. Leighty. 1965. Florida Univ. Agric. Exp. Stn. Tech.
Bull., 699.
Craig W.M., G.A. Broderick, and D.B. Ricker. 1987. Quantitation of microorganisms associated
with the particulate phase of ruminal ingesta. J. Nutr. 117:56–62.
Croom, W.J., A.H. Rakes, A.C. Linnerud, G.A. Ducharme, and J.M. Elliot. 1981. Vitamin B12
administration for milk fat synthesis in lactating dairy cows fed a low fiber diet. J. Dairy Sci.
64:1555-1560.
Eijkman, C. 1890-1896. Polyneuritis in Chickens, or the Origin of Vitamin Research. Hoffman-
la Roche, Basel, Switzerland.
Elliot, J.M., E.P. Barton, and J.A. Williams. 1979. Milk fat as related to vitamin B12 status. J.
Dairy Sci. 62:642-645.
Frobish, R.A. and C.L. Davis. 1977. Theory involving propionate and vitamin B12 in the low-
milk fat syndrome. J. Dairy Sci. 60:268-273
Funk, C. 1911. On the chemical nature of the substance which cures polyneuritis in birds induced
by a diet of polished rice. J. Physiol. 43:395-400.
34
Girard, C.L. and J.J. Matte. 1998. Dietary supplements of folic acid during lactation: effects on
performance of dairy cows. J. Dairy Sci. 81:1412-1419.
Girard, C.L. and J.J. Matte. 1999. Changes in serum concentrations of folates, pyridoxal,
pyridoxal-5-phosphate and vitamin B12 during lactation of dairy cows fed dietary supplements of
folic acid. Can. J. Anim. Sci. 79: 107–113.
Girard, C.L., H. Lapierre, A. Desroches, C. Benchar, J.J. Matte, and D. Rémond. 2001. Net flux
of folates and vitamin B12 through the gastrointestinal tract and the liver of lactating dairy cows.
Br. J. Nutr. 86:707-715.
Girard, C.L. and D. Rémond. 2002. Net flux of folates and vitamin B12 through the
gastrointestinal tract of sheep. Can. J. Anim. Sci. 83:273-278.
Girard, C.L. and J.J. Matte. 2005a. Effects of intramuscular injections of vitamin B12 on lactation
performance of dairy cows fed dietary supplements of folic acid and rumen-protected
methionine. J. Dairy Sci. 88:671-676.
Girard, C.L., H. Lapierre, J.J. Matte, and G.E. Lobley. 2005b. Effects of dietary supplements of
folic acid and rumen-protected methionine on lactational performance and folate metabolism of
dairy cows. J. Dairy Sci. 88:660–670.
35
Girard, C.L., R. Berthiaume, S.P. Stabler, and R.H. Allen. 2009a. Identification of cobalamin and
cobalamin analogues along the gastrointestinal tract of dairy cows. Arch. Anim. Nutr. 63:379-
388.
Girard, C.L., D.E. Santschi, S.P. Stabler, and R.H. Allen. 2009b. Apparent ruminal synthesis and
intestinal disappearance of vitamin B12 and its analogs in dairy cows. J. Dairy Sci. 92:4524-4529.
Graulet, B., J.J. Matte, A. Desroches, L. Doepel, M.F. Palin, and C.L. Girard. 2007. Effects of
dietary supplements of folic acid and vitamin B12 on metabolism of dairy cows in early lactation.
J. Dairy Sci. 90:3442-3455.
Hale, W.H., A.L. Pope, P.H. Phillips, and G. Bohstedt. 1950. The effect of cobalt on the
synthesis of vitamin B12 in the rumen of sheep. J. Anim. Sci. 9:414-419.
Hayes, B.W., G.E. Mitchell, C.O. Little, and N.W. Bradley. 1966. Concentrations of B-vitamins
in ruminal fluid of steers fed different levels and physical forms of hay and grain. J. Anim. Sci.
25:539-542.
Hedrich, M.F., J.M. Elliot, and J.E. Lowe. 1973. Response in vitamin B-12 production and
absorption to increasing cobalt intake in the sheep. J. Nutr. 103:1646-1651.
36
Hodgkin, D.C., J. Kamper, M. Mackay, J. Pickworth, K.N. Trueblood, and J.G. White. 1956.
Structure of Vitamin B12. Nature. 178:64-66.
Hoekstra, W.G., A.L. Pope, and P.H. Phillips. 1952. Synthesis of certain B-vitamins in the cobalt
deficient sheep, with special reference to vitamin B12. J. Nutr. 48:421-430.
Kawashima, T., P.R. Henry, D.G. Bates, C.B. Ammerman, R.C. Littell, and J. Price. 1997.
Bioavailability of cobalt sources for ruminants. 3. In vitro ruminal production of vitamin B12 and
total corrinoids in response to different cobalt sources and concentrations. Nutr. Res. 17:975-987.
Kincaid, R.L., L.E. Lefebvre, J.D. Cronrath, M.T. Socha, and A.B. Johnson. 2003. Effect of
dietary cobalt supplementation on cobalt metabolism and performance of dairy cattle. J. Dairy
Sci. 86:1405-1411.
Kincaid, R.L. and M.T. Socha. 2007. Effect of cobalt supplementation during late gestation and
early lactation on milk and serum measures. J. Dairy Sci. 90:1880-1886.
McDowell, L. R. 2000. Vitamins in Animal and Human Nutrition 2nd
ed. Iowa State University
Press, Ames, IA..
37
Miller, J.K., N. Ramsey, and F.C. Madsen. 1988. The Trace Elements P. 342-347 in The
Ruminant Animal: Digestive Physiology and Nutrition. D.C. Church ed., Prentice Hall,
Englewood Cliffs, NJ.
Minson, D.J. 1990. Forage in Ruminant Nutrtion. Academic Press, Inc., San Diego, CA.
NRC. 2001. Nutrient Requirements of Dairy Cattle. 7th Revised ed. National Academy Press,
Washington, D.C.
Preynat, A., H. Lapierre, M.C. Thivierge, M.F. Palin, J.J. Matte, A. Desroches, and C.L. Girard.
2009. Influence of methionine supply on the response of lactational performance of dairy cows
to supplementary folic acid and vitamin B12. J. Dairy Sci. 92:1685-1695.
Rérat, A., H. Le Bars, and J. Molle. 1958a. Utilisation d’une méthode de perfusion pour la mise
en évidence de l’absorption des vitamins B chez le mouton normalement alimenté. C. R. Acad.
Sci. (Paris) 246:1920–1922.
Rickes, E.L., N.G. Brink, F.R. Koniuszy, T.R. Wood, and K. Folkers. 1948. Crystalline Vitamin
B12. Science. 107:396-397.
Roth, J.R., J.G. Lawrence, and T.A. Bobik. 1996. Cobalamin(Coenzyme B12): Synthesis and
Biological Significance. Annu. Rev. Microbiol. 50:137-181.
38
Santschi, D.E., R. Berthiaume, J.J. Matte, A.F. Mustafa, and C.L. Girard. 2005a. Fate of
supplementary B-vitamins in the gastrointestinal tract of dairy cows. J. Dairy Sci. 88:2043–2054
Santschi, D.E., J. Chiquette, R. Berthiaume, R. Martineau, J.J. Matte, A.F. Mustafa, and C.L.
Girard. 2005b. Effects of the forage to concentrate ratio on B-vitamin concentrations in different
ruminal fractions of dairy cows. Can. J. Anim. Sci. 85:
389–399
Schneider, Z., and A. Stroiński. 1987. Comprehensive B12. Chemistry, Biochemistry, Nutrition,
Ecology, Medicine. Walter de Gruyter, Berlin, Germany.
Schwab, E.C. 2005. B-Vitamin Nutrition of Dairy Cows. PhD Thesis. University of Wisconsin.
Madison.
Schwab, E.C., C.G. Schwab, R.D. Shaver, C.L. Girard, D.E. Putnam, and N.L Whitehouse. 2006.
Dietary forage and nonfiber carbohydrate contents influence B-vitamin intake, duodenal flow,
and apparent ruminal synthesis in lactating dairy cows. J. Dairy Sci. 89:174-187.
Seetharam, B. 1999. Receptor-mediated endocytosis of cobalamin (Vitamin B12). Ann. Rev.
Nutr. 19:173-195.

39
Smith, S.E., A. Koch, B.A., and K. L. Turk. 1951. Cobalt deficiency and vitamin B12. J. Nutr.
44:455.
Smith, R.M. and H.R. Marston. 1970. Production, absorption, distribution and excretion of
vitamin B12 in sheep. Br. J. Nutr. 24:857-877.
Smith, E.L. and L.F.J. Parker. 1948. Purification of Anti-pernicious Anaemia Factor. Proc.
Biochem. Soc. 43:viii.
Stangl, G.I., F.J. Schwarz, H. Müller, and M. Kirchgessner. 2000. Evaluation of the cobalt
requirement of beef cattle based on vitamin B12, folate, homocysteine, and methylmalonic acid.
Brit. J. Nutr. 84:645-653.
Stemme, K., U. Meyer, P. Lebzien, G. Flachowsky, and H. Scholz. 2003. Cobalt and vitamin B12
requirement of dairy cows. Vitamine and Zusatzstoffe in der Ernahrung von Mensch und Tier.
9:61-68.
Stemme, K., P. Lebzien, G. Flachowsky, and H. Scholz. 2008. The influence of an increased
cobalt supply on ruminal parameters and microbial vitamin B12 synthesis in the rumen of dairy
cows. Arch. Anim. Nutr. 62:207-218.
Suttle, N.F. 2010. Mineral Nutrition of Livestock 4th
ed. CAB International, Oxfordshire, UK.
40
Sutton, A.L. and J.M. Elliott. 1972. Effect of ratio of roughage to concentrate and
level of feed intake on ovine ruminal vitamin B12 production. J. Nutr. 102:1341-1346.
Teeri, A.E., H.F. Enos, E. Pomerantz, and N.F. Colovos. 1955. The excretion of vitamin B12 by
dairy cattle. J. Anim. Sci. 14:268-271.
Tiffany, M.E., V. Fellner, and J.W. Spears. 2006. Influence of cobalt concentrations on vitamin
B12 production and fermentation of mixed ruminal microorganisms grown in continuous culture
flow-through fermentors. J. Anim. Sci. 84:635-640.
Tiffany, M.E. and J.W. Spears. 2005. Differential responses to dietary cobalt in finishing steers
fed corn- versus barley-based diets. J. Anim. Sci. 83:2580-2589.
Tokarnia, C.H., J.A. Guimares, C.C. Canella, and J. Dobereiner. 1971. Pesqui Agropecu. Bras.
6:61.
Underwood, E.J. 1977. Trace Elements in Human and Animal Nutrition. Academic Press, New
York, NY.
Zinn, R.A., F.N. Owens, R.L. Stuart, J.R. Dunbar, and B.B. Norman. 1987. B-vitamin
supplementation of diets for feedlot calves. J. Anim. Sci. 65:267-277.
41
CHAPTER 2
Effects of Cobalt Supplementation and Vitamin B12 injections on
Lactation Performance and Metabolism of Holstein Dairy Cows
M. S. Akins1, S. J. Bertics
1, M. T. Socha
2, and R. D. Shaver
1
1Department of Dairy Science, University of Wisconsin, Madison 53706
2Zinpro Corporation, Eden Prairie, MN 55344
42
ABSTRACT
The objective of this study was to determine lactation performance and metabolism
parameters of primiparous and multiparous dairy cows fed different levels and sources (inorganic
and organic) of cobalt or given weekly vitamin B12 injections. Forty-five primi- and multiparous
cows at 60 d prepartum were blocked by expected calving date, and randomly assigned to 1 of 5
treatments in a randomized complete block design with treatments starting at 60 d prepartum.
The five treatments were: 1) no supplemental dietary Co (Control), 2) 25 mg/d supplemental
dietary Co from cobalt carbonate (CoCarb), 3) 25 mg/d supplemental dietary Co from cobalt
glucoheptonate (LCoGH), 4) 75 mg/d supplemental dietary Co from cobalt glucoheptonate
(HCoGH), and 5) Control diet plus weekly 10 mg vitamin B12 injections (IB12). Cows remained
on their respective treatment until 150 DIM. Cobalt (mg/kg DM) in the lactating diets were 1.0,
1.9, 2.3, and 5.1 for Control/IB12, CoCarb, LCoGH, and HCoGH, respectively. Dry matter
intake, body weight, and body condition score were not affected by treatments. LCoGH tended
to have greater milk yield than CoCarb, but Control had similar milk yields to the mean of
LCoGH and HCoGH. Cobalt supplementation or the use of vitamin B12 injections did not
influence plasma or liver measures of energy metabolism. Injections of vitamin B12 increased
plasma, liver, and milk vitamin B12 contents. Diet Co addition did not affect plasma vitamin B12
concentration; however, it did increase milk vitamin B12 concentrations throughout lactation and
liver vitamin B12 at calving. Folate status of cows in the study was low and possibly limited the
effect of improved vitamin B12 status on lactation performance. Overall, cobalt supplementation
or vitamin B12 injections improved measures of vitamin B12 status, but not lactation performance
compared to Control due to cobalt being above requirements in the Control diet.
43
Keywords: cobalt, vitamin B12, dairy cow
INTRODUCTION
Vitamin B12 is a water-soluble vitamin produced by the rumen microbes for use by both
the rumen microbes and host animal. There are two vitamin B12 dependent enzymes in dairy
cattle: 1) methionine synthase, which transfers a methyl group from 5-methyl tetrahydrofolate to
homocysteine to regenerate methionine and tetrahydrofolate and 2) methylmalonyl-CoA mutase,
which transforms methylmalonyl-CoA into succinyl-CoA to enter the Krebs cycle and then
gluconeogenesis. Methylmalonyl-CoA is produced mainly from the metabolism of propionate, a
major product from rumen fermentation, through a biotin dependent pathway. In early lactation,
dairy cattle had lower than optimal levels of vitamin B12 confirmed by reduced serum
methylmalonic acid concentrations and increased energy corrected milk production of
primiparous dairy cows given weekly intramuscular vitamin B12 injections (Girard and Matte,
2005). Early lactation cows have reduced vitamin B12 status due to increased demands of
lactation (Girard and Matte, 1999). Kincaid et al. (2003) reported serum vitamin B12
concentrations of 2.4, 2.0, and 1.2 ng/ml at -21, 7, and 120 d relative to parturition, respectively;
but the decrease from 21 day prepartum to 7 DIM was greater for primiparous cows. Using
multiparous cows, Kincaid and Socha (2007) showed a significant decrease in serum vitamin B12
concentration from 5.7 ng/ml at 55 d prepartum to 2.3, 2.0, and 1.9 at -20, 7, and 120 d relative
to parturition, respectively.
Cobalt is essential for ruminal synthesis of vitamin B12 as cobalt resides at the center of
the corrin ring of vitamin B12. The dietary requirement of dairy cattle for Co is 0.11 mg/kg DM
44
(NRC, 2001). Dietary cobalt content and source have been shown to influence ruminal vitamin
B12 synthesis (Kawashima et al., 1997; Mills, 1981; Tiffany et al., 2006; Tiffany and Spears,
2002). Using continuous-flow cultures, Tiffany et al. (2006) reported increased vitamin B12
concentration as Co increased from 0.1 to 1.0 mg/kg DM. In addition, using beef steers Stangl et
al. (2000) suggested a Co requirement of 0.25 mg/kg DM to maximize vitamin B12 status.
Kincaid et al. (2003) found that multiparous cows fed a diet with 1.26 mg Co/kg DM had higher
milk and 3.5% fat-corrected milk yields than multiparous cows fed diets with 0.37 or 0.68 mg
Co/kg DM, however no effect of dietary cobalt on milk yield was found in primiparous cows.
Limited research has determined the effect of Co source in dairy cattle diets on lactation
performance and metabolism. In addition, no known studies have compared cobalt
supplementation to a positive control treatment of vitamin B12 injections. The objective of this
study was to determine if Co supplementation (inorganic and organic forms) above NRC (2001)
requirements or intramuscular injections of vitamin B12 influenced vitamin B12 status and milk
production by lactating primiparous and multiparous dairy cows. The hypotheses of the study
were that dietary Co supplementation would improve the vitamin B12 status and lactation
performance of dairy cattle compared to an unsupplemented diet. The response to Co
supplementation was hypothesized to be source (inorganic vs. organic) and dose dependent with
organic Co and higher Co doses having greater effects. In addition, it was hypothesized that
cows given vitamin B12 injections would have similar vitamin B12 status and lactation responses
to cows fed diets supplemented with Co.
45
MATERIALS AND METHODS
Cows and Treatments
The Animal Care and Use Committee of the College of Agriculture and Life Sciences
approved this protocol. Forty-five multiparous and forty-five primiparous Holstein dairy cows,
60 d prior to their expected calving, were used in a randomized complete block design. Animals
were blocked depending on parity (1 or ≥2) and expected calving date, and then randomly
assigned to one of five treatments: 1) no dietary cobalt supplementation (Control), 2) 25 mg/d
supplemental dietary Co from cobalt carbonate (CoCarb), 3) 25 mg/d supplemental dietary Co
from cobalt glucoheptonate (LCoGH), 4) 75 mg/d supplemental dietary Co from cobalt
glucoheptonate (HCoGH), or 5) Control diet plus weekly 10 mg intramuscular vitamin B12
injections (IB12). Cobalt glucoheptonate was provided by Zinpro Corporation (Eden Prairie,
MN). Vitamin B12 (Cyanocobalamin 5 mg/mL; Phoenix Pharmaceutical, Inc., St. Joseph, MO)
injections (2 mL) were given in the rear leg. Animals were individually fed a TMR for 5%
refusals in tie-stalls or stanchions with the amounts fed and refused weighed daily to determine
DMI. Diets were mixed once daily in the morning and fed twice daily after each milking.
Treatment premixes (Vita Plus Corporation, Madison, WI) were added to the TMR at a rate of
100 g/cow/d. In addition, a complete dry or lactating cow trace mineral premix with no
supplemental cobalt was added to the TMR at a rate of 100 g/cow/d. The complete trace mineral
premix also contained rumen-protected methionine (15 g/cow/d in dry cow diets and 25 g/cow/d
in lactating diet of Smartamine M, Adisseo, Alpharetta, GA) and sodium monensin (Rumensin,
Elanco Animal Health, Greenfield, IN) at a rate of 250 mg/cow/d. Both far-off (60 to 29 d
before expected calving) and close-up (28 d before expected calving to calving date) dry cow
46
diets were fed (Table 1). A lactating cow diet (Table 1) was fed after calving through 150 DIM.
All multiparous cows received bovine somatotropin (Posilac,Elanco Animal Health, Greenfield,
IN) injections beside the tailhead every 14 d starting at 63 DIM.
Sampling and Analyses
Two animals were removed from the trial at calving. A primiparous cow on HCoGH was
removed due to major calving difficulty, and a multiparous cow on LCoGH was removed due to
delivering twins. Body weight and condition score (1 to 5 in 0.25 increments; Wildman et al.,
1982) were measured weekly throughout the trial. Colostrum samples were taken and frozen at -
20 C until analysis for IgG, IgA, IgE by single radial immunodiffusion (VMRD, Pullman, VA,
Fleenor and Scott, 1981), vitamin B12, and cobalt. Individual milk yields were recorded daily.
Milk samples were taken at four consecutive milkings each week and analyzed for fat, protein,
lactose, SCC, and MUN by infrared analysis using a Foss FT6000 (AgSource Cooperative
Services, Menomonie, WI). In addition, milk samples were frozen at -20° C for vitamin B12 and
cobalt analysis. Vitamin B12 in milk and colostrum was determined using a radioassay kit
designed for human plasma (competitive protein binding assay using a purified form of intrinsic
factor specific for true cobalamins, SimulTRAC-S, MP Biomedicals, Solon, OH) as described by
Preynat et al. (2009) who validated the kit for bovine milk. The recovery of a known amount of
cyanocobalamin was 98.1%, and the interassay coefficient of variations was 5.8%.
Blood samples from the coccygeal vein were taken between d-63 and -57, between d -7
and -1, on d 1, between d 27 and 33, between d 87 and 93, and between d 147 and 153 relative
to calving. Blood samples were taken prior to the morning feeding. Samples were collected in
vacutainer tubes (Becton Dickinson, Franklin Lakes, NJ) containing either sodium heparin or
47
potassium oxalate and sodium fluoride and centrifuged at 625 x g for 15 minutes. All plasma
samples were analyzed for glucose by the glucose oxidase/peroxidase method (Karkalas, 1985),
vitamin B12, folates, and cobalt. Vitamin B12 and folates in plasma were determined using a
radioassay kit designed for human plasma (competitive protein binding assay using a purified
form of intrinsic factor specific for true cobalamins and a purified folate binder from bovine
milk, SimulTRAC-S, MP Biomedicals, Solon, OH) and validated for bovine plasma. The
plasma folate and vitamin B12 assay had recoveries of 97 and 107% of a known amount of added
cyanocobalamin and an interassay coefficient of variation of 9.2 and 9.8%, respectively. Plasma
samples taken d -60, between d -7 and -1, and d 1 and 30 relative to calving were analyzed for
BHBA (Gibbard and Watkins, 1968) and NEFA (acetyl-CoA synthase, acyl-CoA oxidase and
peroxidase, NEFA HR 2, Wako Diagnostics, Richmond, VA). Percutaneous liver biopsies were
taken under local anesthesia (10 ml lidocaine) on d -60, 1, 30, 90, and 150 relative to calving.
Liver samples were rinsed with saline to remove blood, frozen in liquid nitrogen, and stored at -
20 C for triglyceride (TG, Vazques-Anon, 1994) and cobalt analysis, and at -80 C for vitamin
B12 analysis using a radioassy kit designed for human plasma (Simultrac-S, MP Biomedicals,
Solon, OH) as described by Graulet et al. (2007) and validated for bovine liver. The liver
vitamin B12 assay had a recovery of 101.7% and an interassay coefficient of variation of 7.1%.
Cobalt analysis for plasma, liver, milk and colostrum was done by flame atomic
absorption spectrometry (Perkin Elmer, Waltham, MA). Samples of plasma (2 ml), liver (1 g
wet weight), milk (5 ml), and colostrum (5 ml) were added to a 40 ml glass beaker able to
withstand 500° C, dried at 100° C for 24 h, then dry ashed at 500° C for 16 h. The liver samples
were weighed after drying at 100° C for 24 h to determine Co content on a dry basis. After dry
48
ashing, the ash was dissolved in 1 ml of concentrated HCl, then analyzed using flame atomic
absorption spectrometry (Perkin Elmer, Waltham, WA). Individual feed samples were taken
weekly. All feed samples were dried at 60° C for 48 h in a forced-air oven to determine DM
content, ground to pass a 1-mm screen of a Wiley mill (Arthur H. Thomas, Philadelphia, PA),
and composited before sending to Dairy One Forage Laboratory Services (Ithaca, NY) for wet
chemistry analysis. Composites were analyzed for DM, OM (method 942.05; AOAC, 2006), CP
(method 990.03; AOAC, 2006), NDF (Van Soest et al., 1991) determined using α-amylase and
sodium sulfite adapted for ANKOM A200 digestion unit (ANKOM Technology, Macedon, NY),
NDICP (CP [method 990.03; AOAC, 2006] determined on NDF residue from digestion without
sodium sulfite), ADF (method 973.18; AOAC, 2006) adapted for ANKOM A200 digestion unit
(ANKOM Technology, Macedon, NY), ADICP (CP [method 990.03; AOAC, 2006] determined
on ADF residue), lignin (ADF residue digested in 72% sulfuric acid for 3 h in ANKOM Daisy ,
starch using a YSI 2700 SELECT Biochemistry Analyzer with YSI Application Note number
319 (YSI Inc. Life Sciences, Yellow Springs, OH), ether extract (method 2003.05; AOAC, 2006)
, and major and minor minerals including Co using an inductively coupled plasma radial
spectrometer (Thermo Fisher Scientific Inc., Waltham, MA) after microwave digestion (CEM,
Matthews, NC) of the samples in a mixture of nitric and hydrochloric acid. In addition, feed
cobalt was analyzed at the University of Wisconsin Dairy Nutrition Lab (Madison, WI) by
adding to a glass beaker between 1 and 4 g of sample depending on the cobalt concentration of
the sample, drying for 24 h at 100° C, weighing the dry sample and beaker, dry ashing at 500° C
for 16 h, dissolving the ash with 5 ml of concentrated HCl, diluting the sample with 15 ml of
distilled water, and analyzing the sample using a flame atomic absorption spectrometer (Perkin
49
Elmer, Waltham, WA). Energy balance (EB) was calculated weekly based on NRC (2001)
equations. Net energy intake (NEI) was calculated by multiplying weekly DMI by the calculated
net energy for lactation concentration of the diet (NRC, 2001). Net energy of maintenance
(NEM), pregnancy (NEP), and lactation (NEL) were calculated according to NRC (2001)
calculations. Estimated prepartum EB was calculated as EB = NEI – (NEM + NEP). Estimated
postpartum EB was calculated as EB = NEI – (NEM + NEL).
Statistical Analysis
Data were analyzed as a randomized complete block design using the mixed procedure of
SAS (2004). Data were removed when cows experienced a health event that negatively affected
milk yield. Lactation data including DMI, BW, EB, BCS, and all milk yield and component data
were averaged over 3-wk periods. The model for lactation data included fixed effects of parity
(1st lactation or 2
nd lactation and greater), treatment, time, and interactions of these effects. Time
was included as a repeated measure using the first order autoregressive covariance structure.
Random effects included block and the block by cow interaction. Degrees of freedom were
calculated using the Satterthwaite option. Means were determined using the least square means
statement and treatment means were compared using orthogonal contrasts. The model for blood
and liver metabolite data was similar to the lactation data except a spatial power covariance
structure was used for repeated measures due to the unequal spacing of sampling times during
the experiment. Covariate adjustments were made for blood and liver data with the initial
sample at -60 d relative to calving used as a covariate. Orthogonal contrasts used included
Control vs. mean of LCoGH and HCoGH, CoCarb vs. LCoGH, IB12 vs. mean of LCoGH and

50
HCoGH, and LCoGH vs. HCoGH. Statistical significance and trends were considered at P ≤
0.05 and P ≥ 0.06 to P ≤ 0.10, respectively.
RESULTS AND DISCUSSION
Nutrient composition of the diets is presented in Table 1 and 4. Cobalt concentrations of
the diets (Table 3) were higher than anticipated with Control having 1.1 mg Co/kg DM. The
NRC (2001) recommendation for Co requirement is 0.11 ppm Co DM basis, so the negative
control diet had nine times the concentration of Co needed.
Health related incidence rates (not statistically analyzed) are presented in Table 5.
Multiparous cows on LCoGH had numerically fewer health issues than the other treatments.
Three cases of displaced abomasums and milk fever occurred for multiparous cows on CoCarb
and 7 cows on IB12 had mastitis during the study. These health events were likely unrelated to
treatments. Also, primiparous cows had numerically fewer health issues than the multiparous
cows.
Prepartum Data
Least square means for body weight, BCS, DMI, and energy balance are presented in
Table 6. Daily DMI was unaffected by treatment (P = 0.63), and averaged 11.8 kg DM/d. Body
weight and energy balance were not affected by treatment (P > 0.10). Energy balance of the
prepartum period was positive with a mean of 4.3 Mcal/d. Body condition score during the dry
period tended to be lower for cows on IB12 compared to the mean of LCoGH, and HCoGH (P =
0.10).
Lactation Performance
51
Lactation performance data are presented in Table 7. Bodyweight, BCS, energy balance
and DMI of lactating cows were unaffected by treatment (P > 0.10). Energy balance was
negative with mean of -3.3 Mcal/d from parturition to 21 wk into lactation. There was not a
significant effect of treatment (P = 0.15) and treatment by time interaction (P = 0.15) on milk
yield, but there was a tendency for a significant contrast between CoCarb and LCoGH (P = 0.07)
for milk yield. Contrasts between Control and the mean of LCoGH and HCoGH for all lactation
measures were non-significant (P > 0.10), so cobalt concentration in the Control diet was
adequate. LCoGH tended to have greater milk yield than CoCarb (39.7 vs. 42.9 kg/d). 3.5% fat-
corrected milk yield, energy-corrected milk yield, fat content, protein content, lactose content, or
log SCC was not affected by treatment or its interactions with parity or time (P > 0.10). Cows
administered IB12 tended to have greater milk protein content than the mean of LCoGH and
HCoGH (contrast of IB12 vs. mean of LCoGH and HCoGH, P = 0.06). Also, log SCC tended to
be lower for the mean of LCoGH and HCoGH than Control (contrast of Control vs. mean of
LCoGH and HCoGH, P = 0.09). Milk urea nitrogen (MUN) was affected by a treatment by
parity interaction (P = 0.04) such that primiparous cows fed CoCarb (13.8 mg/dL) had
numerically greater MUN than the primiparous cows on the other treatments (12.1, 12.2, 11.5,
12.0 mg/dL for Control, LCoGH, HCoGH, and IB12, respectively), however multiparous cows
had similar MUN across treatments with a mean of 12.3 mg/dL.
Previous studies have reported that cobalt and vitamin B12 supplementation affects
lactation performance. Kincaid et al. (2003) did not observe effects of cobalt supplementation on
bodyweight or BCS, however did find a treatment by parity by time interaction for energy
balance that was not described. In addition, Kincaid et al. (2003) found a treatment by parity by
52
time interaction where multiparous cows fed a diet with 1.26 mg Co/kg DM had increased milk
and 3.5% FCM yield compared to cows fed diets with 0.37 or 0.68 mg Co/kg DM, but
primiparous cows had similar yields across treatments. In another study, Kincaid and Socha
(2007) did not observe an effect of cobalt supplementation on milk yields or milk composition;
however DMI was lower the first 5 wk of lactation for cows fed diets with cobalt concentrations
of 0.93 mg/kg DM vs. 0.19 or 0.57 mg/kg DM. A lack of lactation performance response of
cows to cobalt supplementation when compared to Control in the current study may be due to the
cobalt concentration in the Control being 10-fold higher than the NRC (2001) requirements.Also,
there may have been negative influences of health events on lactation performance with CoCarb
and IB12 having numerically more health events than other treatments. The negative effect of
health events on lactation performance likely carried further into lactation and potentially
impacted the results of the study.
Vitamin B12 injections also did not elicit a lactation response as previously observed by
Girard and Matte (2005). Girard and Matte (2005) fed folic acid and rumen-protected
methionine to primiparous cows during early lactation and observed an increase in energy-
corrected milk when cows were given weekly 10 mg vitamin B12 injections. Cows fed vitamin
B12 alone had lower milk production and reached a plateau sooner than cows fed vitamin B12
with folic acid (Graulet et al., 2007). The cows on the present study had lower folate status
(mean of 14.1 ng/ml during lactation) compared to other studies that supplemented folic acid
with cows having plasma folate levels of 19.5 ng/mL during early and mid-lactation. Methionine
supply was likely adequate for the folate and methionine cycles with the added rumen-protected
methionine in the diet, but folic acid is still needed for nucleotide biosynthesis. Girard and Matte

53
(2005) concluded that with low folate supply, the impact of additional vitamin B12 would be
marginally beneficial due to the rate of tetrahydrofolate flux being limited by folate supply.
Thus, additional folate supply may be needed to have a lactation response to increases in vitamin
B12 supply.
Total protein in colostrum was not affected by treatment (P = 0.28) with a mean of 235.4
mg protein/g colostrum (Table 8). Colostrum IgG and IgM were not affected by treatment (P >
0.10), however IgA tended to be influenced by treatment (P = 0.09). Cows on IB12 tended to
have greater IgA than the mean of LCoGH and HCoGH (P = 0.10). Colostrum cobalt content
was not affected by treatment (P = 0.57), but vitamin B12 content was increased by vitamin B12
injections with cows on IB12 having 2-fold higher colostrum vitamin B12 content than the mean
of LCoGH and HCoGH (P < 0.01). Kincaid and Socha (2007) observed a tendency for increased
colostrum vitamin B12 content when cows were supplemented with cobalt at 0.89 and 1.71 mg/kg
DM during the prepartum period versus 0.15 mg/kg DM. The current study contrasts these data,
but Kincaid and Socha (2007) had lower cobalt content in the control diet. Similar to the current
study, Kincaid et al. (2003) and Kincaid and Socha (2007) did not find an effect of cobalt on
colostrum cobalt content. These studies had similar levels of colostrum cobalt to the current
study with values ranging from 0.095 to 0.144 µg Co/ml colostrum. Cobalt supplementation
non-significantly increased colostrum IgG from 3725 to 5795 mg/dL and IgM from 139 to 185
mg/dL with cobalt supplementation (Kincaid and Socha, 2007). No studies have been reported
on the effect of vitamin B12 injections on colostrum composition for dairy cattle. The increase in
colostrum IgA for cows on IB12 may be due to differences in colostrum yield between the
treatments causing dilution of solids.

54
Milk cobalt content was not impacted by treatment (P = 0.50), but cobalt yield tended to
be affected by treatment (P = 0.06). Cows on LCoGH produced more milk cobalt than CoCarb
(contrast of CoCarb vs. LCoGH, P < 0.01) and cows IB12 yielded less milk cobalt than the mean
of LCoGH and HCoGH (P = 0.02). These differences are due to LCoGH tending to have higher
milk yield than CoCarb and the mean of LCoGH and HCoGH having numerically higher milk
production than IB12.
Vitamin B12 concentrations in milk were affected by treatment and treatment by parity by
time interaction as shown in Table 9 (P = 0.03). Primiparous cows supplemented with cobalt
had numerically greater milk vitamin B12 concentrations throughout lactation. Multiparous cows
on CoCarb and LCoGH had numerically higher milk vitamin B12 concentrations than Control
with HCoGH being intermediate during the months 1 through 4. Primiparous and multiparous
cows given vitamin B12 injections had greater milk vitamin B12 concentrations than other
treatments throughout lactation. There were significant contrasts for milk vitamin B12
concentration with the mean of LCoGH and HCoGH having greater concentrations than Control
(P = 0.01). In addition, injections of vitamin B12 increased milk vitamin B12 concentrations
compared to the mean of LCoGH and HCoGH (P < 0.01). The increase in vitamin B12
concentration with increased cobalt supplementation indicates an increase in ruminal vitamin B12
synthesis and intestinal absorption.
Daily yield of milk vitamin B12 was influenced by a treatment (P < 0.01) and treatment
by time interaction (Figure 2, P < 0.01). Cows on IB12 decreased milk vitamin B12 yield
steadily from month 1 (260 µg/d) to month 3 (135 µg/d) and yield was unchanged during month
4 and 5, while the other treatments had only small changes in vitamin B12 yield during lactation.
55
The mean milk vitamin B12 yield of cows on LCoGH and HCoGH was greater than Control (P =
0.03). Also, cows on IB12 had about 2-fold the milk vitamin B12 yield than the mean of LCoGH
and HCoGH (P < 0.01).
The increase in milk vitamin B12 concentration and yield for cows on IB12 is similar to
other studies giving supplemental vitamin B12 via injection (Girard and Matte, 2005) or diet
(Graulet et al., 2007). Cobalt supplementation improved supply of vitamin B12 indicated by
increased milk vitamin B12 concentration and yield likely due to increased ruminal vitamin B12
synthesis. Ruminal vitamin B12 synthesis was increased by cobalt supplementation (Stemme et
al., 2008), however the study used dietary cobalt concentrations of 0.17 and 0.29 mg/kg DM
which are considerably less than in the present study. Using in vitro fermentation systems,
higher cobalt concentrations have been investigated. Tiffany et al. (2006) using continuous
flow-through fermentors observed that increasing cobalt concentrations from 0.05 to 1.05 mg/kg
DM increased vitamin B12 concentrations.
There was no effect of treatment or treatment by time interaction for blood glucose,
NEFA, or BHBA concentrations (P > 0.10). However there was an effect of time (Table 10, P <
0.01). Glucose, NEFA, and BHBA averaged 60.4 mg/dL, 440 mmol/L, and 8.3 mg/dL. Liver
triglycerides (TG) were unaffected by treatment (P = 0.34), but a parity by time interaction (P <
0.01) was observed. Primiparous cows had liver TG of 1.58, 5.72, and 5.72 % DM at d -60, 1,
and 30 relative to calving. Multiparous cows had liver TG of 1.49, 10.37, and 14.85 % DM at
-60, 1, and 30 relative to calving. The difference in liver TG between primiparous and
multiparous cows has been previously reported by Petit et al. (2007) and may be due to greater
milk production and more severe negative energy balance for multiparous cows leading to
56
greater mobilization of body tissues and liver TG accumulation. In previous experiments
(Graulet et al., 2007 and Preynat et al., 2009) plasma glucose and NEFA concentrations were
also not affected by additional vitamin B12. However, when folate was given in combination
with vitamin B12, plasma glucose concentrations were increased (Graulet et al., 2007).
Plasma cobalt concentration was influenced by a treatment by time interaction (Figure 3,
P = 0.05) such that LCoGH had a higher concentration at 30 d postpartum than other treatments
with no apparent differences at other sampling times. Prior to calving, plasma cobalt was
approximately 0.13 µg/mL until calving when it increased to 0.18 µg/mL, and then decreased
thereafter. Also, LCoGH tended to have greater plasma cobalt than CoCarb (contrast of CoCarb
vs. LCoGH, P = 0.08). Vitamin B12 concentrations in plasma also had a treatment by time effect
(Figure 4, P < 0.01). Injections of vitamin B12 increased plasma vitamin B12 approximately 2-
fold higher than other treatments throughout the study. For all treatments during the prepartum
period, plasma vitamin B12 increased until calving, then decreased to a nadir at 30 d postpartum,
and increased to a plateau at 90 d postpartum. In addition, cows on IB12 had increased plasma
vitamin B12 compared to the mean of LCoGH and HCoGH (P < 0.01) and cows fed LCoGH
tended to have greater plasma vitamin B12 than HCoGH (P = 0.07). However, the plasma
vitamin B12 concentration of cows on IB12 at d 1 of lactation is inflated due to cows calving and
sampling occuring throughout the 7 d between injections leading to cows having higher plasma
vitamin B12 the closer parturition was to the day of injection (Figure 5). Plasma folate
concentration was not affected by treatment (P > 0.10), but tended to be influenced by a parity
by time interaction with plasma folates being lower for multiparous cows than primiparous cows
at -7 d prior to calving and d 1 of lactation (Figure 6, P = 0.06). Furthermore, plasma folates
57
were affected by a time effect (P < 0.01) with folates decreasing before calving to a nadir at -7 d
relative to calving, and then increased thereafter. Liver cobalt and vitamin B12 were both
affected by a treatment by time interaction (P ≤ 0.03). Cows on HCoGH had increased liver
cobalt than the other treatments throughout the study (Figure 7, P < 0.01). Liver vitamin B12
was increased at calving for CoCarb, LCoGH, HCoGH, and IB12 compared to Control, however
LCoGH, HCoGH, and CoCarb decreased at d 30 and was similar to Control for the remainder of
the study (Figure 8, P = 0.03). Cows on IB12 remained higher than other treatments until 150 d
relative to calving.
A reduction in plasma cobalt and vitamin B12 after parturition is due to increased demand
from secretion of vitamin B12 in milk and increased metabolism during lactation. Girard and
Matte (1999) observed a similar decrease in plasma vitamin B12 during early lactation where
vitamin B12 reached a low point at 4 to 8 wk postpartum then increased to a plateau at 16 wk
postpartum. The increase in plasma vitamin B12 due to injections of vitamin B12 was comparable
to Girard and Matte (2005). However, Kincaid observed a reduction in serum vitamin B12 at 21
d prior to calving which is different from the present study. A reduction in serum vitamin B12
may be due to decreased DMI during the prepartum period causing decreased ruminal vitamin
B12 synthesis. Also, increased maternal transfer of vitamin B12 may decrease serum vitamin B12
especially during late pregnancy. Plasma folate levels in the current study are lower (14.1 vs
19.5 ng/mL) than observed by Girard and Matte (2005) where folic acid and rumen-protected
methionine was supplemented. However, Girard and Matte (2005) observed an increase in
energy-corrected milk yield when cows were given injections of vitamin B12 which differs from
the current study. When cows have had serum vitamin B12 levels above 200 pg/ml, supplemental

58
folic acid has increased milk yield, protein content, and protein yield (Girard and Matte, 1998).
The present study further demonstrates that supplementation with rumen-protected methionine
may fulfill the need for methyl groups, but supplemental folates may be needed for optimal DNA
precursor biosynthesis and cell growth (Girard and Matte, 2005).
An increase in liver vitamin B12 with cobalt supplementation has been observed with beef
cattle when determining cobalt requirements. Stangl et al. (2000) observed an increase in liver
vitamin B12 with increasing dietary cobalt with no improvement above 0.2 mg Co/kg DM. The
increase of liver vitamin B12 at calving suggests improvement of vitamin B12 status with cobalt
supplementation; however the decrease after calving is likely due to increased vitamin B12
demand and secretion in milk. Liver cobalt concentration was improved only for HCoGH and
may be due to the high cobalt concentration or the cobalt source, but this cannot be elucidated
since an inorganic source was not fed at the same level as HCoGH. The increase in liver cobalt
has not been demonstrated previously (Kincaid et al., 2003 and Kincaid and Socha, 2007).
SUMMARY AND CONCLUSIONS
Supplementation with Co glucoheptonate or Co carbonate above NRC (2001)
requirements and injections of vitamin B12 did not affect milk yield or component yield
compared to Control. Cows fed LCoGH had improved lactation performance compared to cows
fed CoCarb. However, the level of Co glucoheptonate did not affect lactation performance.
Vitamin B12 injections did not affect lactation performance compared to the Co glucoheptonate
treatments. Cobalt supplementation or vitamin B12 injections did not affect energy metabolite
measures. However, Co supplementation regardless of source or level increased milk vitamin
B12 levels and liver vitamin B12 at calving, but plasma vitamin B12 was not changed. Injections
59
of vitamin B12 increased all measures of vitamin B12 as expected. Plasma folate levels were
lower than previous studies that observed an effect of vitamin B12 injections so folate status may
have influenced the results due to reduced supply of precursors for DNA synthesis. Future
research is warranted to understand the effect of cobalt supplementation when folate supplements
are provided.
ACKNOWLEDGEMENTS
The authors wish to thank the Zinpro Corporation for partial funding of the project, the
Vita Plus Corporation for mixing of premixes, Mike Peters, Sandy Trower, Jerry Guenther and
the staff at the UW Madison Blaine Dairy and Campus Dairy Cattle Center for animal care and
management, fellow Dairy Science graduate students for help with sampling, Jeff Schuttenhelm,
Ryan Dashek, and Carmen Braun for help with sample analysis and data entry, and Peter Crump
of the UW CALS Computer Consulting Lab for assistance with statistical analysis of the data.
REFERENCES
Fleenor, W. A., and G. H. Stott. 1981. Single radial immunodiffusion analysis for quantitation of
colostral immunoglobulin concentration. J. Dairy Sci. 64:740–747.
Gibbard, S. and P. J. Watkins. 1968. A micro-method for the enzymatic determination of D-beta-
hydroxybutyrate and acetoacetate. Clin. Chim. Acta. 19: 511-521.
Girard, C. L., and J. J. Matte. 1998. Dietary supplements of folic acid during lactation: Effects on
the performance of dairy cows. J. Dairy Sci. 81:1412–1419.
60
Girard, C. L., and J. J. Matte. 1999. Changes in serum concentrations of folates, pyridoxal,
pyridoxal-5-phosphate and vitamin B12 during lactation of dairy cows fed dietary supplements of
folic acid. Can. J. Anim. Sci. 79:107–113.
Girard, C. L and J. J. Matte. 2005. Effects of intramuscular injections of vitamin B12 on lactation
performance of dairy cows fed dietary supplements of folic acid and rumen-protected
methionine. J. Dairy Sci. 88: 671-676.
Graulet, B., J. J. Matte, A. Desrouches, L. Doepel, M. F. Palin, and C. L. Girard. 2007. Effects of
dietary supplements of folic acid and vitamin B12 on metabolism of dairy cows in early lactation.
J. Dairy Sci. 90: 3442-3455.
Grummer, R. R. 1993. Etiology of lipid-related metabolic disorders in periparturient dairy cows.
J. Dairy Sci. 76:3882–3896.
Karkalas, J. J. 1985. An improved enzymatic method for the determination of native and
modified starch. J. Sci. Food Agric. 36: 1019-1027.
Kawashima, T., P. R. Henry, D. G. Bates, C. B. Ammerman, R. C. Littell, and J. Price. 1997.
Bioavailability of cobalt sources for ruminants. 3. In vitro ruminal production of vitamin B12 and
total corrinoids in response to different cobalt sources and concentrations. Nut. Res. 17: 975-987.
61
Kincaid, R. L., L. E. Lefebvre, J. D. Cronrath, M. T. Socha, and A. B. Johnson. 2003. Effect of
dietary cobalt supplementation on cobalt metabolism and performance of dairy cattle. J. Dairy
Sci. 86:1405-1414.
Kincaid, R. L and M. T. Socha. 2007. Effect of cobalt supplementation during late gestation and
early lactation on milk and serum measures. J. Dairy Sci. 90: 1880-1886.
Mills, C. F. 1981. Cobalt deficiency and cobalt requirements of ruminants. Pages 129 – 140 in
Recent Advances in Animal Nutrition. W. Haresign, ed., Buttersworths, Boston, MA.
National Research Council. 2001. Nutrient Requirements of Dairy Cattle 6th
rev. ed. Natl. Acad.
Sci. Washington, DC.
Petit, H.V., M.F. Palin, and L. Doepel. 2007. Hepatic lipid metabolism in transition dairy cows
fed flaxseed. J. Dairy Sci. 90:4780-4792.
Preynat, A., H. Lapierre, M. C. Thivierge, M. F. Palin, J. J. Matte, A. Desrouches, and C. L.
Girard. 2009. Effects of supplements of folic acid, vitamin B12, and rumen-protected methionine
on whole body metabolism of methionine and glucose in lactating dairy cows. J. Dairy Sci.
92:677-689.
62
Stangl, G. I., F. J. Schwarz, H. Müller, and M. Kirchgessner. 2000. Evaluation of the cobalt
requirement of beef cattle based on vitamin B12, folate, homocysteine and methylmalonic acid.
Br. J. Nutr. 84:645-653.
Tiffany, M. E., V. Fellner, and J. W. Spears. 2006. Influence of cobalt concentrations on vitamin
B12 production and fermentation of mixed microorganisms grown in continuous culture flow-
through fermentors. J. Anim. Sci. 84: 635-640.
Tiffany, M. E., and J. W. Spears. 2002. Effects of dietary cobalt source and concentration on
performance, vitamin B12 status, and ruminal and plasma metabolites in growing and finishing
steers. J. Anim. Sci. 80(Suppl. 1): 47 (Abstract).
Vazquez-Anon, M., S. J. Bertics, M. Luck, and R. R. Grummer. 1994. Peripartum liver
triglyceride and plasma metabolites in dairy cows. J. Dairy Sci. 77:1521–1528.
Wildman, E. E., G. M. Jones, P. E. Wagner, R. L. Boman, H. F. Troutt, Jr., and T. N. Lesch.
1982. A dairy cow body condition scoring system and its relation to selected production
characteristics. J. Dairy Sci. 65:495–501.

63
Table 1. Ingredient and nutrient composition of diets fed to dry and lactating cows
Diet
Item Far-off Dry Close-up Dry Lactating
Ingredients - - - - - - - - - - - - -% DM- - - - - - - - - - - - - -
Corn silage 49.5 31.3 32.2
Alfalfa silage 28.3 15.6 19.3
Chopped wheat straw 16.5 18.2
Chopped hay 3.1
Concentrate mix1,2,3
4.2 33.2 35.4
Dry distillers grain 9.2
Mineral Premix4,5
.77 .86 .40
Treatment Premix6,7,8,9
.77 .86 .40
Nutrient
CP, % 13.8 ± 0.37 15.1 ± 0.31 18.0 ± 0.50
NDF, % 48.8 ± 1.36 40.2 ± 1.30 32.9 ± 1.78
Ether extract, % 2.5 ± 0.13 2.9 ± 0.06 5.0 ± 0.49
Starch, % 16.4 ± 1.90 24.4 ± 1.30 24.0 ± 1.51
NFC, % 27.8 ± 1.33 35.7 ± 1.15 38.3 ± 1.05
TDN1x, % 60.3 ± 0.57 66.2 ± 0.75 71.9 ± 1.27
DE1x10
, Mcal/kg DM 2.71 ± 0.025 2.98 ± 0.034 3.25 ± 0.058 1Composition of the far-off grain mix on as-fed basis was 86.0% soybean meal (48% CP), 6.2%
magnesium oxide, 3.9% dicalcium phosphate, and 3.9% salt. 2Composition of the close-up grain mix on as-fed basis was 60.0% ground corn, 17.5% soybean
meal (48% CP), 17.5% expeller soybean meal, 2.1% calcium sulfate, 2.1% magnesium sulfate,
0.4% magnesium oxide, and 0.4% dicalcium phosphate. 3Composition of the lactating grain mix on as-fed basis was 58.5% ground corn, 30.1% soybean
meal (48% CP), 4.7% tallow, 2.4% calcium carbonate, 2.4% sodium bicarbonate, 0.96% salt,
0.56% magnesium oxide, and 0.38% magnesium-potassium sulfate. 4Composition of the dry cow mineral premix on an as-fed basis was 68.7% wheat middlings,
15% Smartamine M (Adisseo, Alpharetta, GA), 3.6% zinc methionine complex (10% Zn and
20% methionine, Zinpro Corp., Eden Prairie, MN), 2.5% manganese methionine complex (8%
Mn and 18% methionine, Zinpro Corp., Eden Prairie, MN), 2% vitamin E (50%), 1.8%
manganese sulfate, 1.5% zinc sulfate, 1.4% Rumensin 80 (Elanco Animal Health, Greenfield,
IN), 1.3% mineral oil, 1.3% copper lysine complex (10% copper and 46% lysine, Zinpro Corp.,
Eden Prairie, MN), 0.45% selenium 0.8%, 0.21% copper sulfate, 0.18% iron sulfate, 0.12%
vitamin A/D3 (2200 KIU vitamin A and 440 KIU vitamin D per kg), 0.032% vitamin D3 (1,100
KIU/kg) and 0.021% ethylenediamine dihydroiodide (99%) 5Composition of the lactating cow mineral premix on an as-fed basis was 28.0% calcium
carbonate, 25.0% wheat middlings, 25.0% Smartamine M (Adisseo, Alpharetta, GA), 4.1% zinc
64
methionine complex (10% Zn and 20% methionine, Zinpro Corp., Eden Prairie, MN), 3.8%
manganese sulfate, 3.4% zinc sulfate, 2.5% manganese methionine complex (8% Mn and 18%
methionine, Zinpro Corp., Eden Prairie, MN), 2% vitamin E 50%, 1.4% Rumensin 80 (Elanco
Animal Health, Greenfield, IN), 1.3% mineral oil, 1.3% copper lysine complex (10% copper and
46% lysine, Zinpro Corp., Eden Prairie, MN), 0.83% selenium 0.8%, 0.82% copper sulfate,
0.35% iron sulfate, 0.12% vitamin A/D3 (2200 KIU vitamin A and 440 KIU vitamin D per kg),
0.032% vitamin D3 (1,100 KIU/kg) and 0.032% ethylenediamine dihydroiodide 99%. 6Composition of the Control and IB12 treatment premix on an as-fed basis was 99.5% wheat
middlings and 0.5% mineral oil 7Composition of the CoCarb treatment premix on an as-fed basis was 99.4% wheat middlings,
0.5% mineral oil, and 0.055% cobalt carbonate 8Composition of the LCoGH treatment premix on an as-fed basis was 98.5% wheat middlings,
1.0% cobalt glucoheptonate (2.5% Co, Zinpro Corp., Eden Prairie, MN) and 0.5% mineral oil 9Composition of the HCoGH treatment premix on an as-fed basis was 96.5% wheat middlings,
3.0% cobalt glucoheptonate (2.5% Co, Zinpro Corp., Eden Prairie, MN) and 0.5% mineral oil 10
Digestible energy concentration (Mcal/kg DM) of the diet fed at maintenance level

65
Table 2. Cobalt concentration of ingredients from two laboratories
Laboratory
Ingredient Dairy One1
UW2
Corn silage 0.70 ± 0.12 0.76 ± 0.07
Alfalfa silage 0.59 ± 0.57 2.91 ± 0.37
Hay 1.68 ± 0.59 2.10 ± 0.30
Wheat straw 0.97 ± 0.15 1.29 ± 0.23
Far-off cow grain 1.48 ± 0.40 2.01 ± 0.12
Close-up cow grain 2.55 ± 1.22 1.13 ± 0.01
Lactating cow grain 0.97 ± 0.11 2.08 ± 0.29
Distillers grain 0.08 ± 0.05 0.96 ± 0.10
Dry cow mineral premix 25.7 ± 5.2 23.6 ± 0.7
Lactating cow mineral premix 45.3 ± 11.2 34.8 ± 6.7
Control premix 18.6 ± 14.3 18.0 ± 11.1
CoCarb premix 235 ± 18.5 269 ± 18.8
LCoGH premix 320 ± 57.7 330 ± 29.5
HCoGH premix 1031 ± 269 972 ± 34.1 1Cobalt analysis using microwave wet ash digestion and inductively coupled plasma
spectrometry (Dairy One Laboratory, Ithaca, NY) 2Cobalt analysis using dry ashing and flame atomic absorption spectrometry (University of
Wisconsin Dairy Nutrition Lab, Madison, WI)
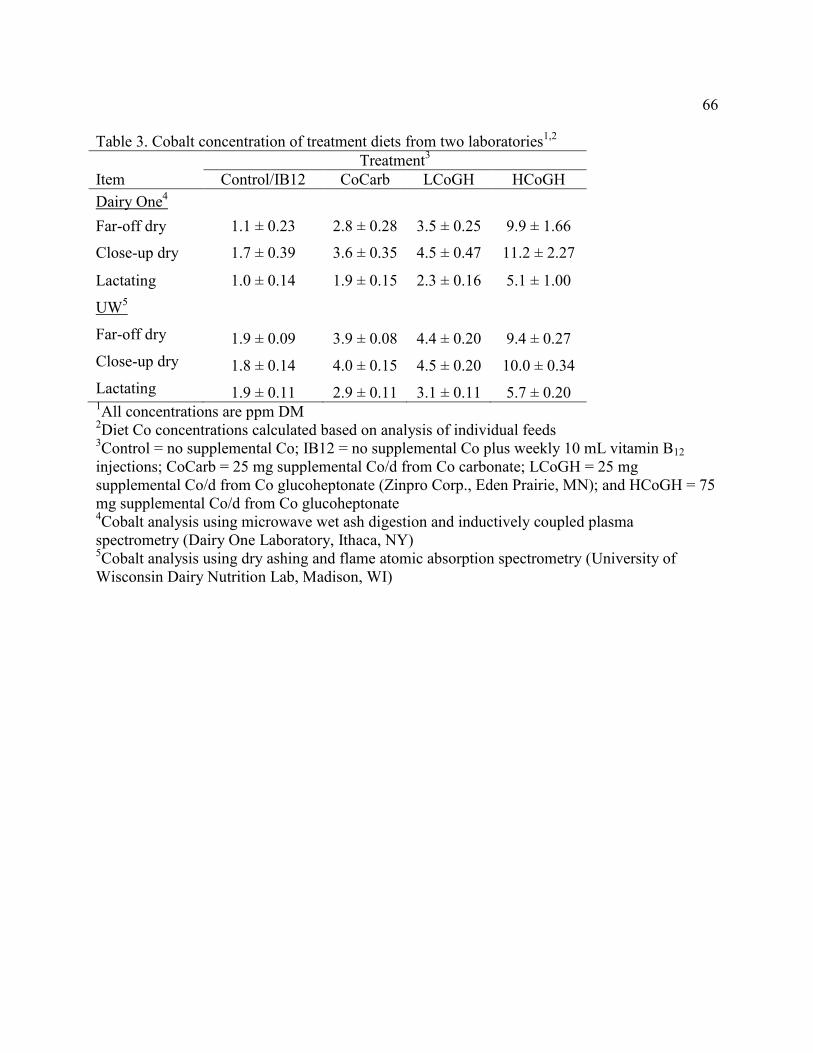
66
Table 3. Cobalt concentration of treatment diets from two laboratories1,2
Treatment3
Item Control/IB12
CoCarb
LCoGH
HCoGH
Dairy One4
Far-off dry 1.1 ± 0.23 2.8 ± 0.28 3.5 ± 0.25 9.9 ± 1.66
Close-up dry 1.7 ± 0.39 3.6 ± 0.35 4.5 ± 0.47 11.2 ± 2.27
Lactating 1.0 ± 0.14 1.9 ± 0.15 2.3 ± 0.16 5.1 ± 1.00
UW5
Far-off dry 1.9 ± 0.09 3.9 ± 0.08 4.4 ± 0.20 9.4 ± 0.27
Close-up dry 1.8 ± 0.14 4.0 ± 0.15 4.5 ± 0.20 10.0 ± 0.34
Lactating 1.9 ± 0.11 2.9 ± 0.11 3.1 ± 0.11 5.7 ± 0.20 1All concentrations are ppm DM
2Diet Co concentrations calculated based on analysis of individual feeds
3Control = no supplemental Co; IB12 = no supplemental Co plus weekly 10 mL vitamin B12
injections; CoCarb = 25 mg supplemental Co/d from Co carbonate; LCoGH = 25 mg
supplemental Co/d from Co glucoheptonate (Zinpro Corp., Eden Prairie, MN); and HCoGH = 75
mg supplemental Co/d from Co glucoheptonate 4Cobalt analysis using microwave wet ash digestion and inductively coupled plasma
spectrometry (Dairy One Laboratory, Ithaca, NY) 5Cobalt analysis using dry ashing and flame atomic absorption spectrometry (University of
Wisconsin Dairy Nutrition Lab, Madison, WI)
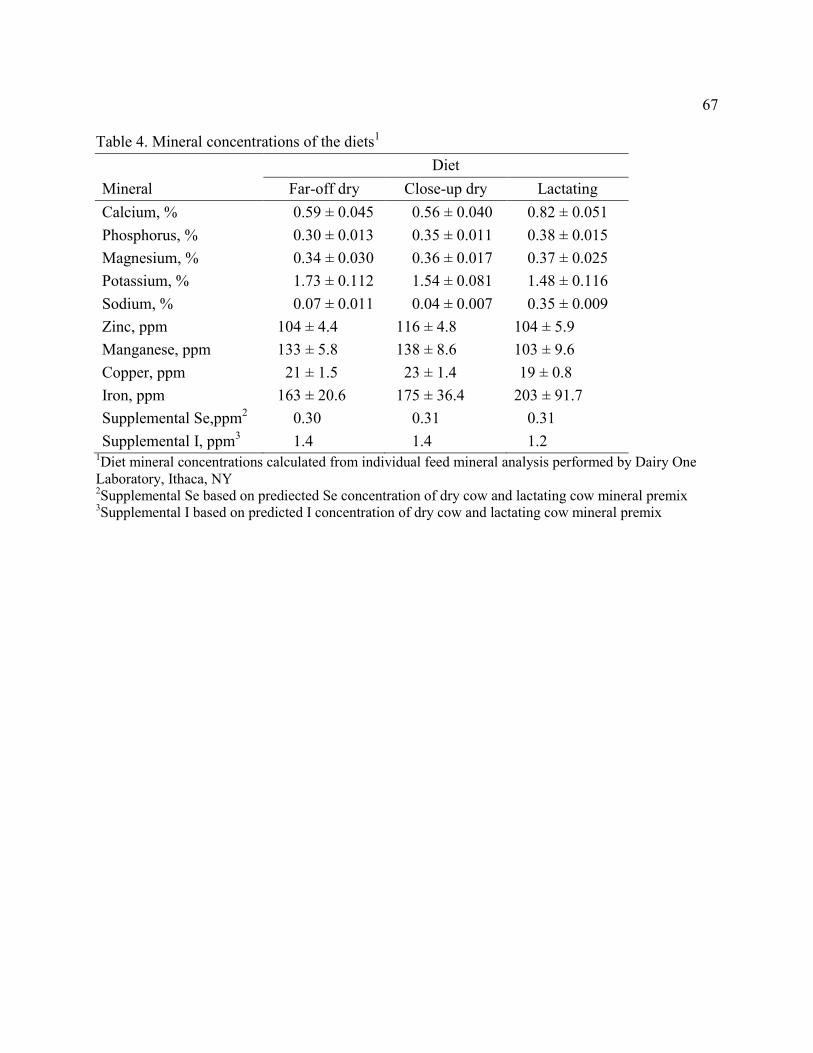
67
Table 4. Mineral concentrations of the diets1
Diet
Mineral Far-off dry Close-up dry Lactating
Calcium, % 0.59 ± 0.045 0.56 ± 0.040 0.82 ± 0.051
Phosphorus, % 0.30 ± 0.013 0.35 ± 0.011 0.38 ± 0.015
Magnesium, % 0.34 ± 0.030 0.36 ± 0.017 0.37 ± 0.025
Potassium, % 1.73 ± 0.112 1.54 ± 0.081 1.48 ± 0.116
Sodium, % 0.07 ± 0.011 0.04 ± 0.007 0.35 ± 0.009
Zinc, ppm 104 ± 4.4 116 ± 4.8 104 ± 5.9
Manganese, ppm 133 ± 5.8 138 ± 8.6 103 ± 9.6
Copper, ppm 21 ± 1.5 23 ± 1.4 19 ± 0.8
Iron, ppm 163 ± 20.6 175 ± 36.4 203 ± 91.7
Supplemental Se,ppm2 0.30 0.31 0.31
Supplemental I, ppm3 1.4 1.4 1.2
1Diet mineral concentrations calculated from individual feed mineral analysis performed by Dairy One
Laboratory, Ithaca, NY 2Supplemental Se based on prediected Se concentration of dry cow and lactating cow mineral premix
3Supplemental I based on predicted I concentration of dry cow and lactating cow mineral premix

68
Table 5. Incidence of health events1
Treatment2
Item Control CoCarb LCoGH HCoGH IB12
Primiparous cows (n=) 9 9 9 8 9
Ketosis3
1 1 1 2 4
Displaced abomasum4
1 1 0 0 1
Milk fever5
0 0 0 0 0
Retained placenta6
1 1 0 0 0
Mastitis7
4 0 2 2 2
Multiparous cows (n=) 9 9 8 9 9
Ketosis 2 1 2 2 1
Displaced abomasum 1 3 0 1 1
Milk fever 0 3 1 0 1
Retained placenta 0 1 0 0 0
Mastitis 4 3 1 4 7 1Incidence is the number of cows on each treatment that had the event occur
2Control = no supplemental Co; CoCarb = 25 mg supplemental Co/d from Co carbonate; LCoGH
= 25 mg supplemental Co/d from Co glucoheptonate (Zinpro Corp., Eden Prairie, MN); and
HCoGH = 75 mg supplemental Co/d from Co glucoheptonate; IB12 = no supplemental Co plus
weekly 10 mL vitamin B12 injections. 3Ketosis recorded when treatment given after confirmed with urine ketone strip being moderate
or greater 4Displaced abomasum recorded after diagnosis by a veterinarian and the cow underwent surgical
treatment 5Milk fever recorded when cow is treated for one or more of the following symptoms: cold ears,
trembling, head bobbing, or inability to rise 6Retained placenta recorded when cow unable to expel placenta within 12 h of parturition
7 Mastitis recorded when cow given treatment for mastitis confirmed by CMT test

69
Table 6. Treatment effects on least square means of prepartum BW, BCS, DMI, and energy balance
1
Treatment2 Effect (P =)
3
Item Control CoCarb LCoGH HCoGH IB12 SEM Trt Par
Trt x
par
Trt x
time
Par x
time
Trt x
par x
time
BW, kg
679 682 662 688 667 13.4 0.63 <0.01 0.92 0.33 0.20 0.11
BCS4
3.6 3.7 3.7 3.8 3.6 0.09 0.39 <0.01 0.56 0.88 <0.01 0.41
DMI, kg/d 11.8 11.6 11.4 11.7 12.3 0.48 0.70 <0.01 0.82 0.62 <0.01 0.78
EB, Mcal/d5 4.3 4.1 4.0 4.1 5.2 0.69 0.67 <0.01 0.85 0.65 <0.01 0.80
1Significant time effect for all measures (P < 0.01).
2Control = no supplemental Co; CoCarb = 25 mg supplemental Co/d from Co carbonate; LCoGH = 25 mg
supplemental Co/d from Co glucoheptonate (Zinpro Corp., Eden Prairie, MN); and HCoGH = 75 mg supplemental
Co/d from Co glucoheptonate; IB12 = no supplemental Co plus weekly 10 mL vitamin B12 injections. 3Trt = treatment and Par = parity
4Tendency for significant contrast of IB12 vs. mean of LCoGH and HCoGH (P = 0.10).
5EB = energy balance calculated according to NRC (2001) equations.
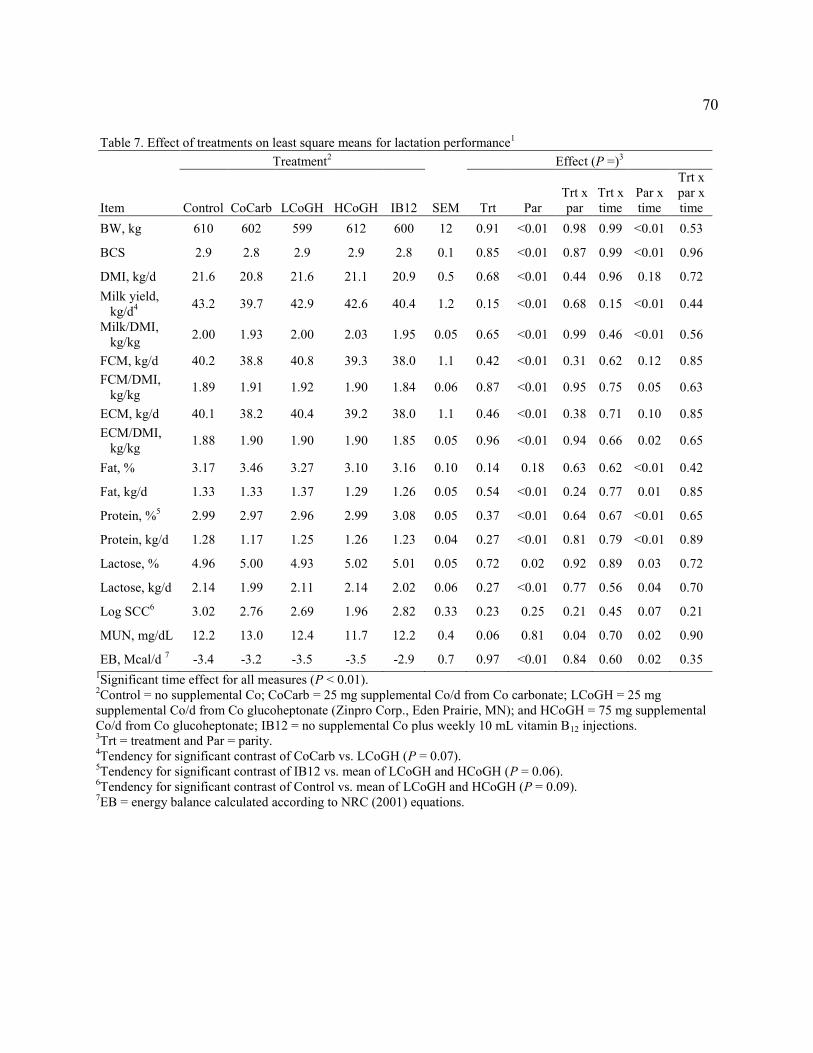
70
Table 7. Effect of treatments on least square means for lactation performance1
Treatment2 Effect (P =)
3
Item Control CoCarb LCoGH HCoGH IB12 SEM Trt Par
Trt x
par
Trt x
time
Par x
time
Trt x
par x
time
BW, kg 610 602 599 612 600 12 0.91 <0.01 0.98 0.99 <0.01 0.53
BCS
2.9 2.8 2.9 2.9 2.8 0.1 0.85 <0.01 0.87 0.99 <0.01 0.96
DMI, kg/d
21.6 20.8 21.6 21.1 20.9 0.5 0.68 <0.01 0.44 0.96 0.18 0.72
Milk yield,
kg/d4 43.2 39.7 42.9 42.6 40.4 1.2 0.15 <0.01 0.68 0.15 <0.01 0.44
Milk/DMI,
kg/kg 2.00 1.93 2.00 2.03 1.95 0.05 0.65 <0.01 0.99 0.46 <0.01 0.56
FCM, kg/d 40.2 38.8 40.8 39.3 38.0 1.1 0.42 <0.01 0.31 0.62 0.12 0.85
FCM/DMI,
kg/kg 1.89 1.91 1.92 1.90 1.84 0.06 0.87 <0.01 0.95 0.75 0.05 0.63
ECM, kg/d
40.1 38.2 40.4 39.2 38.0 1.1 0.46 <0.01 0.38 0.71 0.10 0.85
ECM/DMI,
kg/kg 1.88 1.90 1.90 1.90 1.85 0.05 0.96 <0.01 0.94 0.66 0.02 0.65
Fat, % 3.17 3.46 3.27 3.10 3.16 0.10 0.14 0.18 0.63 0.62 <0.01 0.42
Fat, kg/d 1.33 1.33 1.37 1.29 1.26 0.05 0.54 <0.01 0.24 0.77 0.01 0.85
Protein, %5
2.99 2.97 2.96 2.99 3.08 0.05 0.37 <0.01 0.64 0.67 <0.01 0.65
Protein, kg/d
1.28 1.17 1.25 1.26 1.23 0.04 0.27 <0.01 0.81 0.79 <0.01 0.89
Lactose, %
4.96 5.00 4.93 5.02 5.01 0.05 0.72 0.02 0.92 0.89 0.03 0.72
Lactose, kg/d
2.14 1.99 2.11 2.14 2.02 0.06 0.27 <0.01 0.77 0.56 0.04 0.70
Log SCC6
3.02 2.76 2.69 1.96 2.82 0.33 0.23 0.25 0.21 0.45 0.07 0.21
MUN, mg/dL
12.2 13.0 12.4 11.7 12.2 0.4 0.06 0.81 0.04 0.70 0.02 0.90
EB, Mcal/d 7
-3.4 -3.2 -3.5 -3.5 -2.9 0.7 0.97 <0.01 0.84 0.60 0.02 0.35 1Significant time effect for all measures (P < 0.01).
2Control = no supplemental Co; CoCarb = 25 mg supplemental Co/d from Co carbonate; LCoGH = 25 mg
supplemental Co/d from Co glucoheptonate (Zinpro Corp., Eden Prairie, MN); and HCoGH = 75 mg supplemental
Co/d from Co glucoheptonate; IB12 = no supplemental Co plus weekly 10 mL vitamin B12 injections. 3Trt = treatment and Par = parity.
4Tendency for significant contrast of CoCarb vs. LCoGH (P = 0.07).
5Tendency for significant contrast of IB12 vs. mean of LCoGH and HCoGH (P = 0.06).
6Tendency for significant contrast of Control vs. mean of LCoGH and HCoGH (P = 0.09).
7EB = energy balance calculated according to NRC (2001) equations.
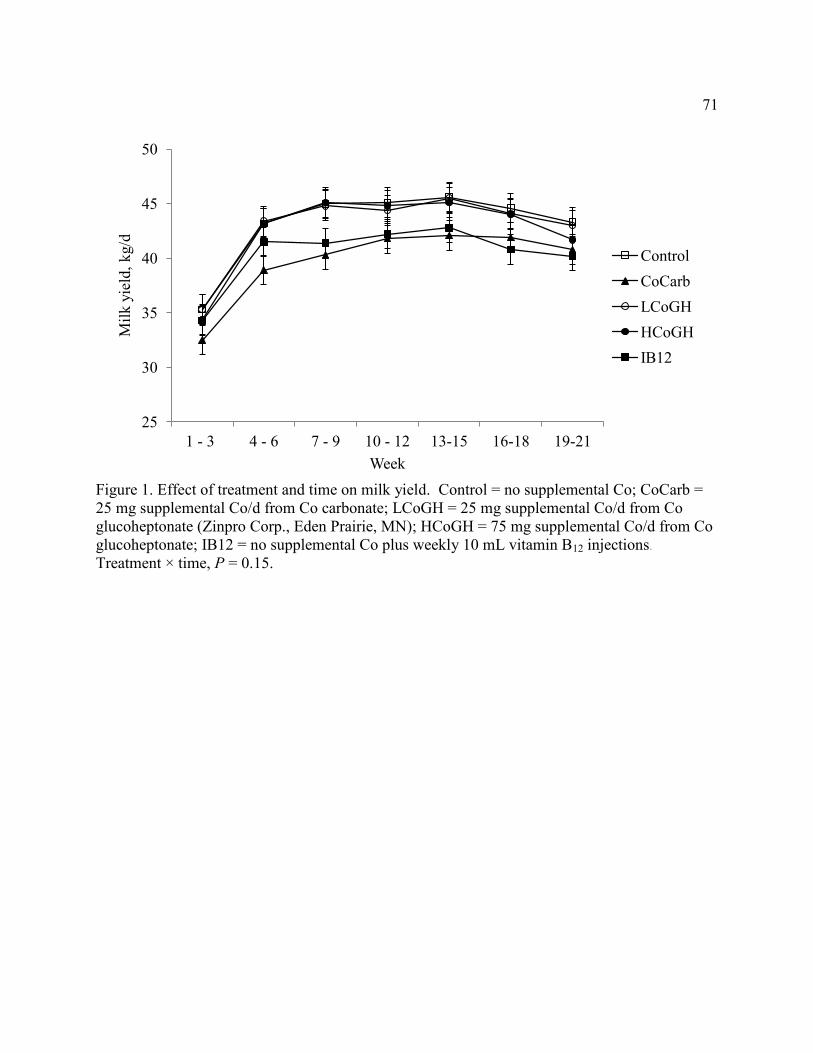
71
Figure 1. Effect of treatment and time on milk yield. Control = no supplemental Co; CoCarb =
25 mg supplemental Co/d from Co carbonate; LCoGH = 25 mg supplemental Co/d from Co
glucoheptonate (Zinpro Corp., Eden Prairie, MN); HCoGH = 75 mg supplemental Co/d from Co
glucoheptonate; IB12 = no supplemental Co plus weekly 10 mL vitamin B12 injections.
Treatment × time, P = 0.15.
25
30
35
40
45
50
1 - 3 4 - 6 7 - 9 10 - 12 13-15 16-18 19-21
Mil
k y
ield
, kg/d
Week
Control
CoCarb
LCoGH
HCoGH
IB12

72
Table 8. Effects of treatments on least square means of selected measures in colostrum and milk1
Treatment2 Effect (P =)
3
Item Control CoCarb LCoGH HCoGH IB12 SEM Trt Par
Trt x
par
Trt x
time
Par x
time
Trt x
par x
time
Colostrum
Protein, g/L 213 253 238 216 256 19 0.28 0.21 0.24 - - -
IgG, mg/dL
7745 8213 7003 7726 8478 728 0.62 <0.01 0.68 - - -
IgM, mg/dL 464 579 492 541 564 41 0.21 0.35 0.65 - - -
IgA, mg/dL4
200 307 242 219 302 36 0.09 <0.01 0.13 - - -
Cobalt,
µg/mL 0.148 0.151 0.153 0.150 0.148 0.002 0.57 0.83 0.22 - - -
Vitamin B12,
ng/mL5 12.8 15.7 16.3 13.6 33.4 1.8 <0.01 <0.01 0.51 - - -
Milk
Cobalt,
µg/mL 0.107 0.105 0.107 0.107 0.106 0.001 0.50 0.84 0.96 0.24 <0.01 0.69
Cobalt,
mg/d6,7 4.60 4.15 4.62 4.55 4.27 0.14 0.06 <0.01 0.59 0.32 0.03 0.33
Vitamin B12,
pg/ml8,9 1575 2012 2070 2032 4431 184 <0.01 0.69 0.22 <0.01 0.41 0.03
Vitamin B12,
µg/d10,11 68.6 79.3 86.6 83.9 172.5 7.1 <0.01 0.10 0.59 <0.01 0.01 0.21
1Significant effect of time for all milk measures (P < 0.01).
2Control = no supplemental Co; CoCarb = 25 mg supplemental Co/d from Co carbonate; LCoGH = 25 mg
supplemental Co/d from Co glucoheptonate (Zinpro Corp., Eden Prairie, MN); HCoGH = 75 mg supplemental Co/d
from Co glucoheptonate; IB12 = no supplemental Co plus weekly 10 mL vitamin B12 injections. 3Trt = treatment and Par = parity.
4Tendency for significant contrast of IB12 vs. mean of LCoGH and HCoGH (P = 0.10).
5Significant contrast of IB12 vs. mean of LCoGH and HCoGH (P < 0.01).
6Significant contrast of CoCarb vs. LCoGH (P = 0.02).
7Tendency for significant contrast of IB12 vs mean of LCoGH and HCoGH (P = 0.07).
8Significant contrast of Control vs. mean of LCoGH and HCoGH (P = 0.01).
9Significant contrast of IB12 vs mean of LCoGH and HCoGH (P < 0.01).
10Significant contrast of Control vs. mean of LCoGH and HCoGH (P = 0.03).
11Significant contrast of IB12 vs mean of LCoGH and HCoGH (P < 0.01).

73
Table 9. Effect of treatment by parity by time on milk vitamin B12 concentration (pg/ml)1
Month of Lactation
Treatment2 1 2 3 4 5 SEM
Primiparous
Control 1314 1641 1186 1443 1668 306
CoCarb 2266 1769 1594 1650 1745 300
LCoGH 2409 1895 1721 1741 1842 305
HCoGH 2883 1962 1793 1827 2167 316
IB12 7904 4519 3222 3672 3814 290
Multiparous
Control 2099 1427 1472 1844 1659 306
CoCarb 2773 2258 1852 2084 2138 299
LCoGH 3106 1930 1814 2023 2254 327
HCoGH 2241 1738 1537 1900 2273 300
IB12 6891 3894 3353 3432 3614 289 1Significant treatment by parity by time interaction (P =0.03).
2Control = no supplemental Co; CoCarb = 25 mg supplemental Co/d from Co carbonate; LCoGH
= 25 mg supplemental Co/d from Co glucoheptonate (Zinpro Corp., Eden Prairie, MN); HCoGH
= 75 mg supplemental Co/d from Co glucoheptonate; IB12 = no supplemental Co plus weekly 10
mL vitamin B12 injections.

74
Figure 2. Effect of treatment by time interaction on milk vitamin B12 yield (µg/d). Control = no
supplemental Co; CoCarb = 25 mg supplemental Co/d from Co carbonate; LCoGH = 25 mg
supplemental Co/d from Co glucoheptonate (Zinpro Corp., Eden Prairie, MN); HCoGH = 75 mg
supplemental Co/d from Co glucoheptonate ; IB12 = no supplemental Co plus weekly 10 mL
vitamin B12 injections. Treatment × time, P < 0.01.
0
50
100
150
200
250
300
1 2 3 4 5
Mil
k v
itam
in B
12 y
ield
, µ
g/d
Month of Lactation
Control
CoCarb
LCoGH
HCoGH
IB12
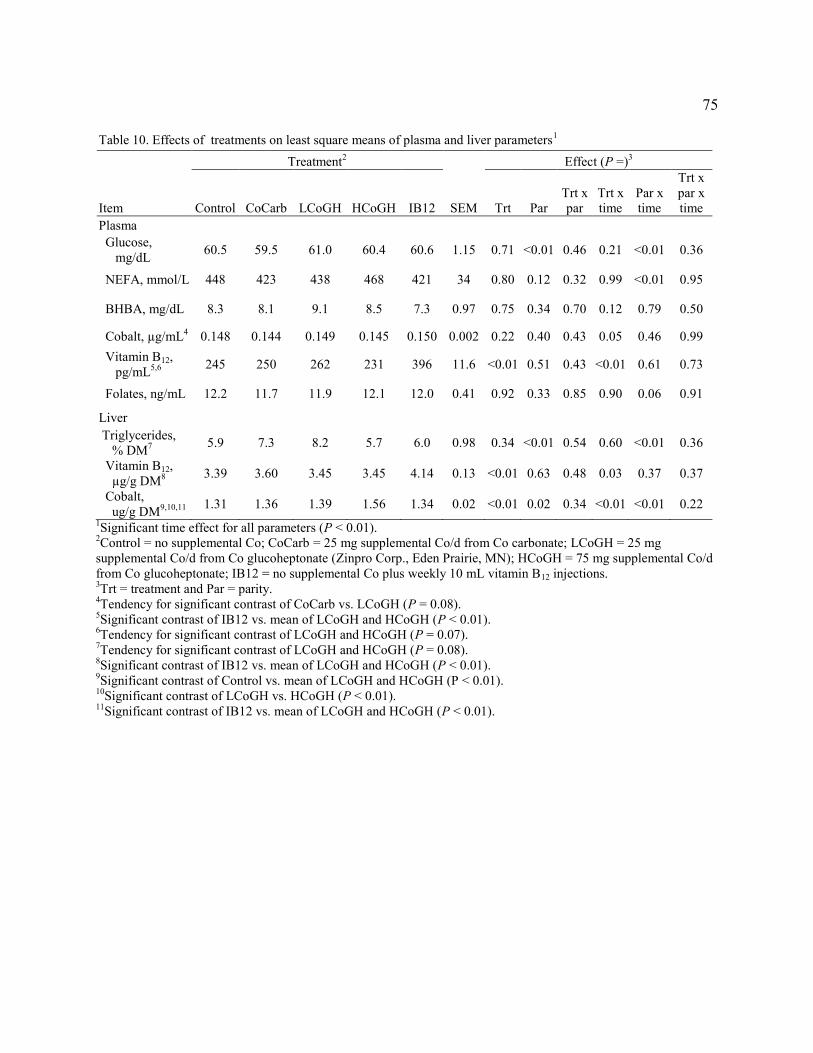
75
Table 10. Effects of treatments on least square means of plasma and liver parameters
1
Treatment2 Effect (P =)
3
Item Control CoCarb LCoGH HCoGH IB12 SEM Trt Par
Trt x
par
Trt x
time
Par x
time
Trt x
par x
time
Plasma
Glucose,
mg/dL 60.5 59.5 61.0 60.4 60.6 1.15 0.71 <0.01 0.46 0.21 <0.01 0.36
NEFA, mmol/L
448 423 438 468 421 34 0.80 0.12 0.32 0.99 <0.01 0.95
BHBA, mg/dL 8.3 8.1 9.1 8.5 7.3 0.97 0.75 0.34 0.70 0.12 0.79 0.50
Cobalt, µg/mL4
0.148 0.144 0.149 0.145 0.150 0.002 0.22 0.40 0.43 0.05 0.46 0.99
Vitamin B12,
pg/mL5,6 245 250 262 231 396 11.6 <0.01 0.51 0.43 <0.01 0.61 0.73
Folates, ng/mL
12.2 11.7 11.9 12.1 12.0 0.41 0.92 0.33 0.85 0.90 0.06 0.91
Liver
Triglycerides,
% DM7 5.9 7.3 8.2 5.7 6.0 0.98 0.34 <0.01 0.54 0.60 <0.01 0.36
Vitamin B12,
µg/g DM8 3.39 3.60 3.45 3.45 4.14 0.13 <0.01 0.63 0.48 0.03 0.37 0.37
Cobalt,
ug/g DM9,10,11 1.31 1.36 1.39 1.56 1.34 0.02 <0.01 0.02 0.34 <0.01 <0.01 0.22
1Significant time effect for all parameters (P < 0.01).
2Control = no supplemental Co; CoCarb = 25 mg supplemental Co/d from Co carbonate; LCoGH = 25 mg
supplemental Co/d from Co glucoheptonate (Zinpro Corp., Eden Prairie, MN); HCoGH = 75 mg supplemental Co/d
from Co glucoheptonate; IB12 = no supplemental Co plus weekly 10 mL vitamin B12 injections. 3Trt = treatment and Par = parity.
4Tendency for significant contrast of CoCarb vs. LCoGH (P = 0.08).
5Significant contrast of IB12 vs. mean of LCoGH and HCoGH (P < 0.01).
6Tendency for significant contrast of LCoGH and HCoGH (P = 0.07).
7Tendency for significant contrast of LCoGH and HCoGH (P = 0.08).
8Significant contrast of IB12 vs. mean of LCoGH and HCoGH (P < 0.01).
9Significant contrast of Control vs. mean of LCoGH and HCoGH (P < 0.01).
10Significant contrast of LCoGH vs. HCoGH (P < 0.01).
11Significant contrast of IB12 vs. mean of LCoGH and HCoGH (P < 0.01).
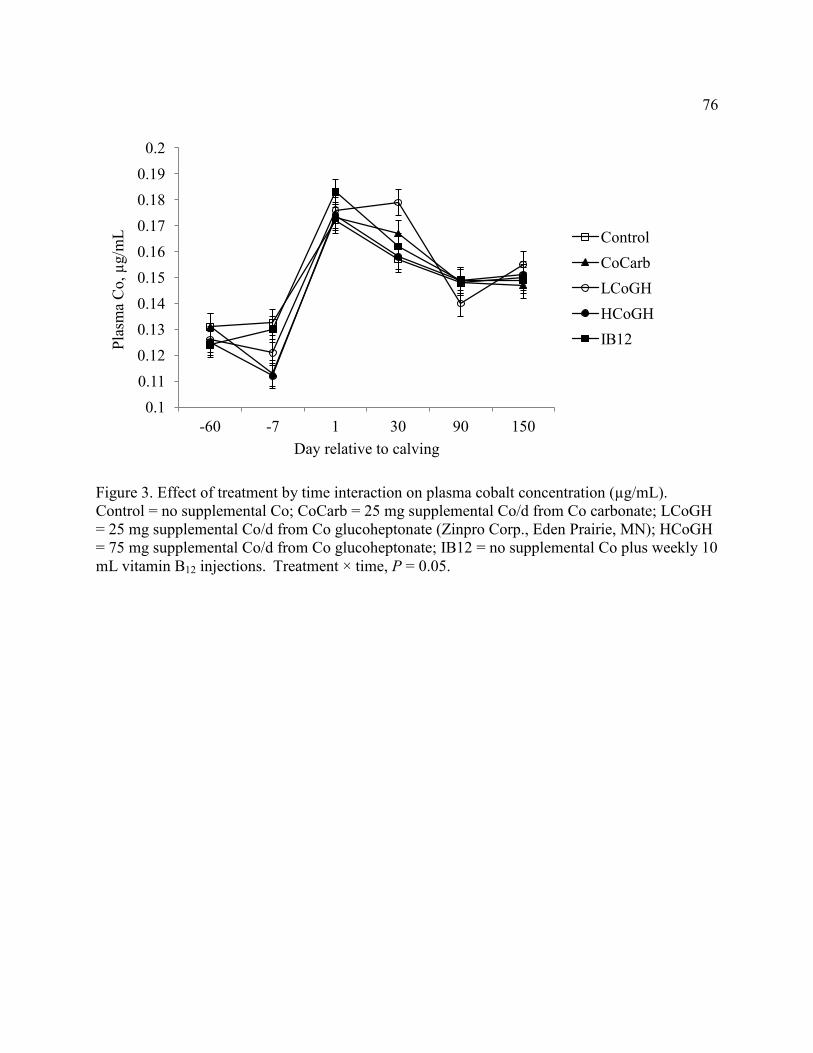
76
Figure 3. Effect of treatment by time interaction on plasma cobalt concentration (µg/mL).
Control = no supplemental Co; CoCarb = 25 mg supplemental Co/d from Co carbonate; LCoGH
= 25 mg supplemental Co/d from Co glucoheptonate (Zinpro Corp., Eden Prairie, MN); HCoGH
= 75 mg supplemental Co/d from Co glucoheptonate; IB12 = no supplemental Co plus weekly 10
mL vitamin B12 injections. Treatment × time, P = 0.05.
0.1
0.11
0.12
0.13
0.14
0.15
0.16
0.17
0.18
0.19
0.2
-60 -7 1 30 90 150
Pla
sma
Co
, µ
g/m
L
Day relative to calving
Control
CoCarb
LCoGH
HCoGH
IB12
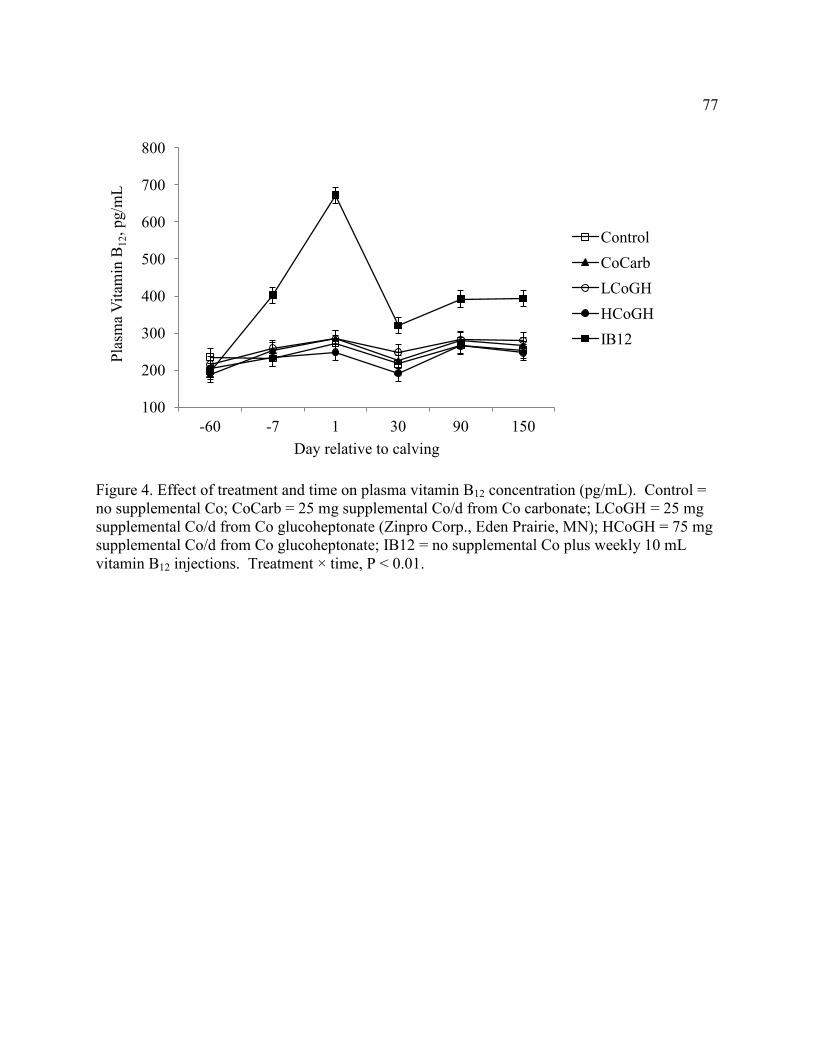
77
Figure 4. Effect of treatment and time on plasma vitamin B12 concentration (pg/mL). Control =
no supplemental Co; CoCarb = 25 mg supplemental Co/d from Co carbonate; LCoGH = 25 mg
supplemental Co/d from Co glucoheptonate (Zinpro Corp., Eden Prairie, MN); HCoGH = 75 mg
supplemental Co/d from Co glucoheptonate; IB12 = no supplemental Co plus weekly 10 mL
vitamin B12 injections. Treatment × time, P < 0.01.
100
200
300
400
500
600
700
800
-60 -7 1 30 90 150
Pla
sma
Vit
amin
B1
2, pg/m
L
Day relative to calving
Control
CoCarb
LCoGH
HCoGH
IB12
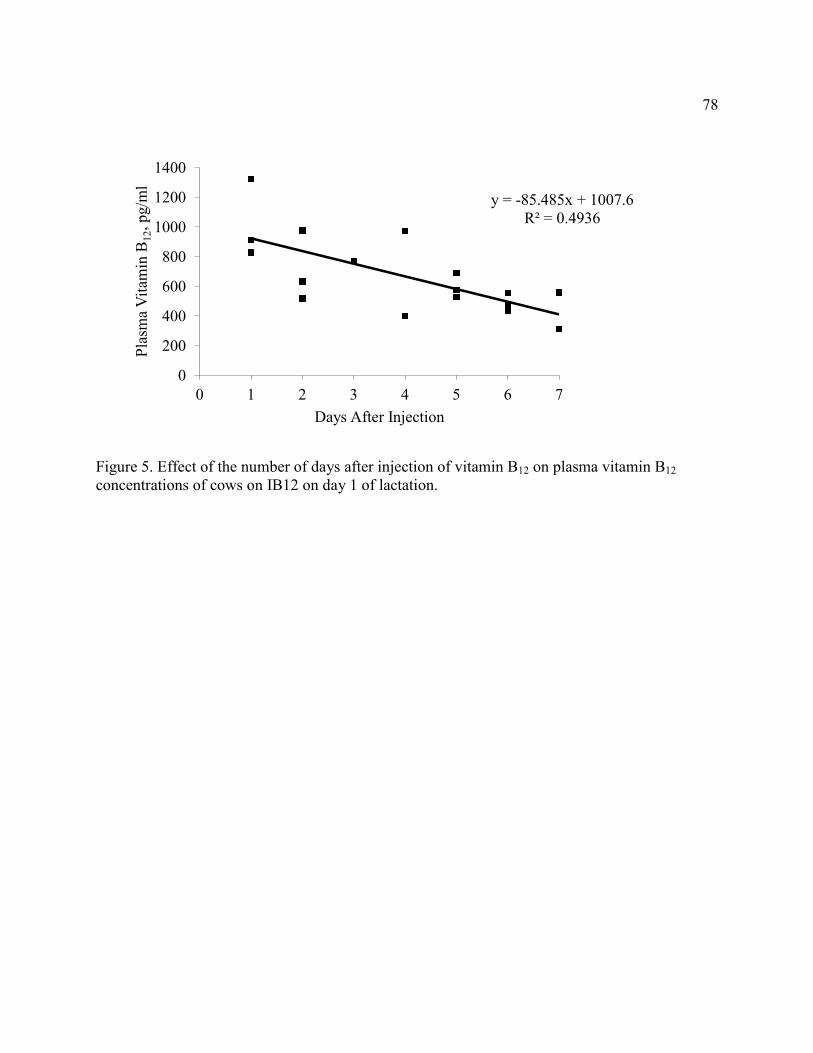
78
Figure 5. Effect of the number of days after injection of vitamin B12 on plasma vitamin B12
concentrations of cows on IB12 on day 1 of lactation.
y = -85.485x + 1007.6
R² = 0.4936
0
200
400
600
800
1000
1200
1400
0 1 2 3 4 5 6 7
Pla
sma
Vit
amin
B1
2, pg/m
l
Days After Injection
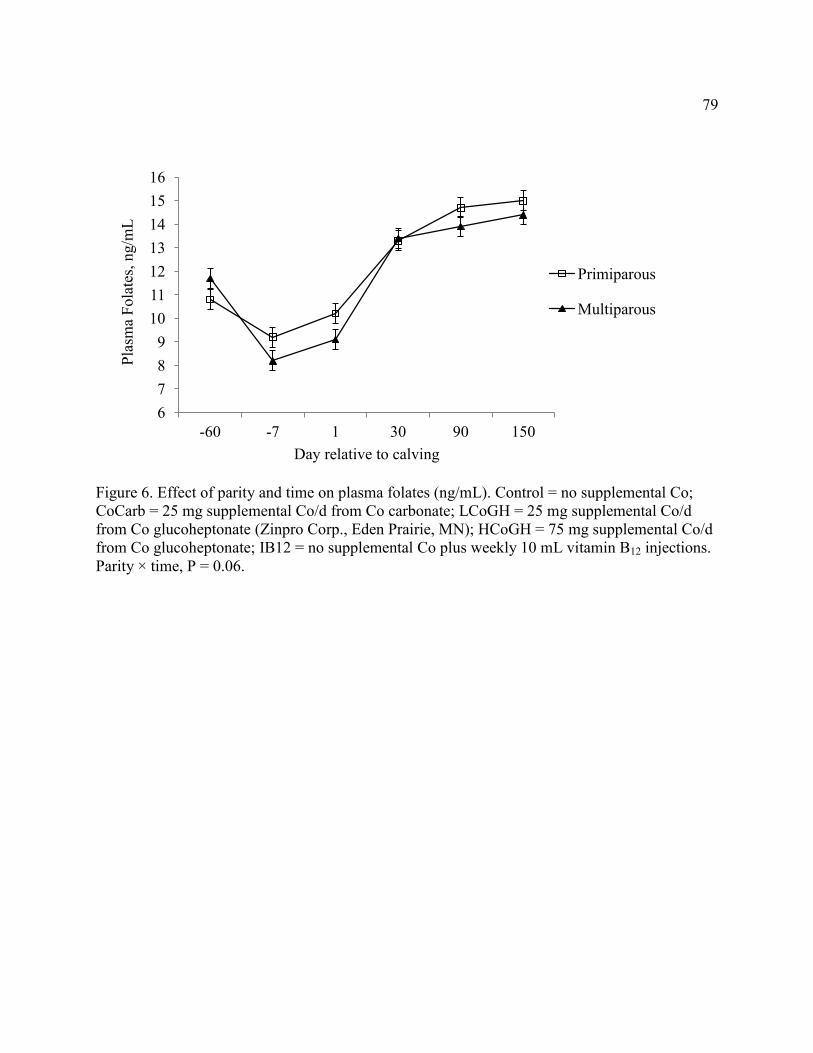
79
Figure 6. Effect of parity and time on plasma folates (ng/mL). Control = no supplemental Co;
CoCarb = 25 mg supplemental Co/d from Co carbonate; LCoGH = 25 mg supplemental Co/d
from Co glucoheptonate (Zinpro Corp., Eden Prairie, MN); HCoGH = 75 mg supplemental Co/d
from Co glucoheptonate; IB12 = no supplemental Co plus weekly 10 mL vitamin B12 injections.
Parity × time, P = 0.06.
6
7
8
9
10
11
12
13
14
15
16
-60 -7 1 30 90 150
Pla
sma
Fola
tes,
ng/m
L
Day relative to calving
Primiparous
Multiparous

80
Figure 7. Effect of treatment and time on liver cobalt (µg/g DM). Control = no supplemental Co;
CoCarb = 25 mg supplemental Co/d from Co carbonate; LCoGH = 25 mg supplemental Co/d
from Co glucoheptonate (Zinpro Corp., Eden Prairie, MN); HCoGH = 75 mg supplemental Co/d
from Co glucoheptonate; IB12 = no supplemental Co plus weekly 10 mL vitamin B12 injections.
Treatment × time, P < 0.01.
0.8
0.9
1
1.1
1.2
1.3
1.4
1.5
1.6
1.7
1.8
-60 1 30 90 150
Liv
er C
o, µ
g/g
DM
Day relative to calving
Control
CoCarb
LCoGH
HCoGH
IB12
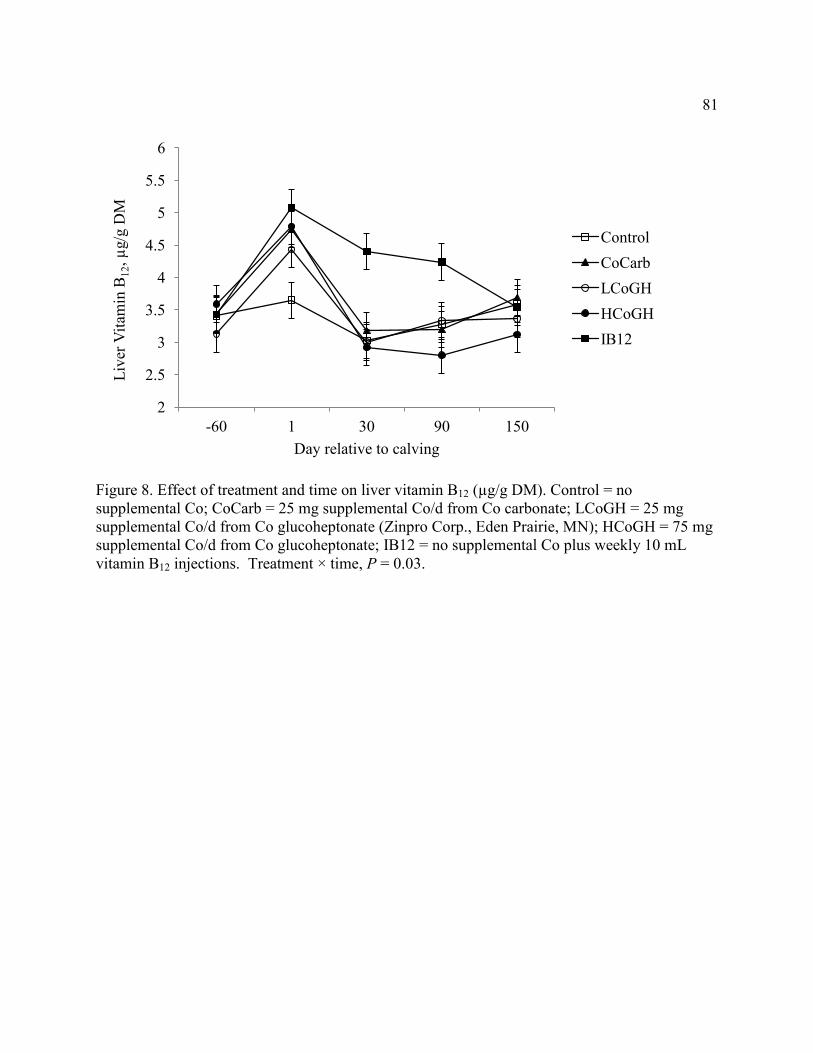
81
Figure 8. Effect of treatment and time on liver vitamin B12 (µg/g DM). Control = no
supplemental Co; CoCarb = 25 mg supplemental Co/d from Co carbonate; LCoGH = 25 mg
supplemental Co/d from Co glucoheptonate (Zinpro Corp., Eden Prairie, MN); HCoGH = 75 mg
supplemental Co/d from Co glucoheptonate; IB12 = no supplemental Co plus weekly 10 mL
vitamin B12 injections. Treatment × time, P = 0.03.
2
2.5
3
3.5
4
4.5
5
5.5
6
-60 1 30 90 150
Liv
er V
itam
in B
12, µ
g/g
DM
Day relative to calving
Control
CoCarb
LCoGH
HCoGH
IB12

82
Chapter 3
Thesis Conclusions and Potential Research Projects
Thesis Conclusions
From this thesis we determined the impact of dietary cobalt supplementation above NRC
(2001) requirements and vitamin B12 injections on lactation performance, energy metabolism,
and vitamin B12 status in dairy cattle. The feeds used in the study proved to be higher in cobalt
than anticipated and the level of cobalt in the control lactation diet (1.0 mg/kg DM) was 9-fold
higher than the NRC (2001) requirement of 0.11 mg/kg DM. Dry matter intake, body weight,
and energy balance during the dry period and lactation were not influenced by treatment. Milk
yield was not significantly affected by treatment, however, cows fed cobalt carbonate tended to
have lower milk yield than cobalt glucoheptonate at similar cobalt concentrations. Milk protein
content tended to be improved for cows injected with vitamin B12 compared to the mean of both
levels of organic cobalt, but protein yield was not different. Other measures of lactation
performance were not significantly affected by treatments. Plasma glucose, non-esterified fatty
acids (NEFA), and β-hydroxybutyric acid (BHBA) levels were also not affected by treatments.
Liver triglyceride was affected by a parity by time interaction such that multiparous and
primiparous cows had similar levels 60 d prior to calving, but multiparous cows had greater
increases at calving and 30 d postpartum than primiparous cows. Most of the measures of
vitamin B12 status indicated that cobalt supplementation improved vitamin B12 status. Plasma
vitamin B12 concentrations were only increased for cows receiving vitamin B12 injections.
Similar to previous studies, plasma vitamin B12 concentrations for all treatments increased until
calving, decreased post-calving to a nadir at 30 d postpartum, and increased to a plateau by 90 d

83
postpartum. This is evidence that the cow may have lower vitamin B12 status during early
lactation due to secretion of vitamin B12 in milk. Cobalt supplementation increased milk vitamin
B12 concentration and yield compared to control. Also, cobalt supplementation increased liver
vitamin B12 concentration at calving compared to control. These improvements in vitamin B12
concentrations indicate increased ruminal vitamin B12 synthesis and overall vitamin B12 status
from cobalt supplementation above requirements. Vitamin B12 injections improved all measures
of vitamin B12 status as expected. Folate status was lower than in studies that observed an effect
of vitamin B12 injections on lactation performance (Girard and Matte, 2005). Cows with low
folate status have not had lactation responses to additional vitamin B12 so the use of folate
supplementation may be needed to observe lactation responses to supplemental cobalt or vitamin
B12 injections. From this finding additional research is warranted to determine the interaction of
cobalt, vitamin B12, and folate status on lactation performance.
Future Research
Project 1
Research on the interaction of vitamin B12 and folate related to lactation performance and
metabolism has greatly increased in the past 10 years due to work by C.L. Girard in Canada.
This research has shown variable results using either dietary supplementation or injections of
folate and vitamin B12. Dairy cattle have reduced vitamin B12 status during early lactation until
approximately 8-12 weeks into lactation (Girard and Matte, 1999). Primiparous dairy cows
supplemented with folic acid and rumen-protected methionine and given weekly vitamin B12
injections had improved energy corrected milk yield compared to cows not given vitamin B12
84
injections. Also, methionine is interrelated to folate and vitamin B12 through the methionine
cycle. Folate supplementation to cows fed diets meeting 70% of methionine requirement
improved milk protein content similar to cows that were fed rumen-protected methionine, but
supplemental folate did not improve milk parameters when methionine requirements were met
(Girard et al., 2005). A full factorial arrangement of treatments involving vitamin B12, folate,
and methionine has not been used in previous studies. Instead, partial factorial arrangements
were used. For example, Preynat et al. (2009) used a 2 x 3 factorial arrangements such that there
were 2 levels of dietary methionine supplementation and within each level of methionine cows
were given either no vitamin supplement, or injections of only folic acid, or a combination of
folic acid and vitamin B12. This study found a significant increase in milk production efficiency
and a tendency for increased milk yield for cows given both folic acid and vitamin B12.
However, the authors could not determine if it was the combination of the vitamins or vitamin
B12 alone since a treatment with injections of only vitamin B12 was not tested. A future research
project is warranted using a full factorial arrangement of treatments to fully elucidate the main
effects of and interactions between methionine, folate, and vitamin B12. A future project would
be a study using a 3 factor factorial arrangement of treatments of vitamin B12, folic acid, and
methionine in transition dairy cows. Methionine would be supplemented or not in the diet as
rumen-protected methionine and the vitamins through injections to isolate the effects of the
vitamins to cow metabolism. Measurements needed include feed composition including cobalt,
feed intake, milk yield and components including vitamin B12, and plasma concentrations of
methionine, vitamin B12, folates, homocysteine, and methylmalonic acid. Homocysteine is a
measure of both vitamin B12 and folate status since both are necessary for its conversion to
85
methionine. Methylmalonic acid is a sensitive indicator of vitamin B12 status that is independent
of folate status. Liver concentration of vitamin B12 is also useful for evaluating vitamin B12
status. Additionally, liver mRNA levels and functionality of enzymes that vitamin B12 and folate
are involved with would be beneficial to understanding how the enzymes are affected by the
treatments.
Project 2
As discussed previously, results from Chapter 2 indicate improvement in vitamin B12
status when cows are supplemented with dietary cobalt at concentrations of approximately 2
mg/kg DM during lactation compared to the control diet of 1 mg/kg DM. However folate status
was low especially around calving and early lactation and possibly limited the effect of increased
vitamin B12 status on lactation performance. Future research is warranted to determine if
supplementation with folic acid is needed to observe a lactation response to supplemental cobalt.
Based upon results from Project 1 involving the interaction of vitamin B12, folate, and
methionine, a study would be designed to maximize the possibility to observe effects of
supplemental cobalt. This study would involve either including or not including supplemental
methionine or folate that would be needed to elicit a lactation response to an improvement in
vitamin B12 status. Measurements would be similar to the previously discussed future project,
but also include analysis of cobalt in milk, plasma, and liver.

86
Project 3
Research on cobalt and vitamin B12 nutrition in dairy cattle has focused on both rumen
synthesis of vitamin B12 and lactation performance when varying levels of cobalt are fed or
vitamin B12 injections are given. Feeding cobalt above the requirement of 0.11 mg/kg DM
(NRC, 2001) has increased ruminal vitamin B12 synthesis in dairy cows (Stemme et al., 2008)
and increased rumen fluid vitamin B12 concentrations in beef cattle (Tiffany and Spears, 2005).
Tiffany and Spears (2005) found a differential effect of cobalt on corn or barley-based diets with
only an increase in vitamin B12 concentrations on corn-based diets. In addition, feeding cobalt at
0.2 to 0.25 mg/kg DM has shown to maximize plasma and liver vitamin B12 concentrations in
beef steers (Stangl et al., 2000). Ruminal vitamin B12 synthesis is also influenced by diet
nutrient content with diet NDF and sugar content positively correlated and NFC and starch
negatively correlated with vitamin B12 synthesis (Schwab et al., 2006). Future research is
warranted on the interaction of dietary cobalt and nutrient content on ruminal vitamin B12
synthesis in dairy cattle. To measure ruminal vitamin B12 synthesis, the omasal sampling
technique would be used to eliminate the need for duodenally cannulated cows. Since omasal
sampling is difficult and previous research shows effects of diet composition, measurement of
the other B-vitamins would be done to gather as much information from the samples taken.
Studies that varied the levels of NDF, sugar, and cobalt content would potentially provide
estimates of maximal vitamin B12 synthesis since all the factors are positively correlated with
vitamin B12 synthesis. Also, measures of nutrient digestibility, milk production and components
including B-vitamins would be performed
87
Project 4
Monensin supplementation also may affect B-vitamin production by rumen bacteria,
however, no reports were found for dairy cattle. Measuring changes in B-vitamin production due
to monensin supplementation may reveal possible strategies for B-vitamin supplementation for
cows fed monensin. A future study would be similar to Project 3 but with diets either
supplemented or not with monensin.
Project 5
Another future research project related to vitamin B12 is the possible interaction of
monensin use and vitamin B12 status. Feeding monensin to dairy cattle is a popular means to
increase milk production efficiency of dairy cattle. Monensin is an ionophore that alters the
rumen microbial population and shifts the rumen fermentation to produce less acetate and more
propionate. Vitamin B12 is necessary for the conversion of propionate to succinate for entry to
the Kreb’s cycle and later gluconeogenesis in the liver. The ruminant liver uses propionate to
synthesize 50-75% of the animal’s glucose requirements (Bergman, 1990). Monensin
supplementation in transition dairy cows has increased plasma glucose levels, reduced plasma
NEFA and BHBA levels (Duffield et al., 2008) and reduced the incidence of ketosis (Duffield et
al., 1998). Also, recent studies using a combination of vitamin B12 and butaphosphan, a
phosphorous containing compound, reduced plasma BHBA and NEFA concentrations post-
calving (Fürll et al., 2010 and Rollin et al., 2010). Plasma concentrations of phosphorous were
not changed by the supplement so it is likely the effect of the treatment was due to the vitamin
B12. There have been no reports in the literature on the combination of monensin and vitamin
B12 to prevent ketosis and improve lactation performance. Future research is needed to evaluate
88
the possible relationship between monensin usage and vitamin B12 and the effect on transition
dairy cows. A future project would use 500 prepartum dairy cows beginning 4 wk prior to
calving. Cows would be housed in pens at a commercial dairy facility. A 2 x 2 factorial
arrangement of treatments with 2 levels of monensin supplementation (unsupplemented or
supplemented) using a controlled release capsule and 2 levels of vitamin B12 injections (not
injected or weekly injections of 10 mg vitamin B12). Monensin capsules would be given 4 wk
prior to calving to provide a dose of 335 mg monensin/d for 95 d. Measurements of milk yield
and composition, and plasma glucose, NEFA, BHBA, vitamin B12, folates, homocysteine, and
methylmalonic acid would be taken. Disease incidence data would be taken from the dairy
management software. Liver biopsy sampling on a randomly selected subset of cows would
allow measurement of liver B12, triglycerides, mRNA and functionality of enzymes involved in
propionate metabolism. Dry matter intake or measures of efficiency would not be possible since
the cows are housed in large pens.
89
References
Bergman, E. N. 1990. Energy contributions of volatile fatty acids from the gastrointestinal tract
in various species. Physiol. Rev. 70(2):567-590.
Duffield, T. F., D. Sandals, K. E. Leslie, K. Lissemore., B. W. McBride, J. H. Lumsden, P. Dick,
and R. Bagg. 1998. Efficacy of monensin for the prevention of subclinical ketosis in lactating
dairy cows. J. Dairy Sci. 81:2866–2873.
Duffield, T. F., A. R. Rabiee, and I. J. Lean. 2008. A Meta-analysis of the impact of monensin in
lactating dairy cattle. Part 1. Metabolic effects. J. Dairy Sci. 91:1334–1346.
Fürll, M., A. Deniz, B. Westphal, C. Illing, and P. D. Constable. 2010. Effect of multiple
intravenous injections of butaphosphan and cyanocobalamin on the metabolism of periparturient
dairy cows. J. Dairy Sci. 93:4155–4164.
Girard, C.L. and J.J. Matte. 1999. Changes in serum concentrations of folates, pyridoxal,
pyridoxal-5-phosphate and vitamin B12 during lactation of dairy cows fed dietary supplements of
folic acid. Can. J. Anim. Sci. 79: 107–113.
Girard, C.L. and J.J. Matte. 2005. Effects of intramuscular injections of vitamin B12 on lactation
performance of dairy cows fed dietary supplements of folic acid and rumen-protected
methionine. J. Dairy Sci. 88:671-676.
90
National Research Council. 2001. Nutrient Requirements of Dairy Cattle 6th
rev. ed. Natl. Acad.
Sci. Washington, DC.
Preynat, A., H. Lapierre, M.C. Thivierge, M.F. Palin, J.J. Matte, A. Desroches, and C.L. Girard.
2009. Influence of methionine supply on the response of lactational performance of dairy cows
to supplementary folic acid and vitamin B12. J. Dairy Sci. 92:1685-1695.
Rollin, E., R. D. Berghaus, P. Rapnicki, S. M. Godden, and M. W. Overton. 2010. The effect of
injectable butaphosphan and cyanocobalamin on postpartum serum β-hydroxybutyrate, calcium,
and phosphorous concentrations in dairy cattle. J. Dairy Sci. 93:978-987.
Schwab, E.C., C.G. Schwab, R.D. Shaver, C.L. Girard, D.E. Putnam, and N.L Whitehouse. 2006.
Dietary forage and nonfiber carbohydrate contents influence B-vitamin intake, duodenal flow,
and apparent ruminal synthesis in lactating dairy cows. J. Dairy Sci. 89:174-187.
Stangl, G.I., F.J. Schwarz, H. Müller, and M. Kirchgessner. 2000. Evaluation of the cobalt
requirement of beef cattle based on vitamin B12, folate, homocysteine, and methylmalonic acid.
Brit. J. Nutr. 84:645-653.
Tiffany, M.E. and J.W. Spears. 2005. Differential responses to dietary cobalt in finishing steers
fed corn- versus barley-based diets. J. Anim. Sci. 83:2580-2589.