effects of coconut oil supplementation on biomarkerscollected to study the effects of coconut oil...
TRANSCRIPT

Effects of Coconut Oil Supplementation on Biomarkers
of Inflammation and Lipid Peroxidation
by
Lisa Norman
A Thesis Presented in Partial Fulfillment of the Requirements for the Degree
Master of Science
Approved April 2017 by the Graduate Supervisory Committee:
Carol Johnston, Chair
Christina Shepard Melissa Ellis
ARIZONA STATE UNIVERSITY
May 2017

i
ABSTRACT
Objective: The purpose of this randomized, placebo-controlled trial was to investigate the
effect a daily coconut oil supplement (2 grams) would have on a common serum marker
of systemic inflammation (C-reactive protein) and an indicator of oxidative stress
(TBARS) when compared to the control group receiving a placebo capsule (white flour)
in healthy, sedentary adults between the ages of 18-40 in Phoenix, Arizona.
Design: This study was designed as secondary analyses of blood samples originally
collected to study the effects of coconut oil supplementation on blood lipids and body
composition. The original study consisted of 32 healthy, adult volunteers recruited from
the Arizona State University campus in Phoenix, Arizona. Participants followed no food
restrictions or special diets, exercised less than 150 minutes per week, had no diagnoses
of chronic disease, were not taking statin medications, were non-smokers, and no female
participants were pregnant. Participants were randomized into either the Coconut Oil
group (CO) or the Placebo group (PL) at week 0, and baseline blood samples and
anthropometric measurements were obtained. Each participant completed an 8-week
protocol consisting of two supplement capsules daily (coconut oil or placebo). Final
fasting blood samples and anthropometric measurements were taken at week 8. This
study analyzed the blood samples for measurements of C-reactive protein (CRP) and
thiobarbituric reactive substance (TBARS).
Results: Eight weeks of 2 grams per day coconut oil supplementation, in comparison to
placebo treatment, did not significantly reduce serum CRP ( -13% and +51%

ii
respectively, p=0.183) but did significantly increase TBARS ( +16% and -27%
respectively, p=0.049).
Conclusions: Coconut oil supplementation (2 g/day) may impact lipid peroxidation as
indicated by an increase in plasma TBARS concentration. Future trials are necessary to
corroborate these results using other indices of fatty peroxide formation.

iii
DEDICATION
This work is dedicated to my parents, John Rooyakkers, and Beverly & Dennis Wilkie,
who always made me believe I can accomplish anything with motivation and diligence.
I would also like to dedicate this to my son, Eric Norman, to Judy Borden, to Michael
Stroup, and to my grandma, Helen Rooyakkers. Without your love, support, and
encouragement, I would not be the person I am today.

iv
ACKNOWLEDGMENTS
I would like to express my sincere gratitude and immeasurable respect to Dr. Carol
Johnston and Tina Shepard. Thank you so much for your expertise, support,
encouragement, advice, assistance, and for never giving up on me through the challenges
I’ve faced in reaching this goal. I would also like to thank Melissa Ellis for taking the
time to be on my thesis committee. I sincerely appreciate your daily encouragement,
understanding, knowledge, and inspiration.
v
TABLE OF CONTENTS
Page
LIST OF TABLES ......................................................................................................... vii
LIST OF FIGURES ....................................................................................................... viii
CHAPTER
I. INTRODUCTION ........................................................................................................ 1
A. Overview ........................................................................................................ 1
B. Purpose of Study ............................................................................................. 2
C. Research Aim and Hypothesis ........................................................................ 2
D. Definition of Terms ......................................................................................... 2
E. Delimitations and Limitations ......................................................................... 3
II. LITERATURE REVIEW ............................................................................................. 5
A. Coconut Oil ......................................................................................................5
B. Composition of Coconut Oil ............................................................................6
C. Possible Risks and Side Effects of Coconut Oil Consumption .......................13
D. Reported Health Benefits of Coconut Oil .......................................................15
E. Inflammation ...................................................................................................21
III. METHODS ................................................................................................................. 29
A. Participants ......................................................................................................29
B. Study Design….. .............................................................................................30
IV. DATA AND RESULTS ............................................................................................. .32

vi
CHAPTER Page
V. DISCUSSION ............................................................................................................. 37
A. Strengths ........................................................................................................ 39
B. Limitations ..................................................................................................... 39
C. Conclusion ..................................................................................................... 39
REFERENCES ..................................................................................................................... 40
APPENDIX
A IRB APPROVAL .......................................................................................... 46
B TBARS ASSAY ............................................................................................ 49
C CRP ASSAY ................................................................................................. 52
vii
LIST OF TABLES
Table Page
1. Baseline Characteristics of Each Study Group ...................................................................... 33
2. Pre- and Post-Intervention Serum CRP Measurements ......................................................... 34
3. Pre- and Post-Intervention Serum TBARS Measurements ................................................... 35

viii
LIST OF FIGURES
Figure Page
1. Comparison of the Fatty Acid Composition of Selected Edible Oils and Fats ..................... . 7
2. Overview of Fatty Acid Metabolism ..................................................................................... . 9
3. Mean Total Phenolic Content of Virgin Coconut Oil and Refined Coconut Oil. ................. 12
4. Comparison of CRP Between Test and Placebo Groups at Baseline and Week 8 ................ 35
5. Comparison of TBARS Between Test and Placebo Groups at Baseline and Week 8 .......... 36

1
Chapter 1
INTRODUCTION
Overview
Chronic inflammation and oxidative stress are associated with several age-related
conditions including weakness/frailty, dementia, diabetes, atherosclerosis, cardiovascular
disease, metabolic syndrome, and cancer. It is estimated that 25% of cancer diagnoses
globally may be related to chronic inflammation28. Recently, coconut oil and its
components have been promoted as functional foods, meaning they provide benefits such
as disease prevention and improved health in addition to simple nutrition. Limited studies
suggest coconut oil may reduce acute and chronic inflammation, as well as prevent
excessive oxidation. Because the accumulated effects over time have such damaging
effects, it is of interest to investigate the possible anti-inflammatory and anti-oxidant
properties of coconut oil.
Certain dietary components such as fatty acids are known to affect inflammation, while
polyphenols exhibit anti-oxidant activities. Coconut oil contains a high amount of lauric
acid, and has been shown to reduce markers of inflammation in animal studies20, 24, 67.
Decreased levels of oxidation markers have also been reported in animals fed coconut
oil39, 40, 41. Although studies are limited, evidence suggests both anti-inflammatory and
anti-oxidant properties of coconut oil. It would be beneficial to investigate these effects in
human studies.
No research was found that specifically studied the effect of dietary coconut oil
supplementation on serum markers of inflammation or oxidative stress in humans. If
coconut oil intake can reduce inflammation (biomarker: C reactive protein [CRP]) and/or
2
lipid peroxidation (biomarker: thiobarbituric acid reactive substance [TBARS]),
replacing pro-inflammatory oils in the diet - such as soybean and corn oils - with coconut
oil may reduce the incidence of cardiovascular events and age-related diseases.
Purpose of Study
The purpose of this study was to determine the effect of a daily coconut oil supplement (2
grams) on clinical markers of chronic inflammation and oxidative stress as compared to a
placebo (white flour). Each experimental group consumed two one-gram capsules daily
of either the coconut oil supplement or placebo. Few clinical studies have examined the
relationship between coconut oil consumption and inflammation or oxidative stress.
Research Aim & Hypothesis
We hypothesized that a daily supplement of coconut oil would result in lower levels of
markers of inflammation (CRP) and oxidative stress (TBARS) when compared to a
placebo control in healthy adults.
Definition of Terms
Acute Inflammation: Acute inflammation is the initial process the body employs to
protect itself from trauma or invading pathogens. It involves a cascade of events, which
includes the activation of endothelial cells and tissue macrophages; the recruitment of
leukocytes, granulocytes, and adhesion molecules; the activation of platelets and clotting
systems; and other systemic responses to resist pathogens and manage injuries. The acute
response increases rapidly within minutes to hours and declines gradually as the event is
resolved62. Symptoms of acute inflammation include fever, swelling, pain, rash, and
redness25.

3
Chronic Inflammation: Chronic inflammation is a prolonged state of mild to moderate
inflammation associated with mononuclear immune cells including lymphocytes,
macrophages, and plasma cells. The response is initiated by vascular adhesion molecules,
which interact with lymphocytes and monocytes that eventually migrate to extravascular
spaces62. Chronic inflammation can lead to tissue damage and fibrous tissue
accumulation28.
Oxidative Stress: Oxidative stress is a continued state of excessive production of reactive
oxygen species (ROS), which overwhelms the system of anti-oxidant defenses. Oxidative
stress damages cells and leads to cell death, which can contribute to cancer,
atherosclerosis, and other age-related diseases13.
Delimitations
Participants in this study were healthy, sedentary, adults between the ages of 18-40 years.
Our results may not apply to children, pregnant women, active adults, older adults, or
people who are overweight or have a chronic disease condition. Also, these results may
not generalize to other brands or coconut oil products, or to differing dosage levels.
Limitations
A limiting factor of this study is participant compliance. Although participants were
instructed to mark their daily supplement consumption on a provided compliance
calendar, investigators did not directly witness participants taking the supplement. A
second limitation is lack of a controlled diet or environment. Dietary and environmental
factors other than coconut oil likely affect serum markers of inflammation and lipid
peroxidation. The duration of the study and low dose of coconut oil may also affect the
results. A study lasting longer than eight weeks and/or a higher dose of coconut oil may

4
achieve different results. Finally, the method of coconut oil production could affect the
results (RCO vs VCO).

5
Chapter 2
LITERATURE REVIEW
A. Coconut Oil - Overview
Coconut oil is a mild flavored, mostly colorless oil produced from mature coconuts. It is
a clear liquid above 76°F (24C) and a white or light brown solid at lower temperatures.
Refined coconut oil (RCO) is produced by pressing dried coconut kernel (copra), and
then chemically refining, bleaching, and deodorizing the extracted oil. RCO can be
partially hydrogenated similar to vegetable oils by a reaction using hydrogen and a
catalyst. This process raises the melting point of the oil by reducing the number of double
bonds in the molecule. An undesirable effect is the creation of trans-fatty acids, which
increase cardiovascular risks similar to saturated fats1, 37.
Virgin coconut oil (VCO) is produced without chemicals or high heat15. According to
Onsaard et al (2005), the simplest method of obtaining unrefined coconut oil is from
coconut milk44. This “wet extraction” is a three-stage process that involves creaming the
coconut milk, clustering the oil globules, and allowing the globules to merge, or coalesce.
This method is a simple way to make coconut oil at home. Seow and Gwee (1997)
describe the process of extracting oil from coconut cream by chilling, freezing, and
thawing after centrifugation54. The oil can also be separated by fermentation. Che Man et
al (1997) successfully used Lactobacillus plantarum to extract 95% oil from a mixture of
50/50 grated coconut and water. In addition, various enzymes can be used to extract the
oil by breaking down the carbohydrate components of coconut meat10.
Coconut oil has a variety of uses ranging from food and cooking to industrial
applications. Throughout history, people have used coconut oil for its nutritional and

6
medicinal benefits. In tropical areas, coconut oil has been the main source of dietary fat
for centuries. It can be used as a shortening in baked goods, and because the smoke point
is about 360°F, coconut oil is an effective oil for medium-heat frying or sautéing. The
medium-chain triglyceride component of coconut oil is used in some parenteral
(intravenous) and enteral (tube) feeding formulas, as well as pre-term infant formulas
because these types of fatty acids are easier to digest and more rapidly metabolized8.
Coconut oil is a safe and effective moisturizer, produces a high-lather soap due to is
solubility in hard water, and can be used in cosmetics, toothpaste, lotions, sunscreens,
laundry detergents, as well as several other self-care and household items30.
B. Composition of Coconut Oil
According to the National Nutrient Database published by the United States Department
of Agriculture, one tablespoon of coconut oil provides 121 kilocalories, 13.7 grams total
lipid (fat), 0 grams protein, 0 grams carbohydrate, and less than significant amounts of
vitamins or minerals2.
Fatty Acids: Coconut oil contains 99.9% fatty acids. Saturated fatty acids (SFA) make up
by far the most prominent component (91.9%) of coconut oil. In comparison, butter
contains approximately 52% saturated fat. Although the connection between coconut oil
and cardiovascular disease has recently been questioned, current dietary
recommendations consider it a saturated fat, which should be consumed as less than 10%
of total energy intake22. The remaining fatty acids consist of (6.4%) monounsaturated
fatty acids (MUFA) and (1.5%) polyunsaturated fatty acids (PUFA). Because coconut oil
is a plant product, it does not contain cholesterol.
Although the saturated fatty acid content is higher than other edible oils, unlike long-

7
chain fatty acids (LCTs) in animal fats, the saturated fatty acids in coconut oil are mainly
short and medium-chain triglycerides (MCTs). Medium-chain triglycerides are
metabolized more efficiently than LCTs, and are used as energy rather than stored in
adipose tissue8, 35. Almost 50% of the fatty acid content of coconut oil is lauric acid
(C12), which is much higher than canola oil, butter, or palm oil (Figure 1). After a review
of the scientific literature, Fabian Dayrit (2014) concluded coconut oil should be more
specifically referred to as a “medium chain triglyceride” rather than a general “saturated
fat” due to distinct biochemical differences between C12 and long-chain fatty acids14.
Figure 1. Comparison of the fatty acid composition of selected edible oils and fats. SFA, saturated fatty acid; MUFA,
monounsaturated fatty acid; PUFA, polyunsaturated fatty acid. Data source: McCance and Widdowson's Composition of Foods (PHE
2015)30.
Medium-Chain Fatty Acids and Medium-Chain Triglycerides: Medium-chain fatty acids
(MCFAs) are saturated fatty acid molecules comprised of 6, 8, or 10 carbons. These
include capronic acid (C6, hexanoic acid); caprylic acid (C:8, octanoic acid); and capric
acid (C:10, decanoic acid). Many classifications also include lauric acid (C:12,
dodecanoic acid) because its biochemical actions are more similar to MCFAs than to
fatty acids comprised of 14 carbons or more. In general, triglycerides are composed of
three fatty acids attached to a small, three-carbon glycerol molecule. Medium-chain
20 0 40 60 80
C6:0 (SFA)
C8:0 (SFA)
C10:0 (SFA)
C12:0 (SFA)
C14:0 (SFA)
C16:0 (SFA)
C18:1 (MUFA)
C18:2 (PUFA)
C18:3 (PUFA)
% composition per 100 g fatty acids
Rapeseed oil Butter Palm oil Coconut oi l

8
triglycerides (MCT’s) are specifically triglycerides in which at least two of those fatty
acids are medium-chained in length34, 38.
Although most dietary fats are long-chain fatty acids (LCFAs), natural sources of
medium-chain triglycerides (MCTs) include tropical oils such as coconut and palm oils,
as well as cow’s milk and human mother’s milk. Commercial MCT oil is synthetically
produced by removing the MCFAs (mainly C:8 and C:10) from coconut or palm oil, and
then recombining the fatty acid molecules with glycerol in order to create MCT oil.
These oils are classified as Generally Regarded as Safe (GRAS) by the United States
Food and Drug Administration, and are used clinically to support nutrition in patients
requiring total parental nutrition or diagnosed with fat malabsorption, pancreatic
insufficiency, and other conditions related to impaired lipid metabolism34.
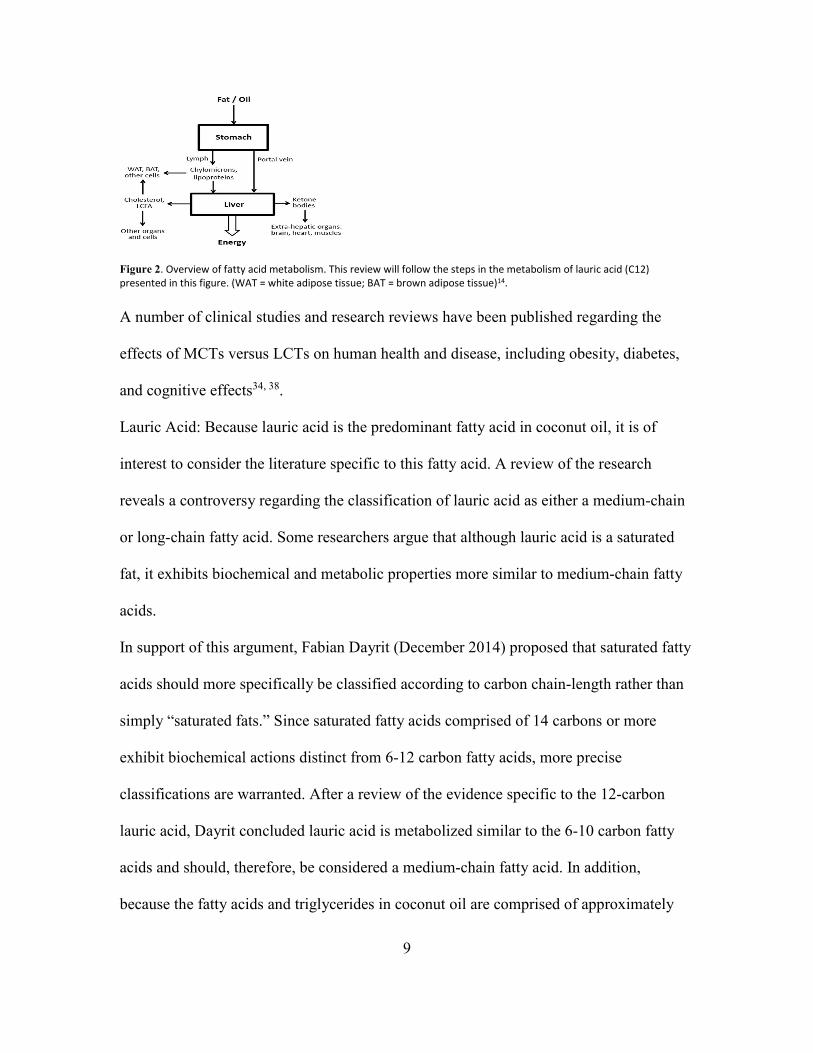
Due to their physical and chemical properties, medium-chain fatty acids are absorbed and
metabolized by the body more efficiently than long-chain fatty acids, which results in
differing physiological effects. While in the intestinal tract, MCTs are more easily broken
down into individual fatty acids than LCTs. Similarly, MCFAs are absorbed more
efficiently than LCFAs. After absorption, LCFAs are transported via chylomicrons
throughout the circulatory system before reaching the liver. MCFAs, on the other hand,
travel directly to the liver through the portal vein in order to be converted to energy
(Figure 2).
9
Figure 2. Overview of fatty acid metabolism. This review will follow the steps in the metabolism of lauric acid (C12)
presented in this figure. (WAT = white adipose tissue; BAT = brown adipose tissue)14.
A number of clinical studies and research reviews have been published regarding the
effects of MCTs versus LCTs on human health and disease, including obesity, diabetes,
and cognitive effects34, 38.
Lauric Acid: Because lauric acid is the predominant fatty acid in coconut oil, it is of
interest to consider the literature specific to this fatty acid. A review of the research
reveals a controversy regarding the classification of lauric acid as either a medium-chain
or long-chain fatty acid. Some researchers argue that although lauric acid is a saturated
fat, it exhibits biochemical and metabolic properties more similar to medium-chain fatty
acids.
In support of this argument, Fabian Dayrit (December 2014) proposed that saturated fatty
acids should more specifically be classified according to carbon chain-length rather than
simply “saturated fats.” Since saturated fatty acids comprised of 14 carbons or more
exhibit biochemical actions distinct from 6-12 carbon fatty acids, more precise
classifications are warranted. After a review of the evidence specific to the 12-carbon
lauric acid, Dayrit concluded lauric acid is metabolized similar to the 6-10 carbon fatty
acids and should, therefore, be considered a medium-chain fatty acid. In addition,
because the fatty acids and triglycerides in coconut oil are comprised of approximately
10
50% lauric acid, coconut oil is more correctly classified as a medium-chain triglyceride
oil than a saturated fat14.
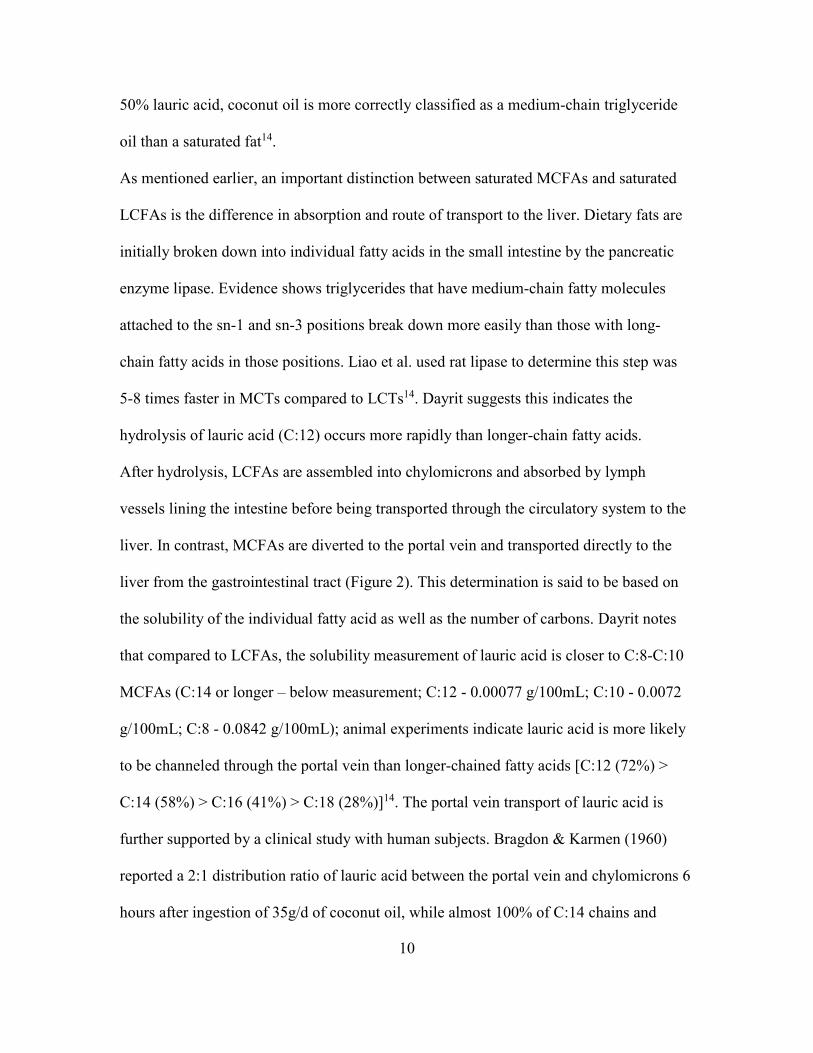
As mentioned earlier, an important distinction between saturated MCFAs and saturated
LCFAs is the difference in absorption and route of transport to the liver. Dietary fats are
initially broken down into individual fatty acids in the small intestine by the pancreatic
enzyme lipase. Evidence shows triglycerides that have medium-chain fatty molecules
attached to the sn-1 and sn-3 positions break down more easily than those with long-
chain fatty acids in those positions. Liao et al. used rat lipase to determine this step was
5-8 times faster in MCTs compared to LCTs14. Dayrit suggests this indicates the
hydrolysis of lauric acid (C:12) occurs more rapidly than longer-chain fatty acids.
After hydrolysis, LCFAs are assembled into chylomicrons and absorbed by lymph
vessels lining the intestine before being transported through the circulatory system to the
liver. In contrast, MCFAs are diverted to the portal vein and transported directly to the
liver from the gastrointestinal tract (Figure 2). This determination is said to be based on
the solubility of the individual fatty acid as well as the number of carbons. Dayrit notes
that compared to LCFAs, the solubility measurement of lauric acid is closer to C:8-C:10
MCFAs (C:14 or longer – below measurement; C:12 - 0.00077 g/100mL; C:10 - 0.0072
g/100mL; C:8 - 0.0842 g/100mL); animal experiments indicate lauric acid is more likely
to be channeled through the portal vein than longer-chained fatty acids [C:12 (72%) >
C:14 (58%) > C:16 (41%) > C:18 (28%)]14. The portal vein transport of lauric acid is
further supported by a clinical study with human subjects. Bragdon & Karmen (1960)
reported a 2:1 distribution ratio of lauric acid between the portal vein and chylomicrons 6
hours after ingestion of 35g/d of coconut oil, while almost 100% of C:14 chains and
11
longer were assembled into chylomicrons6. From his review, Dayrit concludes the
evidence shows lauric acid exhibits metabolic and physiological properties closer to
medium-chain fatty acids than to long-chain fatty acids14.
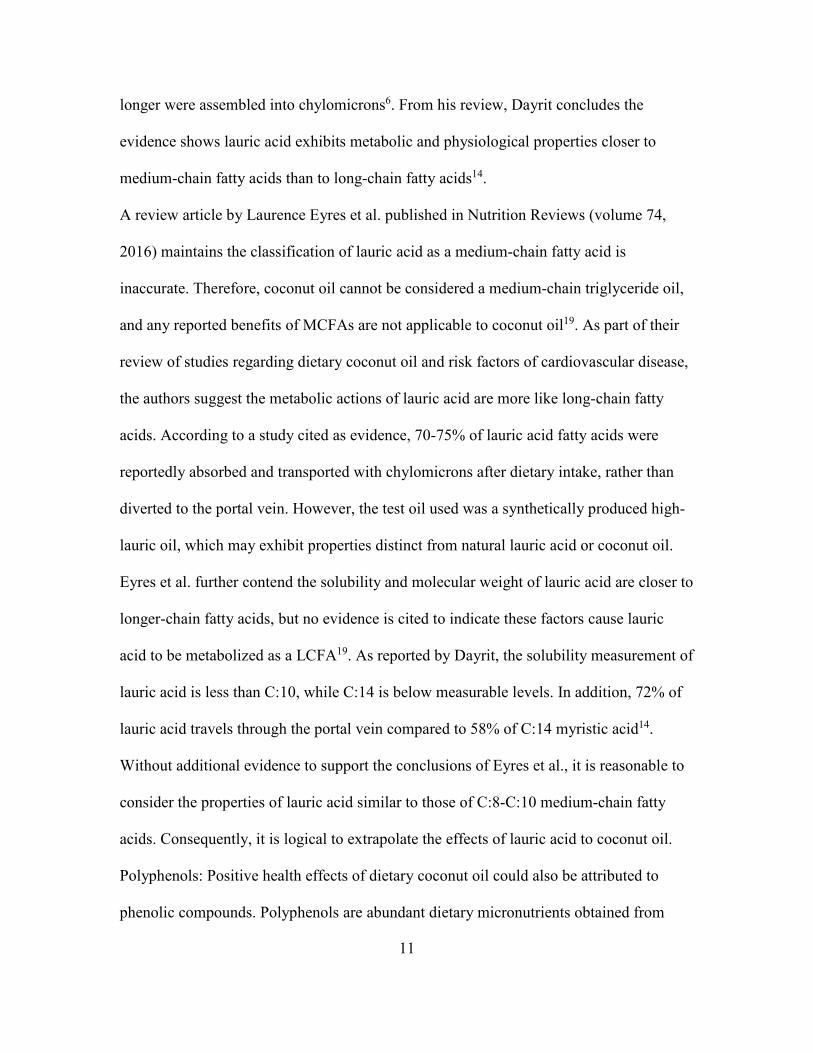
A review article by Laurence Eyres et al. published in Nutrition Reviews (volume 74,
2016) maintains the classification of lauric acid as a medium-chain fatty acid is
inaccurate. Therefore, coconut oil cannot be considered a medium-chain triglyceride oil,
and any reported benefits of MCFAs are not applicable to coconut oil19. As part of their
review of studies regarding dietary coconut oil and risk factors of cardiovascular disease,
the authors suggest the metabolic actions of lauric acid are more like long-chain fatty
acids. According to a study cited as evidence, 70-75% of lauric acid fatty acids were
reportedly absorbed and transported with chylomicrons after dietary intake, rather than
diverted to the portal vein. However, the test oil used was a synthetically produced high-
lauric oil, which may exhibit properties distinct from natural lauric acid or coconut oil.
Eyres et al. further contend the solubility and molecular weight of lauric acid are closer to
longer-chain fatty acids, but no evidence is cited to indicate these factors cause lauric
acid to be metabolized as a LCFA19. As reported by Dayrit, the solubility measurement of
lauric acid is less than C:10, while C:14 is below measurable levels. In addition, 72% of
lauric acid travels through the portal vein compared to 58% of C:14 myristic acid14.
Without additional evidence to support the conclusions of Eyres et al., it is reasonable to
consider the properties of lauric acid similar to those of C:8-C:10 medium-chain fatty
acids. Consequently, it is logical to extrapolate the effects of lauric acid to coconut oil.
Polyphenols: Positive health effects of dietary coconut oil could also be attributed to
phenolic compounds. Polyphenols are abundant dietary micronutrients obtained from

12
plant sources including fruits, vegetables, cocoa, tea, wine, and oils pressed from olives
or coconuts. These compounds exhibit beneficial antioxidant activities, protecting cells
from damage due to oxidative stress. Excessive oxidative stress is associated with age-
related diseases such as cardiovascular disease, cancer, and Alzheimer’s disease31.
Several phenols have been identified in coconut oil, including protocatechuic acid,
vanillic, caffeic, ferulic, and p-coumaric acids32, 53. Although both VCO and RCO contain
these compounds, Marina, et al. (2008) found phenolic content was 7% higher in VCO
versus RCO. Polyphenol amount was highest in VCO produced by fermentation and
lowest in refined coconut oil (Figure 3)32.
Figure 3. Mean total phenolic content of virgin coconut oil, (fermentation and chilling methods) and RBD coconut oil. Values with
different lower case letters are significantly different at P< 0.05 using SAS statistical software (Duncan’s multiple range test). GAE,
gallic acid equivalents. Source: Marina et al. (2008)32.
A 2009 review of published studies concluded VCO exhibits higher antioxidant potential
than RCO32. This review cites several animal studies conducted by Nevin and
Rajamahan. For example, reduced levels of thiobarbituric acid-reactive substance
(TBARS) were reported in VCO-fed rats, suggesting the polyphenol fraction of VCO is
more effective at preventing oxidation of LDL than RCO39. Their follow-up study found
increased catalase (CAT) and superoxide dismutase (SOD) in rats fed VCO compared to
0
5
10
15
20
25
30
Fermentation
a
b
c
Chilling RBD

13
other oils. Rats fed VCO also exhibited significantly lower levels of lipid peroxide in
tissues (heart, liver, kidneys), as well as higher total glutamine (GTN), an indicator of
antioxidant status40. Additionally, Nevin and Rajamahan reported that when LDL was
isolated from Sprague-Dawley rats fed VCO and exposed to oxidant in vitro, oxidation
resistance was significantly higher than LDL isolated from rats fed RCO32, 41.
An interesting point to add is an analysis conducted by Dayrit, et al (2008). Their study
compared VCO versus RCO by phosphorus-31 nuclear magnetic resonance spectroscopy
(31P NMR) using lauric acid to quantify free fatty acid content. The authors reported free
fatty acids were eight times higher in VCO compared to RCO (0.127% vs 0.015%)15. A
question to consider might be whether or not the method of producing and/or refining
coconut oil influences physiological effects or markers of inflammation and oxidative
stress. The production method of coconut oil should be considered when interpreting the
results of studies investigating any possible effects.
C. Possible Risks and Side Effects of Coconut Oil Consumption
Although research regarding an association between coconut oil and cardiovascular
disease is contradictory, the American Heart Association and the United States Dietary
Guidelines classify coconut oil as a saturated fat with damaging effects on the
cardiovascular system22, 29. A 2016 review of 8 clinical and 13 observational studies
concluded the body of evidence confirms coconut oil elevates total cholesterol, LDL-C,
and HDL-C when compared to unsaturated plant oils19.
Critics of this recommendation argue many of the studies that reported increased
cardiovascular risk factors used hydrogenated coconut oil as the test oil, rather than RCO
or VCO. It is possible the negative results on cardiovascular indicators were due to a

14
deficiency of essential fatty acids (EFA), as well as the trans-fatty acid component
resulting from the hydrogenation process18. Diets high in hydrogenated oil are
consequently low in essential polyunsaturated fatty acids (omega-6, linoleic acid (LA);
omega-3, a-linoleic acid (ALA)). These fatty acids are considered “essential” dietary
components because they are required for biochemical reactions but cannot be
synthesized by the human body. Animal and human studies indicate an increase in serum
cholesterol related to diets which replace these essential fatty acids with partially
hydrogenated oils18, 57. In addition, the process of chemical “partial hydrogenation” of
unsaturated plant oils produces fatty acids with a trans isomer in the carbon chain, as
opposed to a cis isomer. This configuration results in a more solid oil with a longer shelf-
life. A large body of evidence, including clinical and epidemiological studies, correlates
dietary trans-fat intake to increased plasma lipids and coronary heart disease1, 36, 37. These
factors should certainly be taken into consideration when reviewing studies that use
hydrogenated coconut oil rather than RCO or VCO.
On the other hand, many of the studies indicating a positive effect of coconut oil on lipid
parameters were limited in duration and/or number of participants, or failed to show a
strong enough correlation to establish a benefit63. Future studies are required in order to
resolve these discrepancies.
Possible side effects resulting from an excessive intake of coconut oil might be expected
due to its high medium-chain triglyceride content. Although a review of the evidence
conducted by Traul et al. (2000) reported no toxic effects resulting from an MCT intake
up to 15% of total kilocalories (either orally or parenterally), Jeukendrup & Aldred
(2004) found that more than 25-30 grams of MCTs ingested during a single meal can

15
cause intestinal symptoms such as abdominal cramping, bloating, nausea, vomiting, and
diarrhea26, 34, 59.
D. Reported Health Benefits of Coconut Oil
Sales of coconut oil have increased worldwide in recent years as a variety of health
benefits have been reported by the media and on the internet. In 2010, Americans
consumed approximately 1.28 kg per person30. Some coconut oil distributers market
VCO as a functional food with health benefits related to weight loss, diabetes, wound
healing, gastrointestinal disorders, Parkinson’s disease, and dementia32, 30. Although
research is limited and sometimes contradictory, studies indicate a positive effect on
cardiovascular disease risk factors, diabetes, and weight loss15, 38.
Cardiovascular Disease: A controversy exists regarding the effect of coconut oil on
cardiovascular risk factors. Current dietary recommendations are based on the
classification of coconut oil as a saturated fat, along with the belief that all saturated fats
increase the risk of cardiovascular disease. Serum cholesterol is a common clinical
marker used to predict cardiovascular disease. Several researchers have investigated the
effects of dietary coconut oil on blood lipids including cholesterol and triglycerides.
An early study by Reiser et al. reported a significantly higher increase in total cholesterol
and HDL-C, as well as reduced triglycerides, from a diet high in coconut oil compared to
beef fat. Although LDL-C increased significantly more than safflower oil, there was no
difference between coconut oil and beef fat. This small, randomized, crossover designed
trial included 19 male medical students, consuming each diet for 5 weeks. Although the
intent was to investigate the effects of beef fat, the outcome indicated coconut oil

16
increased LDL-C to a greater extent than safflower oil, but increased HDL-C
significantly more than both safflower oil and beef fat47.
Cox et al. conducted two trials comparing the effects of coconut oil, butter, and safflower
oil on serum lipids and lipoproteins. Their initial study was a randomized, control trial
which included 28 participants (men and women ages 29-67 years)11. Each 6-week trial
diet consisted of 36% total energy from fat, with 50% from the test oil. Although both
coconut oil and butter increased total cholesterol and LDL-C more than safflower oil,
coconut oil raised these levels significantly less than butter. No significant difference in
HDL-C was reported. Triglycerides were significantly reduced after the coconut oil and
safflower interventions11. These results suggest dietary coconut oil increases serum lipids
and lipoproteins to a lesser extent than butter. The researchers confirmed their results in a
follow-up study of 41 Pacific Island adults (19-72 years of age), in a sequential, non-
randomized trial. Using the same test oils during 6-week trials, results showed a decrease
in triglycerides, but no significant difference between the three groups. Total cholesterol
and LDL-C increased significantly after butter and coconut oil, while coconut oil
increased HDL-C by a greater amount than safflower oil12. Since this study confirmed the
results of the previous study, researchers suggest dietary coconut oil may have a less
detrimental effect on serum lipids than butter.
A 2004 Harvard Medical School study reported a significant improvement in the ratio of
total cholesterol to HDL-C after 6 weeks of coconut oil. This randomized, double-blind
crossover experiment compared serum lipoproteins after 6-week interventions of coconut
oil, soybean oil, and hydrogenated soybean oil in 22 healthy, young men (mean age: 32).
Researchers concluded 50% of dietary fat intake from coconut oil produced no adverse

17
effects, and may actually indicate a benefit due to increased HDL-C and improved ratio
compared to soybean oil42. Since this study is limited by a small sample of healthy males,
a study with a larger sample size and increased population diversity would be of interest.
More recently, Voon et al. conducted a randomized, crossover designed trial including 45
Malaysian adults. After 5 weeks, diets containing 67% test oils of coconut oil, virgin
olive oil, and palm oil were compared for their effects on cardiovascular risk factors. No
difference in CRP or homocysteine was reported. Interestingly, HDL-C was significantly
higher after the coconut oil phase than olive oil, and there was no significant difference in
total cholesterol to HDL-C ratio between the three test oils61. Since the ratio is a more
reliable predictor of cardiovascular event than either total cholesterol of LDL-C alone,
coconut oil may not increase atherosclerosis or cardiovascular disease.
Obesity: Because abdominal obesity is one factor included in the group of clinical
conditions known together as “metabolic syndrome,” investigating possible benefits of
dietary MCTs is of interest. Results of clinical studies conducted on animals and humans
indicate MCT consumption may enhance weight loss. According to a review of the
evidence conducted by Marten et al. (2006), a number of studies report decreased fat
accumulation and less weight gain in rats fed a diet high in MCTs versus LCTs. The
researchers attributed these results to enhanced thermogenesis, likely related to oxidation
of MCFAs in the liver34. Clinical interventions on human participants also report a
positive effect on weight loss, especially in obese men and women. For example, St-Onge
and Bosarge (2008) compared the effects of dietary MCTs to olive oil on body weight
and fat mass in overweight participants. After a 16-week program, participants who
consumed 18-24 grams of MCT oil per day had lower body weight and fat mass than
18
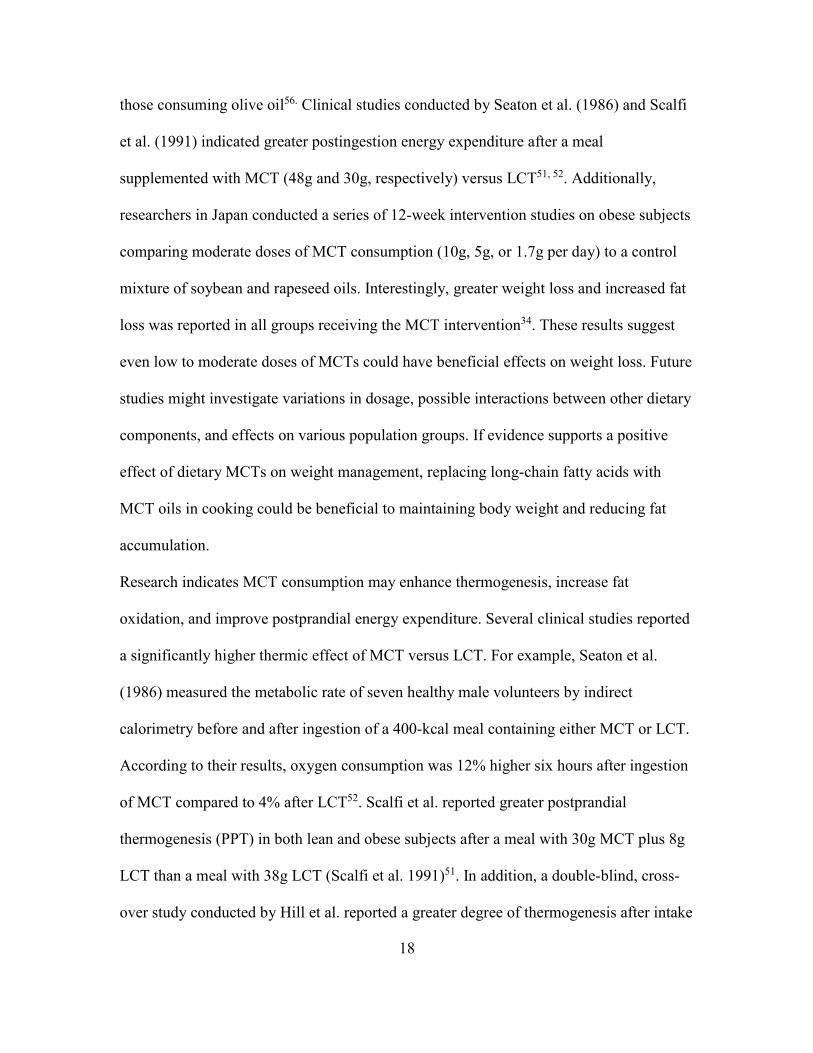
those consuming olive oil56. Clinical studies conducted by Seaton et al. (1986) and Scalfi
et al. (1991) indicated greater postingestion energy expenditure after a meal
supplemented with MCT (48g and 30g, respectively) versus LCT51, 52. Additionally,
researchers in Japan conducted a series of 12-week intervention studies on obese subjects
comparing moderate doses of MCT consumption (10g, 5g, or 1.7g per day) to a control
mixture of soybean and rapeseed oils. Interestingly, greater weight loss and increased fat
loss was reported in all groups receiving the MCT intervention34. These results suggest
even low to moderate doses of MCTs could have beneficial effects on weight loss. Future
studies might investigate variations in dosage, possible interactions between other dietary
components, and effects on various population groups. If evidence supports a positive
effect of dietary MCTs on weight management, replacing long-chain fatty acids with
MCT oils in cooking could be beneficial to maintaining body weight and reducing fat
accumulation.
Research indicates MCT consumption may enhance thermogenesis, increase fat
oxidation, and improve postprandial energy expenditure. Several clinical studies reported
a significantly higher thermic effect of MCT versus LCT. For example, Seaton et al.
(1986) measured the metabolic rate of seven healthy male volunteers by indirect
calorimetry before and after ingestion of a 400-kcal meal containing either MCT or LCT.
According to their results, oxygen consumption was 12% higher six hours after ingestion
of MCT compared to 4% after LCT52. Scalfi et al. reported greater postprandial
thermogenesis (PPT) in both lean and obese subjects after a meal with 30g MCT plus 8g
LCT than a meal with 38g LCT (Scalfi et al. 1991)51. In addition, a double-blind, cross-
over study conducted by Hill et al. reported a greater degree of thermogenesis after intake

19
of 40% fat of MCT versus LCT. During an inpatient trial held at the Vanderbilt
University Clinical Research Center, ten male participants were fed a liquid diet with
MCT for seven days and LCT for seven days, with a week washout period between trials.
Results on day one indicted a greater thermic effect of food (TEF) after an MCT meal
(8% ingested energy) than an LCT meal (5.8%). After five days, the effect of MCT was
even greater (15.7% vs 7.3%)23. Compelling evidence supports the thermogenic effect of
medium-chain triglycerides. Theoretically, this effect could contribute to enhanced
weight loss from an increase in coconut oil consumption.
Diabetes: Insulin resistance is an additional contributor to metabolic syndrome, which
may be mediated by MCFAs. Animal and human studies suggest an antidiabetic effect of
MCTs. High dietary intakes of long-chain fatty acids have been related to insulin
resistance. In contrast, some research suggests dietary MCTs may exhibit an antidiabetic
effect. A 2009 study by Wein et al. reported a protective effect of MCTs on insulin
resistance in rats fed a high fat diet64. In addition, a recent study of diabetic patients who
consumed a diet consisting of 40% of calories from either MCTs or LCTs found a 30%
increase of insulin-mediated glucose metabolism in MCT consumption compared to
LCTs38. A 2002 review by Pfeuffer & Schrezenmeir, however, reported most studies at
that time failed to show a decrease in glucose or insulin. Although the increase in serum
glucose measured shortly after intake of MCT was lower, a 30-day intervention in type 2
diabetics receiving an MCT-rich diet produced no change in fasting glucose or insulin66.
More recently, Tholstrup et al. (2004) reported an increase in fasting glucose after a 3-
week trial of 70 grams MCT compared an equal amount of high-oleic sunflower oil58.
Due to contradictions observed in the current evidence, further research investigating the

20
metabolic effects of dietary MCFAs on glucose production and insulin resistance is
certainly encouraged.
Alzheimer’s disease: Animal and human studies report a possible link between MCFAs
and improved cognitive function in Alzheimer’s patients. The suggested mechanism is
related to mild ketogenesis30. It is believed Alzheimer’s disease and age-related cognitive
decline is associated with decreased glucose metabolism in the brain45. A limited amount
of research suggest ketone bodies, especially –hydroxybutarate (-OHB) produced in the
liver from MCT oxidation, can be utilized as an alternative energy source by the brain.
For example, a study examined cognitive function and ketone body levels in older dogs
after 8 months of a diet containing 5.5% MCT supplement compared to a control diet.
The results indicated improved cognitive abilities and significantly increased levels of –
OHB in the MCT oil fed dogs45. A previous, double-blind, placebo controlled trial of 20
patients with Alzheimer’s disease or mild cognitive impairment reported improved
cognitive function in a genetic subset of patients after a 40ml oral intake of MCTs
compared to a placebo46. To follow this study, Henderson et al. conducted a much larger
study including 140 patients diagnosed with mild to moderate Alzheimer’s disease.
Subjects received either 20mg MCT powder or an isocaloric placebo for 90 days. Results
of their multi-centered, double-blind, randomized, placebo controlled parallel trial
reported improvement in cognition tests after the 90-day trial period. However, similar to
the previous pilot study, only a genetic subset showed significant improvement55. These
results are intriguing and future research into possible cognitive benefits of MCT is
certainly encouraged.

21
Infection. Another intriguing benefit may be the reported microbial action of coconut oil.
Although most existing research has been conducted in vitro, studies indicate an adverse
effect of the monoglyceride lauric acid on microorganisms such as yeast, fungi, bacteria,
and viruses18, 27. Lauric acid is a component in human breastmilk, which provides
newborns protection from pathogens until their immune systems develop30. It is
hypothesized that monolaurin destroys viruses, bacteria, and other pathogens by
disintegrating the plasma membranes, which effectively kills the microorganisms18. A
2004 in vitro study examined the sensitivity of various Candida species to coconut oil
versus fluconazole. Results indicated a 100% sensitivity of Candida species exposed to a
minimum inhibitory concentration (MIC) of 25%43. Recently, researchers investigated a
possible effect of dietary coconut oil on Candida albicans, a fungus common in the
human GI tract that is normally harmless but can lead to infection if colonization
becomes excessive. In an experiment using mice, Gunsalus, et al. (2015) reported a diet
high in coconut oil resulted in less intestinal colonization of Candida albicans than either
soybean oil or beef tallow21. Since approximately 50% of the fatty acid content of
coconut oil is lauric acid, it is possible coconut oil could be used as a non-toxic
replacement for, or in conjunction with, pharmaceuticals commonly used to treat fungal
infections, such as fluconazole14.
E. Inflammation
Inflammation is a biochemical process meant to protect tissues against internal and
external toxins including viruses, bacteria, pollen, and chemicals. Symptoms of acute
inflammation include redness, swelling, pain, and fever25. Dietary fats are of interest, as
numerous studies confirm both pro-inflammatory and anti-inflammatory effects related to

22
fat intake. For example, safflower oil, which is rich in the polyunsaturated omega-6
arachidonic acid, promotes inflammation, while omega-3 fatty acids found in fish oils are
anti-inflammatory22. Although little research exists regarding coconut oil and
inflammation, two experimental studies using rats reported an anti-inflammatory effect.
Both studies induced acute and chronic inflammation in male Sprague-Dawley rats, and
then administered coconut oil either topically or orally. While both experiments resulted
in decreased acute inflammation in the paw edema test, only Intahphuak, et al. (2010)
reported a reduction of chronic inflammation24, 67. Further research should be conducted
in order to investigate this discrepancy.
Chronic inflammation: Inflammation is a causative factor in atherosclerosis and
cardiovascular events24, 48, 49. Chronic inflammation is a continued state of inflammation
associated with mononuclear immune cells (monocytes, lymphocytes, macrophages, and
plasma cells), tissue damage, and accumulation of fibrous tissue28. Abundant research
indicates this continued state of inflammation contributes to age-related diseases
including type 2 diabetes, atherosclerosis and cardiovascular events, Parkinson’s disease,
Alzheimer’s disease, weakness, and frailty16. A relationship between chronic
inflammation and tumor progression is also reported. Researchers estimate 25% of cancer
diagnoses are related to chronic inflammation28. Because some dietary fats contribute to
inflammation and others support anti-inflammatory processes, it is of interest to
investigate the effect of coconut oil intake on markers of systemic inflammation20.
A system of biochemical molecules work together in order to regulate inflammation.
Fatty acid molecules are a critical component of both the inflammatory response to
destroy pathogens and the modulating anti-inflammatory process20. When an invading

23
toxin or injury is detected, pro-inflammatory molecules such as cytokines [tumor necrosis
factor (TNF); interleukins (IL)-1, -6] and eicosanoids [prostaglandins (PG); leukotrienes
(LT)] stimulate a range of effects including fever, increased glucose, reactive oxygen
species (ROS), adhesion molecules, increased triglycerides, muscle protein breakdown,
and anorexia20. Arachidonic acid (AA) is an omega-6 polyunsaturated fatty acid (n26)
involved the production of these pro-inflammatory molecules25. An overabundance of
these molecules for an extended period of time causes cell damage and promotes the age-
related diseases mentioned previously28. Because AA is synthesized from linoleic acid,
Americans typically obtain significantly more than required due to the large quantity of
soybean oil, corn oil, safflower, and sunflower oil in Western diets25. This illustrates a
possible mechanism for the relationship between dietary pattern and progressive diseases
associated with chronic inflammation. It is worth noting coconut oil contains very little
linoleic acid20.
In contrast, the polyunsaturated omega-3 fatty acids eicosapentaenoic acid (EPA) and
docosahexaenoic acid (DHA), mainly found in fish oils, mediate the inflammatory
process by disrupting the production and activity of pro-inflammatory cytokines and
eicosanoids. For example, EPA prevents the synthesis of pro-inflammatory eicosanoids
PG and LT by competing with AA molecules25. Extensive research reports a significant
reduction in PGs and LTs after dietary supplementation with fish oils7. Clinically, fish oil
appears to provide a therapeutic benefit on rheumatoid arthritis, as evidenced by more
than 10 double-blind, placebo-controlled experimental studies7, 25.
Interestingly, studies also indicate anti-inflammatory effects of oils and fats low in
linoleic acid. An 8-week experiment conducted by Mulrooney & Grimble (1993) found a
24
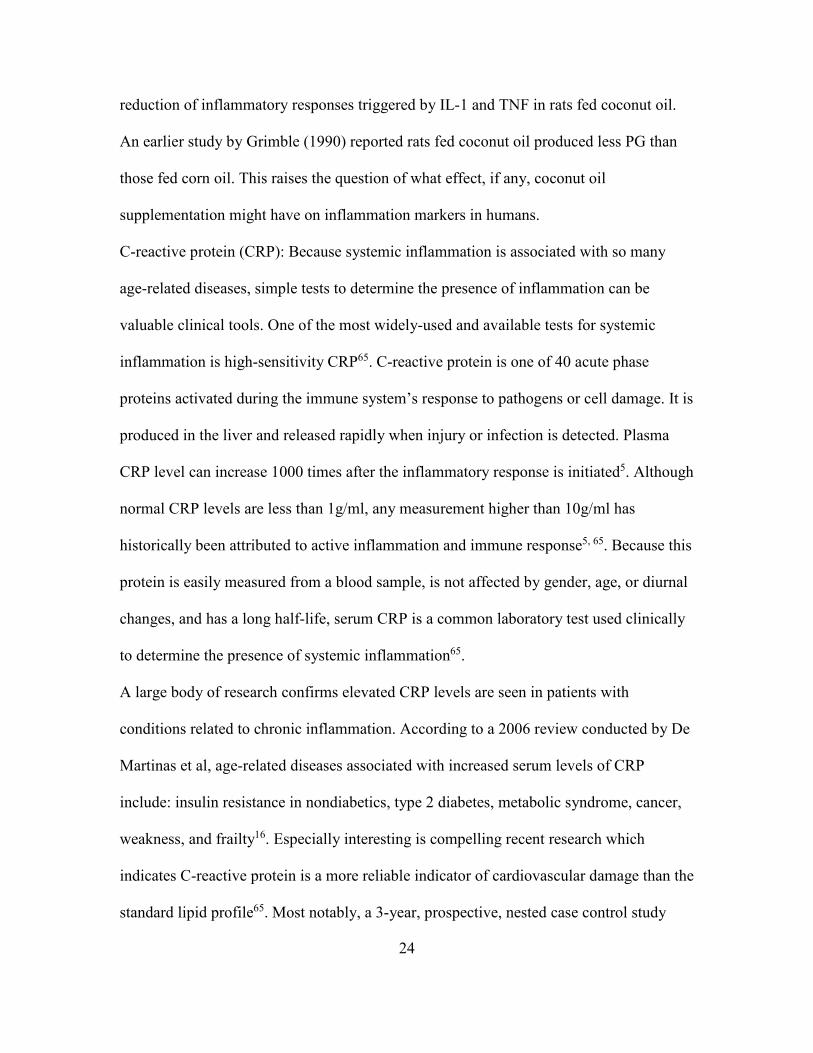
reduction of inflammatory responses triggered by IL-1 and TNF in rats fed coconut oil.
An earlier study by Grimble (1990) reported rats fed coconut oil produced less PG than
those fed corn oil. This raises the question of what effect, if any, coconut oil
supplementation might have on inflammation markers in humans.
C-reactive protein (CRP): Because systemic inflammation is associated with so many
age-related diseases, simple tests to determine the presence of inflammation can be
valuable clinical tools. One of the most widely-used and available tests for systemic
inflammation is high-sensitivity CRP65. C-reactive protein is one of 40 acute phase
proteins activated during the immune system’s response to pathogens or cell damage. It is
produced in the liver and released rapidly when injury or infection is detected. Plasma
CRP level can increase 1000 times after the inflammatory response is initiated5. Although
normal CRP levels are less than 1g/ml, any measurement higher than 10g/ml has
historically been attributed to active inflammation and immune response5, 65. Because this
protein is easily measured from a blood sample, is not affected by gender, age, or diurnal
changes, and has a long half-life, serum CRP is a common laboratory test used clinically
to determine the presence of systemic inflammation65.
A large body of research confirms elevated CRP levels are seen in patients with
conditions related to chronic inflammation. According to a 2006 review conducted by De
Martinas et al, age-related diseases associated with increased serum levels of CRP
include: insulin resistance in nondiabetics, type 2 diabetes, metabolic syndrome, cancer,
weakness, and frailty16. Especially interesting is compelling recent research which
indicates C-reactive protein is a more reliable indicator of cardiovascular damage than the
standard lipid profile65. Most notably, a 3-year, prospective, nested case control study

25
with a cohort of over 28,000 healthy, post-menopausal women participating in the
Women’s Health Study reported cardiovascular events were more reliably predicted by
CRP level than serum low-density lipoprotein (LDL) cholesterol50. The strongest
association was seen at a CRP level between 1 and 5 g/ml. Since over two-thirds of
cardiovascular events in women occur in patients with LDL-C levels related to low risk,
CRP is increasingly used in conjunction with cholesterol levels, as an additional risk
factor of cardiovascular disease65.
In addition to its pro-inflammation response to pathogens, CRP is thought to directly
contribute to atherosclerosis. Research conducted by Verma et al. (2004) found CRP
reduces the expression of nitric-oxide synthase, which effects the stability of cells and
develops plaques in the lining of blood and lymph vessels16, 60. As evidence, Reynolds &
Vance (1987) discovered plaque deposits collected from atherosclerotic human aortas
contain CRP48, 65. Theoretically, strategies intended to reduce serum CRP should decrease
the risk of cardiovascular disease. Pharmaceutical interventions such as statins and
aspirin can reduce serum CRP as much as 25-50%. Some studies show lower CRP levels
after weight loss and diabetes management, as well65. This suggests patients with
elevated CRP may benefit from dietary/lifestyle and pharmaceutical therapies.
Additionally, future studies investigating possible effects of specific dietary components
on CRP levels may be of interest.
Reactive Oxygen Species (ROS)/Oxidative Stress: As mentioned earlier in this review,
polyphenols in coconut oil may provide antioxidant protection against oxidative stress.
Oxidative stress is a detrimental effect of inflammation caused by reactive oxygen
species (ROS), which are a byproduct of the inflammation process. These damaging

26
effects occur when the production of ROS overwhelms the defensive ability of
antioxidants. A general consensus of the relevant literature indicates oxidative stress
resulting from chronic inflammation is associated atherosclerosis, cancer, and other age-
related diseases28, 65. Since antioxidant polyphenols are ubiquitous in dietary sources,
many foods are marketed for their potential protective antioxidant properties.
The production of reactive oxygen species (ROS) is one of the many effects of the
process of inflammation. Reactive oxygen species are “free radical” atoms or molecules
derived from oxygen. Free radicals are highly reactive due to unpaired electrons in their
orbits. Oxygen has two unpaired electrons, and is the most prominent molecule
susceptible to free radical formation. A defensive system of antioxidants works to
neutralize the toxic effects of free radicals. Although a low concentration of ROS acts as
a defense against pathogens, an overabundance of ROS can damage the fatty acid,
protein, and DNA components of cells and tissues13, 28.
The fatty acids located in cell walls are especially vulnerable to ROS damage. Oxygen-
derived free radicals produce lipid peroxides when they react with fatty acids of the cell
membrane. Lipid peroxides make the cell walls rigid and less flexible, which leads to cell
damage and death. Increased lipid peroxidation not associated with normal aging is seen
in the brains of patients diagnosed with Alzheimer’s disease. The accumulation of
excessive lipid peroxides generates additional, potentially damaging end-products such as
the reactive aldehyde malondialdehyde (MDA), which is considered a carcinogen. MDA
is an end-product of arachidonic acid (AA) metabolism, which is obtained in large
amounts as part of the typical Western diet. Since MDA is much more stable than free

27
radicals, it is often used to indirectly measure lipid peroxidation as an indicator of
oxidative stress13, 28.
Thiobarbituric acid-reactive substance (TBARS): In order to investigate the relationship
between oxidative stress and age-related diseases or antioxidant therapies, it is necessary
to measure serum or tissue levels of free radicals or their byproducts. The most common
laboratory analysis used to estimate systemic oxidative stress is the thiobarbituric acid-
reactive substance (TBARS) assay, which measures MDA in serum or tissues in order to
determine lipid peroxidation. Although the assay can be performed by HPLC or
spectrophotometry, HPLC is preferred due to its higher reproducibility, sensitivity, and
specificity.
In order to investigate the antioxidant properties of virgin coconut oil (VCO) versus
refined coconut oil (RCO), Nevin and Rajamahan (2004, 2006, 2008) used TBARS to
measure lipid oxidation in rats fed coconut oil. In 2004, the research reported reduced
TBARS in the VCO-fed animals, suggesting the polyphenol fraction of VCO is more
effective in preventing lipid oxidation than RCO39. Their follow-up study found rats fed
VCO had significantly lower levels of lipid peroxide in tissues (heart liver, kidneys), as
well as higher total glutamine (GTN), an additional indicator of antioxidant status40.
Additional research comparing coconut oil to sunflower oil determined TBARS level was
significantly lower in the VCO group and highest in the sunflower oil group41. Nevin and
Rajamahan proposed that the lower TBARS level may be a result of a higher antioxidant
amount and lower polyunsaturated fat content as compared to sunflower oil, which is
more vulnerable to oxidation41. Based on the results of these previous animal
experiments, it would be of interest to conduct similar studies on the effects of

28
antioxidant activity of dietary coconut oil in human participants. If phenolic compounds
or dietary fats such as lauric acid in coconut oil can reduce inflammation (serum CRP)
and lipid oxidation (TBARS), increased consumption could be used in conjunction with
pharmaceutical therapies such as aspirin, NSAIDs, or statins.

29
Chapter 3
METHODS
Participants
Subject selection
Blood samples obtained from thirty-two, healthy, non-smoking adults between the ages
of 18 and 40 were analyzed for this study. Eligible participants reported no food
restrictions or special diets, had a body mass index (BMI) between 22 and 35, and
reported less than 150 minutes of moderate exercise per week. Subjects were selected if
they had no diagnoses of active disease, were not taking statin medications, and females
were not pregnant or lactating. Volunteers who were unwilling or unable to take a daily
supplement capsule or to continue the study protocol for the duration of the study were
excluded. These criteria were approved by the Arizona State University Institutional
Review Board (IRB), and all participants provided written informed consent.
Recruitment
Participants were recruited via Arizona State University email ListServs, announcements,
and flyers posted on or near the Arizona State University campus. Volunteers were
offered an incentive of $10.00 and $25.00 Target gift cards to participate. An online
survey through the www.surveymonkey.com website was used to pre-screen individuals
who expressed interest. Selected individuals were scheduled for an initial visit in order to
finalize eligibility, inform subjects of study details, and obtain signed inform consent and
anthropometric measurements.

30
Study Design
This eight-week study was primarily designed as a randomized, double-blind, parallel,
two-arm control trial to test the impact of coconut oil on blood lipids and body
composition. This report represents the secondary analysis of the blood samples to
determine the impact of coconut oil on common markers of inflammation (CRP) and
oxidative stress (TBARS), as research indicates these conditions are associated with
cardiovascular disease, cancer, and other age-related diseases26, 34, 59, 49, 65. Thirty-nine
subjects were enrolled and randomly assigned to one group receiving the coconut oil
supplement (2 grams/day) or a second group receiving the placebo control (white flour);
32 subjects completed the 8-week protocol. The study included three visits to the Arizona
Biomedical Collaborative building at the Arizona State University downtown campus.
At the initial visit, each volunteer completed a health history questionnaire and a mood
questionnaire. A dexa scan was performed to assess body composition. Height, weight,
and finger stick blood cholesterol samples were obtained in order to stratify participants
prior to randomization. Selected participants were instructed to complete a three-day diet
record and consume only water for at least eight hours prior to the time of their second
visit. During the second visit, subjects were randomly assigned to either the coconut oil
or placebo group. Each participant was provided with an eight-week supply of
supplement capsules and directions regarding consumption. Participants were asked to
follow their usual dietary patterns and physical activity levels during the eight weeks of
the trial. A final fasting blood sample was collected and a dexa scan was performed.
Participants provided investigators with their completed compliance calendars, and three-
day food records.

31
Independent variable: The variable expected to have an effect was a daily, low-dose
supplement of coconut oil. Subjects in the coconut oil group consumed two, 1000 mg
softgel capsules of Puritan’s Pride brand coconut oil (Cocos nucifera) daily. The serving
size listed on the label is two (2) softgels, recommended twice daily, taken with food.
Subjects in this study were instructed to take two capsules daily (half the recommended
dose). Additional ingredients listed include gelatin, medium chain triglycerides, vegetable
glycerin, and titanium dioxide color. Two softgel capsules provide 25 calories; 2.5 g (4%
Daily Value (DV)) total fat; 2.5 g (12% DV) saturated fat, and less than 1 gram of
protein. According to the product label, 2000 mg coconut oil typically contains: 880 mg
lauric acid; 280 mg myristic acid; 92 mg caprylic acid; 120 mg palmitic acid; 90 mg
capric acid; 100 mg oleic acid; 16 mg stearic acid; and 16 mg linoleic acid.
Dependent variables. Outcome measurements included weight, visceral fat, blood
cholesterol, blood triglycerides, and blood markers of inflammation and oxidative stress.
This study specifically examined changes in common biomarkers of chronic
inflammation (CRP) and oxidative stress (TBARS).
Statistical analyses: The Statistical Package for Social Sciences (SPSS version 23) was
used to perform statistical analyses. Data were reported as the mean ± SD; significance
was set at P≤0.05. Repeated measures ANOVA was used to assess the differences
between means, while correlation analyses evaluated the strength of the relationship
between variables. Data was tested for normality and log transformed if needed in order
to normalize data.

32
Chapter 4
DATA & RESULTS
Data and results of this study are based on secondary analyses of blood samples
originally collected to investigate the effects a daily supplement of 2 grams coconut oil
would have on common serum lipid and lipoproteins associated with cardiovascular
disease risk factors (HDL-C, LDL-C, Total Cholesterol, Triglycerides, and Total
Chol/HDL-C ratio). The secondary analyses measured the blood samples obtained from
the original study for serum levels of CRP and TBARS.
Volunteers for this randomized, double-blind, parallel-arm control trial were recruited via
email ListServs, flyers, and announcements on and near the Arizona State University
campus in Phoenix, Arizona, during October 2015. A total of 154 people completed an
online survey to determine initial eligibility. Eighty of these respondents met the pre-
screen requirements. Written consent was obtained from 42 volunteers; however, 3 of
these withdrew prior to initial data collection. Thirty-nine participants were randomized
into either the coconut oil (CO) group (n=19) or the placebo (PL) group (n=20) after
stratification by gender, age, and BMI. Seven volunteers dropped out prior to the end of
the study. Final analyses include samples collected from 32 subjects completing the 8-
week protocol.
Ultimately, analyses of the experiment group (CO) consisted of 10 females and 4 males;
15 females and 3 males were included in analyses of the PL group. Mean ages of each
group were 25.1±5.7 and 24.2±5.3 years, respectively, with a range of 18 to 38 years.
Mean BMI for both groups was in the normal/healthy range (CO: 23.6±4.4 kg/m2; PL:
24.7±4.0 kg/m2). Heights ranged from 146.1cm to 182.9cm. The lowest baseline weight

33
was 47.5kg and the highest 96.5kg with a mean weight of 65.2±14.3kg in the CO group
and 68.6±13.6kg in the PL group. Waist circumference ranged from 67.31cm to 106.7cm;
percent fat measured between 13.3% and 45.7% in both groups. The range of metabolic
equivalents (METS) was from 26 to 119 kcal/kg/week. Thirteen of 14 participants in the
CO group completed their compliance calendars, with a calculated 89.8% adherence; the
PL group indicated 87.9% compliance with all 18 completed calendars (Table 1).
Table 1. Baseline Characteristics of each study group: coconut oil (CO) and placebo (PL).
CO PL P valueab
N (M/F) 4/10 3/15
Age (years) 25.1±5.7 24.2±5.3 0.643
Weight1 (kg) 65.2±14.3 68.6±13.6 0.492
Height (cm) 165.6±8.7 166.4±9.2 0.801
BMI (kg/m2) 23.6±4.4 24.7±4.0 0.499
Waist (cm) 78.2±10.0 82.0±10.3 0.298
Body Fat (%) 23.7±8.8 27.5±7.2 0.187
METSc
(kcal/kg/week)
59.6±15.8 47.9±22.8 0.113
Adherence (%) 89.8±11.8 87.9±8.22 0.595
Statistical analyses performed using SPSS Statistical Analysis system 23.0. Data expressed as mean ± standard deviation. Adherence represents percent of days pills consumed. aIndependent t-test analysis. bSignificance is >0.05. cMetabolic Equivalents is a measure of physical activity.

34
Baseline measurements of CRP related to body fat and BMI. Using a 2-tailed t-test, the
correlation between CRP and body fat (p=0.000) is significant at the 0.01 level.
Correlation between CRP and BMI (p=0.030) is significant at the 0.05 level.
The CRP analysis of the experimental (CO) group included 13 samples. Although the
mean serum CRP level of the coconut oil group decreased from baseline (1.95±3.35) to
8-weeks (1.70±3.53), the reduction is not significant (p=0.183) (Table 2) (Figure 4). The
NPAR test was used due to lack of normality. When the change in CRP is transformed to
achieve normality and control for age and percent fat, the intervention is weakened to an
even greater extent (p=0.289).
Table 2. Pre- and post-intervention (8-weeks) serum CRP measurements.
CO n=13 PL n=18 P valueab
Baseline (mg/l) 1.95±3.35 1.42±2.06
Week 8 (mg/l) 1.70±3.53 2.14±3.49
Change (0-weeks 8)
(mg/l) -0.250±0.734 0.723±2.91 0.183
Data expressed as the mean ± SD. a NPAR test used for change. bSignificance is set at p < 0.05. The change in CRP was not significant.

35
Figure 4. Comparison of serum CRP between test and placebo groups at baseline and week 8.
Fourteen subjects included in the analysis of TBARS received the coconut oil
intervention; 18 received the placebo. The NPAR test was used as data was not
normalized. In contrast to the hypothesis, TBARS in the test group increased
significantly. Mean baseline TBARS in the CO group was 2.45±0.651 compared to 2.85±
0.973 after 8 weeks (p=0.049). Although this is a significant increase, the significance is
borderline. TBARS in the PL group decreased from baseline (3.54±3.50) to 8-weeks
(2.58±0.894) (Table 3) (Figure 2).
Table 3. Pre- and post-intervention (8-weeks) serum TBARS measurements
CO n=14 PL n=18 P valueab
Baseline (nmol/ml) 2.45±0.651 3.54±3.50
Week 8 (nmol/ml) 2.85±0.973 2.58±0.893
Change (0-weeks 8) 0.401±1.04 -0.955±3.436 0.049
1.9508
1.7008
1.4167
2.1392
0
0.5
1
1.5
2
2.5
3
Baseline Week 8
seru
m C
RP
(m
g/l
)Change in mean CRP (Baseline - Week 8)
CO PL

36
(mg/l)
Data expressed as the mean ± SD. a NPAR test used for change. bSignificance is set at p = < 0.05.
Figure 5. Comparison of serum TBARS between test and placebo groups at baseline and week 8.
2.4461
2.8471
3.5393
2.5841
0
0.5
1
1.5
2
2.5
3
3.5
4
Baseline TBARS Week 8 TBARS
TB
AR
S n
mo
l/m
l
Change in mean TBARS (Baseline - Week 8)
CO Placebo
37
Chapter 5
DISCUSSION
In this randomized, parallel two-arm, placebo controlled trial, 8 weeks of 2 grams per day
of a coconut oil supplement in the form of 2 capsules did not significantly reduce serum
CRP levels compared to the placebo (white flour). In contrast to the hypothesis, TBARS
levels significantly increased after 8 weeks of coconut oil supplementation.
Although the decrease in CRP was not statistically significant, it may be notable that the
coconut oil intervention did not result in an increase of CRP. A large body of evidence
indicates dietary fats affect the inflammation process. For example, dietary oils rich in
linoleic acid, such as soybean, corn, and safflower oils, promote inflammation, while
omega-3 fatty acids, especially those found in fish oils, interfere with the production of
pro-inflammatory cytokines20. Dietary patterns high in saturated fats, particularly red
meats and high-fat dairy products, are associated with increased levels of CRP. Since
coconut oil is high in saturated fat, it might be expected to raise CRP. However, coconut
oil contains very little pro-inflammatory linoleic acid20. Results of this study suggest
coconut oil consumption may be not associated with the same pro-inflammatory effects
as saturated fats or polyunsaturated omega-6 dietary oils.
According to a review by Yeh and Willerson (2003), a CRP level between 1 and 5 g/ml is
associated with an increased risk of a cardiovascular event65. Ridker (2003) reported a
CRP measure between 1 and 3 g/ml indicates a moderate risk, while greater than 3 g/ml
is associated with a high risk49. In the current study, the mean baseline CRP was between
1 and 2 g/ml in both the coconut oil and placebo groups (CO: 1.95±3.35 g/ml; PL:
1.42±2.06 g/ml). Considering the study population was mainly young and healthy, it may

38
be of interest to investigate the effects on a population of subjects with a CRP in the
moderate or high-risk groups.
Although no previous human studies were found, a limited number of animal
experiments suggest coconut oil may have an anti-oxidant effect, possibly related to
polyphenol content. Nevin and Rajamahan conducted several studies which reported
reduced TBARS in rats fed diets rich in virgin coconut oil39, 40, 41. Compared to refined
coconut oil, their results showed lower serum TBARS and lipid peroxide in tissues of rats
fed VCO39, 40. Additional research indicated significantly higher TBARS in rats fed
sunflower oil compared to VCO. The authors suggested the higher antioxidant amount
and lower polyunsaturated content may have contributed to the lower TBARS in the
VCO-fed groups41.
Based on these previous experiments, it was expected that a coconut oil supplement in a
human trial would result in decreased TBARS. To the contrary, this study indicated an
increase in mean serum TBARS from 2.45±0.651 to 2.85±0.973, with a mean change of
+0.16 after 8 weeks of a coconut oil supplement. Although this increase is statistically
significant (p=0.049) the result is borderline. A possible confounding factor may be
related to the dietary intake of each participant. Since MDA, which is the derivative of
lipid peroxidation measured by the TBARS assay, can be influenced by dietary
components, diet should be controlled when using TBARS to determine lipid
peroxidation13.
An additional consideration regarding the TBARS results reported in this study may be
related to the method of production of the test oil. A review of available studies indicates
VCO has a more powerful antioxidant effect than RCO33. Additional research reports free

39
fatty acids may be as much as 8 times higher in VCO compared to RCO15. Results of the
animal experiments mentioned previously were based on test oils of VCO, RCO, and
sunflower oil. Since the test oil used in this study consisted of capsules of RCO, it is
possible trials using VCO may produce different results.
Strengths: This 8-week study was a designed as a double-blind, parallel, two-armed trial.
Participants were randomized into either the experiment or control groups after
stratification by gender, age, and BMI.
Limitations: Limitations include lack of controlled diet, inability to confirm compliance,
and a healthy subject population. Although the protocol of this study considered
participants would follow their usual diet, the study is limited by the lack of a controlled
diet. Since TBARS, especially, may be affected by changes in diet, it is difficult to
conclude the final results were related to the coconut oil supplement. Although subject
compliance of daily intake was recorded on a compliance calendar, study investigators
did not directly observe daily consumption of the capsules. Finally, since inflammation
and oxidatitive stress are affected by age and health status, it is possible different results
may be seen in an older, higher-risk subject pool.
Conclusion: In conclusion, this randomized, placebo-controlled trial found that a daily
supplement of 2-grams refined coconut oil for eight weeks did not significantly affect
serum levels of CRP. Lipid peroxidation was negatively affected by the coconut oil
supplement as evidenced by a significant increase in serum TBARS. Future studies might
include participants with a moderate or high risk of cardiocascular event as evidenced by
serum CRP. Additional human studies investigating the effects of virgin or refined
coconut oil on measures of lipid peroxidation are also of interest.

40
REFERENCES
1. Ascherio, A., Stampfer, M., & Willett, W. (1999). Trans Fatty Acids and Coronary Heart Disease. New England Journal of Medicine, 340, 1994-1998.
2. Basic Report: 04047, Oil, coconut . (2016, May). Retrieved March 25, 2017, from National Nutrient Database for Standard Reference: https://ndb.nal.usda.gov/ndb/foods/show/659?manu=&fgcd=&ds
3. Bergsson, G., Arnfinnsson, J., Steingrimsson, O., & Thormar, H. (2001). In vitro killing of Candida albicans by fatty acids and monoglycerides. Antimicrobial
agents and chemotherapy, 45(11), 3209-3212.
4. Bhatnagar, A., Prasanth, K. P., Hemavathy, J., & Gopala, K. A. (2009). Fatty Acid Composition, Oxidative Stability, and Radical Scavenging Activity of Vegetable Oil Blends with Coconut Oil. J Am Oil Chem Soc, 86, 991-999.
5. Black, S., Kushner, I., & Samols, D. (2004). C-reactive protein. Journal of Biological
Chemistry, 279(47), 48487-48490.
6. Bragdon, J., & Karmen, A. (n.d.). The fatty acid composition of chylomicrons of chyle and serum following the ingestion of different oils. Journal of Lipid Research,
1(2), 167-170.
7. Calder, C. (2011). Fatty acids and inflammation: The cutting edge between food and pharma. European Journal of Pharmacology, 668, S50-S59.
8. Carandang, E. (2008). Health benefits of virgin coconut oil. Health, 8-13.
9. Che Man, Y., Karim, A., & Teng, C. (1997). Extraction of coconut oil with Lactobacillus plantarum 1041 IAM. Journal of the American Oil Chemists'
Society, 74(9), 1115-1119.
10. Che Man, Y., Suhardiyono, Asbi, A., Azudin, M., & Wei, L. (1996). Aqueous enzymatic extraction of coconut oil. Journal of the American Oil Chemists’
Society, 73(6), 683-686.
11. Cox, C., Mann, J., Sutherland, W., Chisolm, A., & Skeaff, M. (1995). Effects of coconut oil, butter, and safflower oil on lipids and lipoproteins in persons with moderately elevated cholesterol levels. Journal of Lipid Research, 36, 1787-1795.
12. Cox, C., Sutherland, W., Mann, J., de Jong, S., Chisolm, A., & Skeaff, M. (1998). Effects of dietary coconut oil, butter and safflower oil on plasma lipids, lipoproteins and lathosterol levels. European journal of clinical nutrition, 52(9), 650-654.

41
13. Dalle-Donne, I., Rossi, R., Colombo, R., Giustarini, D., & Milzani, A. (2006). Biomarkers of Oxidative Damage in Human Disease. Clinical Chemistry, 52(4), 601-623.
14. Dayrit, F. (2014). Lauric Acid is a Medium-Chain Fatty Acid, Coconut Oil is a Medium-Chain Triglyceride. Philippine Journal of Science, 143(2), 157-166.
15. Dayrit, F. M., Buenafe, O. E., Chainani, E. T., & DeVera, I. M. (2008). Analysis of Monoglycerides, Diglycerides, Sterols, and Free Fatty Acids in Coconut (Cocos nucifera L.) Oil by by 31P NMR Spectroscopy. J. Agric Food Chem, 56, 5765-5769.
16. De Martinis, M., Franceschi, C., Monti, D., & Ginaldi, L. (2006). Inflammation markers predicting frailty and mortality in the elderly. Pathology, 80, 219-227.
17. Eckel, R. H., Berman, T., Yost, E., & Brass, E. (1992). Dietary substitution of medium-chain triglycerides improves insulin-mediated glucose metabolism in NIDDM subjects. Diabetes, 41, 641-647.
18. Enig, M. (April 1996). A New Look at Coconut Oil, Health and Nutritional Benefits from Coconut OIl: An Important Functional Food for the 21st Century. AVOC
Oils Symposium. The Weston Price Foundation.
19. Eyres, L., & Eyres, M. (2016). Coconut oil consumption and cardiovascular risk factors in humans. Nutrition Reviews, 74(4), 267-280.
20. Grimble, R. (1998). Dietary lipids and the inflammatory response. Proceedings of the
Nutrition Society, 57, 535-542.
21. Gunsalus, K., Tornberg-Belanger, S., Matthan, N., Lichenstein, A., & Kumamoto, C. (2016). Manipulation of Host Diet To Reduce Gastrointestinal Colonization by the Opportunistic Pathogen Candida albicans. mSphere, 1(1), e00020-15.
22. HHS and USDA release new dietary guidelines to encourage healthy eating patterns
to prevent chronic diseases. (2016, January 21). Retrieved from The Public Record: http://login.ezproxy1.lib.asu.edu/login?url=http://search.proquest.com/docview/1789785732?accountid=4485
23. Hill, J., Peters, J., Yang, D., Sharp, T., Kaler, M., Abumrad, N., & Greene, H. (1989). Thermogenesis in humans during overfeeding with medium-chain triglycerides. Metabolism, 38(7), 641-648.
24. Intahphuak, S., Khonsung, P., & Panthong, A. (2010). Anti-inflammatory, analegesic, and antipyretic activities of virgin coconut oil. Pharmaceutical Biology, 48(2), 151-157.

42
25. James, M., Gibson, R., & Cleland, L. (2000). Dietary polyunsaturated fatty acids and inflammatory mediator production. Am J Clin Nutr, 71(supp), 343S-348S.
26. Jeukendrup, A., & Aldred, S. (2004). Fat supplementation, health, and endurance performance. Nutrition, 20, 678-688.
27. Kabara, J. (1978). Structure-function relationships of surfactants as antimicrobial agents. J Soc Cosmet Chem, 29, 733-741.
28. Khansari, N., Shakiba, Y., & Mahmoudi, M. (2009). Chronic inflammation and oxidative stress as a major cause of age related diseases and cancer. Recent
Patents on Inflammation & Allergy Drug Discovery, 3(1), 73-80.
29. Know Your Fats. (2014, April 21). (American Heart Association) Retrieved March 25, 2017, from Healthy For Good: http://www.heart.org/HEARTORG/Conditions/Cholesterol/PreventionTreatmentofHighCholesterol/Know-Your-Fats_UCM_305628_Article.jsp#.WNc6hmc2zIU
30. Lockyer, S., & Stanner, S. (2016). Coconut oil - a nutty idea? Nutrition Bulletin.
British National Foundation, 41, 42-54.
31. Manach, C., Scalbert, A., Morand, C., Remesy, C., & Jimenez, L. (2004). Polyphenols: food sources and bioavailability. The American journal of clinical
nutrition, 79(5), 727-747.
32. Marina, A., Che Man, Y., & Amin, I. (2009). Virgin coconut oil: emerging functional food oil. Trends in Food Science and Technology, 20, 481-487.
33. Marina, A., Che Man, Y., Nazimah, S., & Amin, I. (2009). Antioxidant capacity and phenolic acids of virgin coconut oil. International Journal of Food Sciences and
Nutrition, 60(supp2), 114-123.
34. Marten, B., Pfueffer, M., & Schrezenmeir, J. (2006). Medium-chain Triglycerides. International Dairy Journal, 1374-1382.
35. McCarty, M., & DiNicolantonio, J. (2016). Lauric acid-rich medium-chain triglycerides can substitute for other oils in cooking. Open Heart, 3, e000467.
36. Mozaffarian, D. (2006). Trans fatty acids - Effects on systemic inflammation and endothelial function. Atherosclerosis Supplements, 29-32.
37. Mozaffarian, D. (2006). Trans Fatty Acids and Cardiovascular Disease. N Engl J
Med, 354, 1601-1613.
38. Nagao, K., & Yanagita, T. (2010). Medium-chain fatty acids: Functional lipids for the prevention and treatment of the metabolic syndrome. Pharmacological Research,
61, 208-212.

43
39. Nevin, K., & Rajamohan, T. (2004). Beneficial effects of virgin coconut oil on lipid parameters and in vitro LDL oxidation. Clinical Biochemistry, 37, 830-835.
40. Nevin, K., & Rajamohan, T. (2006). Virgin coconut oil supplement diet increases the antioxidant status in rats. Food Chemistry, 99, 260-266.
41. Nevin, K., & Rajamohan, T. (2008). Influence of virgin coconut oil on blood coagulation factors, lipid levels, and LDL oxidation in cholesterol fed SpragueDawley rats. European e-Journal of Clinical Nutrition and Metabolism,
3, e1-e8.
42. Norton, D., Angerman, S., Istfan, N., Lopes, S., Babayan, V., Putz, M., & Blackburn, G. (2004). Comparative Study of Coconut Oil, Soybean Oil and Hydrogenated Soybean Oil. PJCS XXIX#, 1&2, 76-89.
43. Ogbolu, D., Oni, A., Daini, O., & Oloko, A. (2007). In vitro antimicrobial properties of coconut oil on Candida species in Ibadan, Nigeria. Journal of medicinal food,
10(2), 384-387.
44. Onsaard, E., Vittayanont, M., Srigam, S., & McClements, D. (2005). Properties and Stability of Oil-in-Water Emulsions Stabilized by Coconut Skim Milk Proteins. J.Agric.FoodChem, 53, 5747-5753.
45. Pan, Y., Larson, B., Araujo, J., Lau, W., de Rivera, C., Santana, R., . . . Milgram, N. (2010). Dietary supplementation with medium-chain TAG has long-lasting cognition-enhancing effects in aged dogs. British journal of nutrition, 103(12), 1746-1754.
46. Reger, M., Henderson, S., Hale, C., Cholerton, B., Baker, L., Watson, G., . . . Craft, S. (2004). Effects of β-hydroxybutyrate on cognition in memory-impaired adults. Neurobiology of aging, 25(3), 311-314.
47. Reiser, R., Probstfield, J., Silvers, A., Scott, L., Shorney, M., Wood, R., & Insull, W. (1985). Plasma lipid and lipoprotein response of humans to beef fat, coconut oil and safflower oil. The American journal of clinical nutrition, 42(2), 190-197.
48. Reynolds, G., & Vance, R. (2004). C-reactive protein immunohistochemical localization in normal and atherosclerotic human aortas. Archives of pathology &
laboratory medicine, 111(3), 265-269.
49. Ridker, P. (2003). Clinical Application of C-Reactive Protein for Cardiovascular Disease Detection and Prevention. Circulation, 107, 363-369.
50. Ridker, P., Hennekens, C., Buring, J., & Rifal, N. (2000). C-reactive protein and other markers of inflammation in the prediction of cardiovascular disease in women. New England Journal of Medicine, 342(12), 836-843.

44
51. Scalfi, L., Coltorti, A., & Contaldo, F. (1991). Postprandial thermogenesis in lean and obese subjects after meals supplemented with medium-chain and long-chain triglycerides. The American journal of clinical nutrition, 53(5), 1130-1133.
52. Seaton, T., Welle, S., Warenko, M., & Campbell, R. (1986). Thermic effect of medium-chain and long-chain triglycerides in man. The American journal of
clinical nutrition, 44(5), 630-634.
53. Seneviratne, K., & Sudarshana Dissanayake, D. (2008). Variation of phenolic content in coconut oil extracted by two conventional methods. International journal of
food science & technology, 43(4), 597-602.
54. Seow, C., & Gwee, C. (1997). Coconut milk: chemistry and technology. International
journal of food science & technology, 32(3), 189-201.
55. Sharma, A., Bemis, M., & Desilets, A. (2014). Role of medium chain triglycerides (Axona®) in the treatment of mild to moderate Alzheimer’s disease. American
Journal of Alzheimer's Disease & Other Dementias®, 29(5), 409-414.
56. St-Onge, M., & Bosarge, A. (2008). Weight-loss diet that includes consumption of medium-chain triacylglycerol oil leads to a greater rate of weight and fat mass loss than does olive oil. The American journal of clinical nutrition, 87(3), 621-626.
57. Sugano, M., & Portman, O. (1965). Essential fatty acid deficiency and cholesterol esterification activity of plasma and liver in vitro and in vivo. Archives of
Biochemistry and Biophysics, 109(2), 302-315.
58. Tholstrup, T., Ehnholm, C., Jauhiainen, M., Peterson, M., Hey, C., Lund, P., & Sandstrom, B. (2004). Effects of medium-chain fatty acids and oleic acid on blood lipids, lipoproteins, glucose, insulin, and lipid transfer protein activities. The American journal of clinical nutrition, 79(4), 564-569.
59. Traul, K., Driedger, A., Ingle, D., & Nakhasi, D. (2000). Review of the toxicologic properties of medium-chain triglycerides. Food and chemical toxicology, 38, 79-98.
60. Verma, S., Kuliszewski, M., Li, S., Szmitko, P., Zucco, L., & Wang, C. S. (2004). C-reactive protein attenuates endothelial progenitor cell survival, differentiation, and function. Circulation, 109(17), 2058-2067.
61. Voon, P., Ng, T., Lee, V., & Nesaretnam, K. (2011). Diets high in palmitic acid (16: 0), lauric and myristic acids (12: 0+ 14: 0), or oleic acid (18: 1) do not alter postprandial or fasting plasma homocysteine and inflammatory markers in healthy Malaysian adults. The American journal of clinical nutrition, 94(6), 1451-1457.

45
62. Ward, P. (2010). Acute and Chronic Inflammation. In Fundamentals of Inflammation (pp. 1-16). Cambridge University Press.
63. Ware, M. (2015, November 23). Coconut Oil: Health Benefits, Nutritional
Breakdown, Risks. Retrieved March 25, 2017, from Medical News Today: http://www.medicalnewstoday.com/articles/282857.php
64. Wein, S., Wolfram, S., Schrezenmeir, J., Gašperiková, D., Klimes, I., & Šeböková, E. (2009). Medium‐chain fatty acids ameliorate insulin resistance caused by high‐fat diets in rats. Diabetes/metabolism research and reviews, 25(2), 185-194.
65. Yeh, E. M., & Willerson, J. M. (2003). Coming of age of C-Reactive Protein - Using Inflammation Markers in Cardiology. Mini-Review: Expert Opnions. Circulation,
107, 370-372.
66. Yost, T., Erskine, J., Gregg, T., Podlecki, D., Brass, E., & Eckel, R. (1994). Dietary substitution of medium chain triglycerides in subjects with non-insulin-dependent diabetes mellitus in an ambulatory setting: impact on glycemic control and insulin-mediated glucose metabolism. Journal of the American College of
Nutrition, 13(6), 615-622.
67. Zakaria, Z., Somchit, M., Mat Jais, A., Teh, L., Salleh, M., & Long, K. (2011). In vivo antinociceptive and anti-inflammatory activities of dried and fermented processed virgin coconut oil. Medical Principles and Practice, 20(3), 231-236.

46
APPENDIX A
IRB APPROVAL

47
APPENDIX A
APPROVAL:CONTINUATION
Carol Johnston
SNHP: Nutrition
602/827-2265
Dear Carol Johnston:
On 8/15/2016 the ASU IRB reviewed the following protocol:
Type of Review: Continuing Review
Title: Dietary Supplementation and Health
Investigator: Carol Johnston
IRB ID: STUDY00003159
Category of review: (2)(a) Blood samples from healthy, non-pregnant adults,
(4) Noninvasive procedures, (9) Convened IRB determined
minimal risk
Funding: Name: Graduate College
Grant Title: None
Grant ID: None
Documents Reviewed:
The IRB approved the protocol from 8/15/2016 to 9/8/2017 inclusive. Three weeks before
9/8/2017 you are to submit a completed Continuing Review application and required
attachments to request continuing approval or closure.

48
If continuing review approval is not granted before the expiration date of 9/8/2017 approval of
this protocol expires on that date. When consent is appropriate, you must use final,
watermarked versions available under the “Documents” tab in ERA-IRB.
In conducting this protocol you are required to follow the requirements listed in the
INVESTIGATOR MANUAL (HRP-103).
Sincerely,
IRB Administrator
cc:
Rachel Shedden
Claudia Thompson-Felty

49
APPENDIX B
TBARS ASSAY

50
APPENDIX B
TBARS Assay (Zeptometrix kit)
1. TBA/Buffer Reagent:
a. Mix 212mg TBA powder + 20ml TBARS Diluent 1 in a small beaker on hot stir plate
until FULLY dissolved (use low heat); be sure to cover with parafilm to avoid
evaporation. This step should also be done in a fume hood as Diluent 1 contains acetic
acid.
b. Add 20 ml TBARS Diluent 2, mix.
c. This solution will be sufficient for one 96-well plate (5 standards and 43 samples).
2. Prepare two sets of standard tubes (1.5mL microcentrifuge) and poke a hole in the lid of one
set of the standard tubes with an 18 gauge needle. Prepare sample tubes and poke a
hole in the lid of each sample tube as well.
3. Prepare stock solutions of the standards in the tubes without holes (be sure to vortex well):
MDA Std # [MDA] (nM/mol) Add MDA Std (ul): Add MDA Diluent (ul)
0 0 0 100
1 12.5 12.5 87.5
2 25 25 75
3 50 50 50
4 100 100 0
4. Add 30uL of stock standard solution or sample to the respective tube with the hole poked in
the lid (for duplicates).
5. Add 30uL SDS to each standard and sample tube.
6. Add 750uL prepared TBA/Buffer Reagent to each tube. Vortex well.
7. Put tubes into 95°C heat block for 60 minutes.
8. Put tubes on ice for 10 minutes.
9. Centrifuge at 3000rpm for 15 minutes at room temperature.
10. Pull of supernatant and re-centrifuge supernatant at 3000rpm for 15 minutes at room
temperature to help purify the supernatant.
11. Add 200ul of re-spun supernatant to each well of a 96-well plate.
12. Read absorbance at 532-540nm.
NOTES:
Bring all reagents to room temp.
SDS will be solid in fridge. Leave at RT x 1hr minimum or place in 37° incubator for 30 seconds to
liquefy.

51
Use water bath at 95° - bright colored multi tube racks work best for this assay.

52
APPENDIX C
CRP ASSAY

53
APPENDIX C
Laboratory Name Test Name: CRPHS
Order information
Analyzer(s) on which kit(s) can be used
05401607 190 Cardiac C-Reactive Protein (Latex) High Sensitive (2 x 50 tests) CRPHS: ACN 217
Roche/Hitachi cobas c 111
11355279 216 Calibrator f.a.s. Proteins (5 x 1 mL) Code 656
11355279 160 Calibrator f.a.s. Proteins (5 x 1 mL, for USA)
Code 656
20766321 322 CRP T Control N (5 x 0.5 mL) Code 235 10557897 122 Precinorm Protein (3 x 1 mL) Code 302 10557897 160 Precinorm Protein (3 x 1 mL, for
USA) Code 302
05117003 190 PreciControl ClinChem Multi 1 (20 x 5 mL)
Code 391
05947626 190 PreciControl ClinChem Multi 1 (4 x 5 mL)
Code 391
05947626 160 PreciControl ClinChem Multi 1 (4 x 5 mL, for USA)
Code 391
05117216 190 PreciControl ClinChem Multi 2 (20 x 5 mL)
Code 392
05947774 190 PreciControl ClinChem Multi 2 (4 x 5 mL)
Code 392
05947774 160 PreciControl ClinChem Multi 2 (4 x 5 mL, for USA)
Code 392
04774230 190 NaCl Diluent 9 % (4 x 12 mL) Code 951
Effective date
Effective date for this procedure: ____________________________
Author
Source documentation compiled by Roche Diagnostics Revised by: ___________________________________________
REF

54
Schedule for review
Last date revised: __________________________________________ Date Reviewed: _____________ Approved: _____________________ Date Reviewed: _____________ Approved: _____________________ Date Reviewed: _____________ Approved: _____________________ Date Reviewed: _____________ Approved: _____________________
System information
CRPHS: ACN 217
Intended use
In vitro test for the quantitative determination of C-reactive protein (CRP) in human serum and plasma on the cobas c 111 system. Measurement of CRP is of use for the detection and evaluation of inflammatory disorders and associated diseases, infection and tissue injury. Highly sensitive measurement of CRP may also be used as an aid in the assessment of the risk of future coronary heart disease. When used as an adjunct to other laboratory evaluation methods of acute coronary syndromes, it may also be an additional independent indicator of recurrent event prognosis in patients with stable coronary disease or acute coronary syndrome.
Summary1,2,3,4,5,6,7,8,9,10,11,12,13,14,15,16,17,18,19,20,21
C-reactive protein is the classic acute phase protein in inflammatory reactions. It is synthesized by the liver and consists of five identical polypeptide chains that form a five-member ring having a molecular weight of 105000 Daltons. CRP is the most sensitive of the acute phase reactants and its concentration increases rapidly during inflammatory processes. Complexed CRP activates the complement system beginning with C1q. CRP then initiates opsonization and phagocytosis of invading cells, but its main function is to bind and detoxify endogenous toxic substances produced as a result of tissue damage. CRP assays are used to detect systemic inflammatory processes (apart from certain types of inflammation such as SLE and Colitis ulcerosa); to assess treatment of bacterial infections with antibiotics; to detect intrauterine infections with concomitant premature amniorrhexis; to differentiate between active and inactive forms of disease with concurrent infection, e.g. in patients suffering from SLE or Colitis ulcerosa; to therapeutically monitor rheumatic disease and assess anti-inflammatory therapy; to determine the presence of post-operative complications at an early stage, such as infected wounds, thrombosis and pneumonia, and to distinguish between infection and bone marrow transplant rejection. Sensitive CRP measurements have been used and discussed for early detection of infection in pediatrics and risk assessment of coronary heart disease. Several studies came to the conclusion that the highly sensitive measurement of CRP could be used as a marker to predict the risk of coronary heart disease in apparently healthy persons and as an indicator of recurrent event
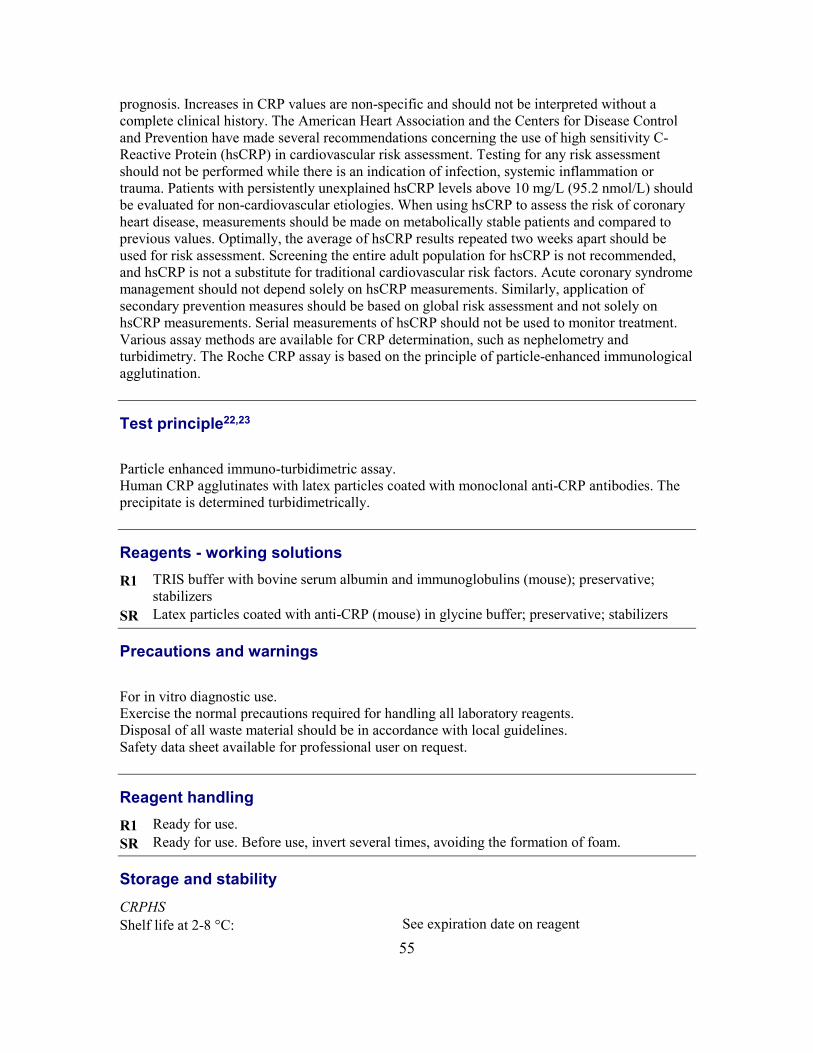
55
prognosis. Increases in CRP values are non-specific and should not be interpreted without a complete clinical history. The American Heart Association and the Centers for Disease Control and Prevention have made several recommendations concerning the use of high sensitivity C-Reactive Protein (hsCRP) in cardiovascular risk assessment. Testing for any risk assessment should not be performed while there is an indication of infection, systemic inflammation or trauma. Patients with persistently unexplained hsCRP levels above 10 mg/L (95.2 nmol/L) should be evaluated for non-cardiovascular etiologies. When using hsCRP to assess the risk of coronary heart disease, measurements should be made on metabolically stable patients and compared to previous values. Optimally, the average of hsCRP results repeated two weeks apart should be used for risk assessment. Screening the entire adult population for hsCRP is not recommended, and hsCRP is not a substitute for traditional cardiovascular risk factors. Acute coronary syndrome management should not depend solely on hsCRP measurements. Similarly, application of secondary prevention measures should be based on global risk assessment and not solely on hsCRP measurements. Serial measurements of hsCRP should not be used to monitor treatment. Various assay methods are available for CRP determination, such as nephelometry and turbidimetry. The Roche CRP assay is based on the principle of particle-enhanced immunological agglutination.
Test principle22,23
Particle enhanced immuno-turbidimetric assay. Human CRP agglutinates with latex particles coated with monoclonal anti-CRP antibodies. The precipitate is determined turbidimetrically.
Reagents - working solutions
R1 TRIS buffer with bovine serum albumin and immunoglobulins (mouse); preservative; stabilizers
SR Latex particles coated with anti-CRP (mouse) in glycine buffer; preservative; stabilizers
Precautions and warnings
For in vitro diagnostic use. Exercise the normal precautions required for handling all laboratory reagents. Disposal of all waste material should be in accordance with local guidelines. Safety data sheet available for professional user on request.
Reagent handling
R1 Ready for use. SR Ready for use. Before use, invert several times, avoiding the formation of foam.
Storage and stability
CRPHS Shelf life at 2-8 °C: See expiration date on reagent

56
On-board in use and refrigerated on the analyzer:
4 weeks
NaCl Diluent 9 %
Shelf life at 2-8 °C: See expiration date on reagent On-board in use and refrigerated on the analyzer:
4 weeks
Specimen collection and preparation
For specimen collection and preparation, only use suitable tubes or collection containers. Only the specimens listed below were tested and found acceptable.
Serum Plasma: Li-heparin, K2-EDTA plasma
The sample types listed were tested with a selection of sample collection tubes that were commercially available at the time of testing, i.e. not all available tubes of all manufacturers were tested. Sample collection systems from various manufacturers may contain differing materials which could affect the test results in some cases. When processing samples in primary tubes (sample collection systems), follow the instructions of the tube manufacturer.
Centrifuge samples containing precipitates before performing the assay.
Stability:24 11 days at 15-25 °C 2 months at 2-8 °C 3 years at (-15)-(-25) °C
Materials provided
See “Reagents - working solutions” section for reagents.
Materials required (but not provided)
See “Order information” section. General laboratory equipment Other suitable control material can be used in addition. _______________________________________________________________________________________ _______________________________________________________________________________________

57
Assay
For optimum performance of the assay follow the directions given in this document for the analyzer concerned. Refer to the appropriate operator's manual for analyzer-specific assay instructions. The performance of applications not validated by Roche is not warranted and must be defined by the user.
Application for serum and plasma
cobas c 111 test definition Measuring mode Absorbance Abs. calculation mode Kinetic Reaction direction Increase Wavelength A 552 nm Calc. first/last 17/34 Unit mg/L (nmol/L, mg/dL) Reaction mode R1-S-SR
Pipetting parameters
Diluent (H2O)
R1 82 µL
Sample 6 µL 48 µL SR 28 µL 14 µL Total volume 178 µL
Calibration
Calibrator Calibrator f.a.s. Proteins Calibration dilution ratio 1:5, 1:10, 1:20, 1:40, 1:80, performed automatically by the
instrument, and Standard 6 = 0 mg/L. Calibration mode Linear interpolation Calibration interval Each lot and as required following quality control
procedures
Enter the assigned lot-specific CRPHS value of the undiluted calibrator (mg/L), indicated in the package insert of C.f.a.s. Proteins. Traceability: This method has been standardized against the reference preparation of the IRMM (Institute for Reference Materials and Measurements) BCR470/CRM470 (RPPHS - Reference Preparation for Proteins in Human Serum).25

58
Quality control
For quality control, use control materials as listed in the “Order information” section. In addition, other suitable control material can be used. The control intervals and limits should be adapted to each laboratory’s individual requirements. Values obtained should fall within the defined limits. Each laboratory should establish corrective measures to be taken if values fall outside the limits. Follow the applicable government regulations and local guidelines for quality control. If controls do not recover within the specified limits, take the following corrective action: _______________________________________________________________________________________ _______________________________________________________________________________________
Calculation
The cobas c 111 analyzer automatically calculates the analyte concentration of each sample.
Conversion factors:
mg/L x 9.52 = nmol/L mg/L x 0.1 = mg/dL
Limitations - interference
Criterion: Recovery within ± 10 % of initial values at CRP levels of 3.0 mg/L.
Icterus:26 No significant interference up to an I index of 60 for conjugated and unconjugated bilirubin (approximate conjugated and unconjugated bilirubin concentration: 1026 µmol/L or 60 mg/dL).
Hemolysis:26 No significant interference up to an H index of 700 (approximate hemoglobin concentration: 435 µmol/L or 700 mg/dL).
Lipemia (Intralipid):26 No significant interference up to an L index of 500. There is poor correlation between the L index (corresponds to turbidity) and triglycerides concentration.
Rheumatoid factors up to 1200 IU/mL do not interfere.
High-dose hook effect: does not occur at CRP concentrations below 40 mg/L or 380 nmol/L. Samples with concentrations > 40 mg/L are flagged either >TEST RNG or “HIGH ACT”.
Drugs: No interference was found at therapeutic concentrations using common drug panels.27,28 Exception: Significantly degreased CRP values may be obtained from samples taken from patients who have been treated with carboxypenicillins.
In very rare cases gammopathy, in particular type IgM (Waldenström's macroglobulinemia), may cause unreliable results. 29
Although measures were taken to minimize interference caused by human anti-mouse antibodies, erroneous findings may be obtained from samples taken from patients who have been treated with monoclonal mouse antibodies or have received them for diagnostic purposes.

59
For diagnostic purposes, the results should always be assessed in conjunction with the patient's medical history, clinical examination and other findings.
Special wash requirements No interfering assays are known which require special wash steps.
Limits and ranges
Measuring range 0.15-20.0 mg/L (1.43-190 nmol/L, 0.015-2.0 mg/dL)
Lower limits of measurement Lower detection limit of the test 0.15 mg/L (1.43 nmol/L, 0.015 mg/dL) The detection limit represents the lowest measurable analyte level that can be distinguished from zero. It is calculated as the value lying 3 standard deviations above that of the lowest standard (standard 1 + 3 SD, repeatability, n = 21).
Functional sensitivity (Limit of Quantitation)
0.3 mg/L (2.86 nmol/L) The functional sensitivity (Limit of Quantitation) is the lowest CRP concentration that can be reproducibly measured with an inter-assay coefficient of variation < 10 %.
Expected values
Consensus reference interval for adults:30
IFCC/CRM 470 mg/dL mg/L nmol/L < 0.5 < 5.0 < 47.6
The CDC/AHA recommended the following hsCRP cut-off points (tertiles) for CVD risk assessment:21,31
hsCRP level (mg/L) hsCRP level (nmol/L) Relative risk < 1.0 < 9.52 low 1.0-3.0 9.52-28.6 average > 3.0 > 28.6 high
Patients with higher hsCRP concentrations are more likely to develop myocardial infarction and severe peripheral vascular disease. 5-95 % reference intervals of neonates and children:32 Neonates (0-3 weeks): 0.1-4.1 mg/L (0.95-39.0 nmol/L) Children (2 months-15 years): 0.1-2.8 mg/L (0.95-26.7 nmol/L) Roche has not evaluated reference values in pediatric population.

60
It is important to monitor the CRP concentration during the acute phase of the illness.
Each laboratory should investigate the transferability of the expected values to its own patient population and if necessary determine its own reference ranges. Increases in CRP values are non-specific and should not be interpreted without a complete clinical history. When using hsCRP to assess the risk of coronary heart disease, measurements should be made on metabolically stable patients and compared to previous values. Optimally, the average of hsCRP results repeated two weeks apart should be used for risk assessment. Measurements should be compared to previous values. When the results are being used for risk assessment, patients with persistently unexplained hsCRP levels of above 10 mg/L (95.2 nmol/L) should be evaluated for non-cardiovascular origins. Testing for any risk assessment should not be performed while there is indication of infection, systemic inflammation or trauma.21
Specific performance data
Representative performance data on the analyzers are given below. Results obtained in individual laboratories may differ.
Precision
Precision was determined using human samples and controls in an internal protocol. Repeatability n = 21, intermediate precision (3 aliquots per run, 1 run per day, 10 days). The following results were obtained:
Repeatability Mean mg/L (nmol/L, mg/dL)
SD mg/L (nmol/L)
CV %
Precinorm Protein 11.4 (109, 1.14) 0.0 (0, 0.0) 0.4 CRP T Control N 4.06 (38.7, 0.406) 0.01 (0.1, 0.01) 0.3 Human serum 1 0.49 (4.66, 0.049) 0.01 (0.07, 0.001) 1.5 Human serum 2 4.02 (38.3, 0.402) 0.02 (0.2, 0.002) 0.6 Human serum 3 16.9 (161, 1.69) 0.1 (1, 0.01) 0.3
Intermediate precision Mean mg/L (nmol/L, mg/dL)
SD mg/L (nmol/L)
CV %
Precinorm Protein 11.3 (108, 1.13) 0.1 (1, 0.01) 0.5 CRP T Control N 3.90 (37.1, 0.390) 0.04 (0.4, 0.004) 1.0 Human serum 4 0.48 (4.57, 0.048) 0.01 (0.10, 0.001) 2.0 Human serum 5 3.91 (37.2, 0.391) 0.05 (0.5, 0.005) 1.4 Human serum 6 16.8 (160, 1.68) 0.1 (1, 0.01) 0.7
Method comparison
CRP values for human serum and plasma samples obtained on the cobas c 111 analyzer (y) were compared to those determined with the same reagent on a COBAS INTEGRA 400 analyzer (x).

61
Sample size (n) = 79
Passing/Bablok33 Linear regression y = 1.035x – 0.111 mg/L y = 1.051x – 0.202 mg/L
τ = 0.962 r = 0.999
The sample concentrations of the reference system (x) were between 0.21 and 18.6 mg/L (2.0 and 177 nmol/L, 0.021 and 1.86 mg/dL).