effects of electroacupuncture versus manual acupuncture … vs manual ac… · effects of...
TRANSCRIPT
Effects of Electroacupuncture versus ManualAcupuncture on the Human Brain
as Measured by fMRIVitaly Napadow,1,2 Nikos Makris,3 Jing Liu,1 Norman W. Kettner,2
Kenneth K. Kwong,1 and Kathleen K.S. Hui1*1Athinoula A. Martinos Center for Biomedical Imaging, Department of Radiology,
Massachusetts General Hospital and Harvard Medical School, Charlestown, Massachusetts2Department of Radiology, Logan College of Chiropractic, Chesterfield, Missouri
3Department of Neurology, Massachusetts General Hospital and Harvard Medical School,Charlestown, Massachusetts
� �
Abstract: The goal of this functional magnetic resonance imaging (fMRI) study was to compare the centraleffects of electroacupuncture at different frequencies with traditional Chinese manual acupuncture. Althoughnot as time-tested as manual acupuncture, electroacupuncture does have the advantage of setting stimulationfrequency and intensity objectively and quantifiably. Manual acupuncture, electroacupuncture at 2 Hz and 100Hz, and tactile control stimulation were carried out at acupoint ST-36. Overall, electroacupuncture (particu-larly at low frequency) produced more widespread fMRI signal increase than manual acupuncture did, andall acupuncture stimulations produced more widespread responses than did our placebo-like tactile controlstimulation. Acupuncture produced hemodynamic signal increase in the anterior insula, and decrease inlimbic and paralimbic structures including the amygdala, anterior hippocampus, and the cortices of thesubgenual and retrosplenial cingulate, ventromedial prefrontal cortex, frontal, and temporal poles, results notseen for tactile control stimulation. Only electroacupuncture produced significant signal increase in theanterior middle cingulate cortex, whereas 2-Hz electroacupuncture produced signal increase in the pontineraphe area. All forms of stimulation (acupuncture and control) produced signal increase in SII. These findingssupport a hypothesis that the limbic system is central to acupuncture effect regardless of specific acupuncturemodality, although some differences do exist in the underlying neurobiologic mechanisms for these modali-ties, and may aid in optimizing their future usage in clinical applications. Hum Brain Mapp 24:193–205, 2005.© 2004 Wiley-Liss, Inc.
Key words: acupuncture methods; current frequencies; human brain mapping; limbic system; electro-acupuncture
� �
INTRODUCTION
Understanding the neurobiologic substrates and mecha-nisms underlying the effects of acupuncture will greatlypromote the integration of this ancient healing art into themodern medical mainstream. Although a broad consensusas to the basic mechanisms underlying acupuncture stimu-lation effects on the central nervous system (CNS) does notyet exist, this system is arguably the most important medi-ator of acupuncture’s multifaceted effects on the body. Theterm “acupuncture” represents a wide range of techniqueswith many variables in needle insertion, manipulation, re-tention, and stimulation. The goal of this functional mag-netic resonance imaging (fMRI) study was to compare thecentral effects of electroacupuncture at different frequenciesversus traditional Chinese manual acupuncture. Ultimately,
Contract grant sponsor: National Institutes of Healh, National Centerfor Complementary and Alternative Medicine; Contract grant num-bers: R21 AT00978-A02, PO1 AT002048-01; Contract grant sponsor:National Center for Research Resources; Contract grant number:P41RR14075; Contract grant sponsor: Mental Illness and NeuroscienceDiscovery (MIND) Institute.*Correspondence to: Dr. Kathleen K.S. Hui, Athinoula A. MartinosCenter for Biomedical Imaging, Department of Radiology, Massa-chusetts General Hospital, 149 13th Street, Rm. 2301, Charlestown,MA 02129. E-mail: [email protected] for publication 16 January 2004; Accepted 23 July 2004DOI: 10.1002/hbm.20081Published online in Wiley InterScience (www.interscience.wiley.com).
� Human Brain Mapping 24:193–205(2005) �
© 2004 Wiley-Liss, Inc.
the choice of acupuncture modality should be consistentwith evidence-based medical research. Functional MRI is apowerful neuroimaging technique with capabilities of spa-tial and temporal resolution that make it an excellent mo-dality to study the response of the brain to acupuncturestimulation [Bandettini et al., 1992; Kwong et al., 1992;Ogawa et al., 1992].
Electroacupuncture (EA) is a technique in which two nee-dles are inserted as electrodes for passing an electric current.At least one of the needles is on an acupoint (a historicallyand empirically predefined location within the humanbody). Although electroacupuncture (dating back less than50 years) is growing in popularity, the more commonly usedacupuncture technique, manual acupuncture (MA) involvesthe insertion of fine needles into acupoints, followed bymanual manipulation (dating back more than 2,000 years)such as twisting the needle or lifting and thrusting. One ofthe main advantages in using EA in clinical practice oracupuncture research is its capacity to set stimulation fre-quency and intensity objectively and quantifiably.
The response of the brain to MA has been studied usingfMRI [Cho et al., 1998; Gareus et al., 2002; Hui et al., 2000;Kong et al., 2002; Wu et al., 1999] and positron emissiontomography (PET) [Biella et al., 2001; Hsieh et al., 2001].Most of these studies demonstrated a broad neuromatrixresponse that involved the limbic system and limbic-relatedbrain structures including the amygdala, hippocampus, hy-pothalamus, cingulate, prefrontal and insular cortices, basalganglia, and cerebellum.
The rationale for investigating different frequencies of EAcomes from the clinical as well as the human and animalexperimental domains. In clinical practice, both low- andhigh-frequency electrostimulation are used often for diverseconditions. Low-frequency stimulation is specifically recom-mended for muscular atrophy [Liu, 1998], whereas high-frequency stimulation is recommended for spinal spasticity[Yuan et al., 1993]. From basic research, several groups haveused animal models to explore the effects of varied fre-quency electrostimulation. Basic animal model research hasdemonstrated that the frequency-dependent response mayresult from association with different CNS targets. For ex-ample, rat model microdialysis studies have demonstratedthat EA with 2-Hz stimulation seems to induce acupunctureanalgesia by the release of endomorphin, �-endorphin andenkephalin binding to � and � opioid receptors. EA with100-Hz stimulation, however, enhances the release of dynor-phin binding to the � opioid receptor in the spinal corddorsal horn [Han et al., 1999b; Ulett et al., 1998] to produceacupuncture analgesic effect. Furthermore, rat model stud-ies demonstrated that EA increased serotonin synthesis andutilization [Han et al., 1979], specifically in the dorsal rapheand raphe magnus nuclei [Kwon et al., 2000]. In addition,low-frequency EA has been reported to attenuate a stress-induced dopamine (DA) increase [Han et al., 1999a; Wang etal., 1999]. Animal neuroimaging using fMRI showed thatlow-frequency EA elicited regional cerebral blood volume(CBV) signal decrease in the cingulate cortex, nucleus ac-
cumbens, septal nuclei, and amygdala in a rat model [Chenet al., 2001]. In human studies on the central effects of EA,frequency dependence was first noted by electroencephalo-graph (EEG) response [Saletu et al., 1975]. A recent acupunc-ture fMRI study found that signal increase in the putamenand insula for low-frequency EA (3 Hz) contrasted withsignal decrease in these structures for MA in normal humansubjects [Kong et al., 2002]. Another study reported a fre-quency-dependent response in different but overlappingbrain networks after transcutaneous electrical nerve stimu-lation (TENS) over an acupoint [Zhang et al., 2003].
More recently, Wu et al. [2002] investigated the specificand nonspecific effects of low-frequency EA (4 Hz) by in-cluding sham, mock, and minimal sensation EA at acupointYanglinquan, GB-34, on the leg. The results demonstratedgreater effect on the limbic and limbic-related brain struc-tures with real EA than with nonspecific or placebo stimu-lation. Specifically, the hemodynamic response producedsignal increase in notable limbic-related regions such as theinsula, thalamus, cerebellum, and the anterior middle cin-gulate cortex. Interestingly, however, the subgenual anteriorcingulate showed signal decrease.
We compared the hemodynamic response in the brain toEA of low (2 Hz) or high (100 Hz) frequency with theresponse to MA and a tactile sensory control carried out atST-36 (Zusanli, a point over the proximal portion of thetibialis anterior muscle). This is one of the most frequentlyused acupoints and has been studied in both animal andhuman acupuncture protocols, allowing for further compar-ison with our neuroimaging results.
SUBJECTS AND METHODS
Subject Recruitment
This study was carried out on 13 healthy, right-handedsubjects (6 men, 7 women; age range 21–42 years) and wasapproved by the Massachusetts General Hospital Subcom-mittee on Human Studies. The subjects included 10 Cauca-sians, 1 Hispanic, 1 African-American, and 1 Asian. Subjectswere screened and excluded for psychiatric and neurologicdisorders, head trauma with loss of consciousness, or otherserious cardiovascular, respiratory, or renal illness. Mostimportantly, all subjects in this study were naı̈ve to acu-puncture, having never experienced an acupuncture treat-ment, although a conceptual familiarity with acupuncturewas not considered an exclusion criterion.
Subjects were asked to lie supine on the scanner bed, witheyes closed during experimental runs. They were told theirbrain would be scanned in response to acupuncture stimu-lation, and that the stimulation could be manual or electrical,although they were not informed of which before the exper-imental run. After each run, subjects were questioned as totheir psychophysical reaction to the procedure. The order ofEA and MA was alternated for different subjects, whereasexperimental runs with tactile sensory control stimulationwere done before any real acupuncture. Naı̈ve subjects lyingsupine in an enclosed MRI scanner bore would not be able to
� Napadow et al. �
� 194 �
differentiate innocuous (sensory control) tapping from acu-puncture sensation, until they experienced the latter. Thesensory control experiments carried out on a subset of oursubjects thus tested the nonspecific placebo-like effects ofacupuncture, in addition to acupoint-specific nonneedle tac-tile sensory stimulation.
Subject motion artifact and scanning constraints resultedin a final cohort wherein eight subjects were included in theanalysis of manual acupuncture stimulation: 13 for 2-Hz EA,eight subjects for 100-Hz EA, and eight for sensory controlstimulation. Excessive motion was the exclusion criteria forno more than two subjects for any group.
EXPERIMENTAL PROTOCOL
A separate scan was collected for acupuncture or sensorycontrol stimulation at each acupoint. Sensory control stim-ulation was completed first. This stimulation consisted of arepetitive tactile stimulation carried out by a different inves-tigator than the one who analyzed the data. The stimuluswas a manual tapping at 1 Hz over left ST-36 with a 5.88 vonFrey monofilament. After the control stimulation, the scanorder was alternated for each subject and consisted of man-ual stimulation acupuncture, electroacupuncture with 2-Hzpulses, and electroacupuncture with 100-Hz pulses. The acu-point was needled with 0.22-mm diameter, 40-mm lengthpure stainless steel disposable needles (KINGLI MedicalAppliance Co., Ltd., Wuxi, China). Needle depth rangedfrom 1–1.5 cm depending on the size of the tibialis anteriormuscle. Manual stimulation at left ST-36 consisted of “even-motion” twisting technique at 1 Hz. Acupoints on differentlegs were used for MA versus EA to avoid receptor accom-modation at a single overstimulated acupoint. Electroacu-puncture was carried out with one electrode attached tothe acupuncture needle in right ST-36 and another in ashallowly inserted point 1 cm proximal (a non-acupointon the ST meridian). Current was delivered with a mod-ified current-constant HANS (Han’s Acupoint NerveStimulator) LH202 (Neuroscience Research Center, Pe-king University, Beijing, China). We used current ampli-tude that ranged from 0.7–3.6 mA, set midway betweenthe sensory and pain thresholds for each subject. Thewaveform consisted of biphasic rectangular pulses (pulsewidth: 1 ms for 2 Hz, 0.2 ms for 100 Hz). Because periph-eral neuroreceptors respond directly to current load andnormal tissue response alters electrical resistance, it isimportant to use a current-constant EA stimulation de-vice. A voltage-constant device (common in clinical prac-tice) would produce variable current load, and lead tononuniformity in stimulation intensity.
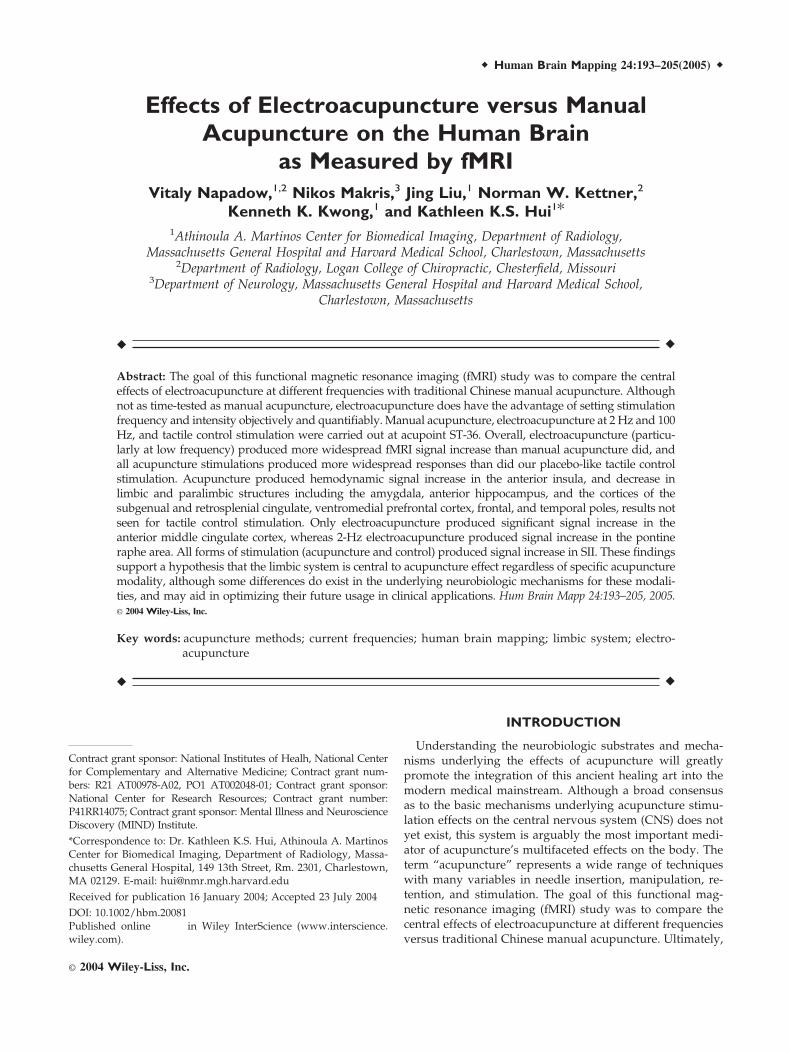
The total scan time for each run was 7 min (Fig. 1). Afterthe needle(s) were inserted into the acupoint, scanning com-menced with a rest period of 2 min (R1). This was followedby two epochs of needle stimulation (S1, S2), each lasting 1min, separated by a rest interval of 2 min (R2). The runended with a 1-min rest interval (R3).
MR Imaging Parameters
Functional scans were acquired using a 3.0-Tesla SiemensAllegra MRI System equipped for echo-planar imaging.Blood oxygenation level-dependent (BOLD) functional im-aging was carried out using a gradient echo T2*-weightedpulse sequence (TE � 30 ms, TR � 4 s, 105 images per slice,matrix � 64 � 64, field of view [FOV] � 200 mm, flip angle� 90 degrees). We acquired 38 sagittal slices, 3 mm thickwith 0.6-mm gap (voxel size 3.13 � 3.13 � 3 mm). Imagecollection was preceded by four dummy scans to allow forequilibration of the MRI signal. A 3-D MPRAGE T1-weighted high-resolution structural dataset (TR/TE/FOV� 2.73 s/3.19 ms/256 mm, slice thickness � 1.33 mm, flipangle � 7 degrees, matrix size � 192 � 256) was collectedbefore functional imaging to facilitate Talairach transforma-tion and visualization.
Single Subject Analysis
Images were first motion corrected with AFNI (softwarefor analysis and visualization of fMRI) through an iterated,linearized, weighted least-squares method with Fourier in-terpolation [Cox, 1996]. Data runs were excluded if grosstranslational motion exceeded 3 mm on any axis. Statisticalparametric mapping was completed via a generalized linearmodel by first estimating the impulse response functionfrom the input stimulus function for the entire 7-min run(block design). This was followed by a convolution of thisfunction with the aforementioned stimulus function. Theestimated response function was then compared with a t-testto the time series data in each brain voxel (3dDeconvolve,AFNI). Fit quality of the full model to the fMRI data wasmeasured by t-statistic and associated P value based ondegrees of freedom (df) calculated from the number of timepoints (7 min/TR � 105). Percent change was calculated bycalculating the percentage deviation of the stimulus blocksin the full model fit from the rest-block derived baselinemodel fit. The P value was color-mapped onto the subject’sown high-resolution T1-weighted 3D anatomic dataset (inTalairach space). No spatial or temporal preprocessingsmoothing was done on the data. Data were thresholded at
Figure 1.Experimental paradigm and location of acupoint ST-36 (Zusanli)over the tibialis anterior muscle. Total scan time for each run was7 min. After needle(s) was inserted into the acupoint, scanningcommenced with a rest period of 2 min (R1), followed by twoepochs of needle stimulation (S1, S2), each lasting 1 min, separatedby a rest interval of 2 min (R2). The run ended with a 1-min restinterval (R3).
.
� Electro- vs. Manual Acupuncture Measured by fMRI �
� 195 �
P � 0.001 (t � 3.38) and a minimum cluster size of 3 voxels.The signal time course was also compared visually with thestimulus paradigm. To address the multiple comparisoncorrection, a Monte Carlo simulation was completed, theresults of which demonstrated that our combination of clus-tering and thresholding produced a false-positive discoveryrate ( of less than 0.4% (AlphaSim, AFNI).
Anatomic analysis was carried out in the frontal, parietal,and temporal cortices, subcortical cerebral gray, as well as inthe brainstem. Regions of interest (ROIs) in the frontal cortexincluded the ventromedial, dorsomedial, and dorsolateralprefrontal areas, precentral gyrus, frontorbital cortex, cingu-late gyrus (subgenual, pregenual, anteromiddle, postero-middle, and posterior), and the dorsomedial, ventromedial,and dorsolateral portions of the frontal pole. In the parietalcortex, we investigated the postcentral gyrus and the infe-rior parietal lobule, which included the angular and supra-marginal gyri. Specifically, SI was defined as the postcentralgyrus (including the homuncular leg region at its mesialsurface), whereas SII was defined as the parietal operculum.In the temporal cortex, we included the temporal pole andanterior and posterior insula, hippocampus, and parahip-pocampus. The subcortical gray included the caudate, nu-cleus accumbens, putamen, globus pallidus, thalamus (an-terior, posterior, middle medial, middle anterolateral,middle posterolateral, lateral, and medial geniculate nuclei),amygdala, hypothalamus, and subthalamic area. Additionalcerebral structures considered included the basal forebrain,pineal gland, habenula, and septal area. Brainstem analysisincluded structures in the midbrain (e.g., ventral tegmentalarea, red nucleus, and substantia nigra), pons, and medulla.Specifically, the pontine raphe nuclei area was defined as amidsagittal region approximately at the half distance be-tween the fourth ventricle and ventral border of the pons.This region extended the length of the pons and included thenucleus raphe superior and the nucleus raphe pontis in theupper pons, and the nucleus raphe magnus in the lowerpons [Parent, 1996]. In all, 52 different regions were definedand investigated for significant fMRI signal response.
The anatomic definitions of the ROIs used in this studywere based on methods published previously through theCenter for Morphometric Analysis, Department of Neurol-ogy, MGH [Caviness et al., 1996; DaSilva et al., 2002; Filipeket al., 1994; Kirifides et al., 2001] and have been applied andadapted in a number of studies [Breiter et al., 1997; Hui et al.,2000; Poellinger et al., 2001]. After these definitions, theanatomic localization and labeling of the functional data wasdetermined by both Talairach coordinates and inspection byour neuroanatomist (N.M.).
Group Subject Analysis
Group averaged analysis also followed the general linearmodeling approach. Multiple runs from individual subjectsfor a given stimulus were averaged. Individual subject datawere transformed into Talairach space, normalized to aver-age image intensity, blurred with a spatial Gaussian filter(full-width half-maximum [FWHM] � 2 mm) to compensate
for any residual differences, and averaged. This adaptedfixed-effect model was thresholded at a more conservative P� 0.0001 (t � 4.06), with a minimum cluster size of 3 voxels( � 0.1%, AlphaSim).
The results of the group analysis were cross-referencedsystematically with the results of the individual analysis. Forevery given ROI/brain structure, results were reported onlyif the individual analysis demonstrated that greater than60% of subjects at threshold P � 0.001 (t � 3.38, � 0.4%)corroborated the group analysis result. Furthermore, resultswould be reported as subthreshold if and only if greaterthan 50% of individuals corroborated the group results, andgreater than 70% of subjects passed under a slightly relaxedthreshold of P � 0.005 (t � 2.88, representing , � 25.9%). Ifresponses in a given region included both signal increaseand decrease, the most statistically significant response (Pvalue) was recorded. Statistical parametric maps were dis-played along with a representative de-trended time coursethat had been filtered with a second order Savitzky-Golayfilter (MATLAB, MathWorks, Natick, MA). For each periodin the run, i.e., rest (R1, R2, and R3) or stimulation (S1 andS2), mean signal was overlaid on the time course for clari-fication purposes only.
RESULTS
fMRI Results
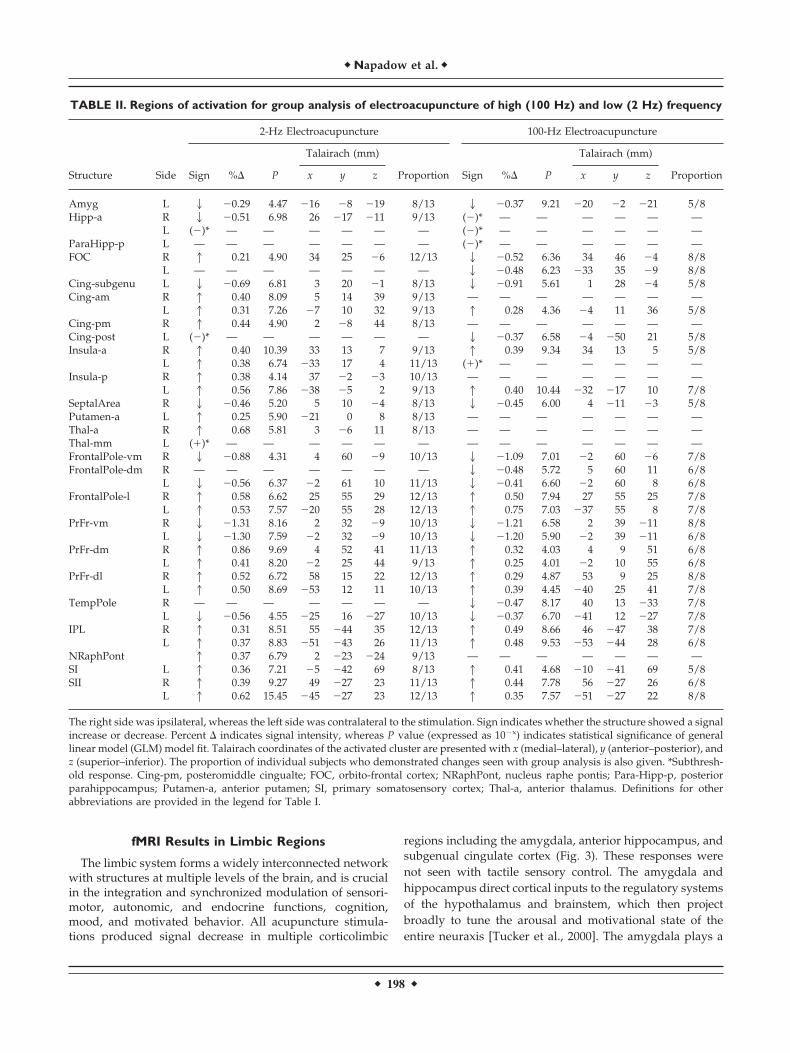
A group analysis comparing MA with 2-Hz EA, 100-HzEA, and tactile sensory control demonstrated notable differ-ences between active acupuncture and control stimulation.EA produced more widespread signal increase, particularlyat low frequency. Of 52 regions investigated, MA producedsignal increase in seven distinct regions, whereas 2-Hz EAproduced signal increase in 15, and 100-Hz EA in nineregions. All three acupuncture stimulations (MA, 2-Hz EA,and 100-Hz EA) produced more regions of positive andnegative hemodynamic signal response than did the tactilesensory control. The data for MA and sensory control arepresented in Table I, whereas EA (high and low frequency)data are presented in Table II.
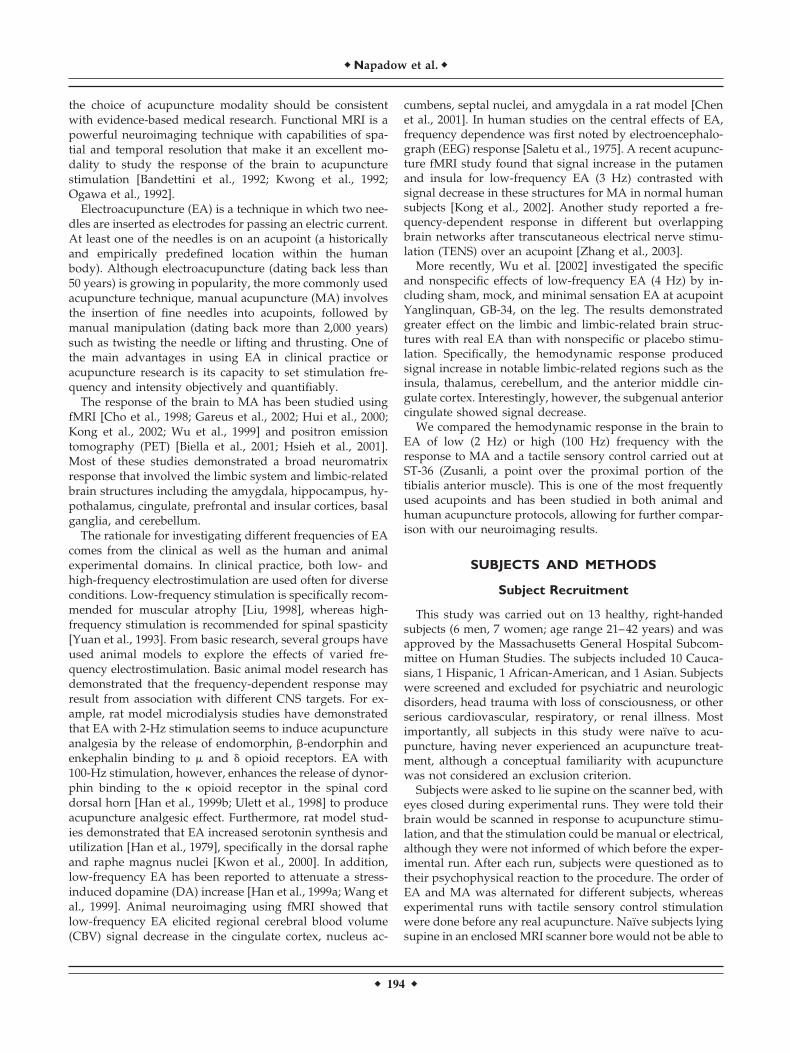
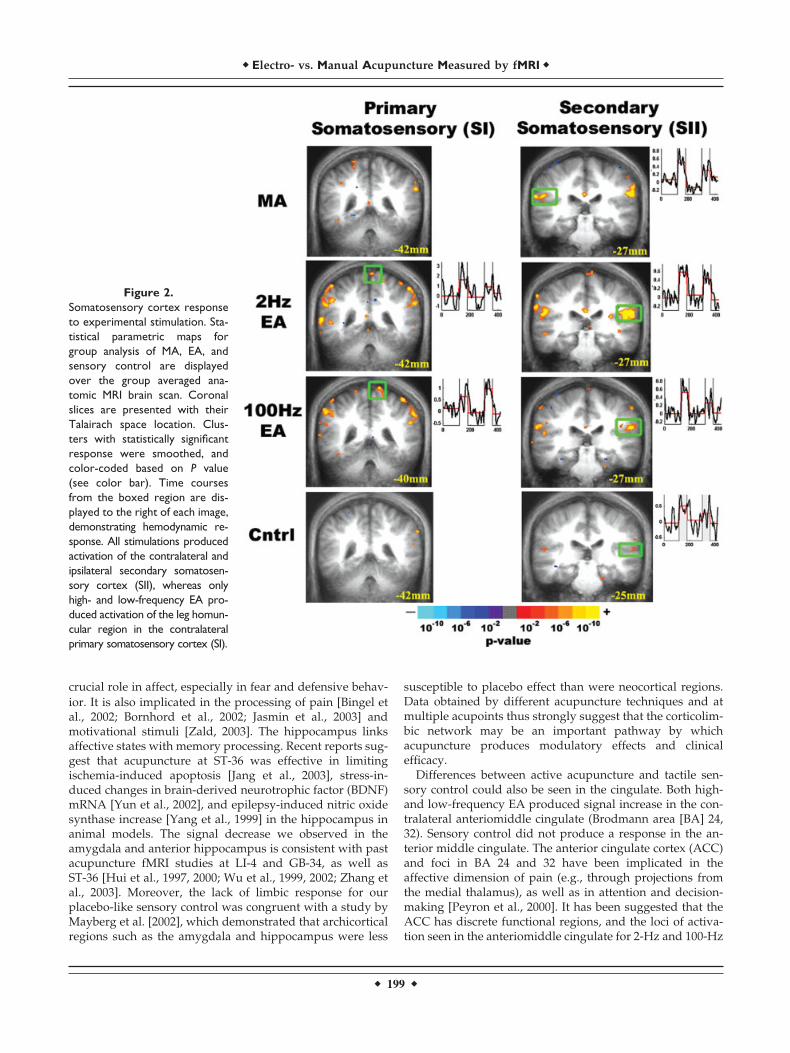
Predictably, the secondary somatosensory cortex (parietaloperculum, SII) demonstrated a positive hemodynamic re-sponse for all experimental stimulations. The homuncularleg topographic representation in the primary somatosen-sory cortex (SI) demonstrated positive hemodynamic re-sponse for both high and low frequency EA (Fig. 2).
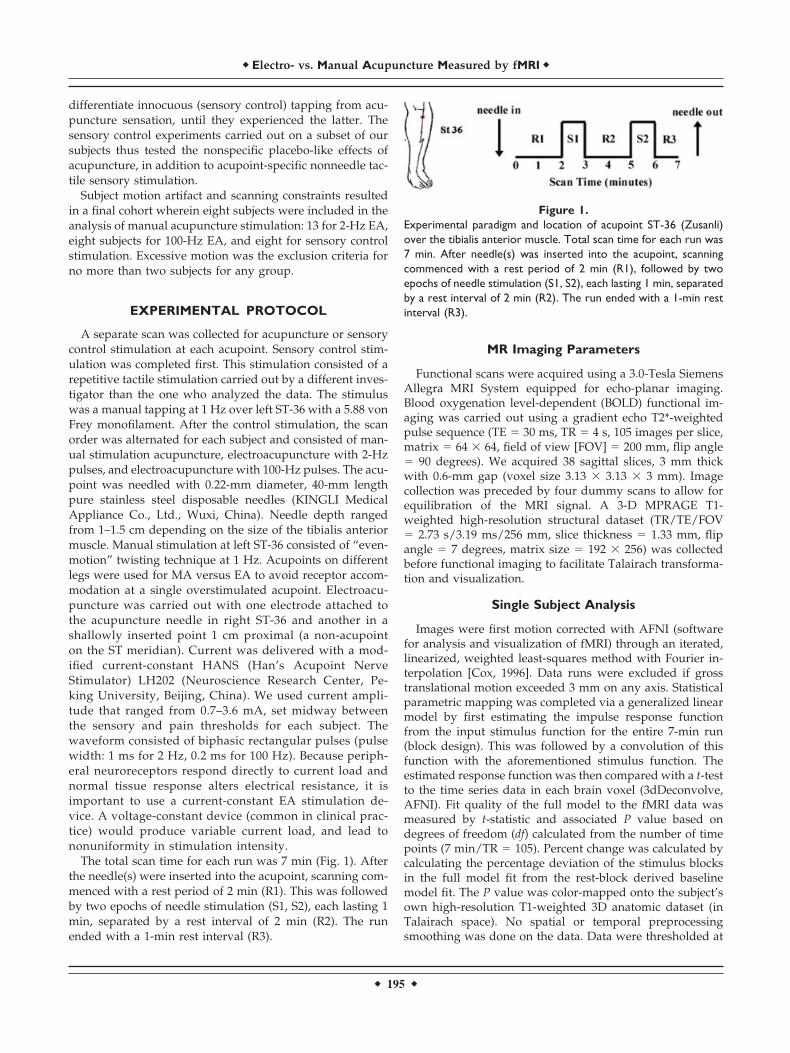
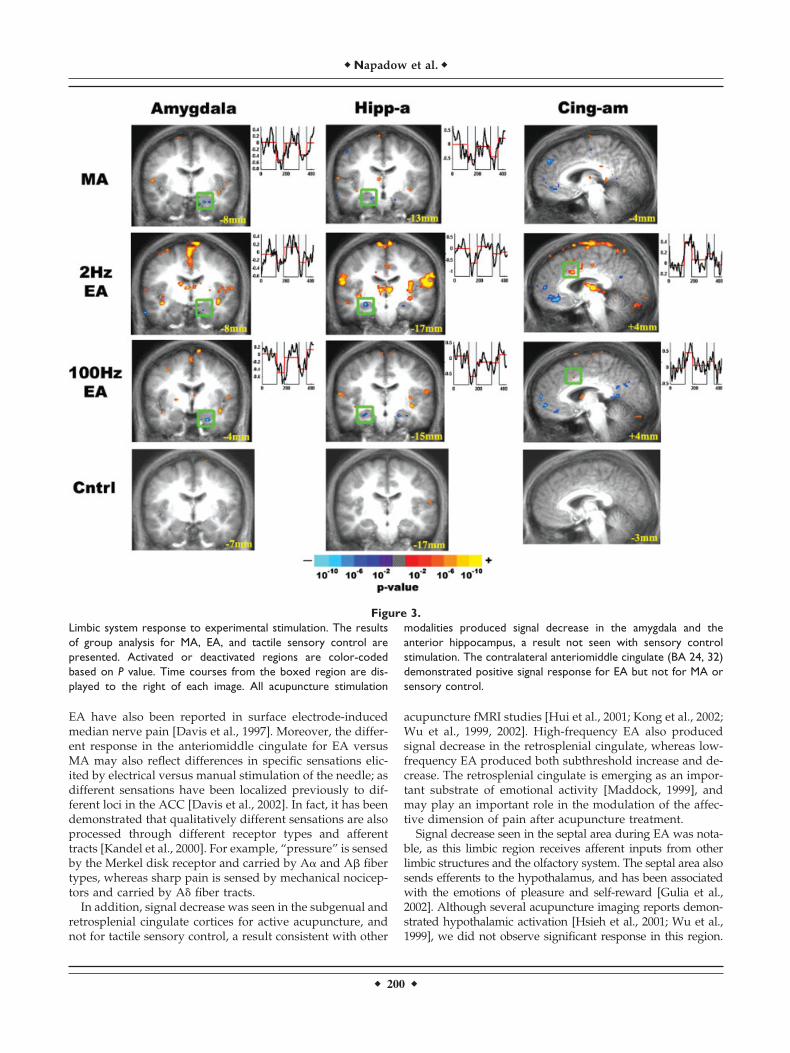
Within the limbic system, the amygdala, subgenual andretrosplenial cingulate, and anterior hippocampus demon-strated signal decrease for all modes of acupuncture (Fig. 3).The contralateral anterior middle cingulate demonstrated apositive signal response for EA but not for MA or tactilesensory control, whereas the septal area demonstrated sig-nal decrease only for EA stimulation.
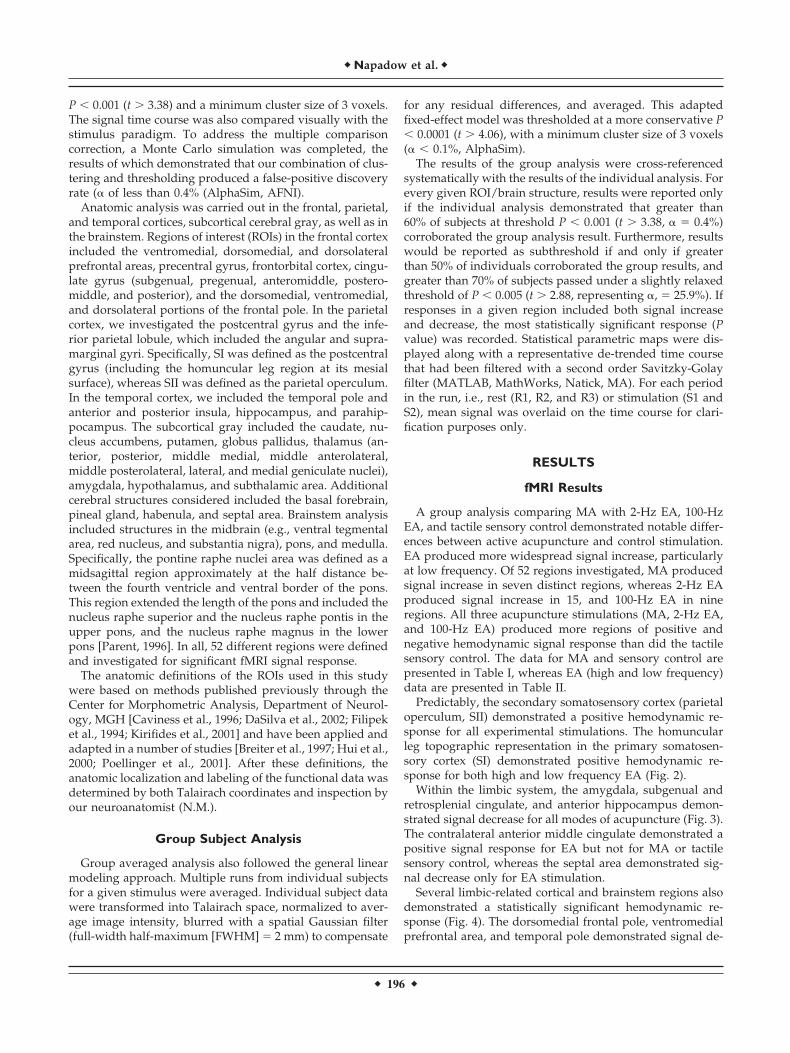
Several limbic-related cortical and brainstem regions alsodemonstrated a statistically significant hemodynamic re-sponse (Fig. 4). The dorsomedial frontal pole, ventromedialprefrontal area, and temporal pole demonstrated signal de-
� Napadow et al. �
� 196 �
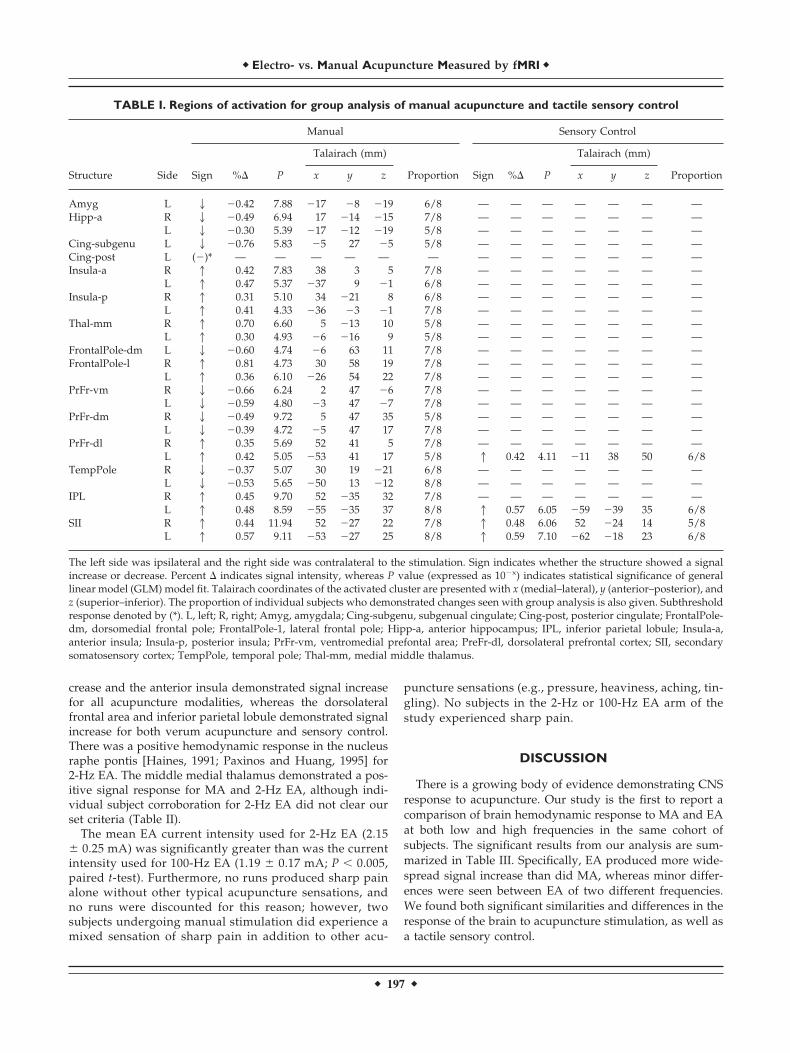
crease and the anterior insula demonstrated signal increasefor all acupuncture modalities, whereas the dorsolateralfrontal area and inferior parietal lobule demonstrated signalincrease for both verum acupuncture and sensory control.There was a positive hemodynamic response in the nucleusraphe pontis [Haines, 1991; Paxinos and Huang, 1995] for2-Hz EA. The middle medial thalamus demonstrated a pos-itive signal response for MA and 2-Hz EA, although indi-vidual subject corroboration for 2-Hz EA did not clear ourset criteria (Table II).
The mean EA current intensity used for 2-Hz EA (2.15 0.25 mA) was significantly greater than was the currentintensity used for 100-Hz EA (1.19 0.17 mA; P � 0.005,paired t-test). Furthermore, no runs produced sharp painalone without other typical acupuncture sensations, andno runs were discounted for this reason; however, twosubjects undergoing manual stimulation did experience amixed sensation of sharp pain in addition to other acu-
puncture sensations (e.g., pressure, heaviness, aching, tin-gling). No subjects in the 2-Hz or 100-Hz EA arm of thestudy experienced sharp pain.
DISCUSSION
There is a growing body of evidence demonstrating CNSresponse to acupuncture. Our study is the first to report acomparison of brain hemodynamic response to MA and EAat both low and high frequencies in the same cohort ofsubjects. The significant results from our analysis are sum-marized in Table III. Specifically, EA produced more wide-spread signal increase than did MA, whereas minor differ-ences were seen between EA of two different frequencies.We found both significant similarities and differences in theresponse of the brain to acupuncture stimulation, as well asa tactile sensory control.
TABLE I. Regions of activation for group analysis of manual acupuncture and tactile sensory control
Structure Side
Manual Sensory Control
Sign %� P
Talairach (mm)
Proportion Sign %� P
Talairach (mm)
Proportionx y z x y z
Amyg L 2 �0.42 7.88 �17 �8 �19 6/8 — — — — — — —Hipp-a R 2 �0.49 6.94 17 �14 �15 7/8 — — — — — — —
L 2 �0.30 5.39 �17 �12 �19 5/8 — — — — — — —Cing-subgenu L 2 �0.76 5.83 �5 27 �5 5/8 — — — — — — —Cing-post L (�)* — — — — — — — — — — — — —Insula-a R 1 0.42 7.83 38 3 5 7/8 — — — — — — —
L 1 0.47 5.37 �37 9 �1 6/8 — — — — — — —Insula-p R 1 0.31 5.10 34 �21 8 6/8 — — — — — — —
L 1 0.41 4.33 �36 �3 �1 7/8 — — — — — — —Thal-mm R 1 0.70 6.60 5 �13 10 5/8 — — — — — — —
L 1 0.30 4.93 �6 �16 9 5/8 — — — — — — —FrontalPole-dm L 2 �0.60 4.74 �6 63 11 7/8 — — — — — — —FrontalPole-l R 1 0.81 4.73 30 58 19 7/8 — — — — — — —
L 1 0.36 6.10 �26 54 22 7/8 — — — — — — —PrFr-vm R 2 �0.66 6.24 2 47 �6 7/8 — — — — — — —
L 2 �0.59 4.80 �3 47 �7 7/8 — — — — — — —PrFr-dm R 2 �0.49 9.72 5 47 35 5/8 — — — — — — —
L 2 �0.39 4.72 �5 47 17 7/8 — — — — — — —PrFr-dl R 1 0.35 5.69 52 41 5 7/8 — — — — — — —
L 1 0.42 5.05 �53 41 17 5/8 1 0.42 4.11 �11 38 50 6/8TempPole R 2 �0.37 5.07 30 19 �21 6/8 — — — — — — —
L 2 �0.53 5.65 �50 13 �12 8/8 — — — — — — —IPL R 1 0.45 9.70 52 �35 32 7/8 — — — — — — —
L 1 0.48 8.59 �55 �35 37 8/8 1 0.57 6.05 �59 �39 35 6/8SII R 1 0.44 11.94 52 �27 22 7/8 1 0.48 6.06 52 �24 14 5/8
L 1 0.57 9.11 �53 �27 25 8/8 1 0.59 7.10 �62 �18 23 6/8
The left side was ipsilateral and the right side was contralateral to the stimulation. Sign indicates whether the structure showed a signalincrease or decrease. Percent � indicates signal intensity, whereas P value (expressed as 10�x) indicates statistical significance of generallinear model (GLM) model fit. Talairach coordinates of the activated cluster are presented with x (medial–lateral), y (anterior–posterior), andz (superior–inferior). The proportion of individual subjects who demonstrated changes seen with group analysis is also given. Subthresholdresponse denoted by (*). L, left; R, right; Amyg, amygdala; Cing-subgenu, subgenual cingulate; Cing-post, posterior cingulate; FrontalPole-dm, dorsomedial frontal pole; FrontalPole-1, lateral frontal pole; Hipp-a, anterior hippocampus; IPL, inferior parietal lobule; Insula-a,anterior insula; Insula-p, posterior insula; PrFr-vm, ventromedial prefontal area; PreFr-dl, dorsolateral prefrontal cortex; SII, secondarysomatosensory cortex; TempPole, temporal pole; Thal-mm, medial middle thalamus.
� Electro- vs. Manual Acupuncture Measured by fMRI �
� 197 �
fMRI Results in Limbic Regions
The limbic system forms a widely interconnected networkwith structures at multiple levels of the brain, and is crucialin the integration and synchronized modulation of sensori-motor, autonomic, and endocrine functions, cognition,mood, and motivated behavior. All acupuncture stimula-tions produced signal decrease in multiple corticolimbic
regions including the amygdala, anterior hippocampus, andsubgenual cingulate cortex (Fig. 3). These responses werenot seen with tactile sensory control. The amygdala andhippocampus direct cortical inputs to the regulatory systemsof the hypothalamus and brainstem, which then projectbroadly to tune the arousal and motivational state of theentire neuraxis [Tucker et al., 2000]. The amygdala plays a
TABLE II. Regions of activation for group analysis of electroacupuncture of high (100 Hz) and low (2 Hz) frequency
Structure Side
2-Hz Electroacupuncture 100-Hz Electroacupuncture
Sign %� P
Talairach (mm)
Proportion Sign %� P
Talairach (mm)
Proportionx y z x y z
Amyg L 2 �0.29 4.47 �16 �8 �19 8/13 2 �0.37 9.21 �20 �2 �21 5/8Hipp-a R 2 �0.51 6.98 26 �17 �11 9/13 (�)* — — — — — —
L (�)* — — — — — — (�)* — — — — — —ParaHipp-p L — — — — — — — (�)* — — — — — —FOC R 1 0.21 4.90 34 25 �6 12/13 2 �0.52 6.36 34 46 �4 8/8
L — — — — — — — 2 �0.48 6.23 �33 35 �9 8/8Cing-subgenu L 2 �0.69 6.81 3 20 �1 8/13 2 �0.91 5.61 1 28 �4 5/8Cing-am R 1 0.40 8.09 5 14 39 9/13 — — — — — — —
L 1 0.31 7.26 �7 10 32 9/13 1 0.28 4.36 �4 11 36 5/8Cing-pm R 1 0.44 4.90 2 �8 44 8/13 — — — — — — —Cing-post L (�)* — — — — — — 2 �0.37 6.58 �4 �50 21 5/8Insula-a R 1 0.40 10.39 33 13 7 9/13 1 0.39 9.34 34 13 5 5/8
L 1 0.38 6.74 �33 17 4 11/13 ( )* — — — — — —Insula-p R 1 0.38 4.14 37 �2 �3 10/13 — — — — — — —
L 1 0.56 7.86 �38 �5 2 9/13 1 0.40 10.44 �32 �17 10 7/8SeptalArea R 2 �0.46 5.20 5 10 �4 8/13 2 �0.45 6.00 4 �11 �3 5/8Putamen-a L 1 0.25 5.90 �21 0 8 8/13 — — — — — — —Thal-a R 1 0.68 5.81 3 �6 11 8/13 — — — — — — —Thal-mm L ( )* — — — — — — — — — — — — —FrontalPole-vm R 2 �0.88 4.31 4 60 �9 10/13 2 �1.09 7.01 �2 60 �6 7/8FrontalPole-dm R — — — — — — — 2 �0.48 5.72 5 60 11 6/8
L 2 �0.56 6.37 �2 61 10 11/13 2 �0.41 6.60 �2 60 8 6/8FrontalPole-l R 1 0.58 6.62 25 55 29 12/13 1 0.50 7.94 27 55 25 7/8
L 1 0.53 7.57 �20 55 28 12/13 1 0.75 7.03 �37 55 8 7/8PrFr-vm R 2 �1.31 8.16 2 32 �9 10/13 2 �1.21 6.58 2 39 �11 8/8
L 2 �1.30 7.59 �2 32 �9 10/13 2 �1.20 5.90 �2 39 �11 6/8PrFr-dm R 1 0.86 9.69 4 52 41 11/13 1 0.32 4.03 4 9 51 6/8
L 1 0.41 8.20 �2 25 44 9/13 1 0.25 4.01 �2 10 55 6/8PrFr-dl R 1 0.52 6.72 58 15 22 12/13 1 0.29 4.87 53 9 25 8/8
L 1 0.50 8.69 �53 12 11 10/13 1 0.39 4.45 �40 25 41 7/8TempPole R — — — — — — — 2 �0.47 8.17 40 13 �33 7/8
L 2 �0.56 4.55 �25 16 �27 10/13 2 �0.37 6.70 �41 12 �27 7/8IPL R 1 0.31 8.51 55 �44 35 12/13 1 0.49 8.66 46 �47 38 7/8
L 1 0.37 8.83 �51 �43 26 11/13 1 0.48 9.53 �53 �44 28 6/8NRaphPont 1 0.37 6.79 2 �23 �24 9/13 — — — — — — —SI L 1 0.36 7.21 �5 �42 69 8/13 1 0.41 4.68 �10 �41 69 5/8SII R 1 0.39 9.27 49 �27 23 11/13 1 0.44 7.78 56 �27 26 6/8
L 1 0.62 15.45 �45 �27 23 12/13 1 0.35 7.57 �51 �27 22 8/8
The right side was ipsilateral, whereas the left side was contralateral to the stimulation. Sign indicates whether the structure showed a signalincrease or decrease. Percent � indicates signal intensity, whereas P value (expressed as 10�x) indicates statistical significance of generallinear model (GLM) model fit. Talairach coordinates of the activated cluster are presented with x (medial–lateral), y (anterior–posterior), andz (superior–inferior). The proportion of individual subjects who demonstrated changes seen with group analysis is also given. *Subthresh-old response. Cing-pm, posteromiddle cingualte; FOC, orbito-frontal cortex; NRaphPont, nucleus raphe pontis; Para-Hipp-p, posteriorparahippocampus; Putamen-a, anterior putamen; SI, primary somatosensory cortex; Thal-a, anterior thalamus. Definitions for otherabbreviations are provided in the legend for Table I.
� Napadow et al. �
� 198 �
crucial role in affect, especially in fear and defensive behav-ior. It is also implicated in the processing of pain [Bingel etal., 2002; Bornhord et al., 2002; Jasmin et al., 2003] andmotivational stimuli [Zald, 2003]. The hippocampus linksaffective states with memory processing. Recent reports sug-gest that acupuncture at ST-36 was effective in limitingischemia-induced apoptosis [Jang et al., 2003], stress-in-duced changes in brain-derived neurotrophic factor (BDNF)mRNA [Yun et al., 2002], and epilepsy-induced nitric oxidesynthase increase [Yang et al., 1999] in the hippocampus inanimal models. The signal decrease we observed in theamygdala and anterior hippocampus is consistent with pastacupuncture fMRI studies at LI-4 and GB-34, as well asST-36 [Hui et al., 1997, 2000; Wu et al., 1999, 2002; Zhang etal., 2003]. Moreover, the lack of limbic response for ourplacebo-like sensory control was congruent with a study byMayberg et al. [2002], which demonstrated that archicorticalregions such as the amygdala and hippocampus were less
susceptible to placebo effect than were neocortical regions.Data obtained by different acupuncture techniques and atmultiple acupoints thus strongly suggest that the corticolim-bic network may be an important pathway by whichacupuncture produces modulatory effects and clinicalefficacy.
Differences between active acupuncture and tactile sen-sory control could also be seen in the cingulate. Both high-and low-frequency EA produced signal increase in the con-tralateral anteriomiddle cingulate (Brodmann area [BA] 24,32). Sensory control did not produce a response in the an-terior middle cingulate. The anterior cingulate cortex (ACC)and foci in BA 24 and 32 have been implicated in theaffective dimension of pain (e.g., through projections fromthe medial thalamus), as well as in attention and decision-making [Peyron et al., 2000]. It has been suggested that theACC has discrete functional regions, and the loci of activa-tion seen in the anteriomiddle cingulate for 2-Hz and 100-Hz
Figure 2.Somatosensory cortex responseto experimental stimulation. Sta-tistical parametric maps forgroup analysis of MA, EA, andsensory control are displayedover the group averaged ana-tomic MRI brain scan. Coronalslices are presented with theirTalairach space location. Clus-ters with statistically significantresponse were smoothed, andcolor-coded based on P value(see color bar). Time coursesfrom the boxed region are dis-played to the right of each image,demonstrating hemodynamic re-sponse. All stimulations producedactivation of the contralateral andipsilateral secondary somatosen-sory cortex (SII), whereas onlyhigh- and low-frequency EA pro-duced activation of the leg homun-cular region in the contralateralprimary somatosensory cortex (SI).
� Electro- vs. Manual Acupuncture Measured by fMRI �
� 199 �
EA have also been reported in surface electrode-inducedmedian nerve pain [Davis et al., 1997]. Moreover, the differ-ent response in the anteriomiddle cingulate for EA versusMA may also reflect differences in specific sensations elic-ited by electrical versus manual stimulation of the needle; asdifferent sensations have been localized previously to dif-ferent loci in the ACC [Davis et al., 2002]. In fact, it has beendemonstrated that qualitatively different sensations are alsoprocessed through different receptor types and afferenttracts [Kandel et al., 2000]. For example, “pressure” is sensedby the Merkel disk receptor and carried by A and A� fibertypes, whereas sharp pain is sensed by mechanical nocicep-tors and carried by A� fiber tracts.
In addition, signal decrease was seen in the subgenual andretrosplenial cingulate cortices for active acupuncture, andnot for tactile sensory control, a result consistent with other
acupuncture fMRI studies [Hui et al., 2001; Kong et al., 2002;Wu et al., 1999, 2002]. High-frequency EA also producedsignal decrease in the retrosplenial cingulate, whereas low-frequency EA produced both subthreshold increase and de-crease. The retrosplenial cingulate is emerging as an impor-tant substrate of emotional activity [Maddock, 1999], andmay play an important role in the modulation of the affec-tive dimension of pain after acupuncture treatment.
Signal decrease seen in the septal area during EA was nota-ble, as this limbic region receives afferent inputs from otherlimbic structures and the olfactory system. The septal area alsosends efferents to the hypothalamus, and has been associatedwith the emotions of pleasure and self-reward [Gulia et al.,2002]. Although several acupuncture imaging reports demon-strated hypothalamic activation [Hsieh et al., 2001; Wu et al.,1999], we did not observe significant response in this region.
Figure 3.Limbic system response to experimental stimulation. The resultsof group analysis for MA, EA, and tactile sensory control arepresented. Activated or deactivated regions are color-codedbased on P value. Time courses from the boxed region are dis-played to the right of each image. All acupuncture stimulation
modalities produced signal decrease in the amygdala and theanterior hippocampus, a result not seen with sensory controlstimulation. The contralateral anteriomiddle cingulate (BA 24, 32)demonstrated positive signal response for EA but not for MA orsensory control.
� Napadow et al. �
� 200 �
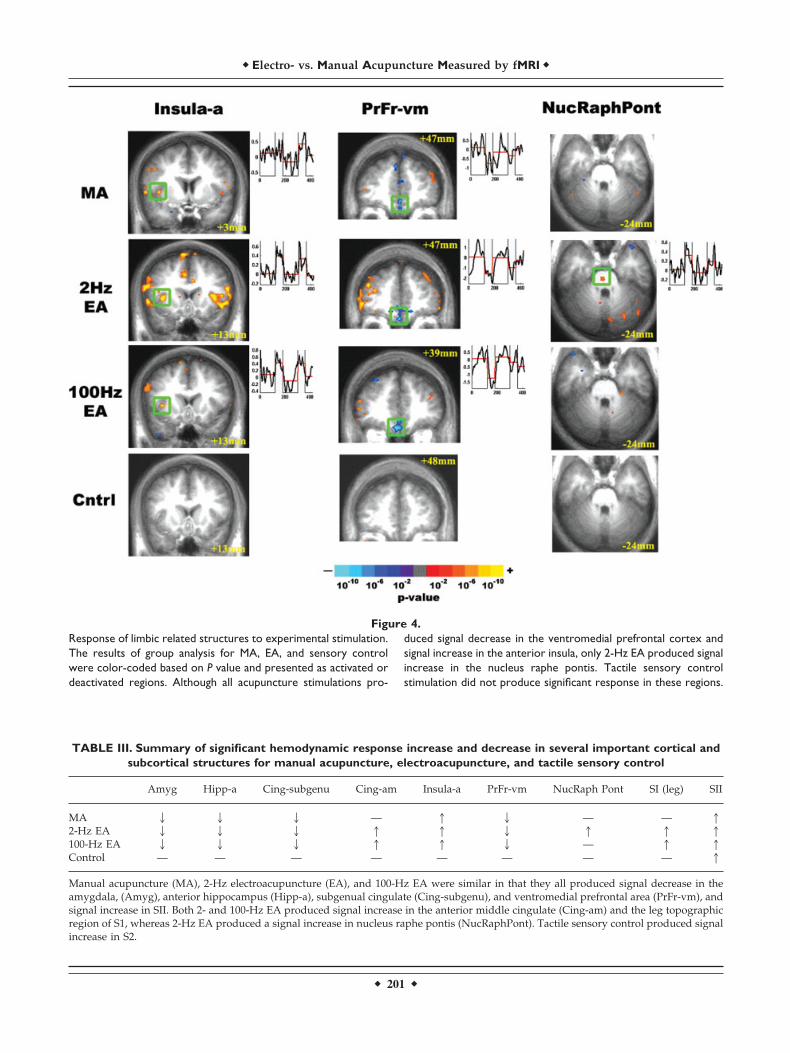
Figure 4.Response of limbic related structures to experimental stimulation.The results of group analysis for MA, EA, and sensory controlwere color-coded based on P value and presented as activated ordeactivated regions. Although all acupuncture stimulations pro-
duced signal decrease in the ventromedial prefrontal cortex andsignal increase in the anterior insula, only 2-Hz EA produced signalincrease in the nucleus raphe pontis. Tactile sensory controlstimulation did not produce significant response in these regions.
TABLE III. Summary of significant hemodynamic response increase and decrease in several important cortical andsubcortical structures for manual acupuncture, electroacupuncture, and tactile sensory control
Amyg Hipp-a Cing-subgenu Cing-am Insula-a PrFr-vm NucRaph Pont SI (leg) SII
MA 2 2 2 — 1 2 — — 12-Hz EA 2 2 2 1 1 2 1 1 1100-Hz EA 2 2 2 1 1 2 — 1 1Control — — — — — — — — 1
Manual acupuncture (MA), 2-Hz electroacupuncture (EA), and 100-Hz EA were similar in that they all produced signal decrease in theamygdala, (Amyg), anterior hippocampus (Hipp-a), subgenual cingulate (Cing-subgenu), and ventromedial prefrontal area (PrFr-vm), andsignal increase in SII. Both 2- and 100-Hz EA produced signal increase in the anterior middle cingulate (Cing-am) and the leg topographicregion of S1, whereas 2-Hz EA produced a signal increase in nucleus raphe pontis (NucRaphPont). Tactile sensory control produced signalincrease in S2.
� Electro- vs. Manual Acupuncture Measured by fMRI �
� 201 �
The lack of hypothalamic activation may be due to the de-creased activity we found in the amygdala and anterior hip-pocampus, which play an important role in modulating hypo-thalamic activity [Squire et al., 2003].
In addition, all acupuncture stimulations demonstratedsignal decrease in the medial frontal pole (dorsomedial orventromedial frontal pole) and medial prefrontal areas (ven-tral, ventromedial, dorsomedial), and signal increase in thelateral frontal pole and prefrontal areas. The response in thefrontal cortex (responsible for many higher cognitive func-tions) was more robust for active acupuncture than for sen-sory control. Recent reports indicate the presence of linksbetween the frontal cortex and the limbic system, and cog-nition likely has an important role in modulating affect andpain processing [Casey, 1999].
Statistically significant responses were also seen in severalother important limbic-related regions. Specifically, active acu-puncture produced signal increase in the anterior insula, whichhas been implicated in the sensory discriminative dimension ofvisceral pain [Peyron et al., 2000]. The anterior insula sendssensory information to the amygdala [Shi and Cassell, 1998]and cingulate. In fact, the insular–amygdaloid connection hasbeen implicated specifically in pro-nociception and hyperalge-sia [Jasmin et al., 2003]. For all three acupuncture modalities inthis study, the insula demonstrated signal increase, whereasthe amygdala demonstrated signal decrease. Other inputs tothe amygdala (e.g., prefrontal cortex) therefore may have over-ridden the pro-nociceptive inputs from the insular cortex,thereby producing a depression of the negative affect nocicep-tive circuit. Tactile control stimulation over the acupoint didnot produce any response in the anterior insula.
fMRI Results in the Brainstem
The oft-mentioned acupuncture pain inhibition network in-volving endorphin release through the periaqueductal gray(PAG) or the descending serotonergic system through the ra-phe magnus nuclei [Parent, 1996] has not been noted explicitlyin other acupuncture fMRI studies. In mouse studies, high-frequency EA analgesia was attenuated by parachloropheny-lalanine (a 5-HT synthesis inhibitor) and not naloxone (anendorphin antagonist), whereas the converse was true for low-frequency EA [Cheng and Pomeranz, 1979, 1981]. These resultssuggested that low-frequency EA may be mediated by opioidanalgesia, whereas high-frequency EA analgesia may be me-diated more by the descending serotonergic system. In ourstudy, low-frequency EA produced an increase in hemody-namic response in the nucleus raphe pontis, whereas no re-sponse in this region was seen with high-frequency EA, MA, orsensory control. The nucleus raphe pontis participates in thecerebellar and subcortical (ascending) serotonergic system[Parent, 1996]. Notably, the ascending serotonergic system hasalso been implicated in low-frequency EA analgesia by ratstudies [Han et al., 1979].
fMRI Results in the Somatosensory Cortices
All stimulation types produced signal increase in the sec-ondary somatosensory cortex, SII (Fig. 2). Furthermore, EA
(2 and 100 Hz) demonstrated signal increase in the homun-cular leg topographic representation of SI. The signal in-crease seen in the somatosensory cortices (especially SII)across all stimulations were expected. Kong et al. [2002]reported a higher magnitude response with EA (3 Hz) thanwith MA for contralateral SII. Our results for low-frequencyEA also demonstrated a greater magnitude response (0.62%)than did those for MA (0.44%). Signal increase in SII is seencommonly also in sensory and pain fMRI studies, and hasbeen noted more frequently than increase in the primarysomatosensory cortex, SI [Hui et al., 2000]. In our groupanalysis results, only EA produced a positive response in theappropriate homuncular region of SI. Lack of SI activationfor MA and tactile sensory control may have arisen fromindividual sulcal anatomic variability, as we stimulated anacupoint with a small homuncular representation region(knee/leg). In fact, individual analysis of the MA and sen-sory control subgroups demonstrated that six of eight sub-jects (one subthreshold) activated SI on their individualscans for MA and five of eight subjects (two subthreshold)activated SI on individual scans for sensory control stimu-lation. Electrostimulation is a grosser activator of somato-sensory receptors and fiber types, whereas manual stimula-tion and tactile control stimulation may preferentiallyactivate specific receptors. (e.g., for vibratory stimuli, low-frequency flutter stimulates Meissner corpuscles; high-fre-quency vibration stimulates Pacinian corpuscles, producingvariable fMRI activation [Harrington and Hunter Downs,2001]). In addition, SI activation is highly susceptible tocognitive factors such as attention [Bushnell et al., 1999], andalthough all subjects were instructed to place attention onthe site of stimulation, some variability in performance mayhave existed. Moreover, although other fMRI studies of EAhave demonstrated signal increase in SI, studies of MA havebeen less consistent [Gareus et al., 2002; Kong et al., 2002;Wu et al., 2002; Zhang et al., 2003]. In fact, an inconsistencyin SI activation also extends to classic pain imaging studies,where much stronger intensity stimulations are used [Bush-nell et al., 1999].
Is Acupuncture the Same as Pain Stimulus?
In our results, signal increase in those brain regions thathave been implicated in the pain-related neuromatrix doesnot necessarily infer that acupuncture effects arise from apain stimulus. Sharp pain was seldom experienced duringactive acupuncture, and although certain acupuncture sen-sations can include correlates of dull pain (e.g., soreness,aching), the fMRI results demonstrated important differ-ences between acupuncture and previous reports of acutepain fMRI. For example, the signal decrease seen with activeacupuncture (amygdala, hippocampus, temporal and frontalpole), was in contrast with signal increase typically reportedin acute pain fMRI studies [Becerra et al., 2001; Bingel et al.,2002; Bornhovd et al., 2002]. In fact, pain imaging studieshave even suggested that effective cognitive coping mecha-nisms may involve a suppression of activity (signal de-
� Napadow et al. �
� 202 �
crease) in limbic and limbic-related structures [Petrovic andIngvar, 2002].
For low-frequency EA, we used a current intensity of 2.15 1.12 mA (intensity was set midway between the sensoryand pain thresholds). This was considerably lower than thecurrent intensity used by Wu et al. [2002] (5.41 2.01 mA).This difference may have occurred because Wu et al. used4-Hz stimulation (not 2 Hz as we did), stimulated theirsubjects closer to (or above) the pain threshold, or used adifferent acupoint (GB-34 or Yanglinquan, just off of thehead of the fibula on the lateral leg). In our study, the painthreshold for high-frequency EA was 1.68 0.8 mA. Thisresult was similar to that of Kawakita et al. [1991], whofound that pain threshold with 500-Hz stimulation was 0.9 0.35 mA at an a priori tender point (medial calf, right leg).Excessive current load in electroacupuncture research is amajor concern in both human and animal studies. A highercurrent increases the risk of pain, and studies with extremecurrent load may not be studying the effects of clinicalacupuncture, but the effects of the noted diffuse noxiousinhibitory control (DNIC) phenomenon [Le Bars et al., 1979].
Limitations
Several limitations in this preliminary study should beaddressed in future studies. First, it is possible for somato-sensory stimulation to produce head motion artifact in fMRIscans. In the future, we will utilize a prospective motioncorrection algorithm during our fMRI scans [Thesen et al.,2000]. The brainstem is especially susceptible to cerebrospi-nal fluid (CSF) and cardiac motion artifact; our results forstructures in the brainstem thus need further validation. Toachieve a homogeneous cohort, efforts should be made tominimize further sharp pain, and a larger sample size wouldpermit separation of subjects with dull acupuncture sensa-tions from those who felt sharp pain mixed with the dullsensations. In addition, there is known individual variabilityin acupuncture response, which may be related to differ-ences in basal state [Gusnard et al., 2001] or neurohormonalfactors such as cholecystokinin-8 (CCK-8) [Zhang et al.,1997]. Moreover, some subjects may be more susceptible topain than others due to genetic factors [Zubieta et al., 2003].To separate out these different cohorts and to carry out apower analysis, a large group size is needed and will beadopted in future studies. As an additional caveat, our fMRIdata analysis included a conservative statistical threshold (P� 0.0001), and may have produced false negative results.
Notably, fMRI signal decrease is seen commonly in studiesof acupuncture, including MA when compared to EA [Kong etal., 2002]. Although the interpretation of fMRI signal decreaseremains controversial, one hypothesis refers to this signal de-crease as “deactivation” of brain regions from a resting baseline[Raichle et al., 2001]. In other words, the fMRI signal is arelative measure and certain brain regions may be more activeduring baseline rest than during acupuncture stimulation. Re-gions with active inhibitory neurons may demonstrate hemo-dynamic signal increase, whereas those regions demonstratingsignal decrease may be subject to either less excitatory inputs or
more inhibitory inputs. Moreover, regional deactivation maybe a mechanism by which acupuncture can mitigate hyperac-tivity in the brain to relieve conditions that have been linkedwith chronic hyperactivity such as chronic pain [Hsieh et al.,1995] or psychopathology, which has been associated withactivations in the prefrontal cortex, ACC, and amygdala [Da-vidson et al., 1999]. Signal decrease in the medial prefrontalcortex, however, has been observed in many cross-disciplinaryfMRI studies. The innately high metabolic state of this corticalregion renders it susceptible to any change in attention andcognition between active and inactive states (i.e., more cogni-tion and rumination during inactive rest periods, and lessduring the active state), and may have been responsible for thissignal decrease [Gusnard and Raichle, 2001].
Summary
To summarize the results of this study, EA produced morewidespread signal increase than did MA. Furthermore, allthree active acupuncture stimulations (MA, 2-Hz EA, and100-Hz EA) produced more regions of positive and negativehemodynamic signal response than did sensory stimulationused as a control condition. All acupuncture stimulations pro-duced signal decrease in the amygdala, anterior hippocampus,subgenual cingulate, and ventromedial prefrontal cortex, andsignal increase in the anterior insula, results not seen withtactile sensory control. These results support the hypothesisthat the limbic system is central to acupuncture effect. Further-more, all acupuncture stimulations and sensory control stimu-lation produced signal increase in SII, whereas only EA (2 and100 Hz) demonstrated signal increase in the homuncular legtopographic representation of SI. Knowledge of the basicmechanisms subserving different modes of acupuncture stim-ulation may aid future recommendations regarding the stim-ulation modality that may be more efficacious for treating themyriad disorders seen in an acupuncture clinic.
ACKNOWLEDGMENT
We thank Dr. Suk-tak Chen for her advice with the dataanalysis.
REFERENCES
Bandettini PA, Wong EC, Hinks RS, Tikofsky RS, Hyde JS (1992):Time course EPI of human brain function during task activation.Magn Reson Med 25:390–397.
Becerra L, Breiter HC, Wise R, Gonzalez RG, Borsook D (2001):Reward circuitry activation by noxious thermal stimuli. Neuron32:927–946.
Biella G, Sotgiu ML, Pellegata G, Paulesu E, Castiglioni I, Fazio F(2001): Acupuncture produces central activations in pain re-gions. Neuroimage 14:60–66.
Bingel U, Quante M, Knab R, Bromm B, Weiller C, Buchel C (2002):Subcortical structures involved in pain processing: evidencefrom single-trial fMRI. Pain 99:313–321.
Birch S, Felt B (1999): Understanding acupuncture. Edinburgh:Churchill Livingstone. 335 p.
Bornhovd K, Quante M, Glauche V, Bromm B, Weiller C, Buchel C(2002): Painful stimuli evoke different stimulus-response func-
� Electro- vs. Manual Acupuncture Measured by fMRI �
� 203 �
tions in the amygdala, prefrontal, insula and somatosensorycortex: a single-trial fMRI study. Brain 125:1326–1336.
Breiter HC, Gollub RL, Weisskoff RM, Kennedy DN, Makris N,Berke JD, Goodman JM, Kantor HL, Gastfriend DR, Riorden JP,Mathew RT, Rosen BR, Hyman SE (1997): Acute effects of co-caine on human brain activity and emotion. Neuron 19:591–611.
Bushnell MC, Duncan GH, Hofbauer RK, Ha B, Chen JI, Carrier B(1999): Pain perception: is there a role for primary somatosen-sory cortex? Proc Natl Acad Sci USA 96:7705–7709.
Casey KL (1999): Forebrain mechanisms of nociception and pain:analysis through imaging. Proc Natl Acad Sci USA 96:7668–7774.
Caviness V, Meyer J, Makris N, Kennedy D (1996): MRI-basedtopographic parcellation of the human neocortex: an anatomi-cally specified method with estimate of reliability. J CognitiveNeurosci 8:566–587.
Chen Y, Hui K, Kong J, Kwong K (2001): Forepaw stimulation at aclassical acupuncture point modulates cerebral dopaminergictone. Neuroimage 13:976.
Cheng RS, Pomeranz B (1979): Electroacupuncture analgesia couldbe mediated by at least two pain- relieving mechanisms; endor-phin and non-endorphin systems. Life Sci 25:1957–1962.
Cheng RS, Pomeranz B (1981): Monoaminergic mechanism of elec-troacupuncture analgesia. Brain Res 215:77–92.
Cho ZH, Chung SC, Jones JP, Park JB, Park HJ, Lee HJ, Wong EK,Min BI (1998): New findings of the correlation between acu-points and corresponding brain cortices using functional MRI.Proc Natl Acad Sci USA 95:2670–2673.
Cox RW (1996): AFNI: software for analysis and visualization offunctional magnetic resonance neuroimages. Comput BiomedRes 29:162–173.
DaSilva AF, Becerra L, Makris N, Strassman AM, Gonzalez RG,Geatrakis N, Borsook D (2002): Somatotopic activation in thehuman trigeminal pain pathway. J Neurosci 22:8183–8192.
Davidson RJ, Abercrombie H, Nitschke JB, Putnam K (1999): Re-gional brain function, emotion and disorders of emotion. CurrOpin Neurobiol 9:228–234.
Davis KD, Pope GE, Crawley AP, Mikulis DJ (2002): Neural corre-lates of prickle sensation: a percept-related fMRI study. NatNeurosci 5:1121–1122.
Davis KD, Taylor S, Crawley A, Mikulis DJ (1997): Functional MRIof pain and attention related activations in the human cingulatecortex. J Neurophysiol 77:3370–3380.
Filipek PA, Richelme C, Kennedy DN, Caviness VS Jr (1994): Theyoung adult human brain: an MRI-based morphometric analy-sis. Cereb Cortex 4:344–360.
Gareus IK, Lacour M, Schulte AC, Hennig J (2002): Is there a BOLDresponse of the visual cortex on stimulation of the vision-relatedacupoint GB 37? J Magn Reson Imaging 15:227–232.
Gulia KK, Kumar VM, Mallick HN (2002): Role of the lateral septalnoradrenergic system in the elaboration of male sexual behaviorin rats. Pharmacol Biochem Behav 72:817–823.
Gusnard DA, Akbudak E, Shulman GL, Raichle ME (2001): Medialprefrontal cortex and self-referential mental activity: relation to adefault mode of brain function. Proc Natl Acad Sci USA 98:4259–4264.
Gusnard DA, Raichle ME (2001): Searching for a baseline: functionalimaging and the resting human brain. Nat Rev Neurosci 2:685–694.
Haines DE (1991): Neuroanatomy. An atlas of structures, sectionsand systems. Baltimore: Williams and Wilkins.
Han CS, Chou PH, Lu CC, Lu LH, Yang TH, Jen MF (1979): The roleof central 5-hydroxytryptamine in acupuncture analgesia. Sci Sin22:91–104.
Han SH, Yoon SH, Cho YW, Kim CJ, Min BI (1999a): Inhibitoryeffects of electroacupuncture on stress responses evoked bytooth-pulp stimulation in rats. Physiol Behav 66:217–222.
Han Z, Jiang YH, Wan Y, Wang Y, Chang JK, Han JS (1999b):Endomorphin-1 mediates 2 Hz but not 100 Hz electroacupunc-ture analgesia in the rat. Neurosci Lett 274:75–78.
Harrington GS, Hunter Downs J 3rd (2001): FMRI mapping of thesomatosensory cortex with vibratory stimuli. Is there a depen-dency on stimulus frequency? Brain Res 897:188–192.
Hsieh JC, Belfrage M, Stone-Elander S, Hansson P, Ingvar M (1995):Central representation of chronic ongoing neuropathic painstudied by positron emission tomography. Pain 63:225–236.
Hsieh JC, Tu CH, Chen FP, Chen MC, Yeh TC, Cheng HC, Wu YT,Liu RS, Ho LT (2001): Activation of the hypothalamus charac-terizes the acupuncture stimulation at the analgesic point inhuman: a positron emission tomography study. Neurosci Lett307:105–108.
Hui K, Liu J, Chen A (1997): Effects of acupuncture on human limbicsystem and basal ganglia measured by fMRI. Neuroimage 5:226.
Hui KK, Liu J, Makris N, Gollub RL, Chen AJ, Moore CI, KennedyDN, Rosen BR, Kwong KK (2000): Acupuncture modulates thelimbic system and subcortical gray structures of the humanbrain: evidence from fMRI studies in normal subjects. HumBrain Mapp 9:13–25.
Hui K, Liu J, Makris N, Chan S, Kong J, Kwong K (2001): Acupunc-ture modulatory effects by whole brain fMRI: deqi versus pain.Abstr Soc for Neurosci 27:21.11.
Jang MH, Lee TH, Lim BV, Shin MS, Min BI, Kim H, Cho S, Kim EH,Kim CJ (2003): Acupuncture suppresses ischemia-induced in-crease in c-Fos expression and apoptosis in the hippocampalCA1 region in gerbils. Neurosci Lett 347:5–8.
Jasmin L, Rabkin SD, Granato A, Boudah A, Ohara PT (2003):Analgesia and hyperalgesia from GABA-mediated modulationof the cerebral cortex. Nature 424:316–320.
Kandel E, Schwartz J, Jessell T (2000): Principles of neural science.New York: McGraw-Hill. 1414 p.
Kawakita K, Miura T, Iwase Y (1991): Deep pain measurement attender points by pulse algometry with insulated needle elec-trodes. Pain 44:235–239.
Kirifides ML, Simpson KL, Lin RC, Waterhouse BD (2001): Topo-graphic organization and neurochemical identity of dorsal rapheneurons that project to the trigeminal somatosensory pathway inthe rat. J Comp Neurol 435:325–340.
Kong J, Ma L, Gollub RL, Wei J, Yang X, Li D, Weng X, Jia F, WangC, Li F, Li R, Zhuang D (2002): A pilot study of functionalmagnetic resonance imaging of the brain during manual andelectroacupuncture stimulation of acupuncture point (LI-4Hegu) in normal subjects reveals differential brain activationbetween methods. J Altern Complement Med 8:411–419.
Kwon YB, Kang MS, Son SS, Kim JT, Lee YH, Han HJ, Lee JH (2000):Different frequencies of electroacupuncture modified the cellularactivity of serotonergic neurons in brainstem. Am J Chin Med28:435–441.
Kwong KK, Belliveau JW, Chesler DA, Goldberg IE, Weisskoff RM,Poncelet BP, Kennedy DN, Hoppel BE, Cohen MS, Turner R, etal. (1992): Dynamic magnetic resonance imaging of human brainactivity during primary sensory stimulation. Proc Natl Acad SciUSA 89:5675–5679.
� Napadow et al. �
� 204 �
Le Bars D, Dickenson AH, Besson JM (1979): Diffuse noxious inhib-itory controls (DNIC). I. Effects on dorsal horn convergent neu-rones in the rat. Pain 6:283–304.
Liu G (1998): Techniques of acupuncture and moxibustion. Beijing:Huaxia Publishing House. 177 p.
Maddock RJ (1999): The retrosplenial cortex and emotion: newinsights from functional neuroimaging of the human brain.Trends Neurosci 22:310–316.
Mayberg HS, Silva JA, Brannan SK, Tekell JL, Mahurin RK, McGin-nis S, Jerabek PA (2002): The functional neuroanatomy of theplacebo effect. Am J Psychiatry 159:728–737.
Ogawa S, Tank DW, Menon R, Ellermann JM, Kim SG, Merkle H,Ugurbil K (1992): Intrinsic signal changes accompanying sensorystimulation: functional brain mapping with magnetic resonanceimaging. Proc Natl Acad Sci USA 89:5951–5955.
Parent A (1996): Carpenter’s human neuroanatomy. Baltimore: Wil-liams and Wilkins. 1011 p.
Paxinos G, Huang XF (1995): Atlas of the human brainstem. SanDiego: Academic Press. 149 p.
Petrovic P, Ingvar M (2002): Imaging cognitive modulation of painprocessing. Pain 95:1–5.
Peyron R, Laurent B, Garcia-Larrea L (2000): Functional imaging ofbrain responses to pain. A review and meta- analysis. Neuro-physiol Clin 30:263–288.
Poellinger A, Thomas R, Lio P, Lee A, Makris N, Rosen BR, KwongKK (2001): Activation and habituation in olfaction—an fMRIstudy. Neuroimage 13:547–560.
Raichle ME, MacLeod AM, Snyder AZ, Powers WJ, Gusnard DA,Shulman GL (2001): A default mode of brain function. Proc NatlAcad Sci USA 98:676–682.
Saletu B, Saletu M, Brown M, Stern J, Sletten I, Ulett G (1975):Hypno-analgesia and acupuncture analgesia: a neurophysiolog-ical reality? Neuropsychobiology 1:218–242.
Shi CJ, Cassell MD (1998): Cortical, thalamic, and amygdaloid con-nections of the anterior and posterior insular cortices. J CompNeurol 399:440–468.
Squire L, Bloom F, McConnell S, Roberts J, Spitzer N, Zigmond M,editors (2003): Fundamental neuroscience. 2nd ed. Boston: Aca-demic Press. 1426 p.
Thesen S, Heid O, Mueller E, Schad LR (2000): Prospective acquisi-tion correction for head motion with image-based tracking forreal-time fMRI. Magn Reson Med 44:457–465.
Tucker D, Derryberry D, Luu P (2000): Anatomy and physiology ofhuman emotion: vertical integration of brainstem, limbic, and
cortical systems. In: Borod J, editor. The neuropsychology ofemotion. New York: Oxford University Press. p 56–79.
Ulett G, Han S, Han JS (1998): Electroacupuncture: mechanisms andclinical application. Biol Psychiatry 44:129–138.
Wang KM, Yao SM, Xian YL, Hou ZL (1985): A study on thereceptive field of acupoints and the relationship between char-acteristics of needling sensation and groups of afferent fibres. SciSin [B] 28:963–971.
Wang YQ, Cao XD, Wu GC (1999): Role of dopamine receptors andthe changes of the tyrosine hydroxylase mRNA in acupunctureanalgesia in rats. Acupunct Electrother Res 24:81–88.
Wu MT, Hsieh JC, Xiong J, Yang CF, Pan HB, Chen YC, Tsai G,Rosen BR, Kwong KK (1999): Central nervous pathway for acu-puncture stimulation: localization of processing with functionalMR imaging of the brain—preliminary experience. Radiology212:133–141.
Wu MT, Sheen JM, Chuang KH, Yang P, Chin SL, Tsai CY, Chen CJ,Liao JR, Lai PH, Chu KA, Pan HB, Yang CF (2002): Neuronalspecificity of acupuncture response: a fMRI study with electro-acupuncture. Neuroimage 16:1028–1037.
Yang G, Huang ZN, Cheung JS (2000): Anticonvulsion effect ofacupuncture might be related to the decrease of neuronal andinducible synthase. Acupunct Electrother Res 25:137–143.
Yuan Y, Yan S, Chen X, Han JS (1993): The effect and mechanism ofelectroacupuncture in treating spinal spasticity: a clinical study.Nat Med J Chin [chin] 73:5932.
Yun SJ, Park HJ, Yeom HJ, Hahm DH, Lee HJ, Lee EH (2002): Effectof acupuncture on the stress-induced changes in brain-derivedneurotrophic factor expression in rat hippocampus. NeurosciLett 318:85–88.
Zald DH (2003): The human amygdala and the emotional evaluationof sensory stimuli. Brian Res Rev 41:88–123.
Zhang WT, Jin Z, Cui GH, Zhang KL, Zhang L, Zeng YW, Luo F,Chen AC, Han JS (2003): Relations between brain network acti-vation and analgesic effect induced by low vs. high frequencyelectrical acupoint stimulation in different subjects: a functionalmagnetic resonance imaging study. Brain Res 982:168–178.
Zhang LX, Li XL, Wang L, Han JS (1997): Rats with decreased braincholecystokinin levels show increased responsiveness to periph-eral electrical stimulation-induced analgesia. Brain Res 745:158–164.
Zubieta JK, Heitzeg MM, Smith YR, Bueller JA, Xu K, Xu Y, KoeppeRA, Stohler CS, Goldman D (2003): COMT val158met genotypeaffects mu-opioid neurotransmitter responses to a pain stressor.Science 299:1240–1243.
� Electro- vs. Manual Acupuncture Measured by fMRI �
� 205 �