effects of electromagnetic fields on behavior of ... · effects of electromagnetic fields on...
TRANSCRIPT

ORNL/TM-2015/580
Effects of Electromagnetic Fields on Behavior of Largemouth Bass and Pallid Sturgeon in an Experimental Pond Setting
Mark S. Bevelhimer Glenn F. Cada Constantin Scherelis September 2015
Approved for public release. Distribution is unlimited.

DOCUMENT AVAILABILITY
Reports produced after January 1, 1996, are generally available free via US Department of Energy (DOE) SciTech Connect. Website http://www.osti.gov/scitech/ Reports produced before January 1, 1996, may be purchased by members of the public from the following source: National Technical Information Service 5285 Port Royal Road Springfield, VA 22161 Telephone 703-605-6000 (1-800-553-6847) TDD 703-487-4639 Fax 703-605-6900 E-mail [email protected] Website http://www.ntis.gov/help/ordermethods.aspx
Reports are available to DOE employees, DOE contractors, Energy Technology Data Exchange representatives, and International Nuclear Information System representatives from the following source: Office of Scientific and Technical Information PO Box 62 Oak Ridge, TN 37831 Telephone 865-576-8401 Fax 865-576-5728 E-mail [email protected] Website http://www.osti.gov/contact.html
This report was prepared as an account of work sponsored by an agency of the United States Government. Neither the United States Government nor any agency thereof, nor any of their employees, makes any warranty, express or implied, or assumes any legal liability or responsibility for the accuracy, completeness, or usefulness of any information, apparatus, product, or process disclosed, or represents that its use would not infringe privately owned rights. Reference herein to any specific commercial product, process, or service by trade name, trademark, manufacturer, or otherwise, does not necessarily constitute or imply its endorsement, recommendation, or favoring by the United States Government or any agency thereof. The views and opinions of authors expressed herein do not necessarily state or reflect those of the United States Government or any agency thereof.

ORNL/TM-2015/580
EFFECTS OF ELECTROMAGNETIC FIELDS ON BEHAVIOR OF
LARGEMOUTH BASS AND PALLID STURGEON IN AN
EXPERIMENTAL POND SETTING
Mark S. Bevelhimer
Glenn F. Cada1
Constantin Scherelis
Environmental Sciences Division
Date Published: September 2015
Prepared by
OAK RIDGE NATIONAL LABORATORY
Oak Ridge, TN 37831-6283
managed by
UT-BATTELLE, LLC
for the
US DEPARTMENT OF ENERGY
1 ORNL retired

under contract DE-AC05-00OR22725

iii
CONTENTS
ABSTRACT ................................................................................................................................... iv ACKNOWLEDGMENTS ...............................................................................................................v LIST OF FIGURES ....................................................................................................................... vi LIST OF TABLES ......................................................................................................................... vi 1. INTRODUCTION ....................................................................................................................1 2. MATERIALS AND METHODS .............................................................................................3 3. RESULTS .................................................................................................................................7 4. DISCUSSION ........................................................................................................................12 5. LITERATURE CITED ...........................................................................................................14

iv
ABSTRACT
In addition to potentially generating much desired renewable energy, the future development of
offshore wind and wave energy and tidal and riverine hydrokinetic energy is also generating
concern regarding possible negative effects of electromagnetic fields (EMF) from generators and
transmission cables on aquatic biota. The effects of EMF on the movements of largemouth bass
and pallid sturgeon were studied in mesocosm experiments in a freshwater pond. Over a trial
period of 4 days, fish experienced alternating 2 h periods in which an underwater energized coil
was alternately powered on and off. Electricity moving through the coil created EMF of
magnitudes and frequencies expected to be created by underwater electrical transmission cables
associated with marine and hydrokinetic energy generating technologies. Surgically implanted
acoustic transmitters signaled the locations of individual fish every 1 to 2 min during trials. An
array of four receivers was positioned so that the general location of each fish could be
determined relative to the position of the EMF source. Paired t-test statistical analysis revealed
no consistent significant differences in location or activity relative to the location of the coil for
either species as a result of exposure to the EMF. These results suggest that in natural systems
where an EMF field can be avoided at a distance of 1 m or more, there should be little effect on
the natural movement and activity patterns of these two species. Additional studies with more
fine-scale spatial resolution and other species are needed to better understand potential responses
in actual field settings.

ACKNOWLEDGMENTS
This research was supported by the United States Department of Energy’s (DOE) Office of
Energy Efficiency and Renewable Energy, Wind and Water Power Technologies Program. Oak
Ridge National Laboratory (ORNL) is managed by UT-Battelle LLC for DOE under contract DE
AC05-00OR22725. John Wilgen (ORNL) created the initial design of the electromagnetic field
generator and generated models of the magnetic field outputs. Pallid sturgeon were obtained
through the Pallid Sturgeon Recovery Program and the Garrison Dam National Fish Hatchery
(Riverdale, North Dakota). Kristina Reimer (ORNL post-graduate intern) assisted with the
design and testing of the net pen telemetry system. Michael Schramm (ORNL) helped with
statistical analysis. Jocelyn Brown-Saracino and Samantha Bickel, representing DOE’s Wind and
Water Power Technologies Program, provided project support and valuable comments on an
early version of the manuscript.

vi
LIST OF FIGURES
Fig. 1. The 22 7 1.5 m net pen was suspended in a 6010 m pond of similar depth. ...............3 Fig. 2. Electromagnetic field generator system. Only the coil was located underwater. .................4 Fig. 3. Electromagnetic field strength emitted from an experimental cable as measured to
either side and above the cable loop. ...................................................................................7 Fig. 4. Mean (±SE) location during 2 h blocks of EMF exposure (shaded boxes) and the
corresponding blocks of control (i.e., no EMF; open boxes) for largemouth bass
(top panel) and pallid sturgeon (bottom panel) during EMF exposure trials. Mean
locations during nonexperimental periods are included for reference. ..............................11
LIST OF TABLES
Table 1. Electromagnetic field study exposure details and results for largemouth bass
(n=11 fish) ............................................................................................................................9 Table 2. Electromagnetic field study exposure details and results for pallid sturgeon
(n=10 fish) ..........................................................................................................................10

1
1. INTRODUCTION
New techniques for generating and distributing electricity in freshwater and marine ecosystems
are raising questions about the effects of electromagnetic fields (EMF) on aquatic biota. For
example, a wide variety of marine and hydrokinetic (MHK) technologies are being proposed and
tested to convert the motions of waves and river or tidal currents into electricity (DOE 2009).
Along US coastlines, the technically recoverable resource for electricity generated from
conversion of wave energy is approximately 1,170 TWh/year, almost 1/3 of the 4,000 TWh/year
of electricity used by the entire country (DOE 2015). The technically recoverable energy in
ocean tides, ocean currents, and river currents could yield 250, 165, and 120 TWh/year
respectively. Similarly, there is growing interest, both in the United States and internationally, in
the development of offshore wind projects. It has been estimated that 54 GW of electrical
capacity could come from offshore wind turbines along the US coasts and the Great Lakes by
2030 (NREL 2010). At the end of 2013, European countries had installed more than 6.6 GW of
offshore wind capacity (EWEA 2014). For nearly all of this energy development, transmission of
generated electricity to shore will be achieved through submarine cables laid along the seafloor.
A recent analysis predicts that the global submarine electricity transmission market will increase
from $16.8 billion to $24.8 billion in the next 10 years (Navigant Research 2015)
Offshore components of MHK and offshore wind turbines include the generator and short
transmission cables running from the generator to a rectifier that converts alternating current
(AC) to direct current (DC). Underwater cables will be used to transmit electricity from offshore
wind or water turbines to users on the shore; cables will connect individual turbines in an array,
the array and a submerged step-up transformer (if part of the design), and the transformer or
array to shore. For short distances, AC is the likely preferred form of transmission since no
current conversion is required; but for long-distance transmission, DC cabling is more efficient
(Normandeau et al. 2011). Although submarine cables are common throughout the world’s
oceans, in the past, most of these cables were fiber optic and low-voltage communication cables
and not high-voltage electricity transmission cables.
This anticipated increase in high-voltage transmission cables has raised concerns about increased
environmental impacts. A potential environmental impact common to most MHK and
underwater transmission cable designs is the effect on aquatic organisms of EMF emitted by the
submerged electrical generators, transformers, rectifiers, and transmission cables into the
surrounding water. Although the cables are armored for protection, and all electrical components
are insulated to prevent leakage of electricity, the electric current moving through the cables will
produce magnetic fields in the immediate vicinity. These may affect the behavior or health of
fish and benthic invertebrates (Gill et al. 2005, 2009). Also, a variable magnetic field (produced
by transmission of AC) or the movement of any conductive fluid (e.g., seawater, fish) through a
static magnetic field (produced by transmission of DC) will create an induced electrical field that
may be sensed by some organisms (Normandeau et al. 2011). Although the electric field
produced by the cable is easily shielded, the magnetic field is not.
There have been several recent reviews of the potential effects of electrical and magnetic fields
on aquatic organisms (CMACS 2003; Gill et al. 2005; Bochert and Zettler 2006; DOE 2009;
Fischer and Slater 2010; Normandeau et al. 2011; Cada 2012). Although Elasmobranchs (i.e.,
sharks and skates) seem to be the most studied class of fishes with regard to EMF response, a

2
few other fish species have also been studied with mixed results. These reviews pointed to the
need to better characterize both the EMF that will be produced by underwater generators and
cables and the responses of aquatic biota to these EMF. A key question is whether EMF could
interfere with normal behavior or physiological processes to the extent that population-level
effects might occur and require some form of mitigation.
Mesocosm-scale studies of changes in the distribution of fish and benthic invertebrates in
relation to electrical sources present an important intermediate step between laboratory bioassays
of EMF effects and in situ environmental monitoring of generators and cables (Gill et al. 2009;
Cada 2012). Such intermediate-scale experiments allow the behavioral responses of larger fish to
be observed in more natural settings, yet still provide experimental control of sample sizes,
replication, and other factors that are not possible in a field study.
We describe a freshwater mesocosm study in which the experimental setting was a net pen
enclosure in an outdoor pond and the EMF source was a coiled wire loop carrying an electrical
load that produced an EMF similar to that expected from MHK transmission cables. Behavioral
responses of free-swimming, adult, freshwater fish in the pond to EMF were tracked by means of
acoustic telemetry tags implanted in each fish. Individual fish positions during EMF exposure
and control treatments were analyzed to determine if exposure to EMF resulted in attraction to or
avoidance of the EMF source or a change in activity.

3
2. MATERIALS AND METHODS
The study was carried out in a 22 m long 7 m wide 1.5 m deep nylon mesh net pen (Fig. 1)
suspended in a 60 1 1.5 m rectangular freshwater pond at Oak Ridge National Laboratory in
Oak Ridge, Tennessee. The pen was suspended from the surface with cylindrical polystyrene
foam floats, with the bottom of the net resting on the pond bottom. The surface of the pond was
completely covered with duckweed (Lemna spp.) which provided shading, reduced solar heating,
and reduced signal backscatter from the acoustic tracking system.
Fig. 1. The 22 7 1.5 m net pen was suspended in a 6010 m pond of similar depth. Only two of
four receivers are shown; the remaining two are not visible on the opposite side of the sound barrier. The
EMF coil was connected to the onshore EMF generator system.
An energizable wire coil was stretched across the narrow width of the pond between the bottom
of the net pen and the pond bottom (not buried in the sediment), approximately 4.5 m from the
south end of the net pen, to create an EMF at that end only (Fig. 1). Unlike laboratory studies
performed by Bevelhimer et al. (2013) with a higher dose and with fish exposure within a few
cm of the EMF source, this study’s design allowed fish to maintain a distance from the EMF
source of up to 1.5 m as they swam over it. We believe this represents an exposure more
representative of field situations and an opportunity for the fish to have a more natural behavioral
response. It was not practical to set up and operate a single underwater power cable exactly like
one that would transmit electricity from an array of hydrokinetic devices (i.e., a 3-phase power
transmission line with a capacity of hundreds of amperes and transmitting up to a megawatt of
power or more). However, we created the same amplitude of 60 Hz magnetic field that would be
emitted from an operating underwater power line by powering a looped multi-turn coil with tens
of amperes of current.
The EMF system consisted of (1) a 60-Hz, AC power supply to simulate typical power
generation frequencies, (2) a 15 A ground fault interrupter for safety, (3) a 120 V AC variable
autotransformer, (4) a step down transformer that reduced the voltage by about 3:1 to produce an
output of up to 37.6 A at 40 V, and (5) a 12-turn coil of about 300 m of #6 stranded wire (Fig. 2).
Cable ties held the bundled wire together, and 30 cm sections of PVC pipe placed 1 m apart
along the coiled wire loop maintained the separation of the two long 30 cm sides across the

4
length of the wire loop. With this arrangement, coil resistance was estimated to be 0.398 ,
resulting in a maximum ohmic power loss of 565 W at 37.6 A. This design created a magnetic
field at the surface of the coil that was representative of predicted values for underwater
transmission cables (460-8,000 µT; Bevelhimer et al. 2013). The shape and magnitude of the
magnetic field created around the coil was a function of the distance between the two long sides
of the loop that went under the net. Experiments were conducted at two voltages (30 and 40 V)
controlled by the step down transformer with a built-in digital readout ammeter for accurate
adjustment.
Magnetic fields around the coil were characterized with a Gauss meter (AlphaLab Inc., Model
GM2) both in air and in a tank of water before the coil was deployed in the pond. In a horizontal
plane, measurements were collected at 0, 5, 10, and 15 cm from the coil in both directions. These
measurements were repeated at vertical distances of 0, 5, 10, 15, 20, and 30 cm above the coil.
At each point of measurement, the unidirectional probe of the Gauss meter was rotated to detect
the highest EMF possible at that point. We converted Gauss to microtesla (1 G = 100 µT), a
more commonly used measure of EMF exposure.
Fig. 2. Electromagnetic field generator system. Only the coil was located underwater.
Largemouth bass (Micropterus salmoides, n=11) and pallid sturgeon (Scaphirhyncus albus,
n=10) were tested during separate trials. Largemouth bass are the most economically important
freshwater sportfish in large rivers in the central and eastern United States. Pallid sturgeon are
one of several federally protected sturgeon species (endangered) in the United States. Found
primarily in the Mississippi River and Missouri River, pallid sturgeon are representative of
several sturgeon species (genera Scaphirhyncus and Acipenser) that are subjects of
environmental concern at nearly all proposed riverine or tidal hydrokinetic development sites.
Electromagnetic sensitivity has been demonstrated recently in lake sturgeon (Acipenser
fulvescens; Bevelhimer et al. 2013).
Individual fish positions were determined with an acoustics telemetry system. Acoustic
transmitters (Lotek Inc. model number MM-M-8-SO; 43 mm long 8.5 mm diameter; 5.5 g in
air; 2 transmissions per minute) were surgically implanted into each fish through a 1.5 cm long
dorsal incision that was closed with two stitches. Each acoustic transmitter broadcast signals at a
unique frequency, so that movements of individual fish could be recorded. Before surgery, fish

5
were anesthetized with buffered tricaine methanesulfonate. Fish were held in laboratory tanks
post-surgery for 1 day before being released to the net pen and allowed to acclimate to the pen
for 2 days before EMF studies were initiated. Trial days for largemouth bass were from 03–06
June 2013 and for pallid sturgeon from 30 June–03 July 2013.
Transmitted signals were detected by up to four submersible recording receivers (Lotek, Inc.
model WHS 3250). Attempts to achieve a sufficient signal detection rate for two-dimensional
location by positioning the receivers at the four corners of the large net pen were unsuccessful,
so the receivers were positioned in the middle of the pen with two on each side of a 6090 cm
soundproof barrier (Fig. 1). The barrier was positioned so that transmissions from fish at either
half of the pen were usually received only by the two receivers on that side of the barrier. When
fish were in the middle of the pond, signals were often detected by receivers on both sides of the
barriers, resulting in a detection resolution of three locations—north, south, or middle of pen.
The EMF coil was located at the south end of the pen.
For both species, EMF exposure trials with controls were conducted over 4 days with four 2 h
blocks of treatments (2 h each of the electrical coil powered and not powered) starting at 09:00 h
and ending at 17:00 h. Each 2 h period of EMF generation was paired with a nonpowered
control, the order of which alternated day to day after initial randomization of the order. The
magnitude of EMF on the first 2 days of the 4 day trial period was 75% of that on the last 2 days
and was controlled by setting the voltage input at 30 and 40 V, respectively.
Data were downloaded from the receivers at the conclusion of each species’ experiment. Every
30 s period was evaluated for all four receivers in combination. If a signal was received at either
or both receivers from the same side, and not from either receiver on the other side of the sound
barrier, a fish was considered located at that end during that entire half-minute period.
Occasionally backscattered (or reflected) signals were received; these signals were typically half
the strength of a full signal and were not considered in the analysis. If a full-strength signal was
received by receivers on both sides of the sound barrier, the fish was considered to be located in
the middle of the pen during that 30 s period.
Results summarized for each 2 h treatment block for each fish included
rate of detection (number of detections divided by 240 possible detections; 0 to 1)
number of locations at each of the three net pen locations (north, south, and middle; 0 to 240)
average location (1=north, 2=middle, 3=south; 1 to 3)
movement index (0 to 100)
The movement index was calculated by summing the number of times that the location changed
from one location to another during the course of a 2 h block divided by the total number of
detections 100, resulting in a range of values from 0 (never moved) to 100 (was in a different
location every subsequent detection).
Paired t-tests were used to determine if differences in mean location or movement index existed
between each of the 16 pairs of EMF exposure and control treatments (8 pairs per species). A
second statistical analysis (Benjamini-Hochberg) was performed on the paired t-test results to

6
control the false discovery rate due to multiple comparisons (Benjamini and Hochberg, 1995). A
significant treatment effect was considered at p>0.1.
If a fish was not detected during a 2 h period, its mean location and movement could not be
calculated, and that fish was excluded from the analysis. Time-variable external factors, such as
direct sunlight and cloud cover, prevented us from treating each of the pairs as exact replicates of
each other; so we chose instead to evaluate each pair separately and conclude a significant effect
of EMF exposure only if a consistent effect, such as avoidance or increased activity, was found
for a majority of the pairs. The 30 and 40 V treatments were evaluated separately in case EMF
strength affected the response. For mean location analysis, a significant increase during EMF
exposure, indicating more time on the south end of the pen (near the EMF coil) would be
interpreted as an attraction to the EMF source. Conversely, a significant decrease in mean
location would be interpreted as avoidance.
7
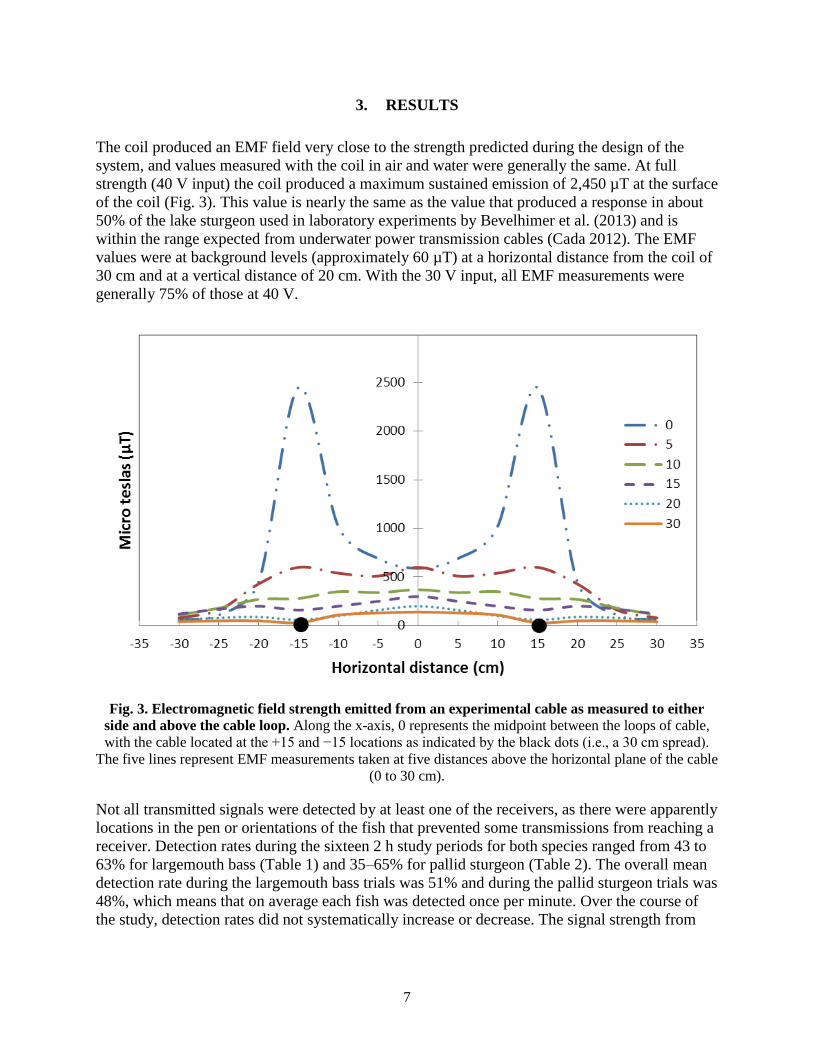
3. RESULTS
The coil produced an EMF field very close to the strength predicted during the design of the
system, and values measured with the coil in air and water were generally the same. At full
strength (40 V input) the coil produced a maximum sustained emission of 2,450 µT at the surface
of the coil (Fig. 3). This value is nearly the same as the value that produced a response in about
50% of the lake sturgeon used in laboratory experiments by Bevelhimer et al. (2013) and is
within the range expected from underwater power transmission cables (Cada 2012). The EMF
values were at background levels (approximately 60 µT) at a horizontal distance from the coil of
30 cm and at a vertical distance of 20 cm. With the 30 V input, all EMF measurements were
generally 75% of those at 40 V.
Fig. 3. Electromagnetic field strength emitted from an experimental cable as measured to either
side and above the cable loop. Along the x-axis, 0 represents the midpoint between the loops of cable,
with the cable located at the +15 and −15 locations as indicated by the black dots (i.e., a 30 cm spread).
The five lines represent EMF measurements taken at five distances above the horizontal plane of the cable
(0 to 30 cm).
Not all transmitted signals were detected by at least one of the receivers, as there were apparently
locations in the pen or orientations of the fish that prevented some transmissions from reaching a
receiver. Detection rates during the sixteen 2 h study periods for both species ranged from 43 to
63% for largemouth bass (Table 1) and 35–65% for pallid sturgeon (Table 2). The overall mean
detection rate during the largemouth bass trials was 51% and during the pallid sturgeon trials was
48%, which means that on average each fish was detected once per minute. Over the course of
the study, detection rates did not systematically increase or decrease. The signal strength from

8
one sturgeon gradually declined during the first 2 days of the trial and was not detected after day
2; we assume that the transmitter battery expired prematurely.
Based on the paired t-test and Benjamini-Hochberg results, we concluded that largemouth bass
position in the net pen was unaffected by either of the two EMF strengths (Table 1 and Fig. 4 top
panel). A significant change in location was detected for three of the four treatment–control pairs
during 30 V exposure, but the direction of change was not consistent; in two cases the mean
position during EMF exposure was nearer the EMF source (indicating possible attraction), and in
the third case the mean position was farther away (suggesting possible avoidance). For the 40 V
exposure, there were no differences in mean position between the EMF exposure trials and the
controls.
Similarly, for the largemouth bass movement index, which was a measure of activity, two of the
four pairs exposed to the lower-magnitude EMF showed significant differences, but one
suggested increased activity and the other, reduced activity (Table 1). At the higher (40 V) EMF
magnitude, there were no differences between treatment and control for the four paired trials.
For pallid sturgeon, only one of the four low-level exposure treatment pairs and one of the four
high-level pairs produced significant differences between EMF exposures and controls; one
treatment/control pair suggested attraction (i.e., average position closer to EMF source) and the
other avoidance (i.e., average position further from source) (Table 2, Fig. 4 bottom panel). As
with largemouth bass, these results suggest no consistent effect of EMF exposure on pallid
sturgeon location, that is, no attraction or avoidance.
Analysis of the pallid sturgeon movement index revealed that none of the treatment–control pairs
showed significant change in activity (after the Benjamini-Hockberg adjustment; Table 2).

Table 1. Electromagnetic field study exposure details and results for largemouth bass (n=11 fish) Two-hour treatments included two levels of EMF (30 and
40 V) or no EMF. An interpretation of effect is described for Benjamini-Hochberg (B-H) values < 0.1.
Day – start time Treatment Detection rate
(SE)
Position (1 to 3) Movement index
Mean (SE)
Paired
t-test
p-value
B-H
adjusted
p-value
EMF
effect Mean (SE)
Paired
t-test
p-value
B-H
adjusted
p-value
EMF effect
1 – 09:00 Off 0.57 (0.06) 1.67 (0.09) <0.01 0.02 Attraction 17.3 (2.65) 0.48 0.55 No effect
1 – 11:00 30 V 0.58 (0.07) 2.03 (0.23) 18.3 (3.51)
1 – 13:00 Off 0.52 (0.15) 1.38 (0.22) 0.24 0.39 No effect 11.1 (4.62) 0.18 0.29 No effect
1 – 15:00 30 V 0.57 (0.07) 1.50 (0.26) 14.9 (10.2)
2 – 09:00 30 V 0.51 (0.08) 1.78 (0.25) <0.01 0.03 Attraction 22.4 (5.17) <0.01 <0.01 More active
2 – 11:00 Off 0.63 (0.09) 1.33 (0.33) 6.86 (3.04)
2 – 13:00 30 V 0.52 (0.08) 1.60 (0.62) 0.03 0.07 Avoidance 6.86 (5.33) <0.01 <0.01 Less active
2 – 15:00 Off 0.43 (0.15) 1.94 (0.48) 16.0 (6.85)
3 – 09:00 40 V 0.55 (0.16) 1.79 (0.52) 0.29 0.39 No effect 7.54 (3.74) 0.11 0.22 No effect
3 – 11:00 Off 0.44 (0.19) 2.02 (0.86) 4.98 (6.12)
3 – 13:00 40 V 0.49 (0.22) 1.90 (0.78) 0.25 0.39 No effect 6.27 (6.66) 0.31 0.42 No effect
3 – 15:00 Off 0.51 (0.21) 1.80 (0.79) 8.90 (10.6)
4 – 09:00 Off 0.58 (0.31) 2.14 (0.94) 0.69 0.69 No effect 2.41 (7.05) 0.11 0.22 No effect
4 – 11:00 40 V 0.45 (0.29) 2.10 (0.84) 5.60 (10.2)
4 – 13:00 Off 0.43 (0.24) 2.06 (0.91) 0.38 0.44 No effect 1.67 (4.01) 0.74 0.74 No effect
4 – 15:00 40 V 0.50 (0.20) 1.87 (0.93) 2.12 (4.02)

Table 2. Electromagnetic field study exposure details and results for pallid sturgeon (n=10 fish) Two-hour treatments included one of two levels of EMF
(30 or 40 V) or no EMF. An interpretation of effect is described for Benjamini-Hochberg (B-H) values < 0.1.
Day – start time Treatment Detection rate
(SE)
Position (1 to 3) Movement index
Mean (SE)
Paired
t-test
p-value
B-H
adjusted
p-value
EMF effect Mean (SE)
Paired
t-test
p-value
B-H
adjusted
p-value
EMF effect
1 – 09:00 Off 0.65 (0.36) 2.21 (0.70) 0.67 0.83 No effect 19.4 (12.2) 0.16 0.54 No effect
1 – 11:00 30 V 0.53 (0.39) 2.00 (0.84) 12.3 (16.7)
1 – 13:00 Off 0.47 (0.31) 2.31 (0.80) 0.09 0.31 Avoidance 15.2 (13.8) 0.43 0.54 No effect
1 – 15:00 30 V 0.35 (0.32) 2.00 (0.62) 27.5 (30.7)
2 – 09:00 30 V 0.45 (0.31) 1.84 (0.55) 0.94 0.94 No effect 27.4 (17.0) 0.47 0.54 No effect
2 – 11:00 Off 0.44 (0.33) 1.89 (0.69) 23.4 (20.0)
2 – 13:00 30 V 0.46 (0.31) 1.82 (0.60) 0.73 0.83 No effect 26.6 (19.5) 0.34 0.54 No effect
2 – 15:00 Off 0.49 (0.31) 1.98 (0.76) 19.2 (14.2)
3 – 09:00 Off 0.43 (0.35) 1.82 (0.66) 0.40 0.80 No effect 16.2 (13.1) 0.22 0.54 No effect
3 – 11:00 40 V 0.45 (0.34) 2.02 (0.83) 9.8 (8.0)
3 – 13:00 Off 0.44 (0.35) 2.04 (0.84) 0.11 0.31 No effect 11.4 (10.0) 0.29 0.54 No effect
3 – 15:00 40 V 0.50 (0.40) 1.75 (0.69) 17.8 (13.9)
4 – 09:00 40 V 0.45 (0.31) 2.01 (0.83) 0.50 0.80 No effect 10.8 (7.2) 0.07 0.52 No effect
4 – 11:00 Off 0.46 (0.40) 2.15 (0.72) 18.5 (14.6)
4 – 13:00 40 V 0.51 (0.36) 1.99 (0.73) 0.04 0.29 Attraction 19.4 (10.7) 0.72 0.73 No effect
4 – 15:00 Off 0.49 (0.35) 1.73 (0.64) 21.5 (17.0)

11
Fig. 4. Mean (±SE) location during 2 h blocks of EMF exposure (shaded boxes) and the
corresponding blocks of control (i.e., no EMF; open boxes) for largemouth bass (top panel) and
pallid sturgeon (bottom panel) during EMF exposure trials. Mean locations during nonexperimental
periods are included for reference.

12
4. DISCUSSION
In summary, the evidence from this study does not support an effect on free-swimming
largemouth bass and pallid sturgeon from EMF delivered at an intensity that would be expected
from a power transmission cable. Our study design and data analysis were intended to be able to
detect large, ecologically relevant behavioral responses and not fine-scale responses like those
detected in our previous laboratory study experiments (Bevelhimer et al. 2013). Although we
saw some indication of response within some treatment pairs, there were no consistent trends
that would indicate either attraction to or avoidance of the end of the pen with the EMF coil, nor
any change in level of activity. The telemetry system used was not able to detect small-scale
movements such as fish moving away from the bottom as they approached the coil.
There have been many studies looking at the response of fish and other aquatic organisms to
exposure to electricity but only a few that have explored behavioral or physiological responses
specifically to EMF. In laboratory studies, Bevelhimer et al. (2013) found what appeared to be a
combination of behavioral and physiological responses, by lake sturgeon to a strong magnetic
field (2,500 to 50,000 µT), but no response by five other freshwater fish species. Westerberg and
Begout-Aranas (2000) found that approximately 60 percent of silver eels (Anguilla anguilla)
observed crossed a HVDC power cable with no apparent response and concluded that the cable
did not appear to act as a barrier to eel normal movements. Skauli et al. (2000) exposed zebrafish
(Danio rerio) embryos to an AC magnetic field of 1,000 µT and observed the hatching rates and
success. A significant delay in hatching occurred when exposure to the magnetic field
commenced at 48 h after fertilization, but not at 2 h after fertilization. Hatching proceeded to
completion with no differences observed in mortality or malformations.
Bochert and Zettler (2006) summarized several studies of the potential injurious effects of
magnetic fields on marine organisms. They subjected several marine benthic species (i.e.,
flounder, blue mussel, prawn, isopods and crabs) to static (DC-induced) magnetic fields of 3,700
µT for several weeks and detected no differences in survival compared to controls. In addition,
they exposed shrimp, isopods, echinoderms, polychaetes, and young flounder to a static, 2,700
µT magnetic field in laboratory aquaria where the animals could move away from or toward the
source of the field. At the end of the 24-h test period, most of the test species showed a uniform
distribution relative to the source, not significantly different from controls. Only one of the
species, the benthic isopod (Saduria entomon), showed a tendency to leave the area of the
magnetic field. The oxygen consumption of two North Sea prawn species exposed to both static
(DC) and cycling (AC) magnetic fields were not significantly different from controls. Based on
these limited studies, Bochert and Zettler (2006) could not detect changes in marine benthic
organisms’ survival, behavior, or a physiological response parameter (e.g., oxygen consumption)
resulting from magnetic flux densities that might be encountered near an undersea electrical
cable.
Electricity generating and transmitting components can produce AC or DC currents. The
magnetic fields surrounding AC and DC are not the same, and responses of aquatic organisms to
different types of EMF will likely differ as well. A recent survey of cable manufacturers/off-
shore power developers found that the predicted range of EMF emitted from marine transmission
cables ranged from ~460 to 8,000 µT (Cada 2012). Possible designs for undersea power cables
are described in Slater et al. (2010) and Normandeau et al. (2011). Over short distances, AC will

13
be transmitted directly from the generator to the onshore grid through insulated cables. On the
other hand, proposals for long-distance transmission of electricity are increasingly considering
high-voltage DC (HVDC) cables. The HVDC cables may be based on either monopole or bipole
systems, and returning electrical current may flow either through an insulated return conductor or
through the ocean by means of sea electrodes. HVDC cables with a sea return generate electrical
fields, higher magnetic fields, electrolysis products (e.g., oxygen and chlorine), and enhanced
corrosion of metal structures. Such arrangements might present exposure to greater EMF levels
than those tested in this study. Because of these adverse effects, insulated metal conductors are
usually preferred over seawater for the HVDC system’s return path (Normandeau et al. 2011).
If electrical and magnetic fields are found to have effects at other power levels or frequencies, or
on the behaviors of other species of fish than those we tested, there are mitigative measures
available to reduce the impacts. Proper shielding and insulation of electrical components will
prevent leakage of electricity (direct electric field emissions, but they cannot completely shield
the magnetic field or the consequent induced electrical field (Gill et al. 2005). EMF decay
rapidly with distance from the source cable; however, the rate of decay is variable and dependent
on the type and strength of current being transmitted (CMACS 2003). In this study the EMF field
decayed roughly by an order of magnitude over a distance of 15 cm. Burying the cable will not
dampen the magnetic field; however, because the magnetic field is strongest at the surface of the
cable and declines rapidly with distance, burying the cable in sediment may reduce effects on
sensitive fish simply by increasing the distance between the source and the fish receptor
(CMACS 2003). Further, cable configurations or alignments for multi-circuit designs might be
able to reduce EMFs by partially canceling the magnetic field.
In this study, we successfully designed and tested a system for creating EMF exposure in an
experimental system that can be adjusted to mimic various strengths of electrical transmission
cables. We tested two species, largemouth bass and pallid sturgeon, and neither showed an effect
(either attraction or avoidance) of exposure to EMF in a semi-natural setting. Although both
species are of concern, they are not representative of all species that could be exposed to
underwater generators and electrical transmission cables. There remains a need for more studies
of the effects of representative EMFs (based on realistic cable configurations, power levels and
frequencies) on the behaviors of other aquatic species.
14
5. LITERATURE CITED
Benjamini, Y., and Y. Hochberg. 1995. Controlling the false discovery rate: A practical and
powerful approach to multiple testing. Journal of the Royal Statistical Society. Series B
(Methodological) 57, 289–300. doi:10.2307/2346101
Bevelhimer, M.S., G.F. Cada, A.M. Fortner, P.E. Schweizer, and K.P. Riemer. 2013. Laboratory
studies of the short-term responses of freshwater fish to electromagnetic fields. Transactions
of the American Fisheries Society 142:802–813.
Bochert, R. and M.I. Zettler. 2006. Effect of electromagnetic fields on marine organisms.
Chapter 14 in: Offshore Wind Energy. J. Koller, J. Koppel, and W. Peters (eds.). Springer-
Verlag, Berlin.
Cada, G.F. 2012. Potential Effects of Electromagnetic Fields from Submerged Electrical Cables
on Aquatic Life. A Review of the Scientific Literature and Suggested Research to Resolve
Potential Issues for the Electric Power Industry. Report 1024943 to the Electric Power
Research Institute, Palo Alto, CA.
CMACS (Centre for Marine and Coastal Studies). 2003. A Baseline Assessment of
Electromagnetic Fields Generated by Offshore Windfarm Cables. COWRIE Report EMF-01-
2002 66. Liverpool, UK. http://www.offshorewind.co.uk
DOE (US Department of Energy). 2009. Report to Congress on the Potential Environmental
Effects of Marine and Hydrokinetic Energy Technologies. December 2009. 89 p. +
appendices. http://www1.eere.energy.gov/water/pdfs/doe_eisa_633b.pdf
DOE (US Department of Energy). 2015. Marine and Hydrokinetic Resource Assessment and
Characterization. http://energy.gov/eere/water/marine-and-hydrokinetic-resource-assessment-
and-characterization
EWEA (European Wind Energy Association). 2014. Building a Stable Future. EWEA Annual
Report 2013. Brussels, Belgium. Available at: http://www.ewea.org/index.php?id=178
Fisher, C., and M. Slater. 2010. Effects of electromagnetic fields on marine species: A literature
review. Electromagnetic Field Study. 0905-00-001. Oregon Wave Energy Trust.
www.oregonwave.org
Gill, A.B., I. Gloyne-Phillips, K.J. Neal, and J.A. Kimber. 2005. The Potential Effects of
Electromagnetic Fields Generated by Sub-Sea Power Cables Associated with Offshore Wind
Farm Developments on Electrically and Magnetically Sensitive Marine Organisms—A
Review. COWRIE Report EM Field 2-06-2004. http://www.offshorewind.co.uk
Gill, A.B., Y. Huang, I. Gloyne-Philips, J. Metcalfe, V. Quayle, J. Spencer, and V. Wearmouth.
2009. COWRIE 2.0 Electromagnetic Fields (EMF) Phase 2: EMF-sensitive fish response to
EM emissions from sub-sea electricity cables of the type used by the offshore renewable
energy industry. Commissioned by COWRIE Ltd. (project reference COWRIE-EMF-1-06).
http://www.offshorewind.co.uk
Navigant Research. 2015. Submarine Electricity Transmission.
https://www.navigantresearch.com/research/submarine-electricity-transmission.

15
Normandeau, Exponent, T. Tricas, and A. Gill. 2011. Effects of EMFs from Undersea Cables on
Elasmobranchs and Other Marine Species. US Department of the Interior, Bureau of Ocean
Energy Management, Regulation, and Enforcement, Pacific OCS Region, Camarillo,
California. OCS Study BOEMRE 2011-09.
NREL (National Renewable Energy Laboratory) 2010. Large-Scale Offshore Wind Power in the
United States. Assessment of Opportunities and Barriers. NREL/TP-500-40745. NREL,
Golden, Colorado. Available at: http://www1.eere.energy.gov/library/default.aspx?Page=9
Skauli, K.S., J.B. Reitan, and B.T. Walther. 2000. Hatching in zebrafish (Danio rerio) embryos
exposed to a 50Hz magnetic field. Bioelectromagnetics 21:407‐410.
Slater, M., R. Jones, and A. Schultz. 2010. The prediction of electromagnetic fields generated by
submarine power cables. 0905-00-007. Oregon Wave Energy Trust. www.oregonwave.org
Westerberg, H. and M.L. Begout-Anras. 2000. Orientation of silver eel (Anguilla anguilla) in a
disturbed geomagnetic field. In: A. Moore and I. Russell (eds.) Advances in Fish Telemetry.
Proceedings of the 3rd Conference on Fish Telemetry. Lowestoft: CEFAS, pp. 149-158. As
cited in Westerberg, H. and I. Lagenfelt. 2008. Sub-sea power cables and the migration
behaviour of the European eel. Fisheries Management and Ecology 15(5-6):369-375.