effects of elodea nuttallii on temperate freshwater …...1 effects of elodea nuttallii on temperate...
TRANSCRIPT

Effects of Elodea nuttallii on temperate freshwater plants, microalgaeand invertebrates: small differences between invaded and uninvadedareasKelly, R., Harrod, C., Maggs, C. A., & Reid, N. (2015). Effects of Elodea nuttallii on temperate freshwater plants,microalgae and invertebrates: small differences between invaded and uninvaded areas. Biological Invasions,17(7), 2123-2138. https://doi.org/10.1007/s10530-015-0865-8
Published in:Biological Invasions
Document Version:Peer reviewed version
Queen's University Belfast - Research Portal:Link to publication record in Queen's University Belfast Research Portal
Publisher rightsCopyright Springer International Publishing Switzerland 2015.The final publication is available at Springer via http://dx.doi.org/10.1007/s10530-015-0865-8
General rightsCopyright for the publications made accessible via the Queen's University Belfast Research Portal is retained by the author(s) and / or othercopyright owners and it is a condition of accessing these publications that users recognise and abide by the legal requirements associatedwith these rights.
Take down policyThe Research Portal is Queen's institutional repository that provides access to Queen's research output. Every effort has been made toensure that content in the Research Portal does not infringe any person's rights, or applicable UK laws. If you discover content in theResearch Portal that you believe breaches copyright or violates any law, please contact [email protected].
Download date:21. Mar. 2020

Effects of Elodea nuttallii on temperate freshwater plants, microalgae and 1
invertebrates: small differences between invaded and uninvaded areas 2
Ruth Kelly1*, Chris Harrod2,3, Christine A. Maggs2 & Neil Reid1,2,4 3
1 Quercus, School of Biological Sciences, Queen’s University Belfast, Belfast BT9 7BL, UK 4 2 School of Biological Sciences, Queen’s University Belfast, Belfast, BT9 7BL, UK 5 3 Instituto de Ciencias Naturales Alexander Von Humboldt, Universidad de Antofagasta, Avenida Angamos 6 601, Antofagasta, Chile 7 4 Institute of Global Food Security (IGFS), Queen’s University Belfast, Belfast, BT9 5BN, UK 8 9 10
*Corresponding author: Tel.: +44 28 9097 2464, +44 77 07627488, Fax: +44 28 9097 11
5877; E-mail address: [email protected] 12
13
Key words: Algae, aquatic, invasion, limnology, macroinvertebrate, macrophyte 14
Running title: Impacts of Elodea nuttallii 15
16
1

Abstract 17
The invasive aquatic plant species Elodea nuttallii could pose a considerable risk to European 18
freshwater ecosystems based on its current distribution, rate of spread and potential for high 19
biomass. However, little research has been conducted on the impacts of this species on native 20
biota. This study takes an ecosystem-wide approach and examines the impact of E. nuttallii 21
on selected physicochemical parameters (dissolved oxygen and pH), algae, invertebrate and 22
macrophyte communities. Elodea nuttallii had small but significant impacts on plant, 23
invertebrate and algal species. The richness of algal periphyton was lower on E. nuttallii than 24
on native macrophytes. The taxonomic composition of invertebrate communities associated 25
with E. nuttallii differed from that associated with similar native plant species, but did not 26
differ in terms of total biomass or species richness. Macrophyte species richness and total 27
cover were positively correlated with percentage cover of E. nuttallii. Not all macrophyte 28
species responded in the same way to E. nuttallii invasion; cover of the low-growing species 29
Elodea canadensis and charophytes was negatively correlated with E. nuttallii cover, whilst 30
floating-rooted plants were positively correlated with E. nuttallii cover. All observed 31
differences in the macrophyte community were small relative to other factors such as nutrient 32
levels, inter-annual variation and differences between sites. Despite this, the observed 33
negative association between E. nuttallii and charophytes is a key concern due to the rarity 34
and endangered status of many charophyte species. 35
36
2

Introduction 37
Freshwater systems have been shown to be at particularly high risk from biological invasions 38
(Sala et al. 2000) and invasive aquatic plants are widely considered to be a major threat to 39
both species diversity and ecosystem functioning (Strayer 2010). The assessment of potential 40
impacts of invasive species on ecosystems is essential to the prioritisation of resources 41
(Leung et al. 2012), and traits associated with successful naturalisation cannot be reliably 42
used to infer potential impact (Hulme 2012). Despite this, in Europe there is a lack of studies 43
directly assessing the impacts of aquatic species on natural ecosystems across trophic levels 44
(Caffrey et al. 2014). 45
Invasive macrophytes can be ‘ecosystem engineers’, fundamentally altering ecosystems 46
through alterations to habitat structure and water chemistry (Strayer et al. 2010). The impacts 47
of invasive macrophytes on native macrophytes are more frequently studied than their 48
impacts on algae or invertebrates (Evangelista et al. 2014). Invasive macrophytes are 49
frequently observed to be dominant in plant assemblages. They may reduce overall 50
macrophyte richness (Carniatto et al. 2013; Michelan et al. 2010; Stiers et al. 2011) and 51
native seed banks (de Winton & Clayton, 1996), and alter plant community composition 52
(Mjelde et al. 2012; O'Hare et al. 2012). However, invasive macrophytes may benefit native 53
plant species by altering the physical environment (e.g. stabilisation of sediment, reduction of 54
turbidity or altering water clarity; (Rybicki, Landwehr 2007; Thomaz et al. 2012). Previous 55
laboratory experiments conducted with Elodea nuttallii have shown that it can out-compete 56
other submerged species (Barrat-Segretain 2005) and floating species when nutrient 57
concentrations are not limiting (Szabo et al. 2010). However, floating species are likely to 58
out-compete E. nuttallii in high nutrient conditions due to their superior ability to compete for 59
light (Netten et al. 2010; Szabo et al. 2010). 60
3

Algal periphyton is a key link between macrophytes and aquatic invertebrate species 61
(Hamilton et al. 1992). Algal periphyton communities differ between plant hosts (Toporoska 62
et al. 2008) both as a result of plant architecture (Declerck et al. 2007; Warfe, Barmuta 2006) 63
and chemical exudates (Erhard and Gross 2006). Suppression of algal taxa by macrophyte 64
exudates has been observed for several submersed species, including E. nuttallii and its 65
congener Elodea canadensis (van Donk 2002; Wu et al. 2009). As competition with 66
periphyton and phytoplankton is a major limiting factor for aquatic macrophytes, such 67
allelopathy could constitute a substantial competitive advantage for these species. 68
Allelopathic exudates may also affect zooplankton and macroinvertebrates, e.g. negative 69
effects of Elodea spp. on growth and development of Daphnia spp. (Burks et al. 2000) and 70
lepidopteran larvae in the family Pyralidae (Erhard et al. 2007). Many macrophyte species 71
contain chemicals that deter grazing, and invertebrates and fish may preferentially select 72
native macrophyte species as food (Burks, Lodge 2002; Schultz, Dibble 2012). Furthermore, 73
the physical structure of different macrophytes provides different quality of refuges from 74
predation (Kovalenko, Dibble 2014; Valinoti et al. 2011). In some cases, the increase in plant 75
biomass associated with invasive macrophytes may increase the overall productivity of the 76
invaded system, resulting in an increase in biomass and diversity of invertebrate species and 77
changes in invertebrate community composition (Schultz, Dibble 2012). 78
Elodea nuttallii is a submerged freshwater plant species which occurs in lakes and slow 79
moving rivers, and which could pose a significant risk to European waterbodies based on its 80
rapid spread and high abundance (Champion et al. 2010) and the observed impacts of E. 81
canadensis. Whilst spread rates and suitability of European waterbodies for the establishment 82
of E. nuttallii have been studied (Hussner 2012; Kelly et al. 2014a; Kelly et al. 2014b), little 83
research has been conducted on the impacts of this species in invaded waterbodies. 84
4

E. nuttallii was first introduced to Europe in 1939 and has spread rapidly, replacing the 85
ecologically similar E. canadensis in many locations (Thiébaut et al. 2008). E. canadensis is 86
considered to be one of the ‘100 worst’ invasive species in Europe (DAISIE, 2015) and has 87
impacts on macrophyte communities and aquatic food webs (e.g. deWinton, Clayton 1996; 88
Kelly, Hawes 2005; Kornijow et al. 2005). E. nuttallii and E. canadensis are so similar that 89
they may be ecologically and functionally redundant (Hérault et al. 2008), in which case 90
their distribution and impacts could be expected to be similar. Both E. canadensis and E. 91
nuttallii have high photosynthetic rates, show strong effects on pH, dissolved oxygen and 92
CO2 levels within plant stands (James et al. 1999) and may play an important role in 93
phosphorus cycling in eutrophic systems (Angelstein, Schubert 2008). Field evidence 94
suggests that E. nuttallii is replacing E. canadensis (Barrat-Segretain et al. 2001; Barrat-95
Segretain, 2002) and laboratory experiments have shown that E. nuttallii is more competitive 96
than E. candensis (Barrat-Segretain 2005). Hence, the impacts of E. nuttallii could be more 97
severe than those of E. canadensis. 98
According to the “invasion meltdown” hypothesis (Simberloff 2006) invasive species may 99
facilitate the establishment or growth of other invasive species leading to accelerating rates 100
of invasion; however, there are few empirical examples (Montgomery et al. 2012). Recent 101
research on invasive macrophytes found evidence of facilitation of Egeria densa by 102
Ludwigia grandiflora, but mutual inhibition between Ludwigia grandiflora and 103
Myriophyllum aquaticum (Thouvenot et al. 2013), suggesting that such interactions may be 104
species- and/or context-specific. Therefore, it is important to examine the potential 105
interactions between E. canadensis and E. nuttallii where they co-occur in order to ascertain 106
whether impacts on native biota are amplified by the interaction of these species. 107
Here, we describe two correlational studies which provide insights into the potential 108
impacts of Elodea. Firstly, we used historical data on the macrophyte communities in two 109
5

large lakes over the course of an invasion to examine the impact of E. nuttallii on other 110
macrophyte species, and to examine interactions between E. nuttallii and E. canadensis. 111
Secondly, we used a paired survey design to examine differences in micro-algae and 112
invertebrates associated with native macrophytes and invasive E. nuttallii within six 113
waterbodies. We used a combination of standard community metrics (e.g. biomass and 114
species richness) and multivariate analysis of communities, both in terms of taxonomic 115
groups and broader functional or structural groups, to examine impacts at different trophic 116
levels. 117
118
Methods 119
Macrophyte study sites 120
Lough Erne in County Fermanagh, Northern Ireland, comprises Upper Lough Erne (ca. 29 121
km2) and Lower Lough Erne (ca. 104 km2). Lough Erne is a naturally eutrophic lake system 122
with high alkalinity due to the underlying geology of the area. Upper Lough Erne is the 123
shallower of the two lakes with a mean depth of 2.9 m; Lower Lough Erne has a mean depth 124
of 11.9 m. Over the period of this study pH in these lakes ranged from 6.2 to 9.3, total 125
phosphorus from 10 μg l-1 to 780 μg l-1 and nitrates from 20 μg l-1 to 1,080 μg l-1 (data 126
provided by Northern Ireland Environment Agency (NIEA), based on monthly measurements 127
at ten monitoring points from 2006-2010). Lough Erne is notable for its conservation value, 128
being designated as a Special Area of Conservation (SAC) and Ramsar site and containing 129
many Irish Red Data List species, including the pointed stonewort (Nitella mucronata) and 130
aquatic invertebrates such as the pond skater (Limnoporus rufoscutellatus), water beetles 131
(Donacia aquatica, D. bicolora, Gyrinus distinctus, G. natator and Hydroporus 132
glabriusculus) and white-clawed crayfish (Austropotabius pallipes). E. nuttallii was first 133
recorded in Lough Erne in 2006. 134
6

135
Field and laboratory methods 136
Data on macrophyte community composition were obtained for both Upper and Lower Lough 137
Erne from the Water Management Unit (WMU), NIEA. These data represent a total of 15 138
transects in Upper Lough Erne during 2007 and 2010 and 18 transects in Lower Lough Erne 139
during 2006 and 2009. Surveys were carried out by wading and by boat depending on water 140
depth. Macrophyte species and percentage cover were recorded within 5 m2 quadrats 141
positioned every 5 m along each transect perpendicular to the shoreline until the edge of the 142
macrophyte zone was reached. Nitrogen and phosphorus (NO3N, NO2N, NH4N, Total 143
Organic Nitrogen, soluble P, and Total P) were measured in surface waters in late July or 144
August for each survey year at a central point in Upper Lough Erne and two points in Lower 145
Lough Erne (Fig 1). These chemistry data are included to account for differences between 146
lakes and over time, rather than smaller scale differences between transects. Unfortunately, it 147
was not possible to obtain more detailed information on water chemistry due to the historical 148
nature of the dataset. We have also accounted for this issue by using a paired statistical design 149
which means that we are not comparing quadrats from different parts of the lakes. Only 150
quadrats which were surveyed in both years were used in the analysis (n = 728 quadrats). 151
In order to determine whether the presence of E. nuttallii affected the structure of 152
macrophyte beds, each macrophyte species was allocated to one of eight groups based on its 153
structural characteristics: emergent, free-floating, floating rooted, submerged (canopy 154
forming), submerged (low growing), bryophytes, filamentous algae and charophytes. 155
156
Dissolved oxygen, pH, algae and invertebrate study sites 157
A paired survey design of six sites in Northern Ireland was used to examine the associations 158
between E. nuttallii, dissolved oxygen, pH, and algal and invertebrate communities, between 159
7

July and September 2010 (Fig 2.). At each site a native macrophyte stand and a stand of the 160
invader were chosen within the same water body (distance between macrophyte stands <500 161
m). Native species differed between sites, but all had a predominantly submerged habit. 162
Native species and sites were as follows: Potamogeton pectinatus (Lagan), Potamogeton 163
perfoliatus/Myriophyllum spicatum (Ballyronan), Potamogeton natans (Lough Cashel), 164
Ceratophyllum demersum (Loughbrickland and Upper Bann), Sagittaria sagittifolia (Lower 165
Bann). Waterbodies were selected to represent the most common site conditions in which 166
Elodea nuttallii was found and included three lake sites and three slow-flowing river sites. 167
All samples were taken in shallow water between 0.45 m and 1.05 m in depth. There was no 168
consistent pattern as to whether E. nuttallii or native plants occurred in deeper water (the 169
mean difference in depth between E. nuttallii and native plants within sites was 14 cm). Sites 170
covered a range of nutrient levels from mesotrophic to hypereutrophic (measured total 171
phosphorus ranging from 18 μg l-1 to 1,168 μg l-1 and total dissolved nitrogen between 4.61 172
μg l-1 and 530 μg l-1). 173
174
Field and laboratory methods 175
Water chemistry, environmental data and algal sampling took place monthly for 3 months 176
from July to September 2010. The pH and dissolved oxygen were recorded at each site using 177
a Hanna pHep 4 pH meter and a portable dissolved oxygen meter (VWR DO200). Two litres 178
of water was collected within each macrophyte bed for chlorophyll a analysis, filtered using a 179
0.45 μm Metricel® membrane filter and stored at -20°C. Chlorophyll a analysis was 180
conducted using methanol-based pigment extraction and spectrophotometry readings 181
(Hamilton, 2010). A further two litres of water was collected for nutrient analyses: soluble 182
reactive phosphorus (SRP), total phosphorus (TP), total soluble phosphorus (TSP), total 183
organic nitrogen (TON), ammonium (NH4), nitrogen dioxide (NO2), nitrates (NO3) and total 184
8

dissolved nitrogen (TDN). Nutrient analyses were conducted by the Agri-Food and 185
Biosciences Institute, Newforge Lane, Belfast, Northern Ireland. 186
Algal periphyton was collected by taking approximately 10 cm length of plant material 187
from both the tip and the base of the macrophyte with approximately 15 ml of water 188
immediately surrounding the macrophyte leaves. Care was taken to carry out this procedure 189
slowly and carefully in situ to minimise loss of periphyton. Water samples were filtered 190
through a 250 μm mesh within 10 minutes of sampling to remove zooplankton and preserved 191
using Lugol’s Iodine solution (5 g iodine (I2), 10 g potassium iodide (KI), 85 ml distilled 192
H2O). One algal sample was taken in each invaded and each uninvaded macrophyte bed in 193
each of July, August and September. Algal samples were kept in the dark at 5-7 °C before 194
processing. 195
Algal periphyton was separated from plant samples by vigorous shaking for 60 seconds. 196
The algal sample was then transferred into a sterile 20 ml tube. Plant material was dried at 197
60°C for 72 hrs and the dry mass was recorded. The algal sample was placed in a Lund 198
chamber. Five horizontal transects of the chamber were carried out at x100 magnification 199
and larger species were identified and counted. A further 20 random fields of view (450 μm2) 200
were examined at x400 magnification and all species were identified and counted. Taxa were 201
identified to genus level where possible, or to the lowest practical taxonomic level 202
(Bellinger, Sigee 2010; Cox 1996; John et al. 2002). It was not possible to accurately identify 203
all cells under 10 μm; those which could not be identified were measured for biovolume and 204
recorded as “unidentified genera” (1.9% of total algal biovolume). For unicellular and 205
colonial algae, the first 10 cells or colonies of each genus or species were measured. For 206
filamentous algae, the first 30 filaments were measured as there was greater variation 207
observed in filament length than in cell or colony size. Mean cell biovolumes were calculated 208
9

using the ‘WISER phytoplankton counter spreadsheet’ (Carvalho et al. 2007) and biovolume 209
formulae were added for new taxa as defined in Hillebrand et al. (1999). 210
Algal species were categorised into seven functional groups based on Kruk et al. (2010) 211
plus an eighth group of ‘uncategorised genera’ (Supplementary Material, Table S1). These 212
groups have been proposed to be useful predictors of algal responses to environmental 213
variables as they are closely linked with functional characteristics such as prey avoidance, K 214
and r strategies and sinking rates (Kruk et al. 2010). 215
Invertebrates were sampled during July and late September/early October using two 216
methods at each sampling date. Firstly, at each site, four replicate core samples of sediment 217
were taken from each macrophyte bed using a KC Denmark Kayak core sampler 45 mm in 218
diameter (hereafter, referred to as ‘sediment invertebrate samples’). Secondly, invertebrates 219
present in macrophyte material were collected using a bespoke bucket and mesh trap of 379 220
cm2 surface area and 300 μm mesh size (hereafter, referred to as ‘macrophyte invertebrate 221
samples’). 222
Invertebrates were separated from samples using a 250 μm sieve and stored in 70% 223
ethanol. Plant material was dried at 60° C for 72 hrs and its dry mass recorded for calculation 224
of macrophyte stand density. All invertebrates were identified to the lowest possible 225
taxonomic level (Edington, Hildrew 1995; Elliott, Mann 1998; Fitter, Manuel 1986; Friday 226
1998; Gledhill et al. 1993; Savage 1989; Wallace et al. 1990). For sediment invertebrate 227
samples, specimen length, width and dry mass were measured (n = 523). Linear regressions 228
based on the length or width and biomass (transformed by Log10 or a natural logarithm 229
depending on best fit described by the adjusted R2 value) were conducted using SigmaPlot 10 230
to describe the relationship between individual length/width and biomass for each common 231
invertebrate family or genus (Supplementary Material, Table S2). In taxa that exhibited a 232
significant relationship between length/width and body mass these regression formulae were 233
10

used to calculate the biomass of individuals of that taxa in the macrophyte invertebrate 234
samples. For all other species dry mass was measured directly. Invertebrate species were 235
further categorised into six functional feeding guilds: collector filterers, collector gatherers, 236
herbivore piercers, predators, scraper grazers and shredders following (Chaloner et al. 2009; 237
Compin, Cereghino 2007; Cummins, Klug 1979; Heino 2008) (Supplementary Material, 238
Table S3). 239
240
Statistical analyses 241
242
Macrophytes 243
In Lough Erne, the impact of Elodea spp. on total macrophyte cover, non-Elodea 244
macrophyte cover and species richness (i.e. native plants) was examined using a Generalized 245
Linear Mixed Model (GLMM) approach. Explanatory variables in the models were Year 246
(fitted as a factor with four levels: 2006, 2007, 2009 or 2010), water depth and nutrient 247
concentration, the percentage cover of E. nuttallii, the percentage cover of E. canadensis, 248
and the interaction of E. nuttallii and E. canadensis. Nutrient concentration was expressed as 249
the first axis of a PCA analysis of nitrogen and phosphorus values, which explained 62.7 % 250
of the variance with a positive relationship with nitrogen variables (r = 0.95) and a negative 251
relationship with phosphorus variables (r = -0.67). Quadrat nested within lake was included 252
as a random factor. 253
All GLMMs were first fitted with a Gaussian distribution and identity link function. 254
Model residuals were tested for normality using a Shapiro-Wilk test. Models for which 255
residuals were not normally distributed were refitted using alternative distributions more 256
suited to the response data. Specifically, gamma distributions with a log-link function were 257
used for continuous response data and a Poisson distribution with a log link function was 258
11

used for count data (i.e. species richness). In each GLMM, all possible subsets of 259
explanatory variables were ranked using the Akaike Information Criterion adjusted for small 260
sample sizes (AICc), and the most optimal model was taken as that with the lowest AICc 261
value. 262
Multivariate responses in macrophyte communities were assessed using partial Canonical 263
Correspondence Analysis (pCCA). Two pCCAs were conducted, the first with a response 264
matrix of percentage cover of macrophyte structural groups and a second with percentage 265
cover of macrophyte genera. The associated environmental matrix included the percentage 266
cover of E. nuttallii, E. canadensis, Year (as a factor), water depth and nutrient content. 267
Quadrat was fitted as a random factor. The optimal model was obtained following stepwise 268
forward selection followed by backward stepwise elimination. Explanatory variables were 269
sequentially added to a null model (with site fitted as a random factor) where these variables 270
significantly improved model AICc values based on a permutation test (P < 0.05 for 271
inclusion), and then successively dropped from the model based on the same inclusion 272
criteria. As E. canadensis was not included in the final pCCA model, it was then added to the 273
response matrices (i.e. plant genera and structural datasets). 274
In order to assess whether species communities where E. nuttallii was present were more 275
similar to each other than those without E. nuttallii, an analysis was carried out on 276
multivariate homogeneity of group dispersion using the function “betadisper” in R based on 277
a Jaccard dissimilarity distance matrix. This was conducted based on a Jaccard dissimilarity 278
distance between species communities (i.e. the proportion of species which differed between 279
quadrats where E. nuttallii was present vs. the proportion of species which differed between 280
quadrats where E. nuttallii was not present). 281
282
283
12

Dissolved oxygen, pH, algae and invertebrates 284
GLMMs were used to examine all univariate dependent variables in relation to the presence 285
of E. nuttallii. Water chemistry response variables (dissolved O2 saturation, pH and 286
chlorophyll a) were tested for correlation prior to GLMM analysis using Spearman’s rank 287
correlation test. There was no significant correlation between these variables (dissolved O2 – 288
chlorophyll a (rho = 0.168, P = 0.327), dissolved O2 – pH (rho = 0.286, P = 0.091) and 289
chlorophyll a and pH (rho = 0.086, P = 0.617). Explanatory variables for these 290
physiochemical variables were the presence or absence of E. nuttallii and month (July, 291
August or September), waterbody type (i.e. two level factor “Lake” or “River”) and the 292
interaction between E. nuttallii presence and waterbody type. Site was fitted as a random 293
factor. 294
Explanatory variables for GLMMs of algal biovolume, algal species richness and 295
macrophyte bed density were the presence and absence of E. nuttallii, month, waterbody 296
type (i.e. a two level factor “Lake” or “River”) and the interaction between E. nuttallii 297
presence and waterbody type, nutrient concentration and the interaction of E. nuttallii and 298
nutrient concentration. Nutrient concentration was expressed as the first axis of a PCA 299
analysis of nitrogen and phosphorus values which explained 64.1 % of the total variance and 300
had a positive relationship with both nitrogen (r = 0.83) and phosphorus variables (r = 0.73). 301
Site was fitted as a random factor. 302
Invertebrate richness and biomass in both macrophyte samples and sediment core samples 303
were examined as above for algae. However, macrophyte bed density was added as an 304
explanatory variable to each model. Model selection was as above for previous GLMMs. 305
Multivariate community responses were assessed using pCCA. Response matrices for 306
algae were biovolume of each algal functional group and biovolume of each algal taxon (per 307
unit of plant dry mass). Response matrices for invertebrate species were the biomass of 308
13

invertebrate feeding guilds and biomass of invertebrate taxa. The associated explanatory 309
environmental matrix included the same factors and covariates as those used in univariate 310
analyses i.e., the presence/absence of E. nuttallii, month and nutrient concentrations, 311
waterbody type and the interaction between E. nuttallii presence and waterbody type, with 312
the addition of plant density in invertebrate models only. Site was fitted as a random factor. 313
Model optimisation was conducted as previously described for pCCAs of macrophyte 314
communities. 315
In order to assess whether algal and invertebrate communities on E. nuttallii were more 316
similar to each other than those on native plants were to each other we conducted an analysis 317
of multivariate homogeneity of group dispersion using the function “betadisper” in R (as per 318
macrophyte community data). 319
Unless otherwise stated all analyses were performed using R 3.0.2 (R Core Development 320
Team 2012) and the packages glmmADMB (Fournier et al. 2012), MuMIn (Barton 2013) 321
and vegan (Oksanen et al. 2013). 322
323
Results 324
325
Macrophytes 326
Elodea nuttallii was present in 2% of the 728 quadrats in the initial survey in 2006-07 and 327
increased to presence in 70% of quadrats in 2009-10. Over the same period, the percentage 328
cover of E. nuttallii within each quadrat increased from a mean of 0.03% (0-4%) to 21.3% 329
(0-100%) on resurvey in 2009-10. E. canadensis declined in presence from 33% to 9% of 330
quadrats and in mean cover per quadrat from 1.1% (0%-70%) to 0.5% (0%-30%) over the 331
same period. A total of 71 other macrophyte species was recorded. E. canadensis and E. 332
nuttallii were the only invasive species recorded in these surveys. 333
14

Total macrophyte cover within quadrats was positively associated with cover of both E. 334
nuttallii (β = 0.013 ± 0.003, χ2 = 20.24, P < 0.001) and E. canadensis (β = 0.029 ± 0.012, χ2 335
= 5.53, P = 0.019). Excluding both Elodea species from the total macrophyte cover, the 336
cover of remaining species was not significantly associated with the cover of either E. 337
nuttallii or E. canadensis, but declined with water depth and differed between years. Both 338
total macrophyte cover and the cover of non-Elodea species were negatively associated with 339
water depth, the PCA axis of nutrient concentration and differed between years (see 340
Supplementary Material, Table S5). 341
Species richness of macrophytes other than E. nuttallii and E. canadensis (i.e. native 342
species) was positively associated with percentage cover of both E. nuttallii (β = 0.002 ± 343
0.001, χ2 = 3.85, P = 0.050) and E. canadensis (β = 0.013 ± 0.004, χ2 = 11.58, P < 0.001) and 344
with the PCA axis of nutrient concentrations and negatively associated with water depth and 345
differed between years (see Supplementary Material, Table S5). There was no evidence of an 346
interaction between E. canadensis and E. nuttallii in any model. 347
The pCCA of macrophyte structural groups showed that year and percentage cover of E. 348
nuttallii influenced structural composition and explained 4.6% of the variation in plant 349
structure after variation between quadrats (69%) was accounted for (P < 0.005; Fig. 3). The 350
pCCA of macrophyte genera showed that water depth, year and percentage cover of E. 351
nuttallii influenced composition of genera significantly and explained 3.9% of the variation 352
after between-quadrat variation (53.9%) was accounted for (P < 0.005). The percentage cover 353
of E. nuttallii alone (with the other factors accounted for by pCCA) explained only 0.6% and 354
0.5% of the variation in structural groups and genera respectively (P < 0.033 and P < 0.005 355
respectively; Supplementary Material, Table S6). The cover of submersed low-growing 356
species and charophytes was negatively associated with the cover of E. nuttallii, whilst the 357
surface-growing plants (both free-floating and rooted) were positively associated with E. 358
15

nuttallii (Table 1). At a taxonomic level, the most negatively affected species was E. 359
canadensis whilst Nuphar lutea and Stratiotes aloides were most positively associated (Table 360
2). However, variance in plant community explained by E. nuttallii was very low relative to 361
variance between quadrats and between years (Tables 1, 2). 362
Analysis of multivariate homogeneity of group dispersion showed that quadrats 363
containing E. nuttallii were more homogeneous (mean Jaccard dissimilarity = 0.43, s.e. < 364
0.01) than those that did not contain E. nuttallii (mean Jaccard dissimilarity = 0.49, s.e. < 365
0.01) (F = 24.34, P < 0.001). 366
367
Dissolved oxygen, pH, algae and invertebrates 368
Dissolved O2 saturation differed between lakes and rivers being higher in lakes than in rivers. 369
The presence of E. nuttallii was included in the best model of dissolved O2 saturation (χ2 = 370
3.21, P = 0.073), being higher in E. nuttallii stands (mean ± s.e. = 93.97% ± 5.46) than in 371
native plant stands (85.13% ± 3.86). Chlorophyll a showed no significant association with 372
rivers or lakes, months or the presence of E. nuttallii. The pH varied significantly between 373
months, but was not significantly associated with the presence of E. nuttallii (Supplementary 374
Material, Table S7). 375
Macrophyte bed density did not differ between E. nuttallii and native macrophyte beds 376
and was not associated with any of the other variables tested. The optimal model for algal 377
species richness contained E. nuttallii with marginal significance (χ2 = 3.67, P = 0.055) and 378
month, but not nutrient concentration. Algal biovolume per gram of plant dry mass varied 379
significantly between months. Algal biovolume was not affected by either the presence of E. 380
nuttallii or nutrient concentration (Supplementary Material, Table S8). 381
The pCCA of algal community data showed no significant effect of E. nuttallii on algal 382
community composition in terms of either functional groups or taxa. The community 383
16

composition in terms of algal functional groups was not significantly associated with any of 384
the explanatory variables tested. However, nutrient concentration and month significantly 385
affected community composition in terms of algal taxa (P = 0.015). Analysis of multivariate 386
homogeneity of group dispersion did not show any significant difference in the variance 387
between algal communities on E. nuttallii and those on native plants (F = 0.42, P = 0.521). 388
None of the community metrics of invertebrate species on macrophytes or sediment 389
differed between E. nuttallii and native macrophyte samples. Invertebrate species richness, 390
derived from macrophyte samples, varied significantly between months. Invertebrate 391
biomass in macrophyte samples also varied significantly between months and was positively 392
correlated with plant density and nutrient concentration. Invertebrate species richness in 393
sediment cores was not significantly associated with any of the environmental parameters. 394
Invertebrate biomass in the sediment cores was positively associated with nutrient, but not 395
with any of the other environmental parameters (Supplementary Material, Table S9). 396
The pCCAs of invertebrate taxonomic communities sampled from macrophytes showed a 397
significant effect of the interaction of waterbody type and the presence of E. nuttallii, 398
suggesting that the impact of E. nuttallii on invertebrate communities differed between lakes 399
and rivers. This interaction explained 10% of the variation in invertebrate communities (P = 400
0.043) after variation between sites (45%) was accounted for (P = 0.005). When rivers and 401
lakes were examined separately, E. nuttallii was found to explain 9% of variation in 402
invertebrate communities in lakes and 13% of the variation in rivers, after accounting for 403
variation between sites (41% and 33% respectively; Tables 3 & 4, Fig. 3). The pCCAs of 404
invertebrate functional groups from the macrophyte invertebrate samples and the pCCAs of 405
invertebrate community in sediment core samples showed no association with any of the 406
tested variables after accounting for variation between sites (Supplementary Material, Table 407
S10). In addition, analysis of multivariate homogeneity of group dispersion did not show any 408
17

significant difference in the variance between invertebrate communities associated with E. 409
nuttallii stands and those associated with native plant stands in either macrophyte (F = 0.15, 410
P = 0.702) or sediment samples (F = 1.92, P = 0.179). 411
412
Discussion 413
414
Freshwater communities associated with Elodea nuttallii differed in small but significant 415
ways from uninvaded communities. Specifically, we observed differences in oxygen 416
saturation, plant and algal richness, and invertebrate and macrophyte species composition. 417
However, observed differences were small relative to other factors such as nutrient levels, 418
inter-annual variation and differences between sites. Furthermore, there was no evidence of 419
any effect of E. nuttallii on the biovolume of periphytic algae, biomass of invertebrate 420
species or the cover of native macrophyte species. In addition, whilst plant communities in 421
quadrats containing E. nuttallii were more similar to each other than quadrats in which E. 422
nuttallii was not present, no similar effect was observed on algal or invertebrate 423
communities. 424
The effects of E. nuttallii on species communities could be seen as both positive and 425
negative, for example, the increased species richness of macrophyte species may be 426
contrasted with the lower richness of algal taxa. Increases in floating plants associated with 427
E. nuttallii can be contrasted with declines in submerged species. The association between 428
floating plant species and E. nuttallii may arise as a result of structural complexity where E. 429
nuttallii reaches the water surface, which reduces surface turbidity and provides anchorage 430
for floating species. In addition, floating species are most likely to out-compete E. nuttallii 431
for light and have been shown to out-compete E. nuttallii in high nutrient conditions (Netten 432
et al. 2010; Szabo et al. 2010). Submerged species which are negatively associated include 433
18

low-growing species which are likely to be shaded by E. nuttallii (such as Eleocharis 434
acicularis, Isoetes spp., Littorella uniflora), canopy-forming submerged species occupying a 435
similar niche space to E. nuttallii (including E. canadensis) and charophyte species. 436
Although the observed negative association between E. nuttallii and charophytes is small, 437
this is of concern due to the rarity and conservation status of charophyte species. Charophytes 438
are usually low-growing (< 0.5 m in height) and are likely to be out-competed for light by E. 439
nuttallii. While this negative association could arise in this study from charophytes reducing 440
the likelihood of establishment of E. nuttallii, this seems unlikely as charophytes have been 441
previously shown to be out-competed by structurally similar invaders from the same plant 442
family (e.g. Lagarosiphon major (Barrs et al. 2008) and E. canadensis (Mjelde et al. 2012)). 443
The observed negative association between the cover of E. nuttallii and E. canadensis 444
suggests a competitive interaction between these two closely related invasive species. We did 445
not find any indication that E. nuttallii or E. canadensis interact to increase impacts on native 446
macrophyte cover or richness. Therefore, our findings do not support the invasion meltdown 447
hypothesis in the case of E. nuttallii and E. canadensis. In addition, the observed rapid 448
increase range and abundance of E. nuttallii in Lough Erne (such that it is much now much 449
more frequently observed than E. canadensis), supports the suggestion that E. nuttallii may 450
be replacing E. canadensis in parts of its invaded range (Barrat-Segretain et al. 2001; Barrat-451
Segretain, 2002). 452
It is perhaps surprising that species richness of native macrophytes was positively 453
associated with the presence of E. nuttallii and E. canadensis in Lough Erne, after differences 454
in nutrient levels and between years had been accounted for. Mechanisms for facilitation of 455
native plant species could include alteration of flow rate and turbidity, or increases in primary 456
productivity over time through the release of nutrients from the sediment. However, these 457
alterations could also make conditions suitable for further establishment of E. nuttallii, which 458
19

can absorb nutrients directly from the water column and is adapted to low-light conditions 459
(Angelstein, Schubert 2008, 2009). An alternative explanation for the positive correlation 460
between E. nuttallii and species richness of native macrophytes is that some other 461
environmental factor, unaccounted for here, facilitates both an increase in E. nuttallii cover/or 462
its establishment and macrophyte species richness. Previous studies have suggested that while 463
species richness increases resistance to invasion at small spatial scales (Kennedy et al. 2002), 464
such effects may be overwhelmed by environmental factors which co-vary with species 465
richness, such as propagule pressure, resulting in an apparent positive relationship between 466
invasive species and native species richness (Levine 2000; Lonsdale 1999). Furthermore, a 467
recent large-scale study of invasive species in macrophyte communities found no clear 468
relationship between native species richness and exotic species richness (Capers et al. 2007). 469
In common with previous authors we found that plant density was significantly correlated 470
with the biomass of invertebrate species living on macrophytes (Schultz, Dibble 2012). 471
However, in our study plant density and invertebrate biomass did not differ between E. 472
nuttallii and native plants, reflecting an explicit decision to examine differences between 473
similar native and invasive plant beds. Whilst E. nuttallii may not alter the biomass of 474
invertebrate species relative to similar-sized plants, results from our macrophyte dataset 475
suggest that E. nuttallii may be replacing low-growing species and increasing overall 476
macrophyte cover. Hence, by altering the relative regional abundance of different plant 477
functional groups, E. nuttallii may produce corresponding changes in invertebrate biomass at 478
larger spatial scales. 479
Differences in invertebrate assemblages associated with macrophytes have also been 480
shown previously for similar submerged invasive species (Hogsden et al. 2007; Kelly, Hawes 481
2005; Stiers et al. 2011). The reasons for the observed differences in invertebrate species 482
composition may be varied and complex, and are likely to relate to differences in plant 483
20

architecture, plant palatability, chemical exudates, water chemistry and water flow rates. 484
Oxygen saturation is an important factor in determining invertebrate communities in 485
freshwater environments. Higher oxygen saturation levels associated with E. nuttallii may 486
have influenced species composition here: there was a lower abundance of some species 487
groups associated with low oxygen saturation levels such as true fly larvae in the family 488
Chironomidae, Alderflies (Sialis lutaria), leeches in the genera Erpobdella and Theromyzon, 489
and Asellus amphipods, and a higher abundance of some species associated with higher 490
oxygen saturation such as caddisflies in the family Linephiidae. However, several species 491
behaved contrary to expectation based on oxygen saturation alone, suggesting that other 492
factors influence their distributions, for example damselflies in the family Coengriidae were 493
negatively associated with E. nuttallii, leeches in the family Glossiphonidae were positively 494
associated with E. nuttallii, and freshwater snails in the genera Hippeautis, Lymnea, Valvata, 495
Physa and Bithynia, which have similar oxygen requirements, show a range of different 496
responses. Allelopathy may explain observed negative association between E. nuttalii and 497
lepidopteran larvae in the family Pyralidae, as E. nuttalii has been previously shown to retard 498
the growth and reduce the survival of the Pyralidae species Acentria ephemerella under 499
laboratory conditions (Erhard et al. 2007). Where Pyralidae larvae exist in large numbers they 500
may substantially reduce cover of other macrophyte species providing an indirect advantage 501
to Elodea spp. (Gross et al. 2001). 502
One weakness of the pairing of native and invasive plant beds in this study was that it was 503
not possible to use sites where only E. nuttallii was present (i.e. highly invaded sites). 504
Therefore, if native species are required at particular points in invertebrate life cycles (e.g. 505
reproduction), population declines associated with their absence may not have been detected 506
as invertebrate species could move between plant beds if necessary. Additionally, many 507
Northern Irish water bodies, such as those sampled here, have been subject to considerable 508
21

pressure from eutrophication, pollution and human disturbance, especially in lowland areas 509
(Heegaard et al. 2001) prior to the introduction of invasive species, such as E. nuttallii. The 510
algal and invertebrate communities present in these waterbodies differ from those in more 511
pristine sites, especially in the relative lack of rare species. Impacts of invasive macrophytes 512
may also differ depending on trophic status of waterbodies (Strayer 2010) and in some cases 513
the same invasive macrophyte species has opposite effects on invertebrates in different study 514
systems (Schultz, Dibble 2012). Therefore, it is possible that the impact of E. nuttallii on 515
invertebrate and algal communities would have been different in oligotrophic sites or more 516
pristine sites which had not been previously impacted by anthropogenic pressures. 517
Together these field studies provide insights into the potential impacts of the widespread 518
invader Elodea nuttallii on a range of taxa in temperate waterbodies. Due to the correlational 519
nature of these studies it is not possible to determine cause-and-effect or to reveal the exact 520
drivers of change in biological communities. Here, where possible we have used closely 521
paired sites within waterbodies to minimise potentially confounding differences between 522
sites. We suggest that the results of this research may be used to direct further research 523
including both field and laboratory experiments focused on the interaction of E. nuttallii with 524
particular species of concern (e.g. the observed negative association of E. nuttallii and 525
charophytes). 526
In conclusion, our findings suggest that whilst E. nuttallii significantly altered freshwater 527
communities, observed differences were small relative to other factors such as nutrient levels, 528
inter-annual variation and differences between sites. In addition, we add to a growing body of 529
literature that suggests that the impacts of aquatic invasive plant species are not consistently 530
negative and they may, for example, increase the richness of native plant species or the 531
abundance of invertebrate species if total plant biomass increases as a result of invasion 532
(Schultz, Dibble 2012; Strayer 2010; Thomaz et al. 2012). 533
534 22

Acknowledgements 535
This research was funded by the Natural Heritage Research Partnership (NHRP) between the 536
Northern Ireland Environment Agency (NIEA) and Quercus, Queen’s University Belfast 537
(QUB) under a PhD studentship (QU08-05). Water chemistry analyses for the field study 538
were conducted by the Agri-Food and Biosciences Institute, Newforge Lane, Belfast. Data 539
from Lough Erne surveys were kindly supplied by Brenda Walker of the NIEA. Thanks to 540
Irena Tománková for her assistance with invertebrate identification. We also thank our NIEA 541
client officers, John Early and Tony Waterman, for their support. Thanks also to two 542
anonymous reviewers whose advice substantially improved this manuscript. 543
544
23

545
References 546
Angelstein S, Schubert H (2008) Elodea nuttallii: uptake, translocation and release of 547 phosphorus. Aquat Biol 3:209-216 548
549 Angelstein S, Schubert H (2009) Light acclimatisation of Elodea nuttallii grown under 550
ambient DIC conditions. Plant Ecol 202:91-101 551 552 Barrat-Segretain M (2005) Competition between invasive and indigenous species: impact of 553
spatial pattern and developmental stage. Plant Ecol 180:153-160 554 555 Barrs JR, Keenan EA, O'Callaghan P, Caffrey J (2008) Research and control programme for 556
Lagarosiphon major (Hydrocharitaceae). Central Fisheries Board, Ireland 557 558 Barton K (2013) MuMIn: Multi-model inference. R package version 1.9.11. 559 560 Bellinger EG, Sigee DC (2010) Freshwater algae: identification and use as bioindicators. 561
Wiley-Blackwell, UK 562 563 Burks R, Lodge D (2002) Cued in: Advances and opportunities in freshwater chemical 564
ecology. Journal of Chem Ecol 28:1901-1917 565 566 Caffrey JM, Baars J-R, Barbour JH, Boets P, Boon P, Davenport K, Dick, J, Early, J, Edsman 567
L, Gallagher C, Gross J, Heinimaa P, Horrill C, Hudin S, Hulme PE, Hynes S, 568 MacIsaac HJ, McLoone P, Millane M, Moen, TL, Moore N, Newman J, O’Conchuir R, 569 O’Farrell M, O’Flynn Colette, Oidtmann B, Renals T, Ricciardi A, Roy H, Shaw R, van 570 Valkenburg JLCH, Weyl Olaf, Williams F, Lucy FE (2014) Tackling invasive alien 571 species in Europe: the top 20 issues. Manag Biol Invasion 5:1-20 572
573 Capers RS, Selsky R, Bugbee GJ, White JC (2007) Aquatic plant community invasibility and 574
scale-dependent patterns in native and invasive species richness. Ecology 88:3135-3143 575 576 Carniatto N, Thomaz SM, Cunha ER, Fugi R, Ota RR (2013) Effects of an invasive alien 577
Poaceae on aquatic macrophytes and fish communities in a neotropical reservoir. 578 Biotropica 45:747-754 579
580 Carvalho L, Dudley B, Dodkins I, Clarke R, Jones I, Thackeray S, Maberly S (2007) Final 581
report project WFD80 Phytoplankton classification tool (Phase 2). SNIFFER, 582 Edinburgh 583
584 Chaloner DT, Hershey AE, Lamberti GA (2009) Benthic invertebrate fauna. Elsevier, New 585
York 586 587 Champion PD, Clayton JS, Hofstra DE (2010) Nipping aquatic plant invasions in the bud: 588
weed risk assessment and the trade. Hydrobiologia 656:167-172 589 590 Compin A, Cereghino R (2007) Spatial patterns of macroinvertebrate functional feeding 591
groups in streams in relation to physical variables and land-cover in Southwestern 592 France. Landscape Ecol 22:1215-1225 593
24

Cox EJ (1996) Identification of freshwater diatoms from live material. Chapman and Hall, 594 London 595
596 Cummins KW, Klug MJ (1979) Feeding ecology of stream invertebrates. Annu Rev Ecol 597
Syst 10:147-172 598 599 DAISIE (2015) 100 of the worst. http://www.europe-aliens.org/speciesTheWorst.do 600
Accessed 16 January 2015 601 602 Declerck S, Vanderstukken M, Pals A, Muylaert K , de Meester L (2007) Plankton 603
biodiversity along a gradient of productivity and its mediation by macrophytes. 604 Ecology 88:2199-2210 605
606 deWinton MD, Clayton JS (1996) The impact of invasive submerged weed species on seed 607
banks in lake sediments. Aquat Bot 53:31-45 608 609 Edington JM, Hildrew AG (1995) Sp. 53 Caseless cadis larvae (Trichoptera) A revised key to 610
the caseless cadis larvae of the British Isles, with notes on their ecology. Freshwater 611 Biological Association, Ambleside 612
613 Elliott JM, Mann KH (1998) Sp. 40 Leeches. A key to the British Freshwater Leeches, with 614
notes on their life cycles and ecology. Freshwater biological association, Ambleside 615 616 Erhard D, Pohnert G, Gross EM (2007) Chemical defense in Elodea nuttallii reduces feeding 617
and growth of aquatic herbivorous Lepidoptera. J Chem Ecol 33:1646-1661 618 619 Evangelista HBA, Thomaz SM, Umetsu CA (2014) An analysis of publications on invasive 620
macrophytes in aquatic ecosystems. Aquatic Invasions 9:521-528 621 622 Fitter R, Manuel R (1986) Field guide to lakes, rivers, streams and ponds of north-west 623
Europe. Harper Collins, Hong Kong 624 625 Fournier D, Skaug H, Ancheta J, Ianelli J, Magnusson A, Maunder MN, Nielsen A, Sibert J 626
(2012) AD Model Builder: using automatic differentiation for statistical inference of 627 highly parameterized complex nonlinear models. Optimization Methods & Software 628 27:233-249 629
630 Friday LE (1998) A key to the adults of British water beetles. Journal of the Field Studies 631
Council 7:1-152 632 633 Gledhill T, Sutcliffe DW, Williams WD (1993) British freshwater Crustacea Malacostraca: a 634
key with ecological notes. Freshwater Biological Association, Cumbria 635 636 Gross EM, Johnson RL, Hairston NG (2001) Experimental evidence for changes in 637
submersed macrophyte species composition caused by the herbivore Acentria 638 ephemerella (Lepidoptera). Oecologia 127:105-114 639
640 Hamilton SK, Lewis WM, Sippel SJ (1992) Energy-sources for aquatic animals in the 641
Orinoco River floodplain - evidence from stable isotopes. Oecologia 89:324-330 642 643
25

Heegaard E, Birks H, Gibson C, Smith, SJ, Wolfe-Murphy, S (2001) Species-environmental 644 relationships of aquatic macrophytes in Northern Ireland. Aquat Bot 70:175-223 645
646 Heino J (2008) Patterns of functional biodiversity and function-environment relationships in 647
lake littoral macroinvertebrates. Limnol Oceanogr 53:1446-1455 648 649 Hillebrand H, Durselen C, Kirschtel D, Pollingher U, Zohary T (1999) Biovolume calculation 650
for pelagic and benthic microalgae. J Phycol 35:403-424 651 652 Hogsden K, Sager E, Hutchinson T (2007) The impacts of the non-native macrophyte 653
Cabomba caroliniana on littoral biota of Kasshabog Lake, Ontario. J Great Lakes Res 654 33:497-504 655
656 Hulme PE (2012) Weed risk assessment: a way forward or a waste of time? J Appl Ecol 657
49:10-19 658 659 Hussner A (2012) Alien aquatic plant species in European countries. Weed Res 52:297-306 660 661 James C, Eaton J, Hardwick K (1999) Competition between three submerged macrophytes, 662
Elodea canadensis Michx, Elodea nuttallii (Planch.) St John and Lagarosiphon major 663 (Ridl.) moss. Hydrobiologia 415:35-40 664
665 John DM, Whitton BA, Brook AJ (2002) The freshwater algal flora of the British Isles: An 666
identification guide to freshwater and terrestrial algae. Cambridge University Press, UK 667 668 Kelly D, Hawes I (2005) Effects of invasive macrophytes on littoral-zone productivity and 669
foodweb dynamics in a New Zealand high-country lake. J N Am Benthol Soc 24:300-670 320 671
672 Kelly R, Leach K, Cameron A, Maggs CA, Reid, N (2014a) Combining global climate and 673
regional landscape models to improve prediction of invasion risk. Divers distrib 20, 674 884–894 675
676 Kelly R, Lundy MG, Mineur F, Harrod C, Maggs CA, Humphries NE, Sims DW, Reid N 677
(2014b) Historical data reveal power-law dispersal patterns of invasive aquatic species. 678 Ecography 37:581-590 679
680 Kennedy T, Naeem S, Howe K, Knops JMH, Tilman D, Reich P (2002) Biodiversity as a 681
barrier to ecological invasion. Nature 417:636-638 682 683 Kornijow R, Vakkilainen K, Horppila J, Luokkanen E, Kairesalo T (2005) Impacts of a 684
submerged plant (Elodea canadensis) on interactions between roach (Rutilus rutilus) 685 and its invertebrate prey communities in a lake littoral zone. Freshwater Biol 50:262-686 276 687
688 Kovalenko KE, Dibble ED (2014) Invasive macrophyte effects on littoral trophic structure 689
and carbon sources. Hydrobiologia 721:23-34 690 691
26

Kruk C, Huszar V, Peeters E, Bonilla S, Costa L, Lurling M , Reynolds CS , Scheffer M 692 (2010) A morphological classification capturing functional variation in phytoplankton. 693 Freshwater Biol 55:614-627 694
695 Leung B, Roura-Pascual N, Bacher S, Heikkila J, Brotons L, Burgman MA, Dehnen-Schmutz 696
K,Essl F, Hulme PE, Richardson DM, Sol D, Vila M (2012) TEASIng apart alien 697 species risk assessments: a framework for best practices. Ecol Lett 15:1475-1493 698
699 Levine J (2000) Species diversity and biological invasions: Relating local process to 700
community pattern. Science 288:852-854 701 702 Lonsdale W (1999) Global patterns of plant invasions and the concept of invasibility. 703
Ecology 80:1522-1536 704 705 Michelan T, Thomaz S, Mormul R, Carvalho P (2010) Effects of an exotic invasive 706
macrophyte (tropical signalgrass) on native plant community composition, species 707 richness and functional diversity. Freshwater Biol 55:1315-1326 708
709 Mjelde M, Lombardo P, Berge D, Johansen SW (2012) Mass invasion of non-native Elodea 710
canadensis Michx. in a large, clear-water, species-rich Norwegian lake - impact on 711 macrophyte biodiversity. Int J Limnol 48:225-240 712
713 Montgomery WI, Lundy MG, Reid N (2012) 'Invasional meltdown': evidence for unexpected 714
consequences and cumulative impacts of multispecies invasions. Biol Invasions 715 14:1111-1125 716
717 Netten J, Arts G, Gylstra R, Roijackers RMM (2010) Effect of temperature and nutrients on 718
the competition between free-floating Salvinia natans and submerged Elodea nuttallii 719 in mesocosms. Fund and Appl Limnol 177:125-132 720
721 O'Hare M, Gunn I, Chapman D, Dudley BJ, Purse BV (2012) Impacts of space, local 722
environment and habitat connectivity on macrophyte communities in conservation 723 lakes. Divers Distrib 18:603-614 724
725 Oksanen J, Blanchet FG, Kindt R, Legendre, P, Minchin PR,O'Hara RB, Simpson GL, 726
Solymos P, Stevens MHH, Wagner, Helene (2013) vegan: Community Ecology 727 Package. R package version 2.0-9. 728
729 R Core Development Team (2012) R: A language and environment for statistical computing. 730
R Foundation for Statistical Computing, Vienna, Austria 731 732 Rybicki N, Landwehr J (2007) Long-term changes in abundance and diversity of macrophyte 733
and waterfowl populations in an estuary with exotic macrophytes and improving water 734 quality. Limnol Oceanogr 52:1195-1207 735
736 Sala OE, Chapin III FS, Armesto JJ, Berlow Eric, Bloomfield J, Dirzo R, Huber-Sanwald E, 737
Huenneke LF, Jackson RB, Kinzig A, Leemans R, Lodge DM, Mooney HA, Oesterheld 738 M, Poff, NL, Sykes, MT, Walker, BH, Walker M, Wall DH (2000) Global biodiversity 739 scenarios for the year 2100. Science 287:1770-4 740
741
27

Savage AA (1989) Adults of the British Aquatic Hemiptera Heteroptera: a Key with 742 Ecological Notes. Freshwater Biological Association, Ambleside, UK 743
744 Schultz R, Dibble E (2012) Effects of invasive macrophytes on freshwater fish and 745
macroinvertebrate communities: the role of invasive plant traits. Hydrobiologia 684:1-746 14 747
748 Simberloff D (2006) Invasional meltdown 6 years later: important phenomenon, unfortunate 749
metaphor, or both? Ecol Lett 9:912-919 750 751 Stiers I, Crohain N, Josens G, Triest L (2011) Impact of three aquatic invasive species on 752
native plants and macroinvertebrates in temperate ponds. Biol Invasions 13:2715-2726 753 754 Strayer D (2010) Alien species in fresh waters: ecological effects, interactions with other 755
stressors, and prospects for the future. Freshwater Biol 55:152-174 756 757 Szabo S, Scheffer M, Roijackers R, Waluto B, Braun M, Nagy PT, Borics G, Zambrano L 758
(2010) Strong growth limitation of a floating plant (Lemna gibba) by the submerged 759 macrophyte (Elodea nuttallii) under laboratory conditions. Freshwater Biol 55:681-690 760
761 Thiébaut G, Di Nino F, Peltre M-C, Wagner, P (2008) Management of Aquatic Exotic Plants: 762
The Case of Elodea Species. In: Sengupta M and Dalwani R (eds) The 12th World Lake 763 Conference. Taal, pp. 1058-1066 764
765 Thomaz SM, Silveira MJ, Michelan TS (2012) The colonization success of an exotic Poaceae 766
is related to native macrophyte richness, wind disturbance and riparian vegetation. 767 Aquat Sci 74:809-815 768
769 Thouvenot L, Puech C, Martinez L, Haury J,Thiebaut G (2013) Strategies of the invasive 770
macrophyte Ludwigia grandiflora in its introduced range: Competition, facilitation or 771 coexistence with native and exotic species? Aquat Bot 107:8-16 772
773 Valinoti C, Ho C, Armitage A (2011) Native and exotic submerged aquatic vegetation 774
provide different nutritional and refuge values for macroinvertebrates. J Exp Mar Biol 775 Ecol 409:42-47 776
777 Wallace ID, Wallace B, Philipson GN (1990) A key to the case-bearing caddis larvae of 778
Britain and Ireland. Freshwater Biological Association, Ambleside, UK 779 780 Warfe DM, Barmuta LA (2006) Habitat structural complexity mediates food web dynamics 781
in a freshwater macrophyte community. Oecologia 150:141-154 782
783
28
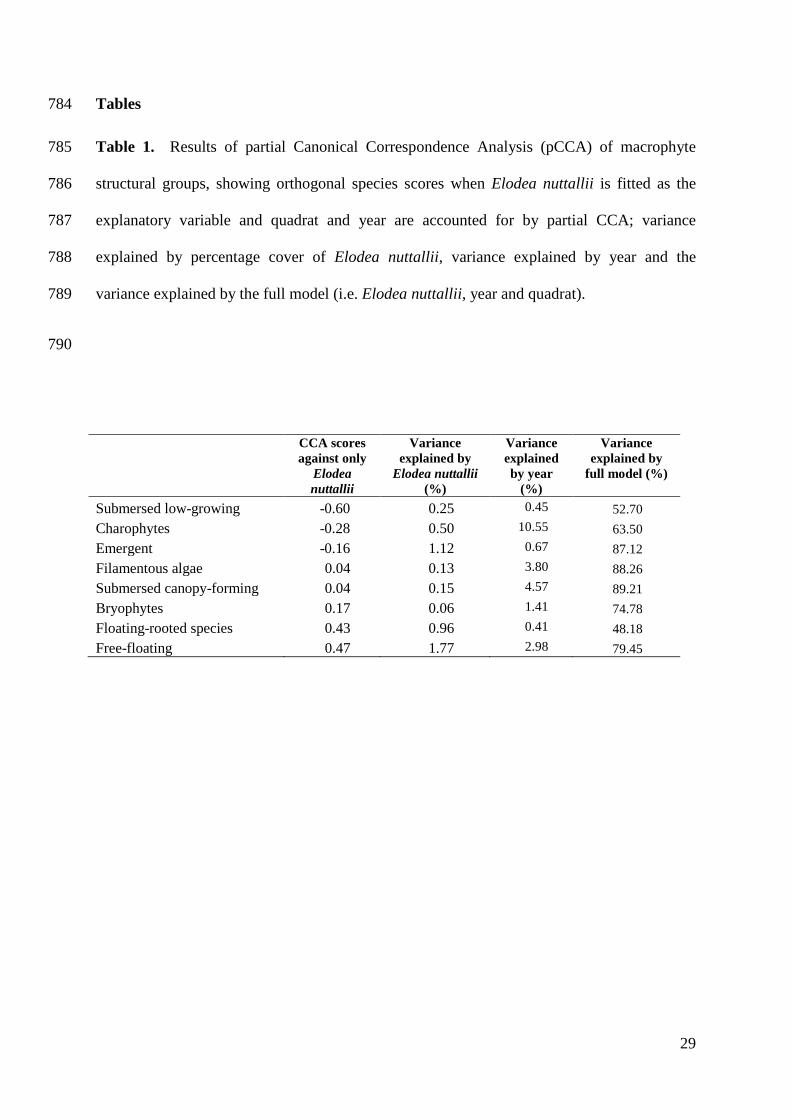
Tables 784
Table 1. Results of partial Canonical Correspondence Analysis (pCCA) of macrophyte 785
structural groups, showing orthogonal species scores when Elodea nuttallii is fitted as the 786
explanatory variable and quadrat and year are accounted for by partial CCA; variance 787
explained by percentage cover of Elodea nuttallii, variance explained by year and the 788
variance explained by the full model (i.e. Elodea nuttallii, year and quadrat). 789
790
CCA scores against only
Elodea nuttallii
Variance explained by
Elodea nuttallii (%)
Variance explained by year
(%)
Variance explained by
full model (%)
Submersed low-growing -0.60 0.25 0.45 52.70 Charophytes -0.28 0.50 10.55 63.50 Emergent -0.16 1.12 0.67 87.12 Filamentous algae 0.04 0.13 3.80 88.26 Submersed canopy-forming 0.04 0.15 4.57 89.21 Bryophytes 0.17 0.06 1.41 74.78 Floating-rooted species 0.43 0.96 0.41 48.18 Free-floating 0.47 1.77 2.98 79.45
29

791
Table 2. Results of partial Canonical Correspondence Analysis (pCCA) for the genera most 792
strongly associated with Elodea nuttallii. Genera with greater than 0.5% of variation 793
explained by Elodea nuttallii are shown. Table shows species from each genus present in the 794
dataset, species scores when Elodea nuttallii is fitted as the explanatory variable and depth, 795
quadrat location and year are accounted for by partial CCA, variance explained by percentage 796
cover of Elodea nuttallii, variance explained by depth and year, and the variance explained 797
by the full model. 798
799 Genus/Family Species CCA scores
against only Elodea nuttallii
Variance explained by
Elodea nuttallii (%)
Variance explained by
depth and year (%)
Variance explained
by full model (%)
Elodea E. canadensis -0.77 3.01 4.12 74.99
Juncus J. bulbosus -0.65 0.80 4.08 61.64
Sparganium S. emersum S. erectum
-0.32 0.54 0.57 69.87
*Characeae Chara globularis Chara vulgaris Nitella flexilis agg. Nitella translucens
-0.32 0.65 10.68 63.77
Equisetum E. fluviatile E. palustre
-0.30 0.68 5.55 77.02
Potamogeton P. alpina P. crispus P. filiformis P. friesii P. lucens P. natans P. obtusifolius P. pectinatus P. perfoliatus P. praelongus P. pusillus P. trichoides P. zizii
0.10 0.67 2.16 89.54
Nuphar N. lutea 0.44 0.94 1.25 47.75
Nymphaea N. alba 0.94 0.54 2.63 45.54
Stratiotes S. aloides 1.60 4.75 8.16 73.69
* Characeae were analysed at a family level as 2006 and 2007 surveys did not record at a species level within this family
30

Table 3. Results of partial Canonical Correspondence Analysis (pCCA) of invertebrate taxa 800
living on macrophytes in lakes. Taxanomic groups which were present in more than one 801
sample and for which > 0.5% of variation is explained by Elodea nuttallii are shown. Table 802
details taxa scores when Elodea nuttallii is fitted as the explanatory variable, variance 803
explained by percentage cover of Elodea nuttallii, and the variance explained by the full 804
model. 805
806
Taxa Species present Order CCA scores against Elodea nuttallii only
Variance explained by Elodea nuttallii
(%)
Variance explained by full
model (%) Pyralidae Spp. Lepidoptera -2.21 27.29 32.27 Hydrachna Spp. Trombidiformes -1.47 17.93 57.90 Coenagrionidae Spp. Odonata -1.27 5.47 9.03 Erpobdella E. octoculata
E. testacea Rhynchobdellida -1.25 20.00 55.60
Chironomidae Spp. Diptera -1.16 38.42 45.23 Rhyacophila Spp. Trichoptera -0.92 0.65 37.26 Physa P. fontinalis *Planorboidea -0.74 5.01 17.72 Lymnaea L. auricularia
L. palustris L. peregra
Lymnaea -0.70 6.23 33.01
Gyraulus G. albus *Planorboidea 0.34 1.25 24.87 Crangonyx C. pseudogracilis Amphipoda 0.37 1.70 17.04 Sialis S. lutaria Megaloptera 0.77 2.56 46.89 Bithynia B. tentaculata *Truncatelloidea 0.98 8.56 49.57 Cortixinae Spp. Hemiptera 1.22 9.30 49.01 Valvata V. cristata,
V. piscinalis *Valvatoidea 1.94 11.46 33.69
Limnephilidae Spp. Trichoptera 2.03 26.19 45.12 Hippeutis H. complanatus Gastropoda 2.05 11.73 31.97 Pisidium P. casertanum
P. subtruncatum *Planorboidea 2.44 23.66 54.02
* within the class Gastropoda, superfamily is given instead of Order as Orders are not defined for these taxa 807
808
31

Table 4. Results of partial Canonical Correspondence Analysis (pCCA) of invertebrate taxa 809
living on macrophytes in rivers. Taxonomic groups which were present in more than one 810
sample and for which > 0.5% of variation is explained by Elodea nuttallii are shown. Table 811
details taxa scores when Elodea nuttallii is fitted as the explanatory variable, variance 812
explained by percentage cover of Elodea nuttallii, and the variance explained by the full 813
model. 814
815
Taxa Species present Order CCA scores against Elodea nuttallii only
Variance explained by Elodea nuttallii
(%)
Variance explained by full
model (%) Crangonyx C. pseudogracilis Amphipoda -3.07 40.46 55.82 Sialis S. lutaria Megaloptera -2.78 37.99 52.11 Bithynia B. tentaculata *Truncatelloidea -1.88 29.44 55.33 Pisidium P. amnicum
P. casertanum Veneroida -1.81 6.49 13.26
Theromyzon T. tessulatum Rhynchobdellida -1.66 9.72 52.30 Haliplus H. confinis Coleoptera -1.29 7.74 59.27 Stictotarsus S. duodecimpustulatus Coleoptera -1.18 6.94 61.61
Coenagrionidae Spp. Odonata -0.89 1.12 16.89 Asellus A. aquaticus Amphipoda -0.59 14.33 57.41 Physa P. fontinalis *Planorboidea -0.44 3.23 57.12 Chironomidae spp. Diptera -0.36 1.24 13.24 Helobdella H. stagnalis Rhynchobdellida -0.29 3.75 64.28 Lymnaea L. palustris
L. stagnalis L. peregra L. trunculata
*Lymnaeoidea -0.26 1.32 81.69
Cortixinae Spp. Hemiptera 0.67 1.89 32.35 Valvata V. piscinalis *Valvatoidea 0.85 1.91 28.78 Gyraulus G. albus *Planorboidea 0.87 5.58 72.10 Gammarus G. pulex Amphipoda 0.97 5.26 25.61 Planorbis P. carinatus *Planorboidea 1.19 22.78 60.58 Planorbarius P. corneus *Planorboidea 1.28 20.42 75.93 Notonecta Spp. Hemiptera 1.28 9.16 17.87 Limnephilidae Spp. Trichoptera 1.28 8.45 64.97 Glossiphonia G. complanata
G. heteroclite Rhynchobdellida 2.28 20.12 40.63
Hippeutis H. complanatus *Planorboidea 2.69 14.39 38.29
* within the class Gastropoda, superfamily is given instead of Order as Order is not defined for these taxa
816
32

Figures & legends 817
818
Fig. 1 a) Field sites for study of impacts of Elodea nuttallii on dissolved oxygen, chorophyll 819
a, pH, algae and invertebrates. Samples were paired within sites such that samples were taken 820
from a stand of E. nuttallii and a stand of native plants within each site, b) inset map of 821
Ireland showing field site locations. 822
823
33

824
825
Fig. 2 a) Study sites for macrophytes in Lough Erne. Black triangles show the locations of 826
survey transects. White circles show locations where water chemistry parameters were 827
measured, b) inset map of Ireland showing location of Lough Erne. 828
34

829
Fig. 3 Plot of partial Canonical Correspondence Analysis showing relationships between 830
Elodea nuttallii and plant functional groups, when year is also fitted an explanatory factor 831
and quadrat ID is accounted for as a random factor. Species scores are unscaled. Axis labels 832
show % of total variation in macrophyte communities explained by each CCA axis. Grey 833
ellipse shows 95% confidence interval around sites where Elodea nuttallii is present, dashed 834
grey ellipse shows 95% confidence interval around sites where Elodea nuttallii is not present. 835
35

836
Fig. 4 Plot of partial Canonical Correspondence Analysis showing relationships between 837
Elodea nuttallii and invertebrate taxa in lakes, when site is accounted for as a random factor. 838
Species scores are unscaled. Taxonomic groups which were present in more than one sample 839
and for which > 0.5% of variation is explained by Elodea nuttallii are shown. Axis labels 840
show % of total variation in macrophyte communities explained by each CCA axis. Grey 841
ellipse shows 95% confidence interval around sites where Elodea nuttallii is present, dashed 842
grey ellipse shows 95% confidence interval around sites where Elodea nuttallii is not present. 843
844
36

845 Fig. 5 Plot of partial Canonical Correspondence Analysis showing relationships between 846
Elodea nuttallii and invertebrate taxa in rivers, when site is accounted for as a random factor. 847
Species scores are unscaled. Taxonomic groups which were present in more than one sample 848
and for which > 0.5% of variation is explained by Elodea nuttallii are shown. Axis labels 849
show % of total variation in macrophyte communities explained by each CCA axis. Grey 850
ellipse shows 95% confidence interval around sites where Elodea nuttallii is present, dashed 851
grey ellipse shows 95% confidence interval around sites where Elodea nuttallii is not present. 852
853
37

Supplementary material 854
855
Table S1 Algal functional groups used 856
Table S2 Invertebrate biomass regression models 857
Table S3 Invertebrate feeding guilds 858
Table S4 Macrophyte structural groups 859
Table S5 Model details of macrophyte GLMMs 860
Table S6 Model details of macrophyte pCCAs 861
Table S7 Model details of GLMMs of dissolved oxygen, chorophyll a, pH and plant 862
biomass. 863
Table S8 Model details of algae GLMMs 864
Table S9 Model details of algae pCCAs 865
Table S10 Model details of invertebrate GLMMs 866
Table S11 Model details of invertebrate pCCAs 867
Table S12 Model details for multivariate analyses of homogeneity. 868
869
38

Supplementary material Table 1 Algal functional groups. Table shows which taxonomic groups were placed in each functional
group for analysis.
Group Key morphological features Taxonomic group
1 Small organisms with high
surface/volume ratio
Lyngbya, Oscillatoria, picoplankton, Stichococcus
2 Small, flagellated, with siliceous
exoskeletal features
Chromulina, Chrysophyta, Synura
3 Large filaments with aerotopes Anabaena spiroides, Chroococcales, Hapalosiphon, Nostoc 4 Medium size organisms, lacking
specialised traits
Ankyra, Aphanochaete magna, Bumilleriopsis, Characiochloris, Characiopsis, Characium, Closteriopsis acicularis, Closterium, Cosmarium, Microthamnion kuetzingianum, Monoraphidium, Mougeotia, Netrium, Oedogonium, Ophiocytium, Pediastrum duplex, Pediastrum tetras, Scenedesmus, Tetraedron, Tetrastrum staurogeniaeforme, Treubaria
5 Medium to large flagellates Chlamydomonas, Chroomonas, Cryptomonas, Dinophyceae Euglena, Gymnodinium, Haematococcus, Katodinium, Pandorina morum, Phacus, Trachelomonas
6 Non-flagellates with siliceous
exoskeletons
Achnanthes, Achnanthidium, Amphora, Aulacoseira Cocconeis, Cyclotella, Cymbella, Denticula, Diadesmis, Encyonema, Epithemia, Eunotia, Fragilaria, Frustulia, Gomphonema, Gyrosigma, Melosira varians, Meridion, Navicula, Nitzschia, Pinnularia, Pseudostaurosira, Rhoicosphenia curvata, Staurosirella, Stephanodiscus, Surirella
7 Large mucilaginous colonies Chamaesiphon, Chlorococcales, Gomphosphaeria, Hydrococcus, Kirchneriella obesa, Lagerheimia genevensis, Merismopedia, Microcystis, Oscillatoria, Phormidium, Protoderma, Quadrigula, Radiococcus, Rhabdoderma
8 Uncategorised genera Unidentifiable genera

Table S2 Best fitting invertebrate biomass regression models and formulae. Optimal regressions based on width/length (mm) and biomass (mg) of invertebrate taxa.
Invertebrate Taxa
n p Adj R2
Intercept (SE)
Slope (SE)
X variable + tranformation
Asellidae 162 <0.001 0.70 -5.07 (0.25) 2.67 (0.14) Length (Ln) Bithyniidae 57 <0.001 0.80 -2.59 (0.29) 2.01 (0.13) Length (Ln) Chironomus 29 <0.001 0.62 -4.18 (0.68) 1.67 (0.24) Length (Ln) Erpobdellidae 15 <0.001 0.92 -9.17 (0.72) 3.22 (0.25) Length (Ln) Glossiphonidae 24 0.0402 0.13 -1.82 (0.64) 0.63 (0.29) Length (Ln) Hydrobiidae 156 <0.001 0.40 -3.36 (0.22) 1.75 (0.17) Length (Ln) Lymnaeidae 81 <0.001 0.72 -3.76 (0.35) 2.59 (0.18) Length (Ln) Physidae 6 <0.001 0.85 -2.77 (0.64) 2.00 (0.37) Length (Ln) Planorbidae 24 <0.001 0.72 -1.23 (0.18) 2.06 (0.27) Width (Log10) Sphaeriidae 18 <0.001 0.74 -4.55 (0.56) 2.54 (0.35) Width (Ln) Valvatidae 52 <0.001 0.69 -3.41 (0.27) 2.75 (0.25) Width (Ln)

Table S3 Invertebrate feeding guilds. Table shows which taxonomic groups were placed in each feeding guild for analysis.
Collector Filterer Collector Gatherer Herbivore Piercer Predator
Scraper Grazer
Shredder
Chydoridae Baetidae Corixinae Argyroneta Asellus Chrysomelidae
Culicidae Beraea Curculionidae Batracobdella Bithynia Elminthidae
Cyclopoida Caenis Donacia Chaoboridae Brychius Gammarus
Daphniidae Dicrotendipes Macroplea Coenagrionidae Crangonyx Helophorus
Pisidium Endochironomus Dytiscidae Gyraulus Pyralidae
Polycentropodidae Chironomidae Erpobdella Haliplidae Glyptotendipes
Microtendipes Chironomus Gerris Haliplus Polypedilum
Limnephilidae Glossiphonia Hippeutis Oligochaeta Helobdella Lymnaea Hydrachna Physa Limnesia Planorbarius Nepidae Planorbis Notonecta Potamopyrgus Rhyacophila Valvata Sialis Stictotarsus Theromyzon
Velia

Table S4 Macrophyte structural groups. Table shows which taxonomic groups were placed in each structural group for analysis. Structural group Taxonomic group Emergent Alisma lanceolatum, Alisma plantago-aquatica, Apium inundatum, Baldellia ranunculoides, Butomus umbellatus, Caltha palustris,
Carex rostrata, Carex vesicaria, Cicuta virosa, Eleocharis palustre, Epilobium hirsutum, Equisetum fluviatile, Equisetum palustre, Filipendula ulmaria, Glyceria fluitans, Iris pseudacorus, Juncus bulbosus, Lythrum spp., Mentha aquatica, Menyanthes trifoliata, Myosotis scorpioides, Phalaris arundinacea, Phragmites australis, Persicaria amphibia, Potentilla palustris, Ranunculus flammula, Schoenoplectus spp., Solanum dulcamara, Sparganium erectum, Stachys palustris, Typha latifolia
Free-floating Hydrocharis morsus-ranae, Lemna gibba, Lemna minor, Lemna minuta, Lemna polyrhiza, Lemna trisulca, Stratiotes aloides Floating rooted Nuphar lutea, Nymphaea alba, Potamogeton natans, Sagittaria sagittifolia Submersed, canopy forming
Callitriche spp., Callitriche hamulata, Ceratophyllum demersum, Elodea canadensis, Elodea nuttallii, Myriophyllum alternifolium, Myriophyllum spicatum, Potamogeton alpina, Potamogeton crispus, Potamogeton filiformis, Potamogeton friesii, Potamogeton gramineus Potamogeton lucens, Potamogeton obtusifolius, Potamogeton pectinatus, Potamogeton perfoliatus, Potamogeton praelongus, Potamogeton pusillus, Potamogeton trichoides, Potamogeton gramineus x lucens, Ranunculus penicillatus, Ranunculus circinatus, Sparganium emersum, Zannichella palustre
Submersed, low growing
Eleocharis acicularis, Isoetes spp., Littorella uniflora
Bryophytes Fontinalis antipyretica, Fontinalis squamosa, Scapania spp. Filamentous algae Chlorophyta Charophytes Charophyceae

Table S5. Univariate models of macrophyte cover and species richness, where quadrat nested within lake was fitted as a random factor. “na” indicates variables not included in the final model.
Model/explanatory variables β ± s.e. Wald χ2 p a) % macrophytes cover (χ2
df=717 = 180.88, p<0.001) % Elodea nuttallii 0.013 ± 0.003 20.24 <0.001 % Elodea canadensis 0.029 ± 0.012 5.53 0.019 Depth -0.470 ± 0.083 31.90 <0.001 Year Factorial 8.47 0.037 Nutrient concentration -3.690 ± 2.109 3.06 0.080 % E. nuttallii * % E. canadensis na
b) % native macrophytes cover (χ2df=719 = 101.74, p<0.001)
% Elodea nuttallii na na na % Elodea canadensis na na na Depth -0.494 ± 0.087 32.42 <0.001 Year Factorial 9.51 <0.001 Nutrient concentration -4.082 ± 2.214 3.40 0.065 % E. nuttallii * % E. canadensis na
c) % native macrophyte richness (χ2df=717 =, p<0.001)
% Elodea nuttallii 0.002 ± 0.001 3.85 0.050 % Elodea canadensis 0.013 ± 0.004 11.58
Depth -0.397 ± 0.043 88.77 Year Factorial 26.86 Nutrient concentration 3.407 ± 1.176 8.39 0.004
% E. nuttallii * % E. canadensis na
Table S6. Results of pCCA models of cover of macrophyte genera and cover of macrophyte structural groups, where quadrat is accounted for as a conditional factor. “na“ indicates variables which were not included in the final model.
Model/explanatory variables Variance explained (%)
p a) % cover of macrophyte genera (df = 697, Conditional variance (Site) = 53.9, Constrained variance = 3.9, p = 0.010)
% Elodea nuttallii 0.5 0.005 % Elodea canadensis na na Depth 0.5 0.005 Year 2.0 0.005 Nutrient concentration na na % E. nuttallii * % E. canadensis na na
b) % cover of structural groups (df = 361, Conditional variance (Site) = 69.0, Constrained variance = 4.6, p = 0.005)
% Elodea nuttallii 0.6 0.005 % Elodea canadensis na na Depth na na Year 2.7 0.005 Nutrient concentration na na % E. nuttallii * % E. canadensis na na

Table S7. Results of univariate models of dissolved oxygen, chlorophyll a, pH, and plant biomass where site is fitted as a random factor. “na“ indicates variables not included in the final model.
Model/explanatory variables β ± s.e. Wald χ2 p a) dissolved oxygen saturation (χ2
df=31 = 6.25, p=0.043) Elodea nuttallii Factorial 3.21 0.073 Month na na na Nutrient concentration na na na Nutrient concentration * E. nuttalii na na na River/Lake Factorial 4.23 0.040 River/Lake * E. nuttallii na
na na
b) chlorophyll a (χ2
df=34 = 1.61, p=0.204) Elodea nuttallii na na na Month na na na Nutrient concentration na na na Nutrient concentration * E. nuttalii na na na River/Lake na na na River/Lake * E. nuttallii na
na na
c) pH (χ2
df=33 =40.45, p<0.001) Elodea nuttallii na na na Month Factorial 125.69 <0.001 Nutrient concentration na na na Nutrient concentration * E. nuttalii na na na River/Lake na na na River/Lake * E. nuttallii na
na Na
d) plant biomass (χ2
df=23 =1.99, p = 0.158) Elodea nuttallii na na na Month na na na Nutrient concentration na na na Nutrient concentration * E. nuttalii na na na River/Lake na na na River/Lake * E. nuttallii na
na na

Table S8. Results of univariate models of algal biovolume and richness of algal taxa, where site is fitted as a random factor. “na“ indicates variables which were not included in the final model.
Model/explanatory variables β ± s.e. Wald χ2 p a) algal biovolume (χ2
df=29 = 7.32, p=0.026) Elodea nuttallii na na na Month Factorial 8.40 0.015 Nutrient concentration na na na Nutrient concentration * E. nuttalii na na na River/Lake na na na River/Lake * E. nuttallii na
na na
b) richness of algal taxa (χ2
df=27 = 177.68, p<0.001) Elodea nuttallii na 3.67 0.055
Month na 20.19 <0.001 Nutrient concentration na na na Nutrient concentration * E. nuttalii na na na River/Lake na na na River/Lake * E. nuttallii na
na na
Table S9. Results of pCCA models of algal taxa and algal functional groups, where site is accounted for as a conditional factor. “na“ indicates variables which were not included in the final model.
Model/explanatory variables Variance explained (%)
p a) biovolume of algal taxa (df = 23, Conditional variance(Site) = 34.5, Constrained variance = 15.5, p = 0.015)
Elodea nuttallii na na Month 7.1 0.041 Nutrient concentration 5.3 0.030 Nutrient concentration*E.nuttallii na na River/Lake na na River/Lake * E. nuttallii na na
b) biovolume of functional groups (df = 25, Conditional variance(Site) = 19.1, Constrained variance = 0, p = 0.340)
Elodea nuttallii na na Month na na Nutrient concentration na na Nutrient concentration*E.nuttallii na na River/Lake na na River/Lake * E. nuttallii na na

Table S10. Results of univariate models of invertebrate biomass and richness, where site is fitted as a random factor. “na“ indicates variables which were not included in the final model.
Model/explanatory variables β ± s.e. Wald χ2 p a) biomass of invertebrates on macrophytes (χ2
df=18 = 20.87, p<0.001) Elodea nuttallii na na na
Month Factorial 12.05 <0.001 Nutrient concentration 0.561 ± 0.200 7.85 <0.001 Nutrient concentration * E. nuttalii na na na Plant density 0.495 ± 0.120 17.01 < 0.001 River/Lake na na na River/Lake * E. nuttallii na
na na
b) richness of invertebrates on macrophytes (χ2
df=21 = 13.33, p=0.002) Elodea nuttallii na na na Month Factorial 6.30 0.012 Nutrient concentration na na Na Nutrient concentration * E. nuttalii na na Na Plant density 0.125 ± 0.075 2.76 0.096 River/Lake na na na River/Lake * E. nuttallii na
na na
c) biomass of invertebrates in sediment (χ2
df=20 =8.93, p<0.001) Elodea nuttallii na na na Month na na na Nutrient concentration 0.792 ± 0.341 9.54 0.002 Nutrient concentration * E. nuttalii na na na Plant density na na na River/Lake na na na River/Lake * E. nuttallii na
na na
d) richness of invertebrates in sediment (χ2
df=20 =1.99, p = 0.158) Elodea nuttallii na na na Month na na na Nutrient concentration na na na Nutrient concentration * E. nuttalii na na na Plant density na na na River/Lake na na na River/Lake * E. nuttallii na
na na

Table S11. Results of pCCA models of invertebrate taxa and feeding guilds, where site is accounted for as a conditional factor. “na“ indicates variables which were not included in the final model.
Model/explanatory variables Variance explained (%)
p a) biomass of invertebrate taxa on macrophytes (df = 15, Conditional variance(Site) = 39.9, Constrained variance = 0, p=0.017)
Elodea nuttallii na na Month na na Nutrient concentration na na Nutrient concentration*E.nuttallii na na Plant density na na River/Lake na na River/Lake * E. nuttallii na na
b) biomass of invertebrate feeding guilds on macrophytes (df = 17, Conditional variance(Site) = 45.2, Constrained variance = 10.5, p=0.005)
Elodea nuttallii na na Month na na Nutrient concentration na na Nutrient concentration*E.nuttallii na na Plant density na na River/Lake na na River/Lake * E. nuttallii 10.45 0.044
c) biomass of invertebrate taxa in sediment (df = 17, Conditional variance(Site) = 42.4, Constrained variance = 0, p=0.005)
Elodea nuttallii na na Month na na Nutrient concentration na na Nutrient concentration*E.nuttallii na na Plant density na na River/Lake na na River/Lake * E. nuttallii na na
c) biomass of invertebrate taxa in sediment (df = 17, Conditional variance(Site) = 42.4, Constrained variance = 0, p=0.005)
Elodea nuttallii na na Month na na Nutrient concentration na na Nutrient concentration*E.nuttallii na na Plant density na na River/Lake na na River/Lake * E. nuttallii na na

Table S12. Results of analyses of multivariate homogeneity of group dispersion for macrophyte, algae and invertebrate taxa. Estimates show mean Jaccard dissimilarity between sites with E. nuttallii present and mean Jaccard dissimilarity between sites without E. nuttallii, based on presence and absence of taxa.
Model/explanatory variables mean ± se
a) macrophyte taxa (Fdf=726 =24.34, p<0.001) Elodea nuttallii present 0.43 ± < 0.01 Elodea nuttallii absent 0.49 ± < 0.01
b) algal taxa(Fdf=24 =0.42, p=0.521)
Elodea nuttallii present 0.49 ± < 0.01 Elodea nuttallii absent 0.48 ± 0.02
c) invertebrate taxa on macrophytes (Fdf=22 =0.92, p=0.179)
Elodea nuttallii present 0.55 ± 0.03 Elodea nuttallii absent 0.60 ± 0.03
d) invertebrate taxa in sediment (Fdf=22 =0.92, p=0.179)
Elodea nuttallii present 0.51 ± 0.02 Elodea nuttallii absent 0.53 ± 0.03
