effects of fdi on institutions
TRANSCRIPT

1
Effects of FDI Flows on Institutional Development in the South:
Does It Matter Where the Investors are from?
Firat Demir
University of Oklahoma Department of Economics
308 Cate Center Drive, Room 436 CCD1 Norman, Oklahoma, USA 73019
E-mail: [email protected] Tel: +1 405 325 5844; fax: +1 405 325 5842.
FIRST DRAFT
ABSTRACT
FDI flows to and from developing countries have increased significantly accounting for more than 31% and 52% of global flows in 2012, respectively. Even more impressive has been the increase in South-South FDI flows, reaching around 63% of all outflows from developing countries in 2010. The increasing share of South-South flows and rising assertiveness of developing country multinationals in cross-border investments have created a controversy with regard to their effects on host country institutions. Given the weaker conditionality requirements in South-South FDI compared to North-South flows, developing countries such as China are accused of undermining developed country efforts to improve the institutional quality of developing countries. In this paper we provide an empirical analysis of the effects of bilateral FDI flows on institutional distance between home and host countries and whether such effects are dependent on the direction of the flows that is South-South vs. North-South, as well as South-North and North-North. The empirical result using bilateral FDI flows data among 134 countries during 1990-2009 suggests that the institutional development effects of bilateral FDI flows from North to South as well as those from South to South countries are not significant and are not any different from each other. In either case we do not find any significant convergence or divergence effect of FDI flows on the institutional distance between host and home countries. We also fail to find any significant effect of pooled North-South FDI flows on host country institutions. In contrast, we find that pooled South-South FDI flows have a significantly negative effect on host country institutions. Furthermore, we find some evidence that South – South FDI flows might be harmful to institutional development in natural resource rich countries while the opposite is true for North – South flows. Last but not least we discover that bilateral trade flows are much more influential in institutional convergence between countries. Keywords: Institutional development, Bilateral FDI flows, South-South capital flows JEL Codes: O10; F21; F23; P48; K33
2
1. INTRODUCTION
“What we have here -- in states like China, Iran, Saudi Arabia, and Venezuela -- are regimes that have the cash and the will to reshape the world into a place very different from where the rest of us want to live. Although they are not acting in concert, they collectively represent a threat to healthy, sustainable development… If they continue to succeed in pushing their alternative development model, they will succeed in underwriting a world that is more corrupt, chaotic, and authoritarian” (Naim, 2007).
Foreign Direct Investment (FDI) outflows from developing countries have increased significantly reaching $482 billion and accounting for more than 35% of global flows in 2012, which is a significant increase compared to their 1990 level of less than 5%.1 Equally impressive has been the fact that China exceeded Japan for the first time in terms of outward FDI flows in 2010. Furthermore, developing countries attracted 58% of global FDI inflows in 2012 and reached $790 billion, which again is a significant increase from their 1990 level of $35 billion that was only 17% of global flows (UNCTAD, 2013). As of 2012 four of top five host countries for FDI flows were developing countries, and seven developing countries were among the top 20 investors in the world (UNCTAD, 2013). Within aggregate flows to and from the South, South-South FDI flows increased significantly, reaching around 63% of all outflows from developing countries in 2010 (UNCTAD, 2011; WB, 2011). In the case of Latin America and the Caribbean region, for example, developing countries from Asia accounted for 68%, and intra-regional flows accounted for 17% of all Merger and Acquisitions in 2010 (UNCTAD, 2011: 59, 60). Overall, the share of developing country TNCs in this region increased from 8% in 2001 to 43% in 2010 (UNCTAD, 2011: 60).
The rising tide of global FDI flows has led a significant push in many countries for improving and harmonizing their institutional environment in order to increase their global competitiveness.2 Between 2000 and 2012 an average of 55 countries adopted a total of 1,082 policy changes (and for an average of 83 changes a year) in their legal and institutional settings to promote and facilitate a more favorable environment for foreign investors. Furthermore, by the end of 2012 a total of 9,111 bilateral investment treaties including features for improving and re-aligning institutional settings of home (source) and host (destination) countries have been signed among 200 countries (UNCTAD, 2013). Nevertheless, the growing importance of South-South FDI flows has also led to plenty of controversy regarding their impacts on host country institutions. It is frequently argued that developing country investments in other developing countries undermine, or ta the least weaken, Western country efforts to improve the institutions and policy environment of host countries due to their lack of policy conditions. China, for example, in its economic relations with other developing countries, particularly with those in Africa, has often been accused of “neglecting human rights offences in recipient nations, supporting corrupt authoritarian regimes, and undermining Western efforts in these countries to promote good governance” and better institutional quality, including economic and political infrastructure and institutions (Economist, 2006; Warmerdam, 2012).3 The lack of conditionality under the premise of respecting host country national sovereignty and “separating business from politics” (as put forward by China) is argued to diminish the Western countries’ bargaining position with regard to institutional and political changes that they seek in those countries. It is also suggested that developed country investments are more beneficial for developing countries than those from the South as they spill over
1 We classify transition economies as developing countries. 2 Governments around the world try to attract FDI to gain technology and productivity spillovers and transfers as foreign firms, compared to domestic firms, are found to have higher productivity, better risk management, know-how, and experience as well as better access to international goods and capital markets, and larger supply of internal finance through parent company (Navaretti et al. 2003; Almeida, 2007; Huttunen, 2007; Yasar and Paul, 2007, 2009; Desai et al., 2008; Arnold and Javorcik, 2009). 3 For further discussion, see Mbaye, (2011), Graham-Harrison (2009), Strange et al. (2003). Moreover, the 2013 Human Development Report of UNDP (titled the Rise of the South) includes an entire chapter on the issue of re-aligning the institutional structures of the South with the North, including those involving trade policy, business environment, transparency and rule of law. Likewise, the 2012 World Investment report of UNCTAD is focused on the issues regarding realigning home and host country institutions as well as harmonizing international rules with regard to policy environment and institutional framework for cross-border investment flows.
3
“demonstration” and “professionalization” effects over local firms and institutions (Kwok and Tadesse, 2006).
Nevertheless, despite a significant amount of ink spilled over this debate, there is no empirical study that tests the “China effect” or any robust evidence of a positive “Western effect” in developing countries. While it has been repeatedly found that aggregate FDI flows have significant growth and development effects in recipient countries, none has yet explored their effects on institutional development in host countries as well as the institutional convergence between home and host economies. Instead, most research on FDI has focused on their direct economic effects through technology transfer and productivity spillovers (Haddad and Harrison, 1993; Aitken and Harrison, 1999; Hall and Jones, 1999; Haskel et al., 2007).
This is particularly surprising given that empirical work on institutional development has shown that institutions do matter for: long run development and growth (Mauro, 1995; Knack and Keefer, 1995; Kaufmann et al., 1999; Acemoglu and Robinson, 2001), productivity and incomes (Hall and Jones, 1999), trade and capital flows (Mauro, 1995; Wei, 1997; Alfaro et al., 2008; Shleifer & Vishny, 1993; Wei, 2000; Levchenko, 2007; Dutt and Traca, 2010), financial sector development (La Porta et al., 1998), and education, health and income distribution (Kaufmann et al., 1999b; Chong and Calderón 1999a and 1999b; Rodrik, 1999). Moreover, all these studies agree that the North is endowed with much better institutions than the South, and that it is a source of comparative advantage (Levchenko, 2007).
Despite the increasing number of studies looking into causes and effects of institutional change, none has yet explored the link between FDI flows and institutional development and convergence. What we set out to do in this paper is the following: First, we explore whether bilateral FDI flows cause any institutional convergence (or divergence) between home and host countries. Secondly, we explore whether there are any difference between developed and developing country investments regarding their effects on institutional convergence dynamics. Third, we test whether North-South as opposed to South-South aggregate FDI flows have any heterogeneous institution-improving effect on host countries. The empirical result using a unique dataset on bilateral FDI flows among 134 countries during 1990-2009 suggests that the institutional development effects of bilateral FDI flows from developed to developing countries as well as those from developing to developing countries are not significant and are not any different from each other. In either case we do not find any significant convergence or divergence effect of FDI flows on the institutional distance between host and home countries. We also do not detect any significant effect of aggregated North-South FDI flows on host country institutions. In contrast, we find that aggregated South-South flows have a significantly negative effect on host country institutions. Furthermore, we find some evidence that South – South FDI flows might be harmful to institutional development in natural resource rich countries while the opposite is true for North – South flows. Last but not least, we discover that bilateral trade flows are much more influential in institutional convergence between countries.
The organization of the paper is as follows: The next section provides a brief literature review of FDI flows and institutional development. The third section introduces the methodology and data. The fourth section presents the empirical results and extensions. The final section concludes.
2. LITERATURE REVIEW
A large and growing number of papers in economics agree that institutions matter for long run development and growth and that the Northern countries have better and institutions than the Southern ones (Shleifer & Vishny, 1993; Mauro, 1995; Knack and Keefer, 1995; Wei, 1997; La Porta et al., 1998; Kaufmann et al., 1999b; Chong and Calderón 1999a and 1999b; Rodrik, 1999; Hall and Jones, 1999; Kaufmann et al., 1999; Wei, 2000; Acemoglu and Robinson, 2001; Levchenko, 2007; Levchenko, 2007; Alfaro et al., 2008; Dutt and Traca, 2010). Nevertheless, there is no consensus on the determinants of institutional differences across countries. There are broadly two views on the causes of institutional change, the “top down” and “bottom up” view (Easterly, 2008). While the former sees institutions as creations of political actors, the latter explains it as the product of historical, cultural and environmental factors with a high level of path-dependency. Naturally, these two views have different implications regarding the speed at which institutions can be changed. According to the top down view, it is fast and furious, and can be done at any time, once there is the will. The bottom up view, however, sees transition as “evolutionary rather than revolutionary (Easterly, 2008).

4
The academic work on the bottom-up view of institutions focuses, among others, on the effects of: a) natural resource base (Leite and Weidmann, 1999; Ades and Di Tella, 1999); b) economic openness (Laffont and N’Guessan, 1999; Ades and Di Tella, 1999, Rigobon and Rodrik, 2005); c) colonial institutions (Acemoglu et al., 2001, 2005) and slave trade (Nunn and Wanchekon, 2011); d) initial wealth (Engerman and Sokoloff, 2002); e) ethnic structures (Michalopoulos and Papaioannou, 2013) and ethnic fragmentation (Easterly and Levine, 1997); f) pre-colonial governance structures (Gennaioli and Rainer, 2007, Hariri, 2012); g) past rulers and governments (Caselli and Modelli, 2004).
In contrast, the top-down view explores the effects of domestic as well international actors on institutions. Among the international actors, World Bank as well as IMF, for example, have long advocated and pushed for top-down changes (usually based on the Washington Consensus) in member country institutions through their conditionality requirements. Shock therapy, as applied in former Soviet Union, is another example of the top-down approach. Furthermore, international investment treaties (BITs) as well as preferential trade agreements have also been instrumental in initiating tow-down institutional changes (Dahi and Demir, 2013; Thrasher and Gallagher, 2008; UNCTAD, 2011, 2012, 2013). It is also argued that BITs can work either as a substitute or complement to improving institutional quality (Neumayer and Spess, 2005; Busse et al., 2010; Yackee, 2009). Regional Unions, such as the European Union, has also been instrumental for leveling institutional heterogeneity through a centralized decision making mechanism whereby each member state is required to harmonize its institutions to those of existing members.
The implication of tow down approach is that there is a universal set of “correct” institutions (such as legal codes, government bureaucracy, transparency, financial system, etc.) that produce the best outcomes for long run development and growth. It is also overwhelmingly agreed that the frontier for these correct institutions is established by Western European and North American countries.4 The original as well as revised Washington Consensus was a byproduct of this belief. In contrast, bottom up economists are more prepared to accept that there might be a myriad of “correct” institutions and different societies may flourish using different institutions without ever converging to a standard norm (Rodrik, 1996, 2006, 2008). Furthermore, it is also possible that we may not even know what it is that we do not know and the only way to find it is through experimentation (Rodrik, 2004).
In global economic relations, developed countries as well as developed country bilateral and multilateral institutions5 are known to adopt the top-down approach with strong conditionality requirements in their economic exchanges with foreign governments. The legal barriers in developed countries also put pressure on foreign governments to synchronize their regulatory and institutional environment with those of home economies. For example, while the US Foreign Corrupt Practices Act of 1977 bans US firms from bribing foreign governments or businesses no such law exists in China or India.6 Likewise, 34 of the 40 countries that have adopted the OECD Anti-Bribery Convention of 1997 are OECD members.7 In addition to their direct effects, such legal conditions may have indirect effects as well by encouraging developing countries to adopt developed country standards if they hope to engage in economic exchange with the latter, including attracting FDI flows. In contrast, developing countries are reported to have lower conditionality requirements attached to their economic exchanges with other developing countries. Increasing rivalry between key emerging markets such as China and Brazil, and the West in having access to developing country economies, either for natural resources or market access might be one cause of this difference. The reported comparative advantage of developing country investors in their ability to operate in poor institutional
4 For example, legal code, based on British, French, German or Scandinavian has long been pointed out as a major source of institutional and economic development and comparative advantage. The same is true for the effects of other Western style institutions. 5 IMF and WB are usually considered Northern country institutions as developed countries control the majority of votes. 6 The violation of this act is punishable with imprisonment for up to five years, and a monetary fine of up to $100,000 for individuals, $2 million for companies. 7 “The OECD Anti-Bribery Convention establishes legally binding standards to criminalize bribery of foreign public officials in international business transactions and provides for a host of related measures that make this effective. It is the first and only international anti-corruption instrument focused on the ‘supply side’ of the bribery transaction. The 34 OECD member countries and six non-member countries - Argentina, Brazil, Bulgaria, Colombia, Russia, and South Africa - have adopted this Convention” (OECD, 2013).

5
environments may also be influential in this choice.8 Similar to supporters of the bottom-up view, China has also often justified its lack of conditionality requirements as respecting national sovereignty by not imposing its institutions on their partner governments.
As a result of this lack of conditionality, South-South economic exchanges, particularly those involving FDI flows, are singled out as undermining Western country efforts to improve the institutional settings of developing countries. China, for example, has frequently been accused of “neglecting human rights offences in recipient nations, supporting corrupt authoritarian regimes”, and undermining developed country efforts to improve developing country institutional quality and economic and political infrastructure (Strange et al., 2003; Economist, 2006; Graham-Harrison, 2009; Warmerdam, 2012; Mbaye, 2011).
In addition to the direct conditionality effect, another possible source of heterogeneous home country effect between the Northern and Southern investors is the demonstration channel. Accordingly, “the introduction of new modes of business practice in MNC subsidiaries can challenge the legitimacy of existing patterns and stimulate debates on better business practice in the host country” (Kwok and Tadesse, 2006). It is, however, also possible that increasing FDI may worsen the institutional quality of host countries. Robertson and Watson (2004) and Kwok and Tadesse (2006), for example, argue that FDI may result in more corruption in recipient countries by a) increasing the total supply of money (i.e. bribery potential), b) increasing the cut-throat competition by foreign investors for host country natural resources and market access. There may also be structural reasons why the effects of FDI flows may be different depending on the direction of flows. For example, higher level of institutional and cultural similarity, not to mention technological and preference structures (Amsden, 1987; Lall and Ghosh, 1989; Demir and Dahi, 2011; UNIDO, 2005), among Southern countries may affect the potential for institutional and governance spillovers, or convergence, from foreign firms.
Despite the wide-spread criticism of Southern governments, however, there is little empirical evidence supporting the view that Western countries through trade or financial flows, including aid, had any positive effect on host country institutions. On the contrary, there is some evidence showing that Western countries often rewarded “bad behavior” in developing countries. Easterly and Pfutze (2013), for example, convincingly show that the percentage of aid going to corrupt countries actually increased during the 1990s as they became more corrupt. Furthermore, developing country multilateral institutions such as the African Development Bank are found be favoring corrupt countries less in their financial aid programs than many developed countries, including the US, UK, and Japan (Easterly and Pfutze, 2008). Furthermore, there is also evidence showing that Western countries often intervened in developing countries for their own economic benefits. Berger et al. (2013), for example, provides strong evidence that the US used its political influence through CIA interventions in developing countries during the Cold War years to increase US export penetration in these economies. Regarding the example set by aid agencies themselves on issues such as transparency, many Western multilateral agencies are reported to perform worse than their developing country counterparts. For example, African Development Bank and Asian Development Bank are found to have a higher level of transparency in their operations than the Nordic Development Fund, European Bank for Reconstruction and Development, HellenicAid, IrishAid, Japan’s Ministry of Foreign Affairs, New Zealand Aid, Spanish Agency for International Cooperation, German Development Bank, or the IMF (Easterly and Pfutze, 2008).
Turning to the link between institutional development and FDI, majority of research has focused on the effects of the latter on the former. Overall, most work on this topic find that improving institutional development significantly increases FDI flows to those countries. This finding is also used to explain the so called Lucas Paradox, the fact that capital does not flow from rich to poor countries. Alfaro et al. (2008), for example, suggest that improving Peru’s institutional quality to that of Australia would quadruple foreign investment flows. Among institutional obstacles, corruption is pointed out as a major impediment to FDI inflows and works as an entry barrier (Shleifer & Vishny, 1993; Wei, 2000; Javorcik and Wei, 2009; Papaioannou, 2009; also see Kinda 2010).
8 Cuervo-Cazurra and Genc (2008), Darby et al. (2010); Aleksynska and Havrylchyk (2013) and Demir and Hu (2013) explore the idea that developing country investors might have a comparative advantage in dealing with challenging institutional and political environments thanks to their first-hand experience from their home countries.

6
Despite the controversy on the political arena there is only limited work done with regard to the effects of FDI flows on institutional development. In fact, Kwok and Tadesse (2006) is the only one we are aware of that considered the effect of FDI on institutional development, measured by corruption. They report that past aggregate FDI flows have a significantly negative effect on host-country corruption levels. We should note that their analysis is highly limited given the sample size of maximum 100 observations using aggregate FDI flows. Building on previous research what we set out in the current study is to explore the effect of FDI flows on institutional differences and whether they contribute to any institutional convergence (divergence) between home and host countries. If there is indeed an FDI effect on institutional development gaps and if this effect differs between developed vs. developing country investors, then South-South FDI flows may diminish incentives for developing countries to improve their institutional and political infrastructure. Moreover, developed country governments may no longer have the same leverage in persuading their counterparts in those countries for political reform. This, in turn, may delay the necessary reforms needed to improve sub-optimal institutional equilibrium in developing countries with detrimental long term negative effects on growth and development goals.
3. EMPIRICAL METHODOLOGY
In our analysis of the determinants of bilateral FDI flows, we estimate the following gravity model, adopted from Rose and van Wincoop (2001), Anderson and van Wincoop (2003), Rose (2004) and Baier and Bergstrand (2007)9. While it was developed for trade research, Gravity modeling of FDI and financial flows has also become common in empirical research (see, for example, Eaton and Tamura, 1994; Hausman and Fernandez-Arias, 2000; Portes et al., 2001; Wei, 2000). Our key hypothesis of interest is that FDI flows result in convergence (divergence) in institutions between home and host countries10
ijtijtiijtijt GravityFDIInstD 1110
(1)
where
ijt
DComNatColonyCurColComColLandLAdjLang
jiijitjtitijt
ijtijijijijijijij eeeeeeee
AreaAreaDistGDPGGDPPCGDPPCGravity
)()()()()()()()( 12111098765
43321 )*()()()()(
Here InstDijt is the level of institutional distance between host country i and home country j at time t, FDIijt is the real net FDI inflows from home country j to host country i at time t. (the higher it is the smaller the similarity). Time variant economic variables to reduce the risk of reverse causality and to account for lagged effects on institutional change. Gravity is the standard control variables employed in Gravity equations including the following:
Economic size and development level are proxied by (log) real per capita GDPs of country i and j (GDPPCi and GDPPCj). It is expected that as income increases it leads to better institutions. We also include real GDP growth (GDP Growth) of country i and j, to proxy for the effect of economic growth on institutional change.11
Demographic pressures (as well as market and labor force size) are proxied by (log) total population of country i and j (Populationi and Populationj). It is possible that increasing population size makes it more difficult and costly to improve institutional quality.
9 Bergstrand and Egger (2007) and Kleinert and Toubal (2010) provide a theoretical extension of the standard Gravity model of trade to FDI flows. 10 We should note that in panels with large cross section and short time period (as is the case in our dataset), fixed effects estimator may yield inconsistent results, known as the “incidental parameter problem” (Baltagi, 2001) 11 We have also experimented with including the land sizes of i and j.
7
The (log) (km) distance between i and j (Distance) captures information costs. It is possible that as distance increases institutional similarity would diminish since countries will have less know-how of each other. Regionalism might be another factor creating incentives for increasing harmonization of countries’ institutions as in the case of European Union.
Sharing a common language and a border may also work as a source institutional convergence. Hence we include a binary dummy variable equal to 1 if i and j share a common language, and 0 otherwise (Language), a binary variable equal to 1 if i and j share a common border, and 0 otherwise (Adj).
Being landlocked may increase country isolation and reduce spillovers from institutional changes in other countries or in other parts of the world. On the other hand, landlocked countries are dependent on building transportation, communication and therefore political networks with other countries for their survival and this may influence their institutional similarity to their economic partners. Thus we also include the number of landlocked countries in the country pair (0, 1, 2), Land locked.
The effect of colonial past on the institutional structures of developing countries is a highly contested and studied topic. To control for any such effects we include the following colony variables: a binary variable equal to 1 if i and j: had a common colonizer after 1945 (ComCol), are in a colonial relationship (CurCol), have ever had a colonial link (Colony).12
We also include a binary variable if i and j were the same country (ComNat) (as such they may capture part of the familiarity effect on the InstD variable).
We also include Dijt that is a vector of time and country fixed effects. ε represents the normally distributed error term capturing omitted other influences on trade.
In equation (1) γ1 is the key parameter of interest that we want to explore to determine whether FDI flows have any effect on institutional distance between two countries. In the benchmark model (using a panel structured as country-pair and time) we estimate the gravity equation using the OLS with country-pair robust standard errors and year fixed effects (to account for global changes in institutions).
Equation (1) however, assumes that bilateral investment flows have a homogenous effect on institutional (dis)similarities and generate convergence between home and host counties no matter what the development level of the countries in question and no matter what the direction of flows is. That is it fails to identify any non-linearities in the effect of FDI between two countries. The idea is that the effect of FDI on host country institutions and on the institutional distance between home and host countries may depend on the direction of flows that is South-South vs. North-South, as well as South-North or North-North.
If equation (1) is correct and we find a significantly negative γ1 coefficient, this suggests that FDI flows lead to convergence between home and host countries. This, however, does not tell much about whether or not this convergence is towards a higher end or lower end equilibrium, or whether it exists in each direction of FDI flows, namely South-South, South-North, North-South and North-North. If the critics are right then we should observe institutional convergence in North-South direction where the differences are the greatest and the flow goes from a high to a low institutionally developed country thus raising the standards in the South. We should also observe a similar development in South-South direction, representing lower-end equilibrium. If there is indeed a China effect on host country institutions in the South, this should be visible through a significant convergence effect among Southern countries. Thus, as a next step we divide the sample into four to explore any heterogeneity in the effect of FDI on institutional gap between two countries.
3.1 Data We carry out our empirical investigation using annual bilateral FDI flows data from the OECD and UNCTAD FDI databases as well as from individual country statistical offices for the period of 1990-2009. The sample selection is based on data availability. We merged the data from these three different sources using the following procedure. For FDI inflows and outflows to and from OECD members, we used the OECD dataset. For FDI flows from and to non-OECD member developing countries, we used the UNCTAD and/or individual country data. When there is discrepancy, among the three we gave the priority
12 We have also experimented with whether i and j have and have had a colonial relationship after 1945 (Col45).

8
first to OECD, then individual country data sources. The availability of data was the main constraint in country and time period selection.13 In the final dataset, we dropped those country pairs that had no data (zero and missing) for the full time period analyzed.
The final dataset is a panel of 38,898 country-year observations from 3,210 country pairs including 134 home and host countries. These 134 countries in the final sample account for 77% of all global FDI inflows, within the range of 61% in 2009 and 96% in 2002. Thus, this is one of the most comprehensive bilateral FDI datasets employed in the current literature. During this period the developing countries share in total sample FDI flows has been 24%. We also note that having a much more disaggregated and larger sample, limiting the possibility of multicollinearity and aggregation bias (Wooldridge, 2002; Yu, 2010). The full list of sample countries with observation numbers is in the appendix. The FDI data are expressed in current US dollars and we employ US GDP deflator from IFS to generate real FDI flows. Overall, we see in Figure 1 that the FDI flows to all directions are highly correlated.
<Insert Figure 1 Here>
The standard gravity variables are from CEPII, CIA’s World Factbook, and Rose (2004). The population and GDP data are from WDI, and, when missing, from IFS, Penn World Table (PWT 6.3), and United Nations statistics. In our investigation the North and South refers to developed and developing countries based on UNCTAD and WTO classification. The income and regional classifications are from the World Bank. The trade data are from IMF’s Direction of Trade database. The North includes Australia, Austria, Belgium, Canada, Switzerland, Cyprus, Germany, Denmark, Spain, Finland, France, Greece, Hong Kong, Ireland, Iceland, Israel, Italy, Japan, Luxemburg, Netherlands, Norway, New Zealand, Portugal, Sweden, UK, and USA. The South includes: Albania, Algeria, Angola, Argentina, Armenia, Azerbaijan, Bahamas, Bahrain, Bangladesh, Belarus, Bolivia, Botswana, Brazil, Brunei Darussalam, Bulgaria, Burkina Faso, Cameroon, Chile, China, Colombia, Congo (Rep.), Costa Rica, Cote d’Ivoire, Croatia, Cuba, Czech, Dominican Republic, Ecuador, Egypt, El Salvador, Estonia, Ethiopia, Gabon, Gambia, Ghana, Guatemala, Guinea, Guinea, Bissau, Guyana, Haiti, Honduras, Hungary, India, Indonesia, Iran, Iraq, Jamaica, Jordan, Kazakhstan, Kenya, Korea Republic, Kuwait, Latvia, Lebanon, Liberia, Libya, Lithuania, Madagascar, Malawi, Malaysia, Mali, Malta, Mexico, Moldova, Mongolia, Morocco, Mozambique, Myanmar, Namibia, Nicaragua, Niger, Nigeria, Oman, Pakistan, Panama, New Papua Guinea, Paraguay, Peru, Philippines, Poland, Qatar, Romania, Russian Federation, Saudi Arabia, Senegal, Sierra Leone, Singapore, Slovak Republic, Slovenia, South Africa, Sri Lanka, Sudan, Suriname, Syrian Arab Republic, Tanzania, Thailand, Togo, Trinidad and Tobago, Tunisia, Turkey, Uganda, Ukraine, Uruguay, Venezuela, Vietnam, Yemen, Zambia, and Zimbabwe.
Table 1 provides summary statistics for the variables used in the empirical analysis. While the sample includes large number of observations in all four directions, average level of FDI flows is the lowest in South-North ($27 million) and South-South ($34 million) directions and the highest in North-North direction ($1 billion). Overall, the sample is quite representative with a high and similar number of FDI and Institutional Distance observations in all directions. Table 2 presents summary statistics on FDI based on home and host country income levels. As expected, the largest flows, both observation and flows level wise, are between high-income OECD countries. The second highest flows occur between high-income OECD and middle income countries (both lower and upper middle income). Looking at low-income countries, the biggest investor group appears to be the high-income OECD countries. In contrast, middle income countries do not have much investment in low income countries. Overall, the data suggests that most of the South-South
13 When the data were in a non-us dollar currency, we used the annual average exchange rate from the IFS for converting to current dollar values. In addition FDI data present several challenges that may bias our results. 1) Reporting and measurement differences in data collection, and errors in reporting distort the data. This problem is more pronounced in South-South and North-South directions. 2) FDI flows in some cases are recorded only if they exceed a certain threshold level of equity ownership (i.e. 10%). 3) Exchange rate fluctuations cause different recordings of same flows (for a discussion, see UNCTAD, WIR2011:6). When there was an inconsistence between inflows and outflows, if the home and host countries are both upper income OECD members we used the host country data, if the host (home) country is non-upper income OECD then OECD member home (host) country data are used. If data are available from individual countries, we preferred these to UNCTAD or OECD data.
9
flows are clustered between upper-middle income countries with little action taking place with respect to low income and lower middle income countries.
Table 3 present presents summary statistics of FDI flows based on geographical location of home and host countries. We observe a high degree of regionalization across the world, with the exception of MENA region. Furthermore, there is a high level of clustering between and within North America and Europe regions. Asia also stands out as a major hub for both inflows and outflows FDI. Confirming regional trends published in other studies, Latin America receives most inflows from North America, Europe, and Asia. Likewise, Africa’s biggest investors are located in North America, Europe, and Asia.
<Insert Tables 1 - 3 Here>
The measurement of institutional development is no easy task. Acemoglu et al. (2001), among others, argued that institutional development encompasses overlapping economic and political institutions including the degree of development of government bureaucracy, level of corruption, law and order, property rights, civil institutions and democracy, etc. All these aspects of institutional development are arguably highly correlated with each other. In addition, there are other factors that may affect foreign investors’ decision to invest in a country including the security situation such as internal/external conflicts. The most comprehensive dataset that addresses all these aspects of institutional development for a majority of countries and for the longest time period is the one provided by the Political Risk Services named International Country Risk Guide (ICRG). Accordingly, the institutional quality using ICRG is measured using a composite index, which includes political, legal, and bureaucratic institutions, as well as ethnic tensions and corruption. More specifically, it consists of: government stability, socioeconomic conditions, investment profile, internal conflict, external conflict, corruption, military in politics, religion in politics, law and order, ethnic tensions, democratic accountability, and bureaucracy quality. It ranges between 0, and 100, the latter reflecting the best institutional environment and least riskiness. Unlike other institutional quality measures, ICRG rating has several advantages; first, it exhibits ample within country variation, enabling us to explore our research question. Second, it is reported since 1984 for a majority of countries, making it possible to utilize as many countries as possible within the FDI dataset. To measure institutional distance (apartness) we use the Kogut and Singh's (1988) method:
Institutional Distance
∑
where d indicates the dimensions of the index; Vd indicates the variance of the dth dimension; Instdit and Instdjt refer to the institutional quality index of order d for country i and j at time t. Figure 2 displays the evolution of average institutional distance in all four directions. As expected and providing support to the measurement methodology, the differences are lowest among developed country pairs and highest between developing and developed countries. The average institutional distance is 0.74 in North-North direction as opposed to 1.64 in South-South, 2.53 in North-South and 2.34 in South-North directions (Table 1). Likewise, the bilateral variation is significantly higher in North-South direction (1.81) and the lowest in North-North direction (0.64). Still the standard deviation is quite high among developing countries as well reaching 1.21 in South-South direction.14
<Insert Figure 2 Here>
The simple correlation coefficient between FDI flows and institutional distance is negative in all directions, suggesting a convergence effect yet is the highest and most significant in the North-South
14 The averages are for country pairs for which we have the FDI data for. Obviously, one may argue that the differences between developed and developing countries might be much higher if we take into account those country pairs where there are no observations for FDI flows, causing a censored dataset. Since the sample countries are the ones that managed to pass the threshold level of institutional barriers, the predicted effect of institutional differences might be biased downwards.

10
direction. Accordingly, it is -0.01 in South-South, -0.04*** in South-North, -0.08*** in North-South and -0.02* in North-North directions. Figure 3 below show the simple scatter diagrams of the relationship between these two variables. The diagram with whole sample suggests a negative yet weak relationship with a heavy clustering at the zero bound FDI flows. When we divide the sample into four directions, we again do not find a very significant relationship in North-North or, contrary to the criticisms discussed in previous section, in South-South directions. Yet, providing some support to the supporters of North-South integration, we find a comparatively stronger negative relationship in North-South and South-North directions. In the next section we explore whether there is indeed a causal relationship between FDI flows and institutional convergence between and within developed and developing county groups.
<Insert Figure 3 Here>
4. EMPIRICAL RESULTS
Table 4 presents benchmark regression results with robust standard errors (clustered by country pair). Column (1) presents the basic OLS results. Column (2) repeats (1) with the addition of year fixed effects to control for global trends in institutional changes and convergence. Colum (3) introduces country-pair fixed effects (which cause all other country-pair variables to drop from the regression equation). Column (4) addresses any omitted time-invariant host country fixed effects, and column (5) controls for both host and home country fixed effects. Column (5) is our benchmark specification as it controls for all observed and unobserved country specific effects, including differences in the definition of FDI across sample countries as well as cultural, time-invariant institutional and geographical characteristics, and natural resource endowments.
<Insert Table 4 Here >
While the regression results in columns (1) – (4) from Table 4 suggest that FDI flows have no significant effect on institutional differences across countries, column (5) suggests a different picture. Accordingly, once we control for home and host country fixed effects, FDI flows appear to have a significantly negative effect on institutional differences between countries and leads to institutional convergence. However, we should note that none of the other regression estimations including column (3) with country-pair fixed effects support this conclusion.
Regarding other variables of interest, coefficient estimates appear as expected and provide support to the specification and estimation methodology. First, we find that, independent of specification, increasing per capita incomes GDP growth rates in host and home countries significantly increase institutional convergence between two countries. Arguably, rising incomes and economic prosperity push both countries towards an optimal level of institutional development and convergence. Increasing population size is also found to generate convergence. We also find that countries that are landlocked or distant from each other experience divergence in their institutional development levels.
Regarding colonial past variables, coefficient estimates suggest that while those countries that have had a common colonizer after 1945 (ComCol) experience convergence, those that ever had a colonial relationship (Colony) or are currently in a colonial relationship (CurCol) face divergence. It appears that colonizing countries had a significant institutional footprint in their colonies as suggested by numerous other studies. In contrast, the same cannot be said about those countries that had or have any kind of colonial relationship. As expected, we also find that countries that were at one point the same country have significantly smaller institutional differences.
<Insert Table 5 Here >
Table 5 reports regression results based on Eq (1) after controlling for the direction of FDI flows to explore whether institutional effects of FDI are conditional on the development levels of home and host countries. In other words, we test if there is indeed a China effect on host country institutions and whether

11
developed country investment flows help achieve convergence in the South. We report regression results in Table 5 based on the specifications in columns (4) and (5) of Table 4 after controlling for host and home country fixed effects.
Looking at results in columns (1) – (8) we do not observe any strong evidence suggesting that the development level of home and host countries matter regarding the effect of FDI flows on institutional development gap across countries. While we find some evidence in column (1) suggesting institutional divergence in response to South-South FDI flows, this is not robust to the inclusion of both home and host country fixed effects in column (5). Furthermore, the positive and significant coefficient estimate for FDI flows in column (1) suggests the opposite of what the critiques of South – South FDI flows argue, which would imply convergence or no significant change in the low-end institutional development levels of two Southern countries. Overall, we find no evidence of a China effect of FDI flows on institutional differences across countries in the South. Furthermore, we do not detect any significant convergence effect of FDI flows from developed to developing countries. While the coefficient estimates for North-South and North-North flows in columns (3) – (4), and (7) – (8) are found to be negative, suggesting a convergence effect, none are statistically significant at conventional levels.
As in Table 4, the coefficient estimates from other control variables provide support to the validity of estimation methodology. We find that the GDP per capita of host country is not a significant determinant of bilateral institutional differences in South-South or North – North directions, reflecting the relative homogeneity of institutional development levels in each group. In contrast, it is found to be a significant determinant of institutional distance in South – North and North – South directions. Accordingly, in the South-North direction the higher the per capita income of the host country in the North the bigger is the institutional development gap with the Southern home country. As expected we find the opposite for North-South flows, that is the higher the income level in the South the smaller is the institutional differences it has with the North. In other words, increasing income levels in the South (North) leads to institutional convergence (divergence) in South-North (North – South) direction.
Likewise, GDP growth does not appear to have a significant effect on institutional differences between host and home countries in South - South and North – North directions. In contrast, consistent with the effect income levels, we find that increasing GDP growth in host (home) country is likely to moderate (worsen) institutional differences in South – North and North – South directions.
Countries that are landlocked, close in distance, and are neighbors appear to have more similar institutional development levels. We also find some evidence suggesting that colonial linkages, as well as having a shared past nationhood or current common language have a moderating effect on institutional structures across countries. Lastly, population size appears to be important determinant suggesting that countries that are similar in size are more likely to have similar institutions.
5. EXTENSIONS
5.1. Natural resource curse The effects of natural resources on institutional development (i.e. natural resource curse) have been discussed extensively in recent literature. Overall it has been shown that increasing dependence on natural resources has a negative effect on institutional development. Some of the channels through which this relationship holds include rentier state formation, which leaves little incentive to improve institutional quality thanks to the easy flow of rents from natural resource exports such as oil and minerals. Another possible channel includes the militarization of state structure and formation of authoritarian police states, which uses revenues from natural resource sectors to suppress popular public demands for improving institutional quality. Furthermore, it is often argued that increasing Chinese investment flows in Africa and elsewhere is mostly motivated by “resource grab”.15
15 For a discussion, see Warmerdam (2012) and Mbaye, (2011), Graham-Harrison (2009), Strange et al. (2003). Poelhekke and Ploeg (2013) also show that increasing natural resource dependence crowds out non-resource FDI flows.

12
Therefore we include a control variable Rents measured by the percentage share of natural resource rents in GDP to capture the effect of host country natural resource dependence on institutional differences across countries. We also include an interaction variable between FDI and Rents to test whether FDI flows affect countries with and without heavy dependence on natural resource rents differently. It is possible that either or both developed and developing country investors treat natural resource rich countries differently than the rest and demand less conditions attached to their investment flows. For example, China as well as UK may pressure a country such as Nigeria less than another developing country when it comes to their demands for institutional improvements, including the level of corruption.16
<Insert Table 6 here>
Table 6 reports regression results after including these two new variables. Column (1) presents results with home and host country fixed effects for the full sample. We find a significantly negative effect of FDI flows on institutional distance, i.e. implying convergence. Yet this effect disappears as the percentage of natural resource rents increase to the sample mean of 4.8%. Overall, it appears that there is indeed a natural resource curse causing host country institutions to diverge from home country institutions. Furthermore, FDI flows do appear to cause further divergence in countries with higher levels of natural resource dependence. In columns (2) – (5) we divide the sample to four directions and include home host country fixed effects. This time we fail to find any effect of FDI on institutional differences in any of the four directions. The effect of Rents also disappear in all but South – South direction. FDI flows also do not appear to have a significantly different effect on natural resource reach countries, either at the margins or in total as shown by the net effect in Table 6.17
However, country fixed effects are likely to remove any effect of Rents on institutions. Therefore, in columns (6) – (9) we repeat the same exercise without including any home or host country fixed effects. The results suggest that while South – North FDI flows may indeed have a positive convergence effect, we fail to find the same effect in any other direction. Yet, we confirm the presence of a NRC whereby countries with higher natural resource rent dependence are found to diverge from other country institutions, particularly in South – South and North – South direction. In contrast, Rents dependence is found to stimulate convergence among Northern countries. Furthermore, even though the marginal effect of Rents through FDI flows is found to be insignificant, except in North – North direction, the net effect of FDI flows is found to be significant and conditional on the level of Rents dependence in host countries. Accordingly, looking at the net effect of FDI at the mean value of natural resource dependence across sample countries we find that FDI flows cause divergence in South-South direction but convergence in South-North and North-South directions. The net effect appears to be insignificant in North-North direction. This finding provides some support to the supporters of North – South FDI flows. Accordingly, FDI flows from developed countries to natural resource rich developing countries appear to cause convergence to a high level of equilibrium in institutional development. 5.2. Bilateral versus total FDI flows The bilateral panel analysis in the previous section might be masking agglomeration effects caused by the total mass of FDI flows from the North and the South. It is possible that FDI flows from the North and the South as a whole might be more important in influencing institutional change in developing countries. For example, changes in OECD regulations including multilateral agreements on investments practices affect all of its members, most of which are Northern countries. Similarly, while there may not be a China effect per se, as our results so far suggests, the total sum of FDI flows from Southern countries as a whole may still affect institutional changes in the South. To test this hypothesis we pool bilateral FDI flows from the South and the
16 For example, it is reported that oil and gas industry has the highest bribery and corruption rate in the UK (Mason and Blackden, 2012). Also see Chazan (2010) for the case of Royal Dutch Shell that was fined $48 million in 2010 for bribing Nigerian customs officials. 17 As in previous tables, we also repeated the exercise using only host country fixed effects. Unreported results are similar to those reported here.

13
North to create an aggregate FDI flows panel in both directions. We also replace the institutional distance variable with the level of aggregate institutional development in host country.
In column (1) of Table 7 we present regression results after aggregating bilateral FDI flows. While we find a positive coefficient estimate suggesting a positive institutional development effect from FDI, it is statistically insignificant. In column (2) we repeat the same exercise after splitting the aggregate FDI flows into two that are FDI flows from the South and the North. In this case we find a significantly positive effect of FDI flows from the North to the rest of the world while no significant effect is detected for those from the South (though the coefficient estimate is negative). In column (3) we test whether there is any China effect by limiting the data to developing countries only and repeat the regression analysis of column (2). The results support the presence of a China effect and suggest that South-South FDI flows have a statistically significant negative effect on institutional development in host countries. North-South FDI flows, on the other hand, is found to have a positive but statistically insignificant effect. To make sure that these are not random effects we replicate column (3) in South-North and North-North directions by limiting the left hand side variable this time to only Northern countries. As expected we did not detect any significant institutional effect of South-North or North-North FDI flows on Northern country institutional development. In column (5) we repeat the exercises in columns (3) and (4) with full sample by introducing interaction variables for Northern and Southern countries. The results suggest a significantly negative institutional development effect of South-South flows while no such effect is detected in South-North or North-South directions. North-North flows, however, are found to have a significantly positive effect on institutional development, possibly supporting the institutional convergence hypothesis among developed countries.
<Insert Table 7 here>
In Table 8 we further extend the analysis of Table 7. First we test the natural resource curse hypothesis of section 5.1 to see if FDI flows have any differential effects in those countries that are rich in natural resources. Column (1) shows that aggregate FDI flows have a positive yet statistically insignificant effect even after controlling for the NRC. NRC variable, on the other hand, is found with the expected negative yet statistically insignificant coefficient estimate. In column (2) we interact FDI flows with the NRC variable yet again fail to detect any marginal or net effect at conventional statistical significance levels. In column (3) we split FDI flows from the South and the North and limit the sample of host countries to those in the South. The results are similar to those in Table 7 showing a significantly negative effect of South-South FDI flows on institutional development in the South while no significant effect is detected in North-South flows. Column (4) introduces an interaction term with the NRC and repeats the analysis as in column (3). The results shows a marginally positive effect of North-South flows on natural resource rich Southern countries despite the fact that the net effect remains negative and insignificant for South-South flows and positive and insignificant for North-South flows. In none of the regressions in columns (1)-(4) the NRC variable is significant at conventional levels. However, we should note that the regression exercise here includes host country fixed effects, which might be removing any fixed effect of NRC. When repeating the regressions in columns (1) – (4) without country fixed effects, we find the following (unreported) results: (i) countries that are more natural resource dependent have significantly (at 1% level) lower institutional development, (ii) the net effect of South – South FDI flows on natural resource rich countries’ institutions is insignificant, (iii) the net effect of North – South FDI flows on developing country institutions is significantly positive.
<Insert Table 8 here>
In column (5) we replace the aggregated bilateral FDI flows variable with the net FDI inflows variable from WDI to test if our earlier findings are robust to any measurement error because of missing or incomplete bilateral flows data. Arguably WDI data might be more complete as it reports net flows rather than bilateral flows which are subject to measurement, reporting and recording errors and include large number of missing or zero observations. Using this variable we still fail to find any significant effect of FDI flows though the sign turns out to be positive yet smaller in size than in Table 7. In column (6) we restrict the host countries to those in the South and this time find a negative though still statistically insignificant coefficient estimate. In column (7) we restrict the sample again to those in the South and use the aggregated bilateral FDI flows variable split into South and North as in column (3). Yet this time we limit the sample to

14
those observations where the aggregated FDI data are within the range of 100% deviation from the WDI data. The results support findings in column (3) as well as in Table 7 showing a significantly negative South-South effect and an insignificant but positive North-South effect. 5.3. Are all institutions equal? It is possible that FDI flows do not affect all aspects of institutional development equally. That is certain components of institutional quality such as corruption might respond more than others to FDI flows. One possible reason for this is the nature of conditions attached to investment flows, as well as investors’ ranking of their priorities for investment decisions. For example, the US and OECD countries have strict restrictions and legal requirements against bribing in host countries. Therefore we repeat the analysis in previous sections after replacing the institutional distance variable with the one including only four rather than all 12 sub-components: corruption, government stability, investment profile and law and order. The simple correlation coefficient between the full and reduced form distance variables is quite high, 0.82. Table 9 reports regressions results using the four-component distance variable and replicates Tables 4 and 5. The results are quite close to those before and once taking into account country fixed effects suggest no significant evidence that South-South flows are any different then North-South flows at any significant level.
<Insert Table 9 here>
Next, we repeat the same analysis in Table 10 but this time using aggregated bilateral FDI flows from the South and North and only for the level of corruption in host countries. Column (1) looks at the effect of total FDI flows on the level of corruption in host countries (higher number signals lower corruption) and finds a positive yet insignificant effect. Column (2) divides the FDI inflows into South and North based on country of origin (i.e. home country) as before, yet we again do not detect any significant effect of FDI flows from either source. In column (3) we restrict host countries with those in the South (World – South) and this time find a negative yet only marginally significant effect from South-South FDI flows. North-South flows appear with a positive yet insignificant effect. In column (4) this time we restrict the host countries with those in the North (World – North) yet find no significant effect of either North-North or South-North flows. Column (5), rather than dividing the sample into sub-groups, introduces a dummy variable approach by identifying host countries as South or North. Thus, the interaction with FDI flows from the South and North of those with the host country dummies of South and North yields sub-group effects. The results are again very similar to those from columns (2) – (4) showing no significant effect of FDI flows from any of the directions except for South-South flows, which appear with a negative and marginally significant coefficient.
<Insert Table 10 here> 5.4. Bilateral trade flows and institutional convergence Bilateral trade flows can also work as a substitute for investment flows. According to option-pricing models, for example, increasing host country risk may deter foreign firms’ investment and growth as they postpone their entry or expansion decisions (Campa, 1993). Conversely, increasing risks may increase foreign firms’ entry and growth as risk-averse foreign firms substitute foreign production for exports (Cushman, 1985; Goldberg and Kolstad, 1995). Accordingly, multinationals can substitute foreign capital for decreasing exports in response to increasing risk. Furthermore, increasing trade integration might be more effective in harmonizing institutional structures between two countries than FDI flows. Increasing regionalization as well as preferential trade agreements may also be instrumental in this change. The Customs Union agreement between Turkey and European Union, for example, has led to a significant increase in trade flows while facilitating harmonization of institutional framework in Turkey. Thus, in table 11 we substitute bilateral trade volume for FDI to test whether bilateral trade integration has any effect on bilateral institutional differences and replicate the regression analysis of Table 5. According to coefficient estimates we find evidence showing that trade flows are much more instrumental for institutional change than FDI flows. Accordingly, we find that bilateral trade flows result in convergence in South – South, North – South, and North – North directions. Yet we fail to find any significant effect in South – North direction. If there is indeed a China

15
effect, it appears that the effect manifests itself more through trade flows than long term investment flows. Other control variables came out to be consistent with those from Tables 4 and 5.
<Insert Table 11 here> 6. CONCLUSIONS
Global FDI flows have increased significantly since 1990s. FDI flows to and from developing countries have experienced the largest increase during this period. While many developing countries saw the increasing investment flows from other developing countries as a positive development, many economists and policy makers in developed countries have raised concerns regarding the institutional effects of developing country investments in the global South. Particularly, the lack of conditionality and weaker institutional quality demands of Southern investors are blamed for undermining developed country efforts to improve institutional landscape of Southern countries. China, for example, is often accused of encouraging “bad behavior” through its increasing investment and trade orientation in developing countries. In this paper we provide an empirical analysis of the institutional effects of long term investment flows in four directions: South – South, South – North, North – South, and North – North. The question we explore is to test whether bilateral FDI flows in any of these four directions have any differential effect on institutional convergence (divergence) between home and host economies. The empirical results using bilateral FDI flows between 134 countries for the period of 1990 – 2009 suggest that the institutional development effects of bilateral FDI flows from developed to developing countries as well as those from developing to developing countries are not significant and are not any different from each other. In either case we do not find any significant convergence or divergence effect of FDI flows on the institutional distance between host and home countries. We also fail to find any significant effect of pooled North-South FDI flows on host country institutions. In contrast, we find that pooled South-South FDI flows have a significantly negative effect on host country institutions. Furthermore, we find some evidence South – South FDI flows might be harmful to institutional development in natural resource rich countries while the opposite is true for North – South flows. Last but not least we discover that bilateral trade flows are much more influential in institutional convergence between countries.

16
REFERENCES
Acemoglu, D., Johnson, S. & Robinson, J.A. 2001. "The Colonial Origins of Comparative Development: An Empirical Investigation," American Economic Review, 91(5), p. 1369-1401.
Acemoglu, D., Johnson, S., Robinson, J., 2005. Institutions as the fundamental cause of long-run growth. In: Aghion, P., Durlauf, S. (Eds.), Handbook of Economic Growth, vol. 1A. Elsevier B.V., pp. 385–472.
Ades, A. and DiTella, R. 1999. “Competition and Corruption.” American Economic Review. 89 (4): 982-993.
Aitken, B.J. and Harrison, A.E. (1999) ‘Do domestic firms benefit from direct foreign investment? Evidence from Venezuela’, American Economic Review 89(3): 605–618.
Aleksynska, M. and Havrylchyk, O. 2013. FDI from the south: The role of institutional distance and natural resources European Journal of Political Economy 29 (2013) 38–53
Alfaro, L., Kalemli-Ozcan, S., Volosovych, V., 2008. Why doesn't capital flow from rich to poor countries? An empirical investigation. The Review of Economics and Statistics 90, 347–368.
Ali, Fathi; Fiess, Norbert; MacDonald, Ronald, 2011, Economic Inquiry, January 2011, v. 49,iss. 1, pp. 289-302.
Almeida, R., 2007. The labor market effects of foreign owned firms, Journal of International Economics 72, 75-96.
Amsden, A.H. 1980. The industry characteristics of intra-third world trade in manufactures. Economic Development and Cultural Change 29(1), 1–19.
Amsden, A. H. 1987. The Directionality of Trade: Historical Perspective and Overview. In World Bank Symposium Exports of Developing Countries: How Direction Affects Performance. O. Havrylyshyn (ed.), pp. 123--138, World Bank: Washington D.C.
Anderson, J.E., and van Wincoop, E. 2003. Gravity with gravitas: a solution to the border puzzle. American Economic Review 93(1), 170–192.
Arnold, J.M., Javorcik, B.S., 2009. Gifted kids or pushy parents? Foreign direct investment and plant productivity in Indonesia. Journal of International Economics 79, 42-53.
Baier, S.L and Bergstrand, J.H. 2007. Do free trade agreements actually increase members’ international trade? Journal of International Economics 71, 72–95.
Baltagi B. (2001). Econometric Analysis of Panel Data
Bergstrand, J.H., and Egger, P. (2007). A Knowledge-and_Physical-Capital Model of International Trade Flows, Foreign Direct Investment, and Multinational Enterprises. Journal of International Economics 73, 278-308.
Busse, M., J. Königer and P. Nunnenkamp (2010). FDI Promotion through Bilateral Investment Treaties: More Than a Bit? Review of World Economics 146 (1)
Campa, J.M., 1993. Entry by foreign firms in the United States under exchange rate uncertainty. The Review of Economics and Statistics 75(4), 614-622.
Caselli, F. and Morelli, M. (2004). “Bad Politicians.” Journal of Public Economics, 88: 3– 4, pp. 759 – 82.
Chazan, G. 2012. Oil and gas has highest bribery rate. Financial Times, June 15. http://www.ft.com/cms/s/0/c84ead24-ce7e-11e1-bc0c-00144feabdc0.html).
Chong, A. and Calderón, C. 1999a. “Institutional Quality and Income Distribution.” Economic Development and Cultural Change. Forthcoming

17
Chong, A. and Calderón, C. 1999b. “Institutional Quality and Poverty Measures in a Cross-section of Countries.” Economics of Governance. Forthcoming.
Cuervo-Cazurra, A. and Genc, M. 2008. Transforming disadvantages into advantages: developing-country MNEs in the least developed countries Journal of International Business Studies 39, 957–979
Cuervo-Cazurra, A. 2008. The effectiveness of laws against bribery abroad. Journal of International Business Studies, 39(4): 634–651.
Cushman, D., 1985. Real exchange rate risk, expectations, and the level of direct investment. The Review of Economics and Statistics 67, 297-308.
Darby, J., Desbordes, R., Wooton, I., 2009. Does public governance always matter? How experience of poor institutional quality influences FDI to the South. CEPR Discussion Paper 7533. Centre for Economic Policy Research, London.
Demir, F., and Dahi, O.S. 2011. Asymmetric effects of financial development on South–South and South–North trade: Panel data evidence from emerging markets. Journal of Development Economics 94, 139–149.
Demir, F. and Hu, C. 2013. Institutional Differences and Direction of Bilateral FDI Flows: Are South-South Flows any Different than the Rest? Working Paper, University of Oklahoma.
Desai, M.A., Foley, C.F., Forbes, K.J., 2008. Financial constraints and growth: Multinational and local firm responses to currency depreciations. The Review of Financial Studies 21(6), 2857-88.
Dutt, P. and Traca, D. 2010. Corruption and Bilateral Trade Flows: Extortion or Evasion. The Review of Economics and Statistics, 92(4): 843–860
Easterly, W. 2008. Design and Reform of Institutions in LDCs and Transition Economies. Institutions: Top Down or Bottom Up?American Economic Review: Papers & Proceedings 2008, 98:2, 95–99.
Easterly, W. and Levine, R. 1997. “Africa’s Growth Tragedy: Policies and Ethnic Divisions.”Quarterly Journal of Economics. 62: 1203-1250
Eaton, J. and A. Tamura (1994), ‘Bilateralism and Regionalism in Japanese and US Trade and Direct Foreign Investment Patterns’, Journal of Japanese and International Economies, 8, 4, 478–510.
Economist, Africa and China: African heads of state gather for a summit in China. Nov 3rd. http://www.economist.com/node/8126261/print?story_id=8126261
Engerman, S. L., and Sokoloff, K. L. (2002). “Factor endowments, inequality, and paths of development among new world economics” (No. w9259). National Bureau of Economic Research.
Gennaioli, N., and I. Rainer (2007): “The Modern Impact of Precolonial Centralization in Africa,” Journal of Economic Growth, 12 (3), 185–234.
Goldberg, L.S., Kolstad, C.D., 1995. Foreign direct investment, exchange rate variability and demand uncertainty. International Economic Review 36(4), 371-394.
Graham-Harrison, E. 2009. China trade outweighs corruption fears for Africa. Reuters. http://www.reuters.com/article/2009/11/05/businesspro-us-china-africa-corruption-a-idUSTRE5A44I220091105
Guerin, S.S. (2006) The Role of Geography in Financial and Economic Integration: A Comparative Analysis of Foreign Direct Investment, Trade and Portfolio Investment Flows. The World Economy Volume 29, Issue 2, pages 189–209, February 2006
Guerin, S.S. and Manzocchi, S. 2006. When FDI Flows from Rich to Poor Countries: Do democracy and economic reform matter? CEPS Working Document No. 251/October 2006
18
Haddad, M. and Harrison, A. (1993), Are There Positive Spillovers from Direct Foreign Investment? Evidence from Panel Data for Morocco," Journal of Development Economics, 42(1), 51-74.
Hall, R. and Jones, C. (1999), “Why Do Some Countries Produce So Much More Output per Worker than Others”, Quarterly Journal of Economics, 114, 83–116.
Hariri, J. G. (2012). “The Autocratic Legacy of Early Statehood.” American Political Science Review, 106(3), 471-494.
Haskel, J., Pereira, S., and Slaughter, M. (2007), Does Inward Foreign Direct Investment Boost the Productivity of Domestic Firms?" Review of Economics and Statistics, 89(3), 482- 496.
Hausman, R. and E. Fernandez-Arias (2000), ‘Foreign Direct Investment: Good Cholesterol?’ Working Paper 417 (Inter-American Development Bank).
Huttunen, K., 2007. The effect of foreign acquisition on employment and wages: evidence from Finnish establishments. The Review of Economics and Statistics 89(3), 497–509.
Javorcik, B. (2004), Does Foreign Direct Investment Increase the Productivity of Domestic Firms? In Search of Spillovers through Backward Linkages," American Economic Review, 94(3), 605-627.
Kaufmann, D., Kraay, A. and Zoido-Lobato´n, P. (1999) Governance Matters, World Bank Research Paper No. 2196. The World Bank: Washington, DC.
Kinda, T. 2010. Investment climate and FDI in developing countries: firm-level evidence. World Development 38 (4) 498-153.
Kleinert, J., and Toubal, F. (2010) Gravity for FDI, Review of International Economics, 18(1), 1013.
Knack S, Keefer P (1995) Institutions and economic performance: cross-country tests using alternative institutional measures. Economics and Politics 7(3):207–227
Kogut, B., and Singh, H. (1988). The Effect of National Culture on the Choice of Entry Mode, Journal of Internatiional Business Studies 19, 411-432.
Kwok, C.C., and Tadesse, S. 2006. The MNC as an agent of change for host-country institutions: FDI and corruption. Journal of International Business Studies (2006) 37, 767–785
La Porta, R., Lopez de Silanes, F., Shleifer, A. and Vishny, R. (1997) ‘Trust in large organizations’, American Economic Review Papers and Proceedings 87(May): 333–338.
La Porta, R., Lopez-de-Silanes, F. Shleifer, A. et al. 1998. “Law and Finance.” Journal of Political Economy. 106: 1113-1155.
Laffont, J.J. and N’Guessan, T. 1999. “Competition and Corruption in an Agency Relationship.” Journal of Economic Development. 60: 271-295.
Lall, S., Ray, A., Ghosh, S., 1989. The determinants and promotion of south-south trade in manufactured products, in: Ventura, Davis, V. (Ed.), South-South Trade Trends, Issues, and Obstacles to Its Growth. Praeger Publishers, New York.
Leite, C. and Weidmann, J. 1999. “Does Mother Nature Corrupt? Natural Resources,Corruption, and Economic Growth.” IMF Working Paper 99/85. Washington, DC,United States: International Monetary Fund
Mason, R. and Blackden, R. 2010. Shell to pay $48m Nigerian bribe fine. The Telegraph. November 4.http://www.telegraph.co.uk/finance/newsbysector/energy/oilandgas/8111277/Shell-to-pay-48m-Nigerian-bribe-fine.html
Mauro, P. (1997) ‘The Effects of Corruption on Growth Investment, and Government Expenditure: A Cross-Country Analysis’, in K.A. Elliott (ed.) Corruption and the Global Economy, Institute for International Economics, Washington DC, pp: 83–107.

19
Mauro, P. 1995. “Corruption and Growth.” Quarterly Journal of Economics. 110 (3):681-712.
Mbaye, S. 2011. Africa will not put up with a colonialist China. The Guardian. http://www.theguardian.com/commentisfree/2011/feb/07/china-exploitation-africa-industry
Michalopoulos, S. and Papaioannou, E. (2013). “Pre-colonial Ethnic Institutions and Contemporary African Development.” Econometrica, 81: 113–152.
Naím, M. 2007. Rogue Aid. (Editor in chief) Foreign Policy. March 1. http://www.foreignpolicy.com/articles/2007/02/14/rogue_aid
Navaretti, G.B., Turrini, A., Checchi, D., 2003. Adjusting Labor demand: multinational versus national firms: a cross-European analysis, Journal of European Economic Association, 1,708-719.
Neumayer, E. and L. Spess (2005). Do Bilateral Investment Treaties Increase Foreign Direct Investment to Developing Countries? World Development 33 (10).
Nunn, N. and Wantchekon, L. 2011. “The Slave Trade and the Origins of Mistrust in Africa.” American Economic Review, 101: 3221- 3252.
OECD, 2013. http://www.oecd.org/corruption/oecdantibriberyconvention.htm
Peter, K.S., Svejnar, J. and Terrell, K. 2012. Foreign Investment, Corporate Ownership, and Development: Are Firms in Emerging Markets Catching Up to the World Standard? Review of Economics and Statistics 2012 94:4, 981-999
Poelhekke, S. and Ploeg, van der F. 2013. Do Natural Resources Attract Nonresource FDI? Review of Economics and Statistics 95:3, 1047-1065.
Portes, R. and H. Rey (2000), ‘The Determinants of Cross-border Equity Flows’, CEPR Discussion Paper 2225 (London).
Portes, R., H. Rey and Y. Oh (2001), ‘Information and Capital Flows: The Determinants of Transaction in Financial Assets’, European Economic Review, 45, 4–6, 783–96.
Rigobon, R., and Rodrik, D. 2005. Rule of law, democracy, openness, and income Estimating the interrelationships. Economics of Transition Volume 13, Issue 3, pages 533–564, July 2005
Robertson, C.J. and Watson, A. (2004) ‘Corruption and change: the impact of foreign direct investment’, Strategic Management Journal 25(4): 385–396.
Rodrik, D. 1996. “Understanding Economic Policy Reform.” Journal of Economic Literature, 34(1): 9-41.
Rodrik, D. 1999. “Democracies Pay Higher Wages.” Quarterly Journal of Economics 64: 707-738.
Rodrik, D. 2004. Industrial Policy for the Twenty-First Century. J.F. Kennedy School of Government Working Paper series RWP04-047. Harward University.
Rodrik, D. (2006). Goodbye Financial Consensus, Hello Washington Confusion? A Review of the World Bank’s Economic Growth in the 1990s.” Journal of Economic Literature, 44: 973-987.
Rodrik, D. 2008. Second-Best Institutions. NBER Working paper 14050.
Rose, A., and van Wincoop, E. 2001. National money as a barrier to international trade: the real case for currency union. American Economics Review 91(2), 386–390.
Rose, A.K. 2004. Do we really know that the WTO increases trade? American Economic Review 94(1), 98–114.
Shleifer, A. and Vishny, R. 1993. “Corruption.” Quarterly Journal of Economics.108: 599-617.
Strange, A., Parks, B., Tierney, M.J., Fuchs, A., Dreher, A., and Ramachandran, V. 2003. China’s Development Finance to Africa: A Media-Based Approach to Data Collection. Center for Global

20
Development, Working paper 323. http://www.cgdev.org/sites/default/files/chinese-development-finance-africa_0.pdf
Thrasher R. D. and Gallagher, K. 2008. 21st Century Trade Agreements: Implications for Long-Run Development Policy, The Pardee Papers, No. 2. Boston University.
UNCTAD, 2011, World Investment Report, UNCTAD: Geneva.
UNCTAD, 2012, World Investment Report, UNCTAD: Geneva.
UNCTAD, 2013, World Investment Report, UNCTAD: Geneva.
UNIDO, 2005. Industrial Development, Trade and Poverty Alleviation through South-South Cooperation. U.N.: New York.
Warmerdam, W. 2012. Is China a Liberal Internationalist?The Chinese Journal of International Politics, Vol. 5, 2012, 201–243.
Wei, S. J. 2000a. How taxing is corruption on international investors? The Review of Economic and Statistics, 82(1): 1–11.
Wei, S. 2000b “Local Corruption and Global Capital Flows.”Brookings Papers on Economic Activity 2: 303–46.
World Bank (2011) Global Development Horizons 2011 Multipolarity: The New Global Economy, The World Bank, Washington D.C.
World Bank. 2013. World Development Indicators. Online Database.
Yackee, J. (2009). Do BITs Really Work? Revisiting the Empirical Link between Investment Treaties and Foreign Direct Investment. In: K.P. Sauvant and L.E. Sachs (eds.), The Effect of Treaties on Foreign Direct Investment: Bilateral Investment Treaties, Double Taxation Treaties, and Investment Flows. Oxford: Oxford University Press. 379-394.
Yasar, M., Paul, C.J.M., 2009. Size and foreign ownership effects on productivity and efficiency: An analysis of Turkish motor vehicle and parts plans. Review of Development Economics 13(4), 576-591.
Yeyati, E.L. and Panizza, U. 2007. Ernesto Stein The cyclical nature of North-South FDI flows Journal of International Money and Finance 26 (2007) 104e130
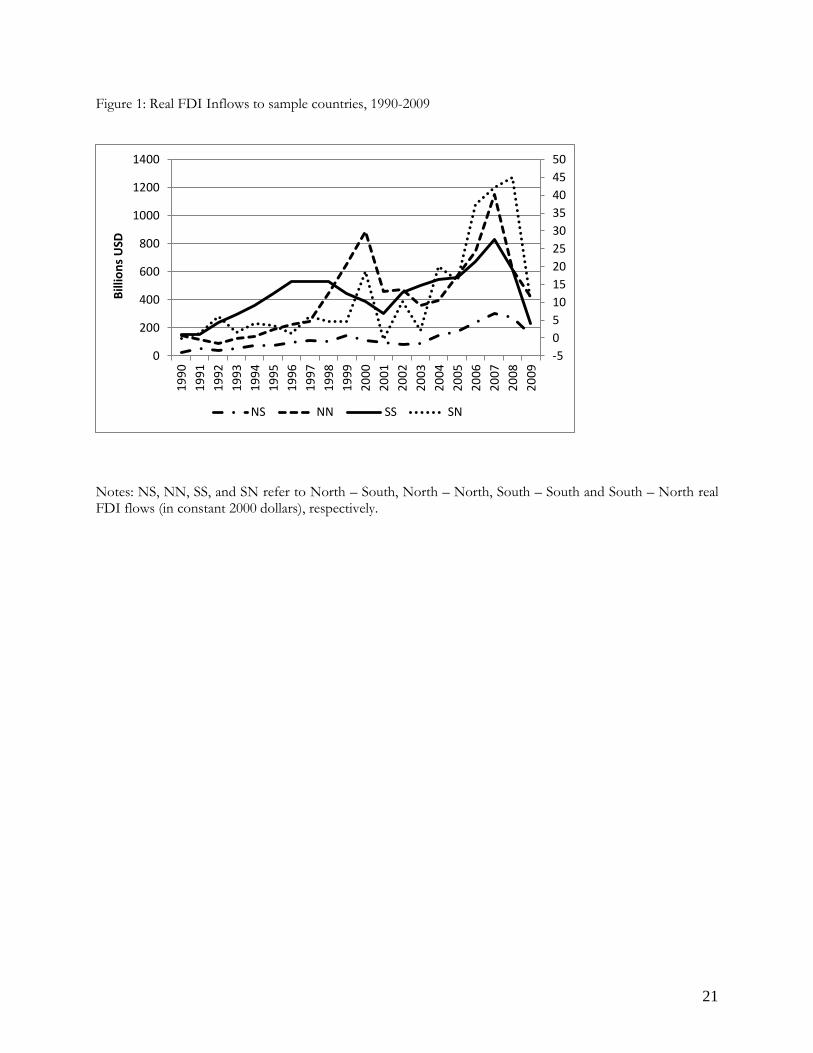
21
Figure 1: Real FDI Inflows to sample countries, 1990-2009
Notes: NS, NN, SS, and SN refer to North – South, North – North, South – South and South – North real FDI flows (in constant 2000 dollars), respectively.
-5
0
5
10
15
20
25
30
35
40
45
50
0
200
400
600
800
1000
1200
1400
19
90
19
91
19
92
19
93
19
94
19
95
19
96
19
97
19
98
19
99
20
00
20
01
20
02
20
03
20
04
20
05
20
06
20
07
20
08
20
09
Bill
ion
s U
SD
NS NN SS SN

22
Figure 2: Institutional distance
Notes: SS, SN NS, and NN, refer to South – South and South – North, North – South, and North – North, institutional distance using the Kogut and Singh's (1988) methodology, respectively.
0
0.5
1
1.5
2
2.5
3
3.5
4
4.51
99
0
19
91
19
92
19
93
19
94
19
95
19
96
19
97
19
98
19
99
20
00
20
01
20
02
20
03
20
04
20
05
20
06
20
07
20
08
20
09
SS SN NS NN

23
Figure 3: FDI flows and Institutional change
Notes: Scatter diagrams plot the Kogut and Singh's (1988) institutional distance variable with bilateral real FDI flows, in full sample as well as sub-samples based on four directions.

24
Table 1: Summary Statistics
Variable Obs Mean Std. Dev
Min Max
FDIij 36,081 298 2,255 -47,911 110,915
South-South 6,738 34 233 -1,008 5,723
South-North 8,274 27 309 -8,108 9,836
North-South 13,132 171 943 -13,690 28,513
North-North 7,937 1,013 4,563 -47,911 110,915
InstDij 36,081 1.924 1.654 0.009 18.867
South-South 6,738 1.643 1.210 0.014 13.416
South-North 8,274 2.337 1.723 0.029 18.867
North-South 13,132 2.525 1.814 0.095 18.867
North-North 7,937 0.740 0.639 0.009 6.090
ln GDPPCi 36,081 8.868 1.364 4.131 10.944
ln GDPPCj 36,081 9.242 1.272 4.131 10.944
ln Populationi 36,081 16.782 1.624 12.461 20.986
ln Populationj 36,081 16.780 1.648 12.461 20.986
GDP growthi 36,081 3.750 3.879 -51.031 106.280
GDP growthj 36,081 3.443 3.746 -51.031 106.280
ln Bilateral tradeij 51,237 5.961 2.350 0 13.089
Land locked 36,081 0.233 0.452 0 2
Ln Distance 36,081 8.286 1.013 4.088 9.901
Language 36,081 0.112 0.315 0 1
Adj 36,081 0.052 0.222 0 1
Colony 36,081 0.062 0.241 0 1
Comcol 36,081 0.010 0.098 0 1
Curcol 36,081 0.000 0.018 0 1
ComNat 36,081 0.016 0.124 0 1
Rentsi 35,693 4.838 10.635 0 218.886
Notes: FDI is real FDI inflows in millions USD from country j to country i. GDPPCi and GDPPCj are the (log) real GDP per capita in country i and j, Populationi and Populationj are (log) total populations of country i and j; GDP Growthi and GDP Growthj is real GDP growth of country i and j; Land locked is the number of landlocked countries (0, 1, or 2); Bilateral Trade is (log) total real bilateral trade in million USD between i and j; Distance is the (log) distance between the i and j; Language is a binary dummy variable equal to 1 if i and j share a common language, and 0 otherwise; Adj is a binary variable equal to 1 if i and j share a common border, and 0 otherwise. Colony, ComCol , CurCol, each is a binary variable equal to 1 if i and j have ever had a colonial link, had a common colonizer after 1945, and are in a colonial relationship, respectively. ComNat is a binary variable if i and j were the same country, Rents refer to the percentage share of natural resource rents in host country GDP.
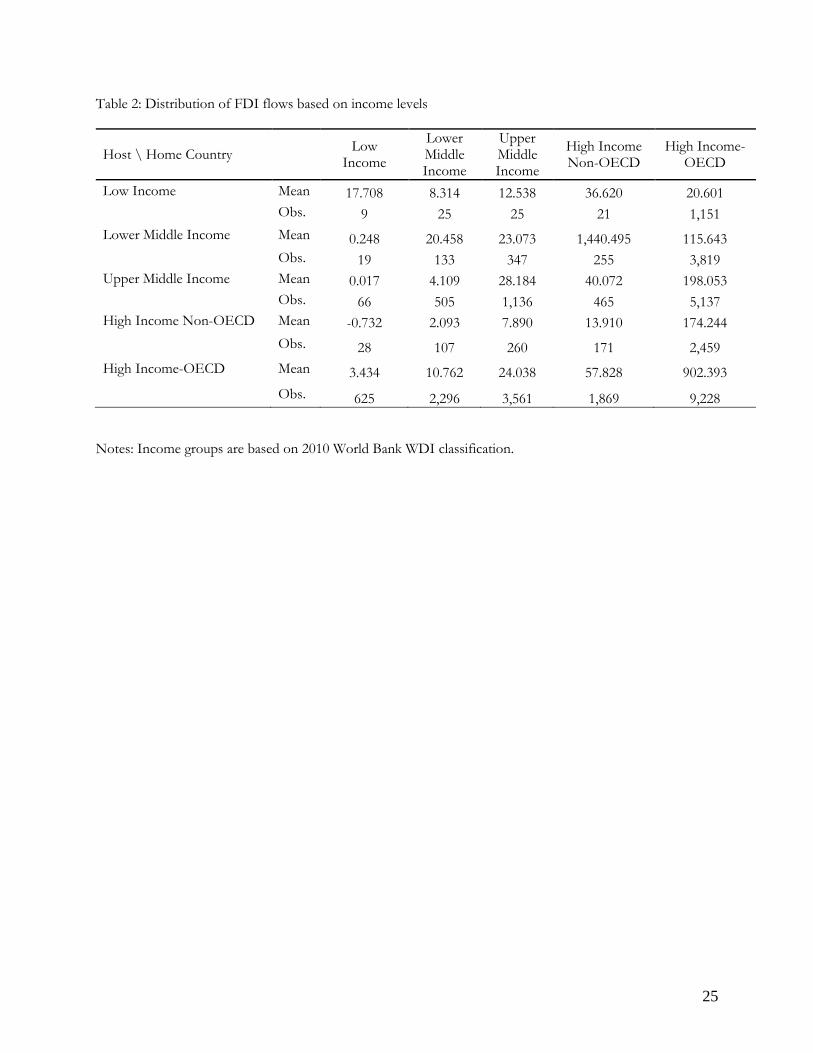
25
Table 2: Distribution of FDI flows based on income levels
Host \ Home Country Low
Income
Lower Middle Income
Upper Middle Income
High Income Non-OECD
High Income- OECD
Low Income Mean 17.708 8.314 12.538 36.620 20.601
Obs. 9 25 25 21 1,151
Lower Middle Income Mean 0.248 20.458 23.073 1,440.495 115.643
Obs. 19 133 347 255 3,819
Upper Middle Income Mean 0.017 4.109 28.184 40.072 198.053
Obs. 66 505 1,136 465 5,137
High Income Non-OECD Mean -0.732 2.093 7.890 13.910 174.244
Obs. 28 107 260 171 2,459
High Income-OECD Mean 3.434 10.762 24.038 57.828 902.393
Obs. 625 2,296 3,561 1,869 9,228
Notes: Income groups are based on 2010 World Bank WDI classification.

26
Table 3: Distribution of FDI flows based on geographical location
Host/Home Country Europe MENA Latin
America Asia
North America
Africa Oceania
Europe Mean 453.116 3.083 16.470 40.002 660.575 11.853 61.835
Obs. 10,160 209 1,077 3,800 1,466 1,139 538
MENA Mean 51.572 5.276 0.000 5.840 13.860 1.588 0.000
Obs. 263 5 0.000 43 26 12 0
Latin America Mean 171.639 0.000 26.537 134.713 394.690 69.550 56.795
Obs. 1,474 0 437 180 320 19 20
Asia Mean 98.311 0.000 1.784 473.818 781.845 3.457 40.627
Obs. 4,127 0 77 1,352 417 100 209
North America Mean 1,169.661 -0.871 12.497 429.319 1,433.312 0.198 787.762
Obs. 1,666 24 278 639 461 137 96
Africa Mean 63.239 1.332 0.000 32.826 114.051 16.943 13.199
Obs. 1,760 3 0 125 198 22 12
Oceania Mean 176.799 0.000 0.311 162.398 519.647 20.682 464.632
Obs. 401 0 11 236 101 12 65
Notes: Geographical regions are based on World Bank’s WDI classification.
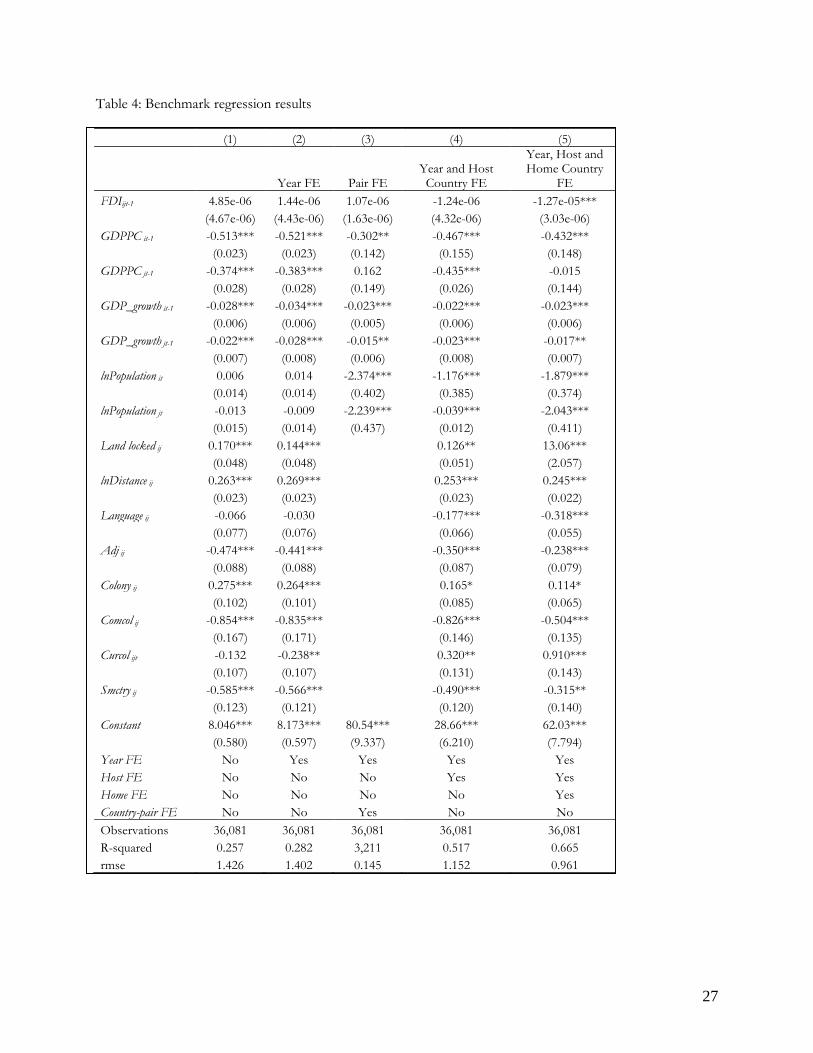
27
Table 4: Benchmark regression results
(1) (2) (3) (4) (5)
Year FE Pair FE
Year and Host Country FE
Year, Host and Home Country
FE
FDIijt-1 4.85e-06 1.44e-06 1.07e-06 -1.24e-06 -1.27e-05***
(4.67e-06) (4.43e-06) (1.63e-06) (4.32e-06) (3.03e-06)
GDPPC it-1 -0.513*** -0.521*** -0.302** -0.467*** -0.432***
(0.023) (0.023) (0.142) (0.155) (0.148)
GDPPC jt-1 -0.374*** -0.383*** 0.162 -0.435*** -0.015
(0.028) (0.028) (0.149) (0.026) (0.144)
GDP_growth it-1 -0.028*** -0.034*** -0.023*** -0.022*** -0.023***
(0.006) (0.006) (0.005) (0.006) (0.006)
GDP_growth jt-1 -0.022*** -0.028*** -0.015** -0.023*** -0.017**
(0.007) (0.008) (0.006) (0.008) (0.007)
lnPopulation it 0.006 0.014 -2.374*** -1.176*** -1.879***
(0.014) (0.014) (0.402) (0.385) (0.374)
lnPopulation jt -0.013 -0.009 -2.239*** -0.039*** -2.043***
(0.015) (0.014) (0.437) (0.012) (0.411)
Land locked ij 0.170*** 0.144***
0.126** 13.06***
(0.048) (0.048)
(0.051) (2.057)
lnDistance ij 0.263*** 0.269***
0.253*** 0.245***
(0.023) (0.023)
(0.023) (0.022)
Language ij -0.066 -0.030
-0.177*** -0.318***
(0.077) (0.076)
(0.066) (0.055)
Adj ij -0.474*** -0.441***
-0.350*** -0.238***
(0.088) (0.088)
(0.087) (0.079)
Colony ij 0.275*** 0.264***
0.165* 0.114*
(0.102) (0.101)
(0.085) (0.065)
Comcol ij -0.854*** -0.835***
-0.826*** -0.504***
(0.167) (0.171)
(0.146) (0.135)
Curcol ijt -0.132 -0.238**
0.320** 0.910***
(0.107) (0.107)
(0.131) (0.143)
Smctry ij -0.585*** -0.566***
-0.490*** -0.315**
(0.123) (0.121)
(0.120) (0.140)
Constant 8.046*** 8.173*** 80.54*** 28.66*** 62.03***
(0.580) (0.597) (9.337) (6.210) (7.794)
Year FE No Yes Yes Yes Yes
Host FE No No No Yes Yes
Home FE No No No No Yes
Country-pair FE No No Yes No No
Observations 36,081 36,081 36,081 36,081 36,081
R-squared 0.257 0.282 3,211 0.517 0.665
rmse 1.426 1.402 0.145 1.152 0.961

28
Notes: The dependent variable is the Institutional Distance between i and j for all regressions. FDI is annual FDI flows from country j to i at time t-1. GDPPCi and GDPPCj are the real GDP per capita in country i and j; GDP_growthi and GDP_growthj are real GDP growth rates in country i and j; ln Populationi and ln Populationj are total population in country i and j; Land locked is the number of landlocked countries (0, 1, or 2); ln Distance is the (natural log) distance between the i and j, Language is a binary dummy variable equal to 1 if i and j share a common language, and 0 otherwise; Adj is a binary variable equal to 1 if i and j share a common border, and 0 otherwise, Colony is a binary variable equal to 1 if i and j have ever had a colonial link after 1945; ComCol is a binary variable equal to 1 if i and j had a common colonizer after 1945, CurCol is a binary variable equal to 1 if i and j are in a colonial relationship at time t, Smctry is a binary variable if i and j were the same country. Coefficient estimates for fixed country and year effects are not reported for brevity. Time-invariant country pair Gravity variables dropped due to collinearity under country-pair fixed effects model. (***), (**), (*) denote significance at 1, 5 and 10% levels, respectively.

29
Table 5: South-South flows versus the rest Notes: SS, SN, NS and NN refer to the sample being restricted to South – South, South – North, North – South and North – North direction of FDI flows from country j to country i. For other variables refer to Table 4.
(1) (2) (3) (4) (5) (6) (7) (8)
Host country FE Home and Host Country FE
SS SN NS NN SS SN NS NN
FDIijt-1 0.0002** -5.14e-05 -2.78e-05 -8.27e-07 5.85e-05 1.21e-05 -1.44e-05 -7.04e-09
(0.0001) (3.33e-05) (1.95e-05) (2.35e-06) (7.70e-05) (2.21e-05) (1.31e-05) (1.89e-06)
GDPPC it-1 -0.295 2.605*** -0.983*** 0.054 -0.212 2.110*** -0.995*** -0.044
(0.262) (0.644) (0.231) (0.197) (0.254) (0.402) (0.227) (0.162)
GDPPC jt-1 -0.389*** -0.795*** 0.706*** -0.172*** 0.050 -0.855*** 2.951*** 0.278*
(0.069) (0.054) (0.055) (0.046) (0.208) (0.274) (0.403) (0.152)
GDP_growth it-1 -0.005 0.043*** -0.029*** -0.007* -0.007 0.042*** -0.029*** -0.004
(0.005) (0.017) (0.007) (0.004) (0.004) (0.014) (0.007) (0.004)
GDP_growth jt-1 -0.015 -0.039*** 0.046*** 0.038*** -0.020** -0.028*** 0.040*** -0.012***
(0.009) (0.010) (0.009) (0.007) (0.008) (0.009) (0.011) (0.004)
lnPopulation it 0.456 -1.867* -2.636*** -1.735*** 0.416 -1.232 -2.642*** -1.691***
(0.624) (1.078) (0.470) (0.413) (0.625) (0.960) (0.474) (0.392)
lnPopulation jt -0.026 -0.018 -0.158*** -0.018* -1.168 -2.840*** -1.778** -1.851***
(0.029) (0.030) (0.012) (0.009) (0.789) (0.584) (0.779) (0.408)
Land locked ij -0.298*** -0.489*** -0.215*** -0.115*** 3.676 13.50*** -4.810* -12.11***
(0.073) (0.097) (0.052) (0.034) (2.364) (3.735) (2.731) (2.644)
lnDistance ij 0.184*** 0.285*** 0.015 0.053** 0.126*** 0.045 0.036 0.021
(0.049) (0.049) (0.025) (0.022) (0.034) (0.039) (0.022) (0.014)
Comlang ij -0.074 0.193 -0.130* 0.048 -0.167 -0.015 -0.048 -0.033
(0.122) (0.192) (0.075) (0.069) (0.136) (0.090) (0.062) (0.035)
ADJ ij -0.204** 0.083 -0.083 -0.130** -0.166* 0.105 0.082 -0.023
(0.103) (0.266) (0.212) (0.056) (0.087) (0.125) (0.115) (0.038)
Colony ij -0.031 -0.003 0.018 -0.091 -0.006 -0.064 -0.043 -0.135***
(0.157) (0.210) (0.082) (0.077) (0.176) (0.079) (0.059) (0.038)
Comcol ij -0.211
-2.632***
0.011
-1.927**
(0.161)
(0.773)
(0.127)
(0.813)
Curcol ijt
-0.056
-0.099
(0.116)
(0.113)
Smctry ij -0.067 -0.083 -0.219 0.116 -0.033 -0.368** -0.512*** 0.117*
(0.108) (0.335) (0.262) (0.095) (0.103) (0.152) (0.174) (0.062)
Constant -1.143 12.09 50.15*** 30.70*** 10.38 45.78*** 58.59*** 63.38***
(11.85) (17.34) (7.901) (6.568) (15.80) (17.13) (17.07) (9.523)
Year FE Yes Yes Yes Yes Yes Yes Yes Yes
Host FE Yes Yes Yes Yes Yes Yes Yes Yes
Home FE No No No No Yes Yes Yes Yes
Observations 6,738 8,274 13,132 7,937 6,738 8,274 13,132 7,937
R-squared 0.350 0.463 0.724 0.215 0.641 0.742 0.758 0.612
rmse 0.984 1.266 0.957 0.568 0.735 0.883 0.898 0.400
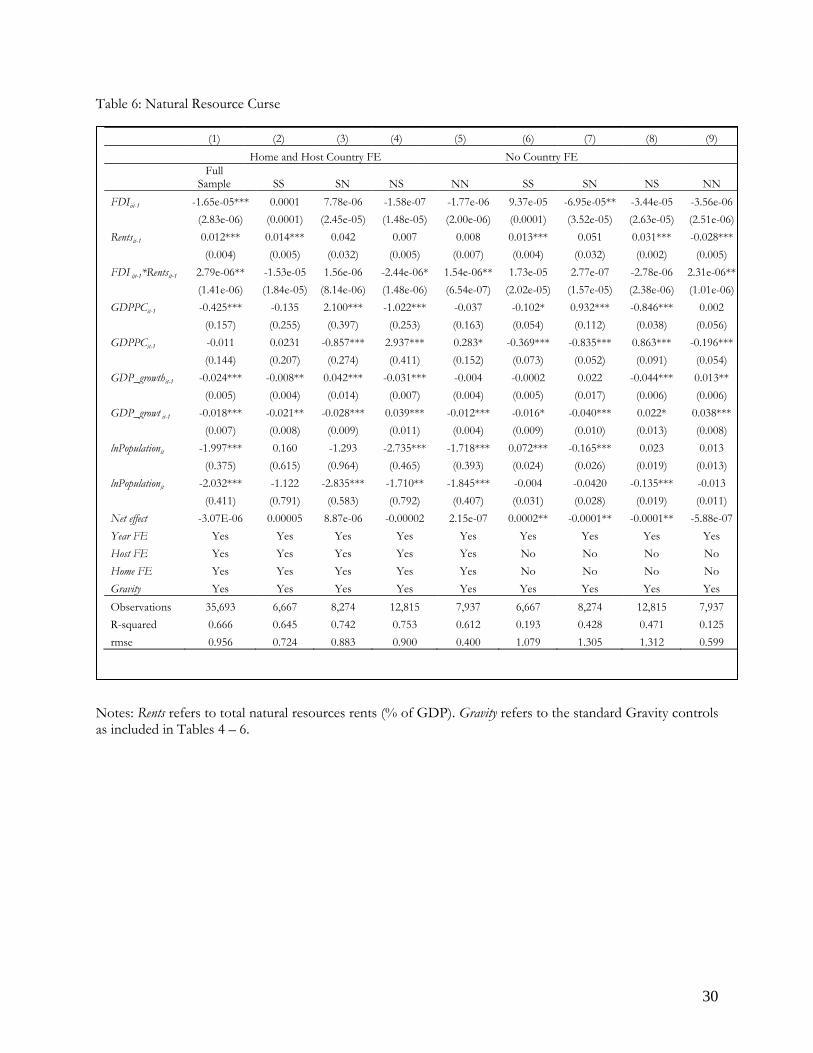
30
Table 6: Natural Resource Curse Notes: Rents refers to total natural resources rents (% of GDP). Gravity refers to the standard Gravity controls as included in Tables 4 – 6.
(1) (2) (3) (4) (5) (6) (7) (8) (9)
Home and Host Country FE No Country FE
Full Sample SS SN NS NN SS SN NS NN
FDIijt-1 -1.65e-05*** 0.0001 7.78e-06 -1.58e-07 -1.77e-06 9.37e-05 -6.95e-05** -3.44e-05 -3.56e-06
(2.83e-06) (0.0001) (2.45e-05) (1.48e-05) (2.00e-06) (0.0001) (3.52e-05) (2.63e-05) (2.51e-06)
Rentsit-1 0.012*** 0.014*** 0.042 0.007 0.008 0.013*** 0.051 0.031*** -0.028***
(0.004) (0.005) (0.032) (0.005) (0.007) (0.004) (0.032) (0.002) (0.005)
FDI ijt-1*Rentsit-1 2.79e-06** -1.53e-05 1.56e-06 -2.44e-06* 1.54e-06** 1.73e-05 2.77e-07 -2.78e-06 2.31e-06**
(1.41e-06) (1.84e-05) (8.14e-06) (1.48e-06) (6.54e-07) (2.02e-05) (1.57e-05) (2.38e-06) (1.01e-06)
GDPPCit-1 -0.425*** -0.135 2.100*** -1.022*** -0.037 -0.102* 0.932*** -0.846*** 0.002
(0.157) (0.255) (0.397) (0.253) (0.163) (0.054) (0.112) (0.038) (0.056)
GDPPCjt-1 -0.011 0.0231 -0.857*** 2.937*** 0.283* -0.369*** -0.835*** 0.863*** -0.196***
(0.144) (0.207) (0.274) (0.411) (0.152) (0.073) (0.052) (0.091) (0.054)
GDP_growthit-1 -0.024*** -0.008** 0.042*** -0.031*** -0.004 -0.0002 0.022 -0.044*** 0.013**
(0.005) (0.004) (0.014) (0.007) (0.004) (0.005) (0.017) (0.006) (0.006)
GDP_growt jt-1 -0.018*** -0.021** -0.028*** 0.039*** -0.012*** -0.016* -0.040*** 0.022* 0.038***
(0.007) (0.008) (0.009) (0.011) (0.004) (0.009) (0.010) (0.013) (0.008)
lnPopulationit -1.997*** 0.160 -1.293 -2.735*** -1.718*** 0.072*** -0.165*** 0.023 0.013
(0.375) (0.615) (0.964) (0.465) (0.393) (0.024) (0.026) (0.019) (0.013)
lnPopulationjt -2.032*** -1.122 -2.835*** -1.710** -1.845*** -0.004 -0.0420 -0.135*** -0.013
(0.411) (0.791) (0.583) (0.792) (0.407) (0.031) (0.028) (0.019) (0.011)
Net effect -3.07E-06 0.00005 8.87e-06 -0.00002 2.15e-07 0.0002** -0.0001** -0.0001** -5.88e-07
Year FE Yes Yes Yes Yes Yes Yes Yes Yes Yes
Host FE Yes Yes Yes Yes Yes No No No No
Home FE Yes Yes Yes Yes Yes No No No No
Gravity Yes Yes Yes Yes Yes Yes Yes Yes Yes
Observations 35,693 6,667 8,274 12,815 7,937 6,667 8,274 12,815 7,937
R-squared 0.666 0.645 0.742 0.753 0.612 0.193 0.428 0.471 0.125
rmse 0.956 0.724 0.883 0.900 0.400 1.079 1.305 1.312 0.599

31
Table 7: Cross section analysis Notes: DSouth and DNorth are dummy variables equal to 1 if host country i is a Southern or Northern country, respectively.
(1) (2) (3) (4) (5)
World-South World-North
FDIit-1 9.59e-06
(6.32e-06)
FDI_Southit-1
-8.51e-05 -0.0003*** -3.65e-05 -3.64e-05
(5.17e-05) (0.0001) (2.83e-05) (3.18e-05)
FDI_Northit-1
1.55e-05** 1.08e-05 1.89e-06 -8.39e-06
(6.89e-06) (6.47e-05) (6.72e-06) (6.09e-05)
FDI_South_DSouthit-1
-0.0003**
(0.0001)
FDI_North_DNorthit-1
2.37e-05
(6.05e-05)
GDPPC it-1 7.762*** 7.853*** 7.927*** 12.12** 8.170***
(2.222) (2.204) (2.320) (4.643) (2.245)
GDP_growth it-1 0.173*** 0.172*** 0.168*** 0.386*** 0.172***
(0.038) (0.038) (0.039) (0.063) (0.038)
lnPopulation it 10.34*** 10.30*** 11.54*** 10.11 10.07***
(3.769) (3.769) (4.288) (11.63) (3.763)
Constant -166.0*** -166.0*** -186.7*** -204.7 -164.7***
(61.40) (61.30) (70.68) (180.7) (60.74)
Host Country FE Yes Yes Yes Yes Yes
Year FE Yes Yes Yes Yes Yes
South-World
-8.51e-05 North-World
1.55e-05**
South-South
-0.0003***
-0.0003***
South-North
-3.65e-05 -0.00004
North-South
1.08e-05
-8.39e-06
North-North
1.89e-06 0.00002**
Observations 2,451 2,451 1,976 475 2,451
R-squared 0.346 0.347 0.349 0.583 0.348
Number of host c. 136 136 111 25 136
rmse 4.497 4.495 4.737 2.670 4.492

32
Table 8: Cross section analysis, natural resource curse and database error Notes: Rents refers to total natural resources rents (% of GDP). FDI_WDI refers to total FDI flows data from WDI (2013).
(1) (2) (3) (4) (5) (6) (7)
Natural Resource Curse WDI
South South
South South
FDIit-1 8.52e-06 3.48e-06
(6.44e-06) (7.98e-06)
FDIit-1*Rents it-1
3.97e-06
(3.67e-06)
FDI_Southit-1
-0.0003*** -0.0002
-0.0003***
(0.0001) (0.0002)
(0.0001)
FDI_Northit-1
7.77e-06 -8.95e-05
2.52e-05
(6.52e-05) (5.57e-05)
(6.69e-05)
FDI_Southit-1*Rents it-1
-8.61e-06
(3.15e-05)
FDI_Northit-1*Rents it-1
1.25e-05**
(4.93e-06)
Rents it-1 -0.022 -0.024 -0.019 -0.025
(0.026) (0.026) (0.028) (0.026)
FDI_WDIit-1
1.99e-06 -4.03e-05
(7.31e-06) (3.19e-05)
GDPPC it-1 7.800*** 7.738*** 8.022*** 7.947*** 7.698*** 7.824*** 8.777***
(2.302) (2.315) (2.417) (2.436) (2.250) (2.353) (2.364)
GDP_growth it-1 0.180*** 0.179*** 0.174*** 0.171*** 0.185*** 0.180*** 0.158***
(0.035) (0.035) (0.036) (0.036) (0.036) (0.037) (0.042)
lnPopulationit 10.23*** 10.36*** 11.34*** 11.40*** 9.497** 10.77** 11.09**
(3.709) (3.715) (4.231) (4.306) (3.833) (4.353) (4.478)
Constant -164.2*** -165.7*** -183.8** -184.2** -152.0** -173.6** -185.2**
(60.62) (60.81) (70.13) (71.55) (62.38) (71.82) (77.85)
Year FE Yes Yes Yes Yes Yes Yes Yes
Host Country FE Yes Yes Yes Yes Yes Yes Yes
Net effects 8.52e-06 0.00004
1.99e-06 World-South
-4.03e-05
South-South
-0.0003*** -0.0003
-0.0003***
North-South
7.77e-06 0.0001
2.52e-05
Observations 2,410 2,410 1,935 1,935 2,359 1,917 1,774
R-squared 0.347 0.347 0.350 0.352 0.340 0.342 0.349
Number of host c. 134 134 109 109 135 110 109
Rmse 4.501 4.501 4.751 4.745 4.459 4.699 4.568
r2_o 0.149 0.142 0.0270 0.0249 0.178 0.0343 0.0424
r2_w 0.347 0.347 0.350 0.352 0.340 0.342 0.349

33
Table 9: Are all institutions equal Notes: The dependent variable is the Institutional distance based on four sub-categories, including corruption, government stability, investment profile and law and order.
(1) (2) (3) (4) (5) (6) (7) (8) (9)
Host Country FE
Home and Host Country FE
Full sample SS SN NS NN SS SN NS NN
FDIijt-1 -1.58e-05*** 0.0002 -6.28e-05 -2.05e-05 -3.33e-06*** 0.0001 -2.45e-05 7.14e-06 -1.42e-06
(3.37e-06) (0.0001) (4.19e-05) (1.88e-05) (1.05e-06) (8.44e-05) (3.35e-05) (9.53e-06) (1.04e-06)
GDPPC it-1 -0.285** -0.414 2.267*** -0.597*** 0.095 -0.471* 1.711*** -0.630*** 0.124
(0.133) (0.279) (0.510) (0.231) (0.158) (0.275) (0.411) (0.222) (0.154)
GDPPC jt-1 -0.082 -0.166*** -0.525*** 0.834*** -0.085* -0.120 -0.719** 3.084*** 0.655***
(0.136) (0.044) (0.044) (0.062) (0.048) (0.210) (0.293) (0.443) (0.168)
GDP_growth it-1 -0.015*** -0.007 0.034** -0.023*** 0.001 -0.007 0.028** -0.023*** 0.0003
(0.003) (0.005) (0.013) (0.004) (0.005) (0.005) (0.012) (0.004) (0.005)
GDP_growth jt-1 -0.009* -0.012* -0.049*** 0.023** 0.009 -0.014** -0.019*** 0.022** 0.004
(0.005) (0.007) (0.007) (0.009) (0.006) (0.007) (0.006) (0.009) (0.005)
lnPopulation it -1.242*** -0.230 -1.548 -2.252*** -0.566 -0.214 -1.055 -2.201*** -0.697*
(0.303) (0.698) (0.956) (0.425) (0.369) (0.692) (0.922) (0.424) (0.360)
lnPopulation jt -1.395*** -0.029 -0.029 -0.216*** -0.001 -0.448 -2.341*** -1.451** -1.425***
(0.347) (0.022) (0.025) (0.013) (0.009) (0.801) (0.502) (0.724) (0.349)
Land locked ij 5.350*** -0.037 -0.121 -0.433*** 0.088** -0.371 8.788*** -3.404 -9.020***
(1.646) (0.061) (0.117) (0.069) (0.035) (2.132) (2.746) (2.564) (2.242)
lnDistance ij 0.278*** 0.181*** 0.429*** -0.005 0.033** 0.131*** 0.042 0.031 0.061***
(0.025) (0.034) (0.042) (0.035) (0.015) (0.028) (0.031) (0.020) (0.019)
Comlang ij -0.366*** 0.031 -0.115 -0.270*** -0.019 -0.218* -0.187** -0.140** 0.076**
(0.0606) (0.102) (0.153) (0.072) (0.03) (0.130) (0.079) (0.056) (0.034)
ADJ ij -0.164** -0.019 0.449** -0.096 -0.040 -0.096 0.057 0.018 -0.036
(0.083) (0.074) (0.217) (0.223) (0.053) (0.068) (0.111) (0.095) (0.046)
Colony ij 0.211*** 0.120 0.183 0.121 -0.135*** 0.103 0.112 0.069 -0.124***
(0.068) (0.113) (0.165) (0.074) (0.035) (0.113) (0.074) (0.051) (0.038)
Comcol ij -0.275** 0.016
-2.170***
0.094
-0.851
(0.125) (0.101)
(0.646)
(0.093)
(0.698)
Curcol ijt 1.062***
0.026
-0.227*
(0.166)
(0.318)
(0.129)
Smctry ij -0.308* -0.169** -0.312 0.179 0.153** -0.104 -0.467*** -0.274** 0.119
(0.158) (0.085) (0.355) (0.254) (0.077) (0.089) (0.170) (0.122) (0.081)
Constant 43.05*** 9.042 6.767 40.30*** 9.702* 16.05 38.72** 40.12** 31.91***
(7.555) (13.42) (15.88) (8.029) (5.819) (17.80) (17.85) (17.12) (8.873)
Year FE Yes Yes Yes Yes Yes Yes Yes Yes Yes
Host FE Yes Yes Yes Yes Yes Yes Yes Yes Yes
Home FE Yes No No No No Yes Yes Yes Yes
Observations 36,081 6,738 8,274 13,132 7,937 6,738 8,274 13,132 7,937
R-squared 0.528 0.203 0.433 0.595 0.200 0.373 0.678 0.673 0.304
rmse 0.985 0.790 1.175 0.977 0.493 0.705 0.891 0.879 0.461
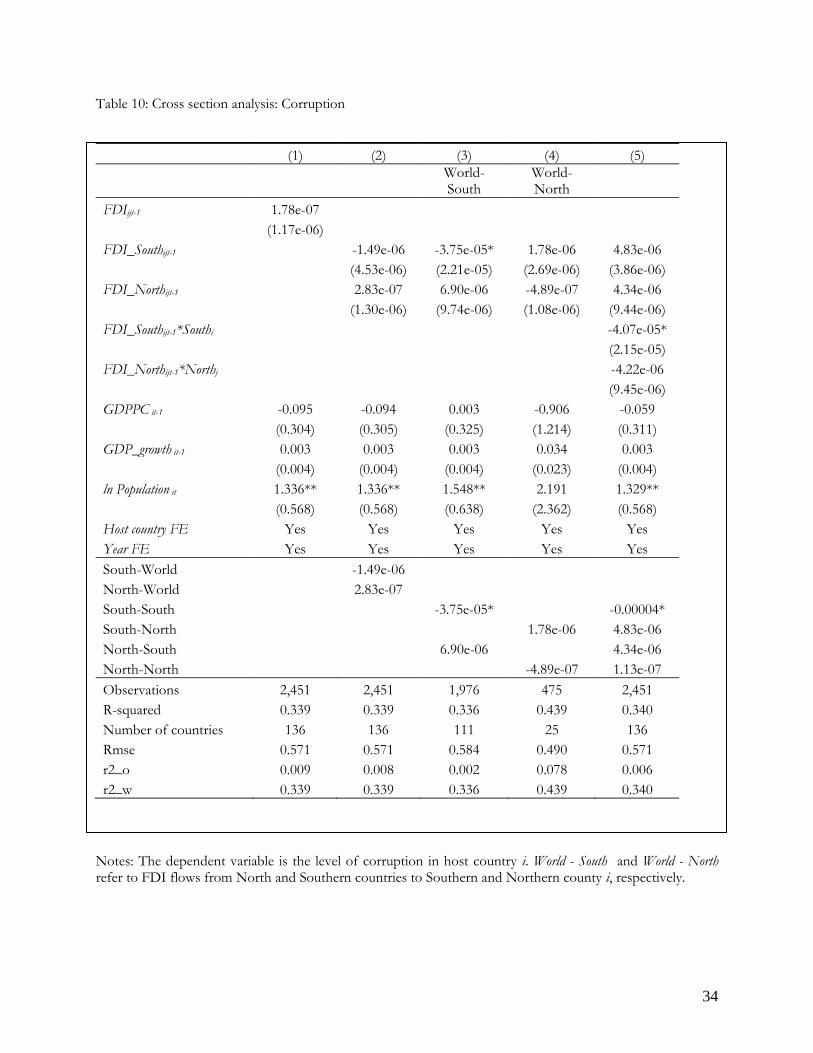
34
Table 10: Cross section analysis: Corruption Notes: The dependent variable is the level of corruption in host country i. World - South and World - North refer to FDI flows from North and Southern countries to Southern and Northern county i, respectively.
(1) (2) (3) (4) (5)
World-South
World-North
FDIijt-1 1.78e-07
(1.17e-06)
FDI_Southijt-1
-1.49e-06 -3.75e-05* 1.78e-06 4.83e-06
(4.53e-06) (2.21e-05) (2.69e-06) (3.86e-06)
FDI_Northijt-1
2.83e-07 6.90e-06 -4.89e-07 4.34e-06
(1.30e-06) (9.74e-06) (1.08e-06) (9.44e-06)
FDI_Southijt-1*Southi
-4.07e-05*
(2.15e-05)
FDI_Northijt-1*Northj
-4.22e-06
(9.45e-06)
GDPPC it-1 -0.095 -0.094 0.003 -0.906 -0.059
(0.304) (0.305) (0.325) (1.214) (0.311)
GDP_growth it-1 0.003 0.003 0.003 0.034 0.003
(0.004) (0.004) (0.004) (0.023) (0.004)
ln Population it 1.336** 1.336** 1.548** 2.191 1.329**
(0.568) (0.568) (0.638) (2.362) (0.568)
Host country FE Yes Yes Yes Yes Yes
Year FE Yes Yes Yes Yes Yes
South-World
-1.49e-06 North-World
2.83e-07
South-South
-3.75e-05*
-0.00004*
South-North
1.78e-06 4.83e-06
North-South
6.90e-06
4.34e-06
North-North
-4.89e-07 1.13e-07
Observations 2,451 2,451 1,976 475 2,451
R-squared 0.339 0.339 0.336 0.439 0.340
Number of countries 136 136 111 25 136
Rmse 0.571 0.571 0.584 0.490 0.571
r2_o 0.009 0.008 0.002 0.078 0.006
r2_w 0.339 0.339 0.336 0.439 0.340

35
Table 11: Trade flows as a factor for institutional change Notes: Trade refers to the (log) gross real trade flows between country i and j.
(1) (2) (3) (4) (5) (6) (7) (8) (9)
Home country FE Home and Host country FE
Full Sample SS SN NS NN SS SN NS NN
Tradeijt-1 -0.051*** -0.058 -0.007 0.021 -0.055 -0.07*** -0.032 -0.035** -0.049**
(0.015) (0.044) (0.049) (0.018) (0.044) (0.023) (0.022) (0.016) (0.020)
GDPPC it-1 -0.536*** -0.144 2.544*** -1.312*** 0.140 -0.131 2.407*** -1.258*** 0.154
(0.134) (0.218) (0.436) (0.210) (0.178) (0.208) (0.436) (0.207) (0.169)
GDPPC jt-1 0.011 -0.313*** -0.823*** 0.753*** -0.184*** 0.249 -1.020*** 2.591*** 0.348**
(0.128) (0.084) (0.077) (0.050) (0.052) (0.200) (0.234) (0.398) (0.159)
GDP_growth it-1 -1.874*** 0.107 -0.820 -2.870*** -1.726*** -0.038 -1.005 -2.812*** -1.907***
(0.290) (0.729) (0.872) (0.359) (0.387) (0.709) (0.811) (0.366) (0.364)
GDP_growth jt-1 -1.540*** 0.037 -0.022 -0.182*** 0.016 -1.152** -2.698*** -0.695 -1.771***
(0.350) (0.055) (0.057) (0.019) (0.036) (0.572) (0.475) (0.772) (0.324)
lnPopulation it -0.023*** -0.008 0.014 -0.028*** -0.001 -0.009 0.014 -0.028*** -0.003
(0.004) (0.009) (0.012) (0.004) (0.004) (0.009) (0.012) (0.005) (0.003)
lnPopulation jt -0.017*** -0.013 -0.024*** 0.031*** 0.043*** -0.018** -0.023*** 0.024** -0.014***
(0.005) (0.008) (0.007) (0.009) (0.007) (0.007) (0.006) (0.009) (0.004)
Land locked ij -2.400*** -0.265*** -0.716*** -0.263*** -0.172*** 3.048 9.717*** -4.776 -6.501***
(0.330) (0.068) (0.095) (0.050) (0.046) (2.210) (3.281) (5.028) (1.144)
lnDistance ij 0.218*** 0.121* 0.254*** 0.064** 0.022 0.056 0.019 0.004 -0.009
(0.028) (0.072) (0.066) (0.032) (0.047) (0.044) (0.037) (0.029) (0.024)
Language ij -0.283*** -0.101 0.244 -0.122** 0.089 -0.116 0.047 -0.009 -0.015
(0.053) (0.113) (0.203) (0.060) (0.085) (0.122) (0.068) (0.05) (0.035)
Contig ij -0.179** -0.169* -0.012 -0.079 -0.103* -0.129 0.104 0.152 0.017
(0.083) (0.100) (0.326) (0.162) (0.062) (0.083) (0.113) (0.109) (0.038)
Colony ij 0.0830 -0.032 -0.063 -0.052 -0.096 0.053 -0.105 -0.082* -0.137***
(0.063) (0.162) (0.213) (0.071) (0.083) (0.186) (0.064) (0.047) (0.039)
Comcolij -0.696*** -0.064
-2.574***
0.167
-2.080**
(0.151) (0.178)
(0.827)
(0.113)
(0.810)
Curcol ijt 0.956***
4.324***
0.067
-0.003
(0.138)
(0.243)
(0.140)
(0.092)
Smctry ij -0.201 -0.022 0.252 -0.109 0.121 -0.068 -0.171 -0.517** 0.139**
(0.137) (0.104) (0.353) (0.310) (0.098) (0.092) (0.124) (0.210) (0.058)
Constant 70.66*** 2.634 -4.625 55.71*** 29.68*** 17.62 40.86*** 46.55*** 62.79***
(7.438) (12.73) (13.62) (5.848) (6.405) (15.55) (14.08) (16.18) (8.381)
Year FE Yes Yes Yes Yes Yes Yes Yes Yes Yes
Host FE Yes Yes Yes Yes Yes Yes Yes Yes Yes
Home FE Yes No No No No Yes Yes Yes Yes
Observations 51,237 9,272 12,415 19,758 9,792 9,272 12,415 19,758 9,792
R-squared 0.667 0.367 0.441 0.718 0.231 0.600 0.726 0.746 0.628
rmse 1.067 1.025 1.371 1.097 0.624 0.819 0.963 1.043 0.435
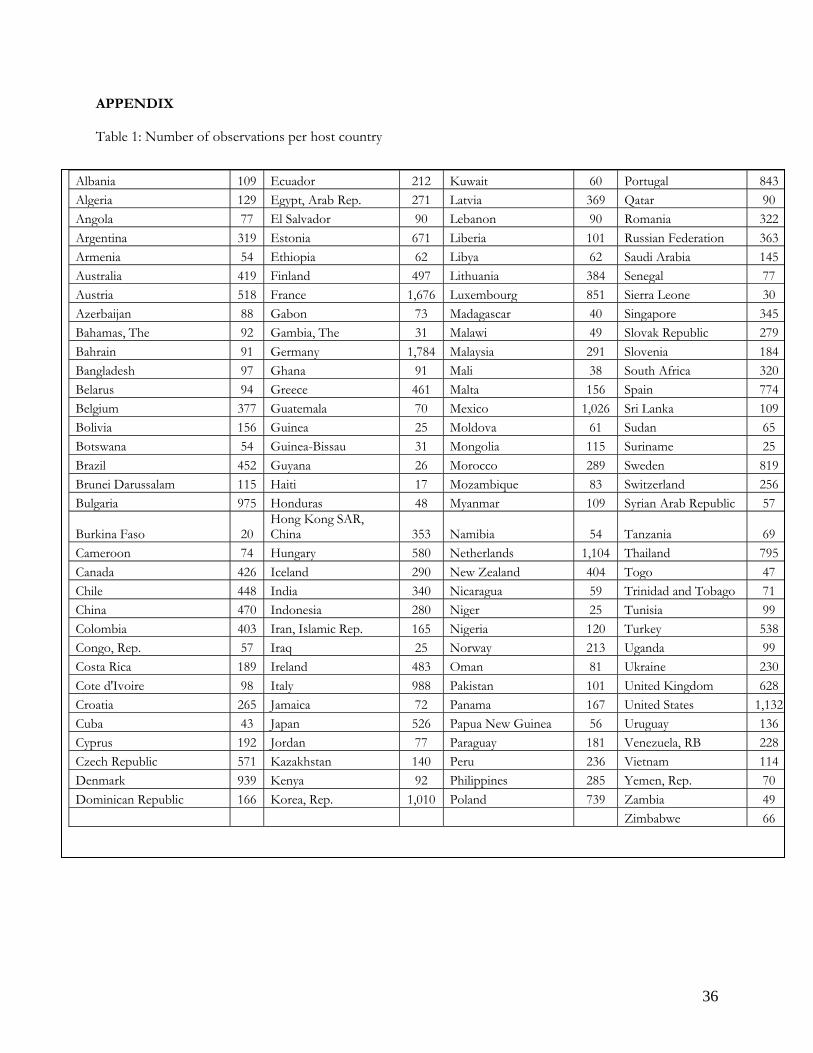
36
APPENDIX Table 1: Number of observations per host country
Albania 109 Ecuador 212 Kuwait 60 Portugal 843
Algeria 129 Egypt, Arab Rep. 271 Latvia 369 Qatar 90
Angola 77 El Salvador 90 Lebanon 90 Romania 322
Argentina 319 Estonia 671 Liberia 101 Russian Federation 363
Armenia 54 Ethiopia 62 Libya 62 Saudi Arabia 145
Australia 419 Finland 497 Lithuania 384 Senegal 77
Austria 518 France 1,676 Luxembourg 851 Sierra Leone 30
Azerbaijan 88 Gabon 73 Madagascar 40 Singapore 345
Bahamas, The 92 Gambia, The 31 Malawi 49 Slovak Republic 279
Bahrain 91 Germany 1,784 Malaysia 291 Slovenia 184
Bangladesh 97 Ghana 91 Mali 38 South Africa 320
Belarus 94 Greece 461 Malta 156 Spain 774
Belgium 377 Guatemala 70 Mexico 1,026 Sri Lanka 109
Bolivia 156 Guinea 25 Moldova 61 Sudan 65
Botswana 54 Guinea-Bissau 31 Mongolia 115 Suriname 25
Brazil 452 Guyana 26 Morocco 289 Sweden 819
Brunei Darussalam 115 Haiti 17 Mozambique 83 Switzerland 256
Bulgaria 975 Honduras 48 Myanmar 109 Syrian Arab Republic 57
Burkina Faso 20 Hong Kong SAR, China 353 Namibia 54 Tanzania 69
Cameroon 74 Hungary 580 Netherlands 1,104 Thailand 795
Canada 426 Iceland 290 New Zealand 404 Togo 47
Chile 448 India 340 Nicaragua 59 Trinidad and Tobago 71
China 470 Indonesia 280 Niger 25 Tunisia 99
Colombia 403 Iran, Islamic Rep. 165 Nigeria 120 Turkey 538
Congo, Rep. 57 Iraq 25 Norway 213 Uganda 99
Costa Rica 189 Ireland 483 Oman 81 Ukraine 230
Cote d'Ivoire 98 Italy 988 Pakistan 101 United Kingdom 628
Croatia 265 Jamaica 72 Panama 167 United States 1,132
Cuba 43 Japan 526 Papua New Guinea 56 Uruguay 136
Cyprus 192 Jordan 77 Paraguay 181 Venezuela, RB 228
Czech Republic 571 Kazakhstan 140 Peru 236 Vietnam 114
Denmark 939 Kenya 92 Philippines 285 Yemen, Rep. 70
Dominican Republic 166 Korea, Rep. 1,010 Poland 739 Zambia 49
Zimbabwe 66

37
Appendix Table 2: Number of observations per home country
Albania 78 Ecuador 101 Kuwait 110 Portugal 641
Algeria 76 Egypt, Arab Rep. 226 Latvia 244 Qatar 66
Angola 38 El Salvador 53 Lebanon 139 Romania 276
Argentina 371 Estonia 190 Liberia 125 Russian Federation 367
Armenia 54 Ethiopia 8 Libya 97 Saudi Arabia 196
Australia 554 Finland 733 Lithuania 176 Senegal 42
Austria 882 France 1,756 Luxembourg 960 Sierra Leone 8
Azerbaijan 49 Gabon 63 Madagascar 37 Singapore 447
Bahamas, The 217 Germany 2,076 Malawi 16 Slovak Republic 261
Bahrain 101 Ghana 67 Malaysia 430 Slovenia 262
Bangladesh 73 Greece 511 Mali 25 South Africa 314
Belarus 110 Guatemala 54 Malta 184 Spain 826
Belgium 539 Guinea 21 Mexico 269 Sri Lanka 41
Bolivia 69 Guinea-Bissau 14 Moldova 26 Sudan 19
Botswana 8 Guyana 7 Mongolia 25 Suriname 17
Brazil 394 Haiti 10 Morocco 175 Sweden 1,087
Brunei Darussalam 52 Honduras 27 Mozambique 14 Switzerland 1,079
Bulgaria 291 Hong Kong SAR, China 463 Myanmar 39 Syrian Arab Republic 67
Burkina Faso 20 Hungary 514 Namibia 32 Tanzania 18
Cameroon 64 Iceland 386 Netherlands 1,512 Thailand 260
Canada 562 India 340 New Zealand 403 Togo 23
Chile 267 Indonesia 273 Nicaragua 30 Trinidad and Tobago 48
China 441 Iran, Islamic Rep. 234 Niger 24 Tunisia 96
Colombia 243 Iraq 27 Nigeria 111 Turkey 421
Congo, Rep. 30 Ireland 471 Norway 450 Uganda 26
Costa Rica 120 Israel 284 Oman 55 Ukraine 223
Cote d'Ivoire 42 Italy 1,119 Pakistan 114 United Kingdom 1,197
Croatia 141 Jamaica 61 Panama 309 United States 1,455
Cuba 44 Japan 981 Papua New Guinea 32 Uruguay 216
Cyprus 214 Jordan 97 Paraguay 53 Venezuela, RB 281
Czech Republic 449 Kazakhstan 129 Peru 135 Vietnam 122
Denmark 970 Kenya 81 Philippines 265 Yemen, Rep. 19
Dominican Republic 63 Korea, Rep. 852 Poland 570 Zambia 19
Zimbabwe 37