effects of foreign exchange supply and · pdf fileeffects of foreign exchange supply and...
TRANSCRIPT

289Effects of Foreign Exchange Supply and Demand Dynamics to Rupiah Exchange Rateand Economic Performance
EFFECTS OF FOREIGN EXCHANGE SUPPLY ANDDEMAND DYNAMICS TO RUPIAH EXCHANGE RATE
AND ECONOMIC PERFORMANCE
SugengM. Noor Nugroho
IbrahimYanfitri 1
This study examines the influence of forex demand and supply interaction on Rupiah»s exchange
rate. Estimation results show that the movement of rupiah is influenced by the forex supply and demand,
where the foreign players are dominating. Furthermore, the demand and supply of foreign exchange is
asymmetric.
This paper also shows the impact of exchange rate movements on output is only in the short term
with a more significant influence to the import, while the depreciation of Rupiah has a larger impact than
its appreciation.
KeywordsKeywordsKeywordsKeywordsKeywords::::: Foreign exchange, inflation, exchange rate.Foreign exchange, inflation, exchange rate.Foreign exchange, inflation, exchange rate.Foreign exchange, inflation, exchange rate.Foreign exchange, inflation, exchange rate.
JEL Classification: E31, F31
1 Sugeng ([email protected]), M. Noor Nugroho ([email protected]), Ibrahim ([email protected]) and Yanfitri ([email protected]) areeconomist on BRE - DKM Bank Indonesia. The authors thank to Made Sukada, Dr. Iskandar Simorangkir and other researchers fortheir valuable contribution on this paper.
Abstract
290 Bulletin of Monetary, Economics and Banking, January 2010
I. INTRODUCTION
Exchange rate is an important economic indicator that has a strategic role in an economy.
Exchange rate movement widely influence various aspects of economy, including inflation,
import-export performance which in turn affects the output of economy. In addition, the
exchange rate movement are like a double-edged sword, for example, in the event of
depreciation, exporters are benefited since the prices of Indonesian exported products relatively
turn out to be cheaper. Conversely, depreciation of rupiah may be detrimental for importers
and foreign debt debtors within increased cost of imports and foreign debt payment burdens
(equivalent in domestic currency). Depreciation also increases inflationary pressures in which if
inflation increases significantly, it will have negative impacts throughout the economy. The
impact will ultimately depend on the ratio of positive and negative effects of rupiah depreciation.
In the case of rupiah appreciation, it will apply vice versa.
Indonesia as an open economy with floating exchange rate system also faces the above
dilemma, especially when rupiah moves very volatile as happened in the last quarter of 2008
after the global financial crisis. Such case contributes negative impacts impact to the domestic
financial market and the overall economy.
Taking into account that the exchange rate movement are quite volatile and the negative
impacts are quite extensive to the economy, efforts to maintain exchange rate stability are not
easy challenges for the Bank of Indonesia in the midst of a very open economy within a free
forex system and a floating exchange rate regime. Rupiah stability turns out to be increasingly
crucial in association with the inflation target achievement and concerning that the impacts of
exchange rate to inflation and inflation expectations are quite high (Kurniati, 2007, Kurniati et
al, 2008).
In the efforts to maintain the exchange rate stability, recognizing the factors affecting the
movements is required. Many studies have been made to develop exchange rate models that
may explain the influencing factors and may measure the significance and magnitude of each
factor»s effect. In the Bank of Indonesia, several studies on rupiah exchange rate by using
macroeconomic fundamentals variable have also been carried out, such as Behavioural
Equilibrium Exchange Rate (BEER) model that shows the movements of rupiah real exchange
rate is significantly influenced by risk factors and several macroeconomic variables, namely
interest rate differential, terms of trade, productivity and net foreign assets. The study shows
that the rupiah movements are more influenced by the risk factors than the macroeconomic
variables. Besides for the evaluation purposes or assessment on rupiah movements, the BEER
model is also used to forecast the rupiah exchange rate. Other models that are also developed

291Effects of Foreign Exchange Supply and Demand Dynamics to Rupiah Exchange Rateand Economic Performance
- as a comparison to the BEER model - are the Fundamental Equilibrium Exchange Rate (FEER)
model and the Effective Real Exchange Rate model, which also utilize a macroeconomic approach.
In practical research, the exchange rate modelling is one of very difficult topics to apply.
Consequently, it is hard to find the model that is satisfactorily able to explain the phenomena
of exchange rate movement, especially to forecast the exchange rate. A model may
appropriately explain exchange rate developments in a certain country and within a certain
period, but at other time, the same model may not function similarly. To handle weaknesses,
many economists and practitioners (as well as the central banks) endeavour to construct
several alternative models so that such models can complement one another to explain
exchange rate movement accurately.
By paying attention to the above issues, this study aims to provide an alternative exchange
rate model (as well as with an alternative approach) in order to explain exchange rate movement
better. The approach used is the forex supply and demand approach in the domestic forex
market. Theoretically, the interaction between forex supply and demand - as a commodity
traded in the forex market - will establish a price, which in this case is the rupiah exchange rate
(rupiah against the US dollar). Referring to the theory, the exchange rate model to be generated
by this study may explain the effect of forex supply and demand dynamics for rupiah exchange
rate movement. In addition to measuring the impact on exchange rates, it will further measure
the effects to the economic price and output.
In addition to further enrich an understanding on the supply and demand dynamics in
the domestic forex marketing in order to increase the added value of resulted exchange rate
model, this study also analyzes the structure of forex market that includes market participants,
their characteristics and forex transactions applied, as well as their impact on the rupiah exchange
value development.
In implementing this study, there are several things that have very wide or even specific
definitions. Forex market shall be interpreted as any activity related to exchange or purchasing
and selling of one currency to the other currency. Therefore, any forex transaction that occurs
between one person and the other without considering where the transaction takes place,
such as any forex transaction in any money changer, any bank, and forex transaction between
banks, may be interpreted as a forex market. In this study the definition of forex market is
restricted only on any forex transaction occurring in any domestic banking sector (banks
functioned as the forex market), and reported by the banks to the Bank of Indonesia through
the Commercial Bank Daily Report (LHBU) which includes (i) individual, (ii) corporation, (iii)
domestic banks and (iv) foreign parties.

292 Bulletin of Monetary, Economics and Banking, January 2010
A bank serves as a forex market, due to its role to serve as an intermediary to bring
together supply and demand. A bank may be equated as a forex market since it tends to be
neutral, although a bank may also carry out transactions for its own interests and take long or
short forex position. However, the bank»s position is relatively limited (near-neutral) because:
- Bank risk management will lead the bank to the neutral position to avoid exchange rate
risk, and
- In case the bank takes a risk by taking a long / short forex position, the bank is limited by the
terms of the net open position.
Forex supply and demand in this study shall refer to any effective supply and demand
since it has been realized in the form of forex transactions. Forex supply and demand are
distinguished from the bank»s point of view - as the forex market - based on the flow of forex
arising from forex transactions conducted by the bank.
Forex supply is specified as forex flows into the market, so that the representing forex
transactions are forex purchase transactions (rupiah sales) performed by the bank in which the
bank receives forex from the counterpart, whereas to the counterpart, the bank hands over
rupiah to the counterpart within an equivalent amount.
Conversely, demand is defined as forex flows out of the bank which is represented by
forex sale transactions by the bank. The accumulation of all purchase and sale forex transactions
by the bank will show the bank»s position as a net purchase (purchase transaction is larger than
sale transaction) or the net sale which may also be equated with excess supply or excess demand.
The second section of this paper reviews the theory underlying this study, while the third
section discusses the data and methodology used. Furthermore, the fourth section reviews the
results of the estimate and analysis, while conclusions and suggestions will take part as the
closing section.
II. THEORY
II.1. Theory of Demand and Supply
In the market, there are two main forces that interact with each other, namely supply and
demand, in order to form an equilibrium reflected in the price and quantity levels where supply
and demand curves meet. Law of demand connects a various combination points between the
amount of goods (or services) and the price levels offered. The higher the price, the higher the
quantity will be supplied - or vice versa when the price falls √ within a√ceteris paribus assumption,
so that there is a positive relationship between the price and the supply.

293Effects of Foreign Exchange Supply and Demand Dynamics to Rupiah Exchange Rateand Economic Performance
In the context of forex market, the commodity traded is the forex, whereas the price is
the exchange rate. For the US dollar market in Indonesia, the price of US dollar is the rupiah
exchange rate per US dollar, for example with a quotation of IDR 9,000/USD; in case the quotation
increases, it means the price of USD1 purchased with the rupiah currency turns out to be more
expensive. This condition is called rupiah depreciation (the rupiah value decreases) or US dollar
appreciation. Conversely, if the quotation declines, then rupiah appreciation occurs (US dollars
depreciation).
As in other markets, excess demand against the US dollar causes rupiah depreciation,
and conversely, excess supply results in US dollar depreciation (rupiah appreciation). An exchange
model within a microstructure approach uses the same principle, namely to measure the effect
of «excess demand»»- using the order flow data √ to the exchange rate movement.
Order flow refers to an order or request to conduct forex transactions from one party to
a forex dealer, which in this case serves as the market maker or the market. By serving as a
market maker, the dealer may receive any sale order and purchase order. In the concept of
order flows, sale and purchase orders of forex are distinguished by giving a positive mark (+) for
forex purchase orders (the dealer sells the forex to the buyer) and a negative mark (-) for the
forex sale orders. The order flow accumulation is empirically proven by Evan and Lyons (2005)
that affects the exchange rate.
The main explanation of explanatory power is an order containing a lot of information
potentially affects the exchange rate. Before ordering, the buyer has to obtain information,
including information concerning macroeconomic fundamentals (Rime, 2007) from various
sources and then process (analyze) such information that eventually create future expectation
of exchange rate. Based on this expectation, a buyer delivers a forex transaction order, which
aims to gain profit. Since the orders come from various circles that have great variety of
information, the order flow accumulation is synthesized from a variety of information, so it is
able to explain the direction of exchange rate movement.
The signing to distinguish the direction of forex transactions makes the order flow is
often referred to as a variant of «excess demand». Based on this fact, relationship between the
order flow and the exchange rate may be found, namely higher order flow (excess demand)
will increasingly put depreciative pressures to the exchange rates. The general form of the
order flow equation is as follows:
∆Pt = f(X, I, Z) + ε
t
Where ∆Pt is the change of exchange rate, X is the order flow, I is the forex reserves held
by a market maker, and Z is the other micro indicators.

294 Bulletin of Monetary, Economics and Banking, January 2010
A study on a supply and demand approach has also been taken in the Bank of Indonesia
by Husman (2005). This study uses a composite (hybrid) model that combines forex supply and
demand with economic fundamental variables to explain exchange rate movement. The equation
of such intended composite exchange rate model is as follows:
st = α
0 + (p
t – p*
t) + α
1(i
t – i*
t) + α
2sdv
t + α
3tot
t + α
4p
oil + u
t
where st is the exchange rate, p
t – p*
t is the price differential, i
t – i*
t is the interest rate
differential, sdvt is the ratio of foreign forex supply and demand, tot
t is the term of trade and poil
is the world oil price. The study results show that the supply and demand variables significantly
influence the movement of exchange rate.
II.2. Exchange Rate, Inflation and Monetary Policy Transmission Pass-Through
Exchange rate movement as indicated on the background has broadly influenced the
economy, including the price. Exchange rate in influencing the price may be through various
pass-through of transmission:
- Direct pass-through
- Indirect pass-through
- Inflation expectation
In the direct pass-through, changes in the exchange rate may affect the import prices of
goods (in domestic currency), which is reflected in the import price index. The main problem
related to the issue of pass-through effect is the effect of exchange rate depreciation which
directly increases the import costs to be borne by importers that causes the increase of import
price. Furthermore, importers or retailers who sell imported goods to customers have some
alternatives to bear the cost increase on their own or impose the charge of cost increase to
their customers in the form of raising the customer price. In case importers would like to
maintain their profit, the rupiah depreciation expense will be charged to the customers so that
the customer prices increase. However, if importers are willing to bear it - by reason of maintaining
their market share - hence the rupiah depreciation will give minimum impacts to customer
prices.
Impact of changes in exchange rates through indirect pass-through is through shifting
the marketing orientation of domestic market into international markets. Depreciation makes
the price of exported goods cheaper, which subsequently encourages the exports. For domestic
manufacturers, it is a potential for greater profits that it will be more profitable if their produced
goods are sold to overseas markets than to domestic markets. Due to changes in the market

295Effects of Foreign Exchange Supply and Demand Dynamics to Rupiah Exchange Rateand Economic Performance
investment, the prices of these goods in the country become more expensive (inflation).
Meanwhile, expectation point enlightens that the exchange rate depreciation will cause future
prices that tend to increase. This expectation is realized by manufacturers and retailers to make
anticipatory measures on price adjustment (raising the prices). As a result, inflation tends to
rise.
In this study, the effects of exchange rate changes to prices (inflation) through a direct
pass-through will be estimated. Therefore, the estimate will be divided into two stages: the first
stage or the first round effect is known as the effects of changes in exchange rates to import
prices, and the second round effect is the influence of import prices to customer prices. An
equation model used is in reference to Kurniati (2007) with the following equation:
Pm = f(e
t, P
int’l, P
oil, Y); first round effect
P = f(Pm, P
oil, Y
t); second round effect
Where P is the CPI, Pm is import price, e is the exchange rate, P
int’l is the price indicator of
trading partner nations, Poil
is the world oil price, and Y is GDP.
II.3. Determinants of Export and Import Performance
Exports and imports are the implementation of an open economic system in which a
country performs trading activities with other countries. The dynamics of exports and imports
will also affect the balance of payments and the overall economic outputs. The exchange rate
is closely linked both to exports and imports of which exchange rate movement affect the
competitiveness of export products (in terms of relative prices). Depreciation of an exchange
rate of one country against another country»s currency makes the country»s competitiveness of
export products increases, so that exports rise as well. At the same time, imports become more
expensive for such country, which tends to decline. Combination of increased exports and
decreased imports improves the condition of balance of payments, and will further increase
revenues. An opposite effect occurs when the exchange rate is appreciated, namely the
performance of the balance of payments and the national revenue becomes worse.
In addition to the exchange rate, exports and imports are also influenced by the terms of
trade, export goods supply side and demand side (the exports and the imports). Improved
terms of trade will contribute positive impacts to the exports, but adversely influence the imports.
For exporting countries, the availability of goods supplied may be reflected in their production,
while the goods import demand is reflected by their revenue. Thus, export and import equations
may be expressed as follows:

296 Bulletin of Monetary, Economics and Banking, January 2010
X = f(e, TOT, IP*)
M = f(e, TOT, Y)
Where
X is the export, M is the import, e is the exchange rate, TOT is the terms of trade, IP* is the
industrial production index, the trade partner countries representing revenues.
Furthermore, exports and imports affect the national revenue as indicated in the identity
equation of domestic output in an open economic system:
Y = C + I + G + (X – M)
Where Y is the GDP, C is the consumption, I is the investment, G is the government spending,
and X - M is the net exports (exports - imports).
III. METHODOLOGY
The method of analysis is divided into two, the first is a descriptive analysis of domestic
banking forex market aims to determine the forex market microstructure; including conducting
studies on the market players and its characteristics, demand, supply and exchange rate
developments, and transaction patterns. The second part is an analysis applying the simultaneous
equation econometric estimate technique. Based on the model developed, shock simulation
occurring either on forex demand or supply is conducted. The simulation is also conducted to
refine the analysis and to test whether or not the model is robust.
III.1. Empirical Model
The framework of empirical model developed in this study is a simultaneous equation
system. The simultaneous equation model to be estimated consists of five behavioural equations
(behavioural equation) and one identity equation such as follows:
et = b
10 + b
11SD_LN
t + b
12SD_LN
t-1 + b
13SD_DN
t + b
14SD_DN
t-1 + b
15RISK
t + b
16NEER
t + u
1t (III. 1)
Xt = b
20 + b
21e
t + b
22TOT
t + b
23IP*
t + u
2t (III. 2)
Mt = b
30 + b
31e
t + b
32TOT
t + b
33Y
t + u
3t (III. 3)
Yt = C
t + I
t + G
t + X
t – M
t (III. 4)
Pmt = b
40 + b
41e
t + b
42P*
t + b
43P
oilt + b
44Y
t + u
4t (III. 5)
Pt = b
50 + b
51Pm
t + b
52P
oilt + b
53Y
t + u
5t (III. 6)

297Effects of Foreign Exchange Supply and Demand Dynamics to Rupiah Exchange Rateand Economic Performance
where e is the nominal exchange rate, SD_DN and SD_LN is the net demand and forex supply
from foreign and domestic parties, RISK is the risk factor, NEER is the composite exchange rate
of a few global currencies, X is the export, TOT is the term of trade, IP* is the industrial
production index of trading partner countries, M is the import, Y is the domestic revenue /
output, C is the consumption, I is the investment, G is the government spending, Pm is the
import price, P* is the foreign price, Poil
is the world oil price, and P is the customer price.
Concerning that the above equations are one-way effect (et affects Pm
t, P
t, X
t and M
t, and
subsequently Xt and M
t affects Y
t)) and there is no looping or reverse effect or mutual effect,
then the estimate of such equations will be done partially. Furthermore, the results of the said
partial estimate will be combined in one simultaneous equation system. Having such method,
it is expected that such estimate may be efficient so that a consistent equation may eventually
produced.
The first equation is an equation of exchange rate that is consistent with an order flow
approach developed by Lyons (2001) such as follows:
∆Pt = b
0 + b
1X
t + b
2I
t + b
3Z
t + ε
t
where ∆Pt is the change of exchange rate (IDR / USD), X
t is the order flow, I
t is the forex reserves
held by a market maker, and Zt is the other indicator. Additional indicators are risk factors and
global exchange rates.
Variable Xt - net forex purchase by the bank - is expected to negatively affect the exchange
rate; if the net purchase or excess supply (see the description below) increases, the rupiah rate
then will be appreciated (quotation of IDR / USD is down). Conversely, the decline in the net
purchase results in rupiah depreciation. The It forex reserves are also expected to negatively
affect the exchange rate. High forex reserves of a certain bank will encourage such related
bank to release the forex.
In this study, the order flow data is replaced by spot transactions occurring in a domestic
banking sector (banks ~ dealers in the concept of microstructure market). Therefore, some
designations of terms are required to be clarified:
- A bank is equated with a dealer in terms of its role as a forex market associated with several
crucial similarities, namely:
o The bank may enter into two-way transactions (sale and purchase) so that it may bring
together demand and forex supply, and distribute such excess supply/demand to the
entire market.
o Neutrality; the bank tends to be neutral - excessive supply/demand of forex is forwarded
to the other market participants - since the bank tends to be risk averse and √ in case√

298 Bulletin of Monetary, Economics and Banking, January 2010
the bank take (long / short of forex) position - the bank»s position is restricted by the
prudential regulation of Net Open Position.
- Forex supplyForex supplyForex supplyForex supplyForex supply is specified as forex transactions conducted by a bank within a consequence of
forex flows into the bank, namely forex purchase transactionspurchase transactionspurchase transactionspurchase transactionspurchase transactions (forex sale from the bank
counterpart).
- Forex demandForex demandForex demandForex demandForex demand refers to forex transactions conducted by a bank within a consequence of
forex flows out of the bank, namely forex sale transactionssale transactionssale transactionssale transactionssale transactions (forex purchase from the bank
counterpart side).
- When a purchase transaction (supply) is provided with a positive mark, whereas the sale
transaction (demand) is provided with a negative mark, then the accumulation of such
transactions are net purchasenet purchasenet purchasenet purchasenet purchase √ when it is positivepositivepositivepositivepositive, it means that the bank has an excessexcessexcessexcessexcess
supplysupplysupplysupplysupply transaction with its counterpart, or vice versa, when it is negativenegativenegativenegativenegative, it means that the
bank experiences an excess demandexcess demandexcess demandexcess demandexcess demand.
Equation III.5 and equation III.6 are import price equations and customer price equations.
Estimate of exchange rate effect to the price (exchange rate pass-through) refers to the existing
study prepared by Kurniati (2007). In such study, the effects of exchange rate change to the
price are estimated through the direct pass-through. Before affecting the customer price, the
effects will be transmitted through the import price. Increased import cost due to price changes
will encourage importers to sell their imported goods to the domestic markets with higher
prices in order to maintain their profits.
Besides because of changes in exchange rates, import prices are also directly influenced
by price developments in the country of origin where the imported goods, oil prices, and
domestic revenues come from. Changes in the price of imported goods in their home country
directly affect the import costs should be borne by the importers, so that the price increase of
trading partner countries has positive effect to the import price. Oil price may affect the imported
goods price - although such price has no direct relationship with the oil √ through the increase
of production cost since most of the entire production process requires such energy source (the
oil). Therefore, the increase of oil prices will increase the import price as well. Oil price also
leads to the increase of domestic production cost, which in turn shall raise the price of goods in
general. Meanwhile, domestic revenues also strongly affect the import demand and the domestic
product demand, which eventually may increase the import and customer prices. Referring to
this description, Equation III.5 shows the first round effect, while Equation III.6 shows the second
round effect.
Equation III.2 in the simultaneous model above shows the export equation, whereas
Equation III.3 represents the import equation. Exchange rate directly affects the export and
299Effects of Foreign Exchange Supply and Demand Dynamics to Rupiah Exchange Rateand Economic Performance
import performances of an economy through the effects of price competitiveness. Depreciation
makes domestic goods price is relatively cheaper, so it provides an incentive for foreign customers
to buy more, which means that the export shall increase. However, the exchange rate is not the
only factor that affects the export. Exports are determined by interactions between the demand
side which are generally represented by the revenues of trading partner countries, which in this
case - since the estimate uses monthly data √ are represented by US Industrial Production Index.
On the other hand, import of such countries obtains impacts contrary with the export as
described above. If depreciation is profitable for the export, the import is depressed since the
price of imported goods relatively becomes more expensive. As a result, the import decreases
by the domestic currency depreciation. However, the impact ultimately depends on the strength
of domestic demand for imported goods that is represented by domestic revenues. The higher
domestic revenue, the higher import demand is. The other factor that affects the import, as
well as the export, is the terms of trade. However, the effects greatly depend on the export and
import conditions.
Effects of changes in exchange rates - in this case the appreciation √√to the increased
exports and decreased imports will in turn improve the trade balance, balance of payment, and
furthermore the output √ when the Marshall-Lerner condition is met.
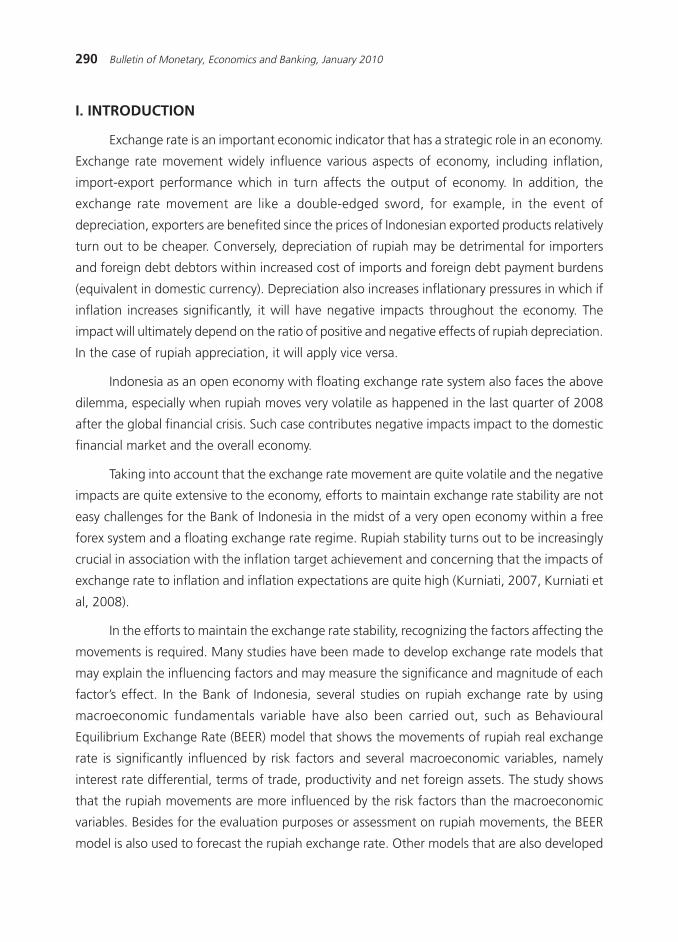
To close the equation system, an identity equation namely the national revenue is utilized:
Y = C + I + G + (X – M). Visually, simultaneous connections between all variables involved are
illustrated in the following scheme:
Scheme III.1Simultaneous Equation Model
EXCHANGERATE
NET FOREIGNSUPPLY-DEMAND
NET DOMESTICSUPPLY-DEMAND
R I S K
REGIONALCURRENCY
IMPORT
EXPORT
EXCHANGERATE
G D P
INFLATION
CONSUMPTION INVESTMENT
EXPORTPRICE
FOREIGNDEMAND
Oil Price

300 Bulletin of Monetary, Economics and Banking, January 2010
Table III.1Summary for the Endogeneity Test Results
ERForeign SDDomestic SDRISKNEERINTERNATIONAL POIL PDOMESTIC PIMPORT PPEXPORTTOTINTERNATIONAL IPIMPORT
Y Y Y YY Y Y Y Y YY Y Y Y Y Y
Y Y Y Y Y Y Y Y YY Y Y Y Y Y Y
Y Y Y Y Y YY Y Y Y Y Y Y Y Y Y
Y Y Y YY Y Y Y Y
Y Y Y Y YY Y Y Y Y YY Y Y Y Y Y
Y YY Y Y
III.2. Initial Identification
Endogeneity test and the order and rank condition of identification (or also known as the
order condition) is firstly conducted to identify a simultaneous model. Granger causality test
results indicate that there is an endogeneity in the equation (See Table 4.7). The order condition
test is conducted by following a procedure of Gujarati (1995), namely, K - k > m - 1, where K is
the number of predetermined variables in the model, k is the number of predetermined variables
in certain equations, m is the number of endogenous variables in certain equations. When (K -
k) s = (m - 1), it may be said that the equation is exactly identified or properly identified, and if
(K - k) > (m - 1), it may be said that the equation is over identified. Conversely, when (K - k) <
(m - 1), it is concluded that the equation is under identified and cannot be estimated.
In the system of simultaneous equation above there are 11 predetermined variables and
six endogenous variables. Following the identification procedure of order condition, the overall
equation is over-identified.
By using other formulations - namely (K-M)> (G-1), where K is the number of variables
used in the system (17), M is the number of variables specified in certain equation (6), and G is
the total of equation (6), thus (17-6)> (6-1) - the same conclusion is also obtained, namely over-
identified. Since the estimate result of order condition shows that partial equation in the system
of simultaneous equation is over identified, the estimate will use Two Stage Least Square method.
The estimate result for each of these equations is discussed as the following below.
ERERERERER ForeignForeignForeignForeignForeignSDSDSDSDSD
DomesticDomesticDomesticDomesticDomesticSDSDSDSDSD RISKRISKRISKRISKRISK NEERNEERNEERNEERNEER INTERNATIONAL PINTERNATIONAL PINTERNATIONAL PINTERNATIONAL PINTERNATIONAL P OIL POIL POIL POIL POIL P DOMESTIC PDOMESTIC PDOMESTIC PDOMESTIC PDOMESTIC P IMPORT PIMPORT PIMPORT PIMPORT PIMPORT P EXPORTEXPORTEXPORTEXPORTEXPORTPPPPP TOTTOTTOTTOTTOT INTERNATIONAL IP INTERNATIONAL IP INTERNATIONAL IP INTERNATIONAL IP INTERNATIONAL IP IMPORTIMPORTIMPORTIMPORTIMPORT

301Effects of Foreign Exchange Supply and Demand Dynamics to Rupiah Exchange Rateand Economic Performance
III.3. Data
By considering various models of the above equations to be estimated, the data to be
used covers:
- Rupiah exchange rate against US dollar (IDR), source: Bloomberg,
- Supply and demand transactions of forex, source: LHBU,
- Foreign assets ratio against foreign liability of bank (FA / FL), source: DSM,
- EMBIG index as the risk indicator, source: JP Morgan-Chase,
- Currency exchange rates of some trading partners processed to be a composite index of
nominal exchange rate (NEER), source: Bloomberg
- The customer price index (CPI), source: DSM,
- Import prices index (Pm), source: DSM,
- Inflation of trading partner countries, source: CEIC
- World oil price, source: Bloomberg,
- GDP, source: BPS
- Terms of trade, source: DSM,
- US Industrial Production Index, source: CEIC.
Estimate of the model will use monthly data during the observation periods from January
2004 to December 2008. Particularly, a forex market practice analysis will use daily data of
forex transactions within observation periods from January 2004 to April 2009.
IV. ESTIMATE AND ANALYSIS RESULTS
IV.1. Forex Market Review
In accordance with the microstructure analysis of forex market there are some interesting
findings obtained from the development, characteristics and behaviour of the forex market
and market participants. Such intended findings include: imbalanced forex market developments;
foreign players, although their transaction is not the largest but able to influence the other
market participants; a «hot money»»indication of foreign participant fund coming into the forex
market (capital inflows); asymmetric impact of inflows and outflows against the exchange rate
movement; and the transaction patterns between the market participants. These findings will
be described further hereunder.
IV.1.1. Forex Market DevelopmentsIV.1.1. Forex Market DevelopmentsIV.1.1. Forex Market DevelopmentsIV.1.1. Forex Market DevelopmentsIV.1.1. Forex Market Developments
Forex market has been developing well enough and able to support the economic activities,
especially those related to international trade and cross-border investment. Forex market

302 Bulletin of Monetary, Economics and Banking, January 2010
transaction volume averagely increases about 25.9% (yoy, in the periods of 2004 to 2008),
whereas the export and the import grows averagely 11.1% and 11.5% (Figure III.1). However,
rapid growth only occurs at a spot transaction segment where the highest monthly transaction
volume reaches USD 72 billion (September 2008), or averagely amounting to USD 3.3 billion
per day, before sharply decreases during the explosion of global financial crisis in October 2008
(Figure III.2).
The development of spot transactions, especially in 2008, may also be seen from the
value and frequency increase (number of transactions) of spot transactions. Value and frequency
of each spot transaction rises 10.3% and 80.6% (compared to 2007) to be USD 506.6 billion
and 3.4 million times of transactions. Meanwhile, although the spot transaction value tends to
decrease at the end of 2008, for entire 2008, the average daily transaction increases 12.2% to
be USD 2.1 billion.
Meanwhile, swap and forward transactions are relatively stagnant (Figure III.2). Swap
transaction volume drops dramatically since the enactment of swap transaction restriction without
relying on the economic activities in mid 2005. The third market share of such segment contains
about 77% of spot transactions, 19% of currency swap transactions, and 4% of forward
transactions.
Less balanced development also occurs in forex transactions based on the currency traded.
Trade transactions of US dollars (USD) against rupiah dominate the market within an average
market share reaching 76% (Figure III.3). Trade of other strong currencies, such as Euro and
Japanese Yen, only have a share of 1% respectively. Such composition is in line with Indonesia»s
Figure III.1.Growth of GDP, Export, Import and Forex
Market Volume
Figure III.2.Development of Forex Transactions
-60
-40
-20
0
20
40
60
80
-5
0
5
10
15
20
25
% %
GDP Export Import Fx Market Volume (rhs)
Mar Jun Sep Dec2005
Mar Jun Sep Dec2006
Mar Jun Sep Dec2007
Mar Jun Sep Dec2008
0
10,000
20,000
30,000
40,000
50,000
60,000
70,000
80,000
USD Million
FOREX MARKETTRANSACTION
Jan May Sep2004
Jan May Sep2005
Jan May Sep2006
Jan May Sep2007
Jan May Sep2008
Jan2009
SPOT
FORWARD
SWAP

303Effects of Foreign Exchange Supply and Demand Dynamics to Rupiah Exchange Rateand Economic Performance
Figure III.3.Development of Forex Transactions Composition
Based on Currency
Table III.2 Composition ofExport-Import Transaction
Based on Currency
Non-oil/gas exportsNon-oil/gas exportsNon-oil/gas exportsNon-oil/gas exportsNon-oil/gas exportsUSD - US$ 93.3SGD - SINGAPORE $ 2.0EUR - EURO 1.7JPY - JAPANESE YEN 1.6others 1.4
Non-oil/gas importsNon-oil/gas importsNon-oil/gas importsNon-oil/gas importsNon-oil/gas importsUSD - US$ 83.7SGD - SINGAPORE $ 4.8JPY - JAPANESE YEN 4.6EUR - EURO 4.1others 2.9
Type of CurrencyType of CurrencyType of CurrencyType of CurrencyType of CurrencyShare (%)Share (%)Share (%)Share (%)Share (%)
60
65
70
75
80
85
90
95
100USD EUR GBPJPY SGD
SHARE of FOREX TRANSACTIONby CURRENCY
%
Jan Apr Jul Oct2006
JanJan Apr Jul Oct2007
Jan Apr Jul Oct2008 2009
international trade that mostly (93% of the total exports and 83.7% of the total imports) uses
US dollars for payment (Table III.2). In addition, the composition of the Indonesian Foreign debt
is also dominated by foreign currency in US dollars. Private foreign debt as of February 2009 in
the form of US dollar reaches 88% or equivalent to USD 53 billion. Meanwhile, the second
largest proportion is about 9% in Yen.
IV.1.2. Market Participants/Players
Forex market participants may basically be separated into two major groups, namely (1)
market makers who act as the market and (2) market participants who act as the counterpart
to conduct forex transactions with the market makers. Market makers, which in the scope of
this study are banks classified as State Banks, Private Forex Banks, Private Non-Forex Banks,
Regional Development Banks, Joint Banks and Foreign Banks. Banks function as the market
since they tend to be neutral to the long/short position of forex. Such bank neutrality is because
the risk management of banks tends to be risk averse, prudential regulation of net open position
(NOP) that restricts the forex position of banks, and banks receive purchase/supply orders of
foreign currency so it allows them to distribute demand and supply to the entire market.
Meanwhile, the counterpart of banks may be classified into corporation, individual customer,
and foreign players.
Market participants considered significant or called as significant players are market
participants having a special role in the forex market. For the market makers, foreign banks are
InformationInformationInformationInformationInformation
Periods of 2006-2008

304 Bulletin of Monetary, Economics and Banking, January 2010
considered as significant players since they have the largest network of transactions, including
becoming a gateway for foreign players to enter into domestic financial markets. Such large
network allows foreign banks to make the market share to be over 41% of the total transactions
(Figure III.4). Development of Foreign Bank market share is relatively stable of over 40% since
2003. Private Forex Bank market share tends to decline and is replaced by State Banks and Joint
Banks whose market shares increase (Figure III.5).
Figure III.4.Bank Group»s Market Share
Figure III.5.Market Share Growth
Foreign BankJoint BankState BankReg.Devl. BankPrivate Fx BankPrivate Non-Fx Bank
Forex Transaction by Bank Group
41%
13%
17%
0.13%
27%
2%
0
10
20
30
40
50
2002 2003 2004 2005 2006 2007 2008
FOREIGN BANKFOREX NATIONAL PRIVATE BANK
STATE-OWNED BANKJOINT BANK
%
Although foreign banks have the highest market share, the highest market share of
individual banks is obtained by Bank Mandiri (limited liability company bank) whose market
share reaches 8.7% of the total forex transactions in 2008. Foreign banks having significant
market share consist of Standard Chartered Bank, Citibank, HSBC, ABN Amro Bank, Deutsche
Bank and JP Morgan Chase.
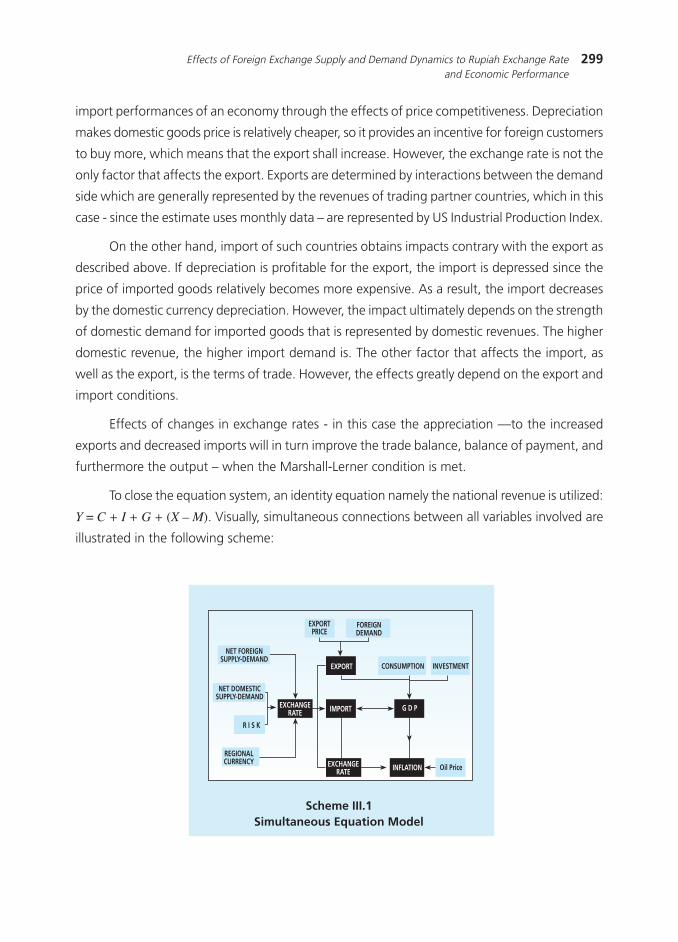
For counterpart bank group, foreign (foreign) player group is a significant player even
though its market share (25%) is lower than the market shares of interbank transactions (35%)
and corporation (28%) groups (Figure III.6). Predicate as significant players is more because the
quite large transactions of foreign players whose transaction value during the observation
period reaches USD 1.6 million in average (compared to domestic players, which is only USD
242 thousand per transaction). This allows foreign players able to influence exchange rates and
to formulate exchange rate expectation which in turn may influence the forex transactions of
other market participants. Forex transactions of foreign players are concentrated within foreign
banks as the main partners have the market share that reaches about 80% of the total foreign
player transactions (Figure III.7).
305Effects of Foreign Exchange Supply and Demand Dynamics to Rupiah Exchange Rateand Economic Performance
Figure III.6.Counterpart Bank Market Share
Figure III.7.Bank Transaction Share by Partner
(average of 2006-2008)
Interbank
Corporation
Individual
Offshore
FOREX TRANSACTIONBY GROUP OF COUNTERPART
35%
28%12%
25%
120
80
60
40
20
0
%
Foreign Partner Partner Domestic
ForeignBank
JointBank
Forex NationalPrivate Bank
ForeignBank
JointBank
State-ownedBank
Forex NationalPrivate Bank
One thing should be concerned from the structure of forex market participants is the
dominance of few market participants. In market makers group, forex market is dominated
only by some banks, where 10 large banks control around 62% of the total transactions of
forex market. In case the list of largest banks is extended to be 20 largest banks, the market
share raises to be 87% of the total forex transactions. Similar to the market makers group, the
forex transactions of foreign player group are also dominated by some players only, where 10
to 20 foreign players with the largest forex transactions have a market share of 56% and 73%
of the total forex transactions made by foreign players. In the corporation group, the value is
relatively more homogeneous, in which 10 corporations having the largest forex transactions
own a portion of 29%, whereas the 20 largest corporations has a market share of approximately
34%. However, in this group, in fact, there is a very dominant market player, namely Pertamina.
IV.1.3. Characteristics of the Market Participants
Forex market participants have different behaviours and roles. One factor to distinguish
the characteristics of market participants is the motivation to conduct forex transactions. Most
market participants do so in order to support or related to their business activities, for example,
exporters regularly sell forex generated from the proceeds of their export activities, importers
buy forex to pay their imported goods, foreign debt debtors buy forex to pay off their debts,
foreign investment companies sell forex coming from the operational funds of their parent
companies abroad, and so on. Transactions whose economic motivations such like this are
often called as genuine demand or genuine supply. The implication of such genuine transaction
motivation to the behaviour of market participants tends persistently to be one-way transactions
306 Bulletin of Monetary, Economics and Banking, January 2010
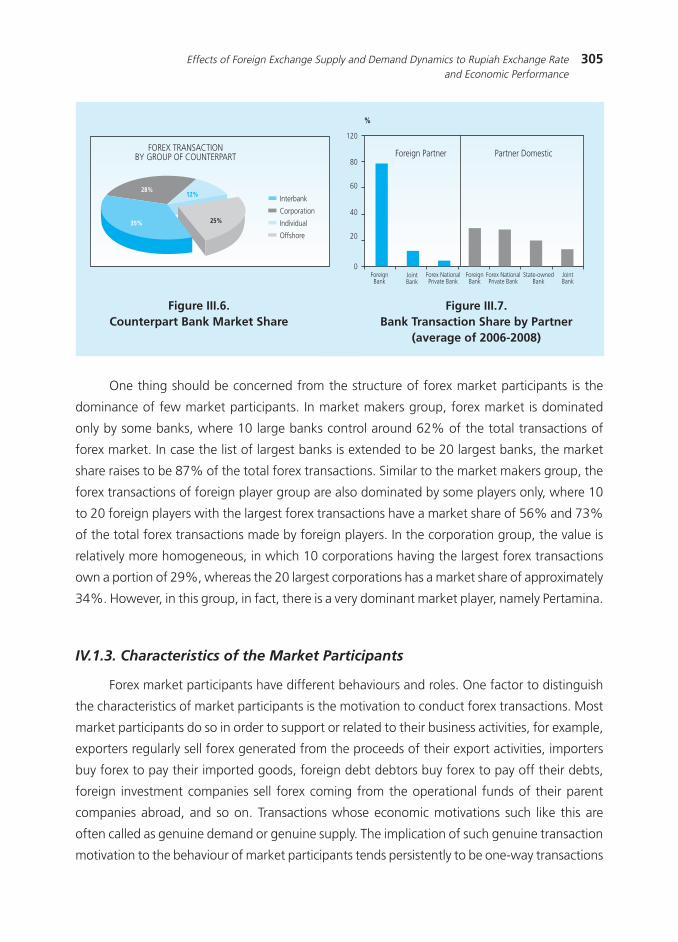
Figure III.8.Trading Indications by Foreign Players
83.9
7.42.7 1.5 0.1 0.6 0.6 0.2 0.3 2.8
0
20
40
60
80
100
0-10 20-30 40-50 60-70 80-9010-20 30-40 50-60 70-80 90-100
FOREX TRANSACTIONby OFFSHORE PLAYERS
Ratio of NetForex Sell-Buy toTotal Transaction
Trading GenuineTransaction
%
(sell only or buy only), thus the difference between forex selling and buying transactions (net of
transactions in absolute terms) conducted closes to the total transactions (sales + purchases).
On the other hand, some market participants conduct forex transactions to obtain profits
from two-way transactions - sale and purchase √√conducted in a short period, even in one day
(intraday). Such kind of transactions is often called as trading and full of speculative nuance. Its
implication to forex transactions is: the total transaction is quite high - the sale and purchase
frequency is relatively high - but its position finally tends to be square position (buy ~ sell). Since
it is not based on certain underlying permanent economic activity, forex transactions of foreign
players become very flexible √√may switch the roles quickly from net supply to net demand, or
vice versa - in order to maximize profits.
Referring to the distinction on the characters of market participants, behaviour of foreign
players is fairly the same, namely forex transactions that lead to trading. This is indicated by the
ratio between net purchases to the total transactions that is close to zero, even the majority
(84%) of the total forex transactions of foreign players are in the range of lowest ratio, namely
less than 10% (Figure III.8). Such Similar behaviour of foreign players is because almost all
foreign players who actively conduct forex transactions are international financial institutions
or institutional investors whose primary goal is to invest in domestic financial markets.
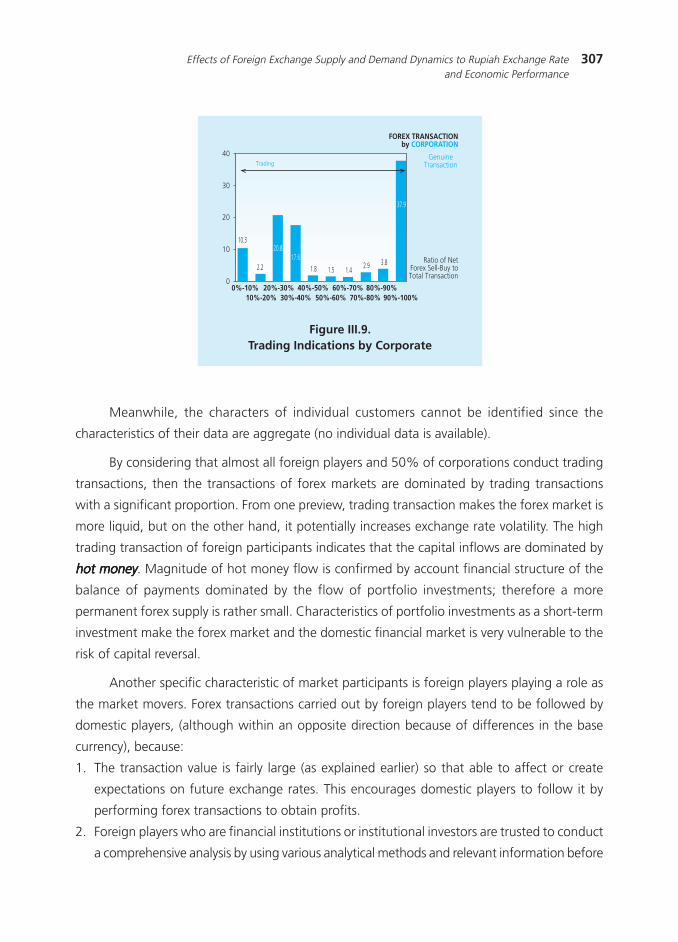
Corporation group is divided into two within almost balanced proportion, 53% of
corporation tends to perform trading and 47% are likely to conduct forex transactions due to
genuine demand/supply (Figure III.9). Corporations whose forex transactions are encouraged
by genuine demand/supply are generally those engaging in real sectors (such as Pertamina,
PLN, and Indofood), while those that perform trading transactions are financial institutions.
307Effects of Foreign Exchange Supply and Demand Dynamics to Rupiah Exchange Rateand Economic Performance
Figure III.9.Trading Indications by Corporate
0%-10% 20%-30% 40%-50% 60%-70% 80%-90%10%-20% 30%-40% 50%-60% 70%-80% 90%-100%
FOREX TRANSACTIONby CORPORATION
Ratio of NetForex Sell-Buy toTotal Transaction
TradingGenuine
Transaction
0
10
20
30
40
10.3
2.2
20.817.6
1.8 1.5 1.42.9 3.8
37.9
Meanwhile, the characters of individual customers cannot be identified since the
characteristics of their data are aggregate (no individual data is available).
By considering that almost all foreign players and 50% of corporations conduct trading
transactions, then the transactions of forex markets are dominated by trading transactions
with a significant proportion. From one preview, trading transaction makes the forex market is
more liquid, but on the other hand, it potentially increases exchange rate volatility. The high
trading transaction of foreign participants indicates that the capital inflows are dominated by
hot moneyhot moneyhot moneyhot moneyhot money. Magnitude of hot money flow is confirmed by account financial structure of the
balance of payments dominated by the flow of portfolio investments; therefore a more
permanent forex supply is rather small. Characteristics of portfolio investments as a short-term
investment make the forex market and the domestic financial market is very vulnerable to the
risk of capital reversal.
Another specific characteristic of market participants is foreign players playing a role as
the market movers. Forex transactions carried out by foreign players tend to be followed by
domestic players, (although within an opposite direction because of differences in the base
currency), because:
1. The transaction value is fairly large (as explained earlier) so that able to affect or create
expectations on future exchange rates. This encourages domestic players to follow it by
performing forex transactions to obtain profits.
2. Foreign players who are financial institutions or institutional investors are trusted to conduct
a comprehensive analysis by using various analytical methods and relevant information before

308 Bulletin of Monetary, Economics and Banking, January 2010
Figure III.10.Net Capital Flows and
Volatility Developments of Rupiah
0
20
40
60
80
100
120
140
160
-4,000,000
-3,000,000
-2,000,000
-1,000,000
0
1,000,000
2,000,000
3,000,000
4,000,000Net Flows Volatilitas
Volatility,%USD Thousand
Jan Mar May Jul Sep Nov Jan Mar May Jul Sep Nov Jan Mar
2007 2007 2009
deciding to conduct a transaction. Therefore, most of the domestic players cannot do the
same; they tend to follow transactions done by foreign players.
To support the above hypothesis a Granger causality test is conducted by using daily data
samples for the periods of January 2004 - April 2009 and intraday data (minute to minute
transactions) for several periods representing specific conditions in the forex market. The first is
the period of May 2007 that represents a condition in which the forex market experiences net
capital inflows in large numbers. April 2008 period is chosen to represent the normal condition
of forex market where rupiah moves stabile (low volatility). Conversely, October 2008 period is
chosen to represent the forex market condition during the crisis, namely when the sub-prime
mortgage crisis in the US (Figure III.10) explodes.
Development of transactions in the forex markets during such three specified periods
may be viewed in Table III.3 below. In general, the value of forex transactions of foreign players
(with the banks) is much smaller than the transaction value of domestic players, but the average
value per transaction is much bigger than the domestic players. One interesting thing is the
stable movement of rupiah exchange rate during April 2008 supported by the demand and
forex supply from foreign party (net supply) and domestic party (net demand) that are relatively
balanced (but the excess supply is $ 39 million). Meanwhile, the rupiah exchange rate during
May 2007 period is highlighted by the quite large net supply of foreign players (USD 1,9 billion),
hence rupiah tends to be strengthened. Unlike the two periods, the October 2008 period is a
crisis period within volatile exchange rates. Forex supply and demand conditions at that time
experiences excess demand - both from domestic and foreign players - amounting to $ 2,4
billion.

309Effects of Foreign Exchange Supply and Demand Dynamics to Rupiah Exchange Rateand Economic Performance
Test results for a long period (January 2004 - April 2009) show that forex transactions
conducted by foreign players lead to transactions performed by domestic players. In stable and
crisis periods, foreign players transactions remain to encourage domestic players transactions,
although within confidence level of 10%. Only in the period in which inflows occurs in a large
number, domestic players transactions actually influence the foreign players transactions - also
within confidence range of 10%.
Tabel III.3Forex Transactions Development in Certain Periods
Sale TransactionsSale TransactionsSale TransactionsSale TransactionsSale TransactionsBank vs. Foreign Player
Total Value of Transactions (USD thousands) 4,378,078 6,111,802 5,135,634Average per transaction (USD thousands) 3,491 4,192 3,401Number of Transactions (frequency) 1,254 1,458 1,510
Bank vs. Domestic PlayerTotal Value of Transactions (USD thousands) 25,330,557 19,960,854 19,708,011Average per transaction (USD thousands) 2,192 1,751 1,947Number of Transactions (frequency) 11,556 11,397 10,121
Purchase TransactionsPurchase TransactionsPurchase TransactionsPurchase TransactionsPurchase TransactionsBank vs. Foreign Player
Total Value of Transactions (USD thousands) 7,533,516 6,492,548 3,342,554Average per transaction (USD thousands) 3,198 2,498 1,789Number of Transactions (frequency) 2,356 2,599 1,868
Bank vs. Domestic PlayerTotal Value of Transactions (USD thousands) 24,093,852 19,618,986 19,054,528Average per transaction (USD thousands) 2,151 1,732 1,862Number of Transactions (frequency) 11,199 11,330 10,236
N e tN e tN e tN e tN e tBank VS Foreign Player (USD thousands) 3,155,438 380,745 -1,793,079Bank VS Domestic Player (USD thousands) -1,236,705 -341,868 -653,482Total Net (USD thousands) 1,918,734 38,877 -2,446,562
May-07May-07May-07May-07May-07 Apr-08Apr-08Apr-08Apr-08Apr-08 Oct-08Oct-08Oct-08Oct-08Oct-08
Note : Note: Forex spot transactions are 8.00 to 17.00Minus mark (-) of net transaction means net demand
Bank vs. Foreign PlayerNumber of Transactions (frequency) 1,841Value per transaction (USD thousands) 3,095
Bank vs. Foreign PlayerNumber of Transactions (frequency) 10,973Value per transaction (USD thousands) 1,939
Overall AverageOverall AverageOverall AverageOverall AverageOverall Average(Three Period)(Three Period)(Three Period)(Three Period)(Three Period)
Table III.4Causality Test Results: Foreign Players Transactions and Domestic Players Transactions
Jan 04 to Apr 09Jan 04 to Apr 09Jan 04 to Apr 09Jan 04 to Apr 09Jan 04 to Apr 09 May 2007May 2007May 2007May 2007May 2007 Apr 2008Apr 2008Apr 2008Apr 2008Apr 2008 Oct 2008Oct 2008Oct 2008Oct 2008Oct 2008
Net Concept (supply/demand)FP DP 2,47574 0,00453 0,38775 0,88729 1,403 0,09995 2,44601 0,08681DP FP 1,72918 0,06206 1,99501 0,06298 1,142 0,29166 0,54828 0,57800
F-StatF-StatF-StatF-StatF-Stat Prob.Prob.Prob.Prob.Prob. F-StatF-StatF-StatF-StatF-Stat Prob.Prob.Prob.Prob.Prob. F-StatF-StatF-StatF-StatF-Stat Prob.Prob.Prob.Prob.Prob. F-StatF-StatF-StatF-StatF-Stat Prob.Prob.Prob.Prob.Prob.
Note: For the periods of January 2004 to April 2009, daily data is used. For samples of three other periods, intraday data is used.
310 Bulletin of Monetary, Economics and Banking, January 2010
Figure III.11.Net Forex Supply and Demand
of Domestic Players
Figure III.12.Net Forex Supply and Demand
of Domestic Players and EMBIG Index
-3,5
-3
-2,5
-2
-1,5
-1
-5
0
5
1
1,5
USD Million
Corporations
IndividualsAll Domestic
DOMESTIC NET FOREX SUPPLY-DEMAND
Jan May Sep2004
Jan May Sep2005
Jan May Sep2006
Jan May Sep2007
Jan May Sep2008
Jan2009
Jan May Sep2004
Jan May Sep2005
Jan May Sep2006
Jan May Sep2007
Jan May Sep2008
Jan2009
0
100
200
300
400
500
600
700
800
-5
-4
-3
-2
-1
0
1
2
3
4
5
OFFSHORE PLAYERS
USD Million
OFFSHORE NET FOREX SUPPLY-DEMAND
EMBIG
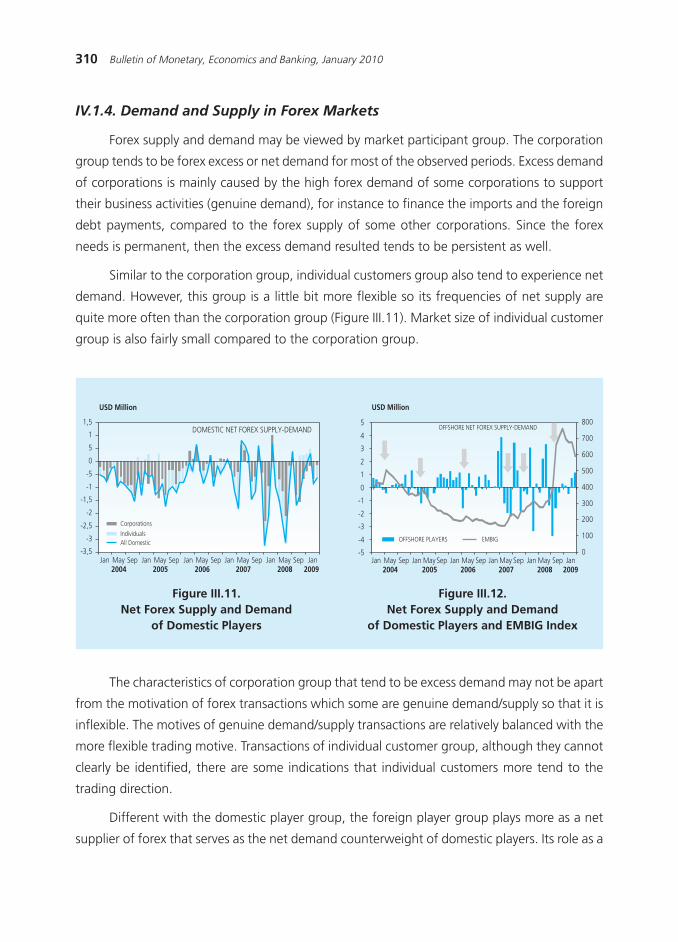
IV.1.4. Demand and Supply in Forex Markets
Forex supply and demand may be viewed by market participant group. The corporation
group tends to be forex excess or net demand for most of the observed periods. Excess demand
of corporations is mainly caused by the high forex demand of some corporations to support
their business activities (genuine demand), for instance to finance the imports and the foreign
debt payments, compared to the forex supply of some other corporations. Since the forex
needs is permanent, then the excess demand resulted tends to be persistent as well.
Similar to the corporation group, individual customers group also tend to experience net
demand. However, this group is a little bit more flexible so its frequencies of net supply are
quite more often than the corporation group (Figure III.11). Market size of individual customer
group is also fairly small compared to the corporation group.
The characteristics of corporation group that tend to be excess demand may not be apart
from the motivation of forex transactions which some are genuine demand/supply so that it is
inflexible. The motives of genuine demand/supply transactions are relatively balanced with the
more flexible trading motive. Transactions of individual customer group, although they cannot
clearly be identified, there are some indications that individual customers more tend to the
trading direction.
Different with the domestic player group, the foreign player group plays more as a net
supplier of forex that serves as the net demand counterweight of domestic players. Its role as a

311Effects of Foreign Exchange Supply and Demand Dynamics to Rupiah Exchange Rateand Economic Performance
counterweight contributes positive impacts to the exchange rate movement that tends to be
stronger and more stable. Although the forex market as a whole is still experiencing excess
demand, the forex supply may encourage rupiah appreciation.
Figure III.13.Net Forex Supply and Demand and
Exchange Rate
Grafik III.14.Net Capital Flows and
Foreign Portfolio Investment
7,000
8,000
9,000
10,000
11,000
12,000
13,000-5
-4
-3
-2
-1
0
1
2
3
4
5
USD Million Rp/USD
Jan MaySep2004
Jan May Sep2005
Jan May Sep2006
Jan MaySep2007
Jan MaySep2008
Jan2009
Domestic Net S-DOffshore Net S-DOverall Net S -DIDR/USD
-4
-3
-2
-1
0
1
2
3
4
SBI SUN Stock
USD Million
Net Flows
Jan May Sep2004
Jan May Sep2005
Jan May Sep2006
Jan May Sep2007
Jan May Sep2008
Jan2009
Behind the positive effects of foreign forex supply, there are also inherent problems in
this supply, namely the characteristics of foreign fund flow as hot moneyhot moneyhot moneyhot moneyhot money. Funds of foreign
players are placed in rupiah financial asset (portfolio investment), which is very liquid, such as
the Bank of Indonesia Certificates (SBI), Government Securities (SUN) and stocks. Figure III.14
shows the development and magnitude of net capital flows that are relatively the same as the
foreign portfolio investments in three rupiah financial assets, namely the Bank of Indonesia
Certificates (SBI), government securities (SUN) and stocks. Another alternative for foreign investors
to invest in Indonesia is by placing their money in the money market or used it in forex trading.
The character of hot money as a very short-term investment is shown in the chart below
where inflows and outflows
occur alternately with each other in the fairly similar amount. For example, net inflows
occured in the periods of March 2007 - May 2007 reaches USD 6.0 billion, followed by a period
of net outflows by nearly similar amount of USD 5.5 billion.

312 Bulletin of Monetary, Economics and Banking, January 2010
Figure III.15 Net Capital Flows and ForeignPortfolio Investment
# of Events 708 601Offshore's Net Fx S-D (avg, $ mio) 97,449 -98,761Domestic Net Fx Supply-Demand
Domestic Net Fx Supply 12.99% 56.41%# of Events 92 339Amount (avg, $ mio) 33.46 78.62
Domestic Net Fx Demand 87.01% 43.59%# of Events 616 262Amount (avg, $ mio) -101.48 -56.63
Exchange Rate NovementsAppreciation 66.08% 29.29%
# of Events 450 169Average 0.43% 0.28%
Depreciation 33.92% 70.71%# of Events 231 408Average -0.26% -0.50%
Exch. Rate Volatility (avg) 10.25% 12.14%
Cap. InflowsCap. InflowsCap. InflowsCap. InflowsCap. Inflows Cap. OutflowsCap. OutflowsCap. OutflowsCap. OutflowsCap. Outflows
EVENTEVENTEVENTEVENTEVENT
# of Events 708 601Offshore's Net Fx S-D (avg, $ mio) 97,449 -98,761Domestic Net Fx Supply-Demand
Domestic Net Fx Supply 12.99% 56.41%# of Events 92 339Amount (avg, $ mio) 33.46 78.62
Domestic Net Fx Demand 87.01% 43.59%# of Events 616 262Amount (avg, $ mio) -101.48 -56.63
Exchange Rate NovementsAppreciation 66.08% 29.29%
# of Events 450 169Average 0.43% 0.28%
Depreciation 33.92% 70.71%# of Events 231 408Average -0.26% -0.50%
Exch. Rate Volatility (avg) 10.25% 12.14%
Cap. InflowsCap. InflowsCap. InflowsCap. InflowsCap. Inflows Cap. OutflowsCap. OutflowsCap. OutflowsCap. OutflowsCap. Outflows
E V E N TE V E N TE V E N TE V E N TE V E N T
Table III.4Forex Market Trend during inflows
and outflows Period
# of Events 708 601Offshore's Net Fx S-D (avg, $ mio) 97,449 -98,761Domestic Net Fx Supply-Demand
Domestic Net Fx Supply 12.99% 56.41%# of Events 92 339Amount (avg, $ mio) 33.46 78.62
Domestic Net Fx Demand 87.01% 43.59%# of Events 616 262Amount (avg, $ mio) -101.48 -56.63
Exchange Rate NovementsAppreciation 66.08% 29.29%
# of Events 450 169Average 0.43% 0.28%
Depreciation 33.92% 70.71%# of Events 231 408Average -0.26% -0.50%
Exch. Rate Volatility (avg) 10.25% 12.14%
Cap. InflowsCap. InflowsCap. InflowsCap. InflowsCap. Inflows Cap. OutflowsCap. OutflowsCap. OutflowsCap. OutflowsCap. Outflows
EVENTEVENTEVENTEVENTEVENT
# of Events 670 639% change (avg) 0.36% -0.41%Exch. Rate Volatility (avg) 10.76% 11.50%Domestic Net Fx Supply-Demand
Domestic Net Fx Supply 15.97% 0.70%# of Events 107 324Amount (avg, $ mio) 45.46 76.75
Domestic Net Fx Demand 84.03% 49.30%# of Events 563 315Amount (avg, $ mio) -102.95 -61.53
Capital Flows (Offshore Net S-D)Capital Inflows 71.19% 36.15%
# of Events 477 231Avg., $ mio 117.96 55.09
Capital Outflows 28.81% 63.85%# of Events 193 408Average -68.35 -113.15
AppreciationAppreciationAppreciationAppreciationAppreciation DepreciationDepreciationDepreciationDepreciationDepreciation
E V E N TE V E N TE V E N TE V E N TE V E N T
Table III.5Forex Market Trend during Appreciation
and Depreciation Periods
-400
-200
0
200
400
600
800
1,000
-200
-100
0
100
200
300
400
500
USD MillionUSD Million
Jan Mar May Jul Sep Nov2007
Jan Mar May Jul Sep Nov2008
Jan Mar2009
Net Flows (rhs) Outflows Inflows
As a result of its characteristic as a short-term investment, foreign investors may withdraw
their funds at any time, as occurred in some periods where the risk factor increases. When
outflows arise, rupiah is depreciated, while its movements are more volatile. Based on the
313Effects of Foreign Exchange Supply and Demand Dynamics to Rupiah Exchange Rateand Economic Performance
historical data, in the event of inflows, there is 66% chance of rupiah appreciation, whereas
the appreciation occurred is relatively smooth so that the volatility resulted is on the average of
10% only. However, when outflows occur, the opportunity of rupiah depreciation is slightly
larger (71%) and the level of depreciation is much sharper as reflected in the average volatility
of outflow period that achieves approximately 12%. From the above description, the asymmetric
impact of the inflows and outflows may be seen. One of the factors that cause such asymmetric
impact is the domestic supply and demand conditions that tend to be excess demand. Therefore,
the foreign forex supply must firstly mend the domestic excess demand before encouraging
the rupiah appreciation.
IV.1.5. Transaction Pattern Between the Market Participant Groups
Forex transactions conducted by forex market participants formulate a general pattern
that is fairly persistent in the observed periods. In addition, although it is not able to identify
the occurrence of market segmentation, such transaction pattern indicates that the market is
only dominated by a small part of market players. In the market maker group, the market is
controlled by foreign banks (by six banks only), government banks (three banks) and only few
banks from the joint bank group (1 bank) and private forex bank. These banks control around
86% of the market share, while the remaining is contested by more than 100 other domestic
banks.
Associated with the transaction pattern, foreign banks become the biggest bank group
which have access to all market participants. In fact, more than 80% of bank transactions with
foreign players are served by foreign banks, so that foreign banks become the «gate» of foreign
players to enter the domestic financial market. Under normal circumstances, foreign players
become the forex suppliers for foreign banks and other banking groups. In addition, foreign
banks also receive larger forex supply from corporations. Forex supply is almost exclusively
distributed by foreign banks to other banks, especially state banks and private forex banks.
Overall, foreign banks experience sufficiently large excess demand.
Limited liability company banks, in addition to receiving forex supply from foreign players
(directly) and foreign banks, they also gain a large amount of forex supply from individual
customers. The forex supply is distributed to meet the forex demand of corporations (including
Pertamina), which is very large, so that the overall state banks also experiences forex flow
deficit.
The only banks group experiencing a surplus of forex supply is the private forex banks.
This group receive a forex supply from all groups of banks, except the private non-forex banks,

314 Bulletin of Monetary, Economics and Banking, January 2010
Table III.6Forex Transaction Pattern Between the Market Participant Groups
ALL PeriodALL PeriodALL PeriodALL PeriodALL Period FOREIGNFOREIGNFOREIGNFOREIGNFOREIGN JOINT BANKJOINT BANKJOINT BANKJOINT BANKJOINT BANK STATE BANKSTATE BANKSTATE BANKSTATE BANKSTATE BANK PRIVATE FXPRIVATE FXPRIVATE FXPRIVATE FXPRIVATE FX ALL BANKALL BANKALL BANKALL BANKALL BANKBANKBANKBANKBANKBANK BANKBANKBANKBANKBANK
FOREIGN BANK 0 -756,207 3,985,576 16,813,438 20,042,807JOINT BANK 663,807 0 -1,607,367 11,019,864 10,076,304STATE BANK -3,985,576 1,551,367 0 10,361,111 7,926,902PRIVATE FX BANK -16,817,638 -11,078,014 -10,361,111 0 -38,256,763REG DEVL BANK -548,785 -1,750 193,175 588,686 231,326PRIVATE Non-FX BANK -629,034 -602,332 -454,428 -328,135 -2,013,929CORPORATION 11,404,656 5,020,344 -48,475,487 -3,142,302 -35,192,789INDIVIDUAL -2,076,875 862,379 11,558,071 -24,633,484 -14,289,909OFFSHORE 2,421,232 2,212,527 2,736,218 2,916,468 10,286,445
-9,568,213 -2,791,686 -42,425,353 13,595,646
NET FOREX BUY and SELL BYNET FOREX BUY and SELL BYNET FOREX BUY and SELL BYNET FOREX BUY and SELL BYNET FOREX BUY and SELL BY
NET
FO
REX
SELL
and
BU
Y B
Y
ALL PeriodALL PeriodALL PeriodALL PeriodALL Period FOREIGNFOREIGNFOREIGNFOREIGNFOREIGN JOINT BANKJOINT BANKJOINT BANKJOINT BANKJOINT BANK STATE BANKSTATE BANKSTATE BANKSTATE BANKSTATE BANK PRIVATE FXPRIVATE FXPRIVATE FXPRIVATE FXPRIVATE FX ALL BANKALL BANKALL BANKALL BANKALL BANKBANKBANKBANKBANKBANK BANKBANKBANKBANKBANK
FOREIGN BANK 0 -679,223 -1,859,500 -567,760 -3,106,483JOINT BANK 679,223 0 -1,327,475 809,148 160,896STATE BANK 1,859,500 1,327,475 0 1,929,275 5,116,250PRIVATE FX BANK 567,760 -809,148 -1,929,275 0 -2,170,663REG DEVL BANK 41,365 0 -35,060 12,150 18,455PRIVATE Non-FX BANK -46,811 -114,680 -102,200 -46,737 -310,428CORPORATION 229,960 -11,399 -2,780,567 -893,360 -3,455,366INDIVIDUAL 85,342 -23,719 425,388 -264,810 222,201OFFSHORE -2,671,868 500,799 100,839 267,014 -1,803,216
744,471 190,105 -7,507,850 1,244,920
NET FOREX BUY and SELL BYNET FOREX BUY and SELL BYNET FOREX BUY and SELL BYNET FOREX BUY and SELL BYNET FOREX BUY and SELL BY
NET
FO
REX
SELL
and
BU
Y B
Y
and the foreign players directly. The forex supply is utilized to meet the forex demands of
corporations and individual customers, while the surplus increases the forex reserves of this
bank group.
In crisis conditions, as happened in the last quarter of 2008, the flow pattern direction of
forex transactions as described above is reversed, so that foreign bank group and joint bank
group experience an excess supply. Meanwhile, the state banks continue to have deficits (as in
normal conditions) and the private forex banks experience a supply surplus. This condition
indicates an imbalance distribution of forex, although it is still possible to be balanced through
various other channels, such as transfers of funds or through PUAB.

315Effects of Foreign Exchange Supply and Demand Dynamics to Rupiah Exchange Rateand Economic Performance
IV.2. Estimate Results
IV.2.1. Exchange Rate Equation
In accordance with the processing result by using the ECM method, factors influencing
the exchange rate both in long and short terms are recognized. For a long term, the net forex
supply from foreign players is the only factor affecting the exchange rate movement. 1%
increase in the net forex supply of foreign players will lead to the exchange rate appreciation of
0.06%.
Meanwhile, for a short term, risk factor is the main factor influencing the exchange
rate movement. Regression coefficient of risk factor of 0.70 that implies each worse risk
where the risk index increase of 1% will cause rupiah exchange rate depreciation of 0.70%.
The processing results show that the sentiment of market participants to the forex market is
still dominated.
The second factor significantly influencing is the regional exchange rate movement of
0.46. The regional exchange rate indexes are the composite indexes of Japanese, Europe, and
Singapore currencies, which represent the regional exchange rates. Nugroho et .all (2008)
show that the movements of such four currencies have strong correlation with rupiah movements,
as shown in the following chart.
Figure III.16.Development of Rupiah and
Euro Exchange Rates
Figure III.17.Development of Rupiah and
Singapore Dollar Exchange Rates
1.3
1.2
1.1
1
0.9
0.8
0.7
0.6
EUR IDR Thousand
13
12
11
10
9
8
72000 2000 2001 2002 2003 2004 2005 2006 2007 2008
EUR/USDIDR/USD
1.8
1.7
1.6
1.5
1.4
1.3
SGD IDR Thousand
13
12
11
10
9
8
72000 2000 2001 2002 2003 2004 2005 2006 2007 2008
SGD/USDIDR/USD
left side
right side
Moreover, the demand and supply factors affect the exchange rates significantly within
composition as follows:

316 Bulletin of Monetary, Economics and Banking, January 2010
Table III.8Estimate Results of Exchange Rate Equation
FOREIGN SDFOREIGN SDFOREIGN SDFOREIGN SDFOREIGN SD FOREIGN SD (-1)FOREIGN SD (-1)FOREIGN SD (-1)FOREIGN SD (-1)FOREIGN SD (-1) DOMESTIC SDDOMESTIC SDDOMESTIC SDDOMESTIC SDDOMESTIC SD SD DOMESTIC (-1)SD DOMESTIC (-1)SD DOMESTIC (-1)SD DOMESTIC (-1)SD DOMESTIC (-1) R I S KR I S KR I S KR I S KR I S K NEERNEERNEERNEERNEER
-0.07*** -0.06*** -0.04*** -0.07 -0.05*** -0.03*** 0.18 0.76*** -0.48 0.55*** -0.34***(0.02) (0.01) (0.01) (0.06) (0.02) (0.02) (0.16) (0.20) (0.31) (0.21 ) (0.17 )
Long TermLong TermLong TermLong TermLong Term Short TermShort TermShort TermShort TermShort Term Long TermLong TermLong TermLong TermLong Term Short TermShort TermShort TermShort TermShort Term Long TermLong TermLong TermLong TermLong Term Short TermShort TermShort TermShort TermShort Term Long TermLong TermLong TermLong TermLong Term Short TermShort TermShort TermShort TermShort Term Long TermLong TermLong TermLong TermLong Term Short TermShort TermShort TermShort TermShort Term Long TermLong TermLong TermLong TermLong Term Short TermShort TermShort TermShort TermShort TermCoef. ofCoef. ofCoef. ofCoef. ofCoef. of
adjusmentadjusmentadjusmentadjusmentadjusment
R-squared 84% 83%DW stat 1.72 1.56
Short RunShort RunShort RunShort RunShort Run Long RunLong RunLong RunLong RunLong Run
a. Foreign demand and supply influence the coefficient of 0.06 in the current period and 0.04
in the past. The temporary influence of supply and demand is greater in the present. These
results are consistent with the theory of simultaneous-trade model that the current behaviour
of market participants is information for the future market participants who will then perform
a similar behaviour. In addition, these results are also consistent with the previous analysis
that shows the influence of domestic player»s behaviour to the foreign players. This means
that the greater coefficient of today is the accumulation of current information and past
player information for among foreign players and domestic players.
b. Domestic supply and demand affect the current coefficient of 0.05. Past behaviour does not
affect the current condition, showing that all market information has been absorbed in
period t. However, it is necessary to consider that the effects of domestic supply and demand
are smaller than the foreign demand and supply. This test clarifies the results of the previous
analysis. Market share of foreign players in forex trading within a denomination of USD/IDR
is still in the range of 40% and uses foreign banks in carrying out the transactions. Meanwhile,
the relevance of foreign banks as the main partner of domestic banks increases. Large
magnitude of foreign players to domestic players may also come from the trading behaviour
tendency of foreign players, so that greater changes in exchange rates show greater expected
gain/loss for foreign players as well. Meanwhile, domestic players tend to make real
transactions, thus the forex purchases and sales are not only influenced by changes in the
exchange rates, but it is also due to forex needs.
The following table shows the test results of an exchange rate model (by fulfilling the
BLUE assumption) in long and short terms.

317Effects of Foreign Exchange Supply and Demand Dynamics to Rupiah Exchange Rateand Economic Performance
IV.2.2. Output Equation
Output equation is an identity function of the variables of consumption, investment,
government, exports, and imports. Variables of consumption, investment and government are
exogenous variables in the formation of output, while variables of imports and exports are
specified in the (endogenous) model.
a. Export
As described in the methodology, the export equation used is the function of exchange
rates, revenue of trading partner, and terms of trade (the export prices compared to the import
prices). In the export equation, a processing method using ECM is conducted also since some
exogenous variables are not stationary in the level but have a long-term cointegration.2 Processing
results in the long term show that the growth variable of trading partner (growth composite of
major trading partners such as Japan, USA, and Singapore) is the main factor affecting Indonesia»s
exports. This is in accordance with the fact that these three countries own shares that reach
44.58% of the total Indonesia»s exports. High concentration of those three countries results in
strong dependence of Indonesia»s exports on them.
Meanwhile, for a short term, the most export movement influencing factor is the price
factor shown by the terms of trade. 1% increase of export price (relative to the import price)
causes a decrease of exports amounting to 2.2%.
Furthermore, the other export affecting factor is the change of exchange rates. Exchange
rate depreciation will cause the price of exported goods in the international market is relatively
cheaper, thereby, it may increase the exports. Moreover, the coefficient of data processing is
1.185, in which 1% increase of exchange rate will cause 1.19% increase of exports. This
equation also shows the effect of exchange rates to the exports directly or indirectly. The indirect
way is through the more expensive price of imported goods due to the increase of exchange
rates; therefore, the price of exported goods becomes cheaper and ultimately enhances the
exports.
The test results of exchange rate model (by satisfying the BLUE assumption) both in long
and short terms may be concluded as the following table:
2 Stationary, heterocedasticity, autocorrelation, stationary and residual normality tests are presented in the appendix.

318 Bulletin of Monetary, Economics and Banking, January 2010
Table III.10.Estimate Results of Import Equation
Term of TradeTerm of TradeTerm of TradeTerm of TradeTerm of Trade Production IndexProduction IndexProduction IndexProduction IndexProduction Index Exchange RateExchange RateExchange RateExchange RateExchange Rate
-1.25** 0.87 0.15 0.65*** 0.06 -1.00** -0.44***(0.56) (0.58) (0.29) (0.08) (0.30) (0.38) (0.08)
Long TermLong TermLong TermLong TermLong Term Short TermShort TermShort TermShort TermShort Term Long TermLong TermLong TermLong TermLong Term Short TermShort TermShort TermShort TermShort Term Long TermLong TermLong TermLong TermLong Term Short TermShort TermShort TermShort TermShort TermCoef. ofCoef. ofCoef. ofCoef. ofCoef. of
adjusmentadjusmentadjusmentadjusmentadjusment
R-squared 76% 86%DW stat 2.52 2.57
Short RunShort RunShort RunShort RunShort Run Long RunLong RunLong RunLong RunLong Run
b. Import
Import equation is also the functions of exchange rate, terms of trade (export prices
compared with import prices), and growth of Indonesia. Based on the processing results by
using the ECM, it is obtained that for the long term the most influencing factor to the movement
of imports in Indonesia is the relative price between the exports and the imports. 1% increase
of the terms of trade may cause a 1.25% decrease of imports. Meanwhile, in the short term,
the most influencing factor to the imports is the change of exchange rates. 1% depreciation of
exchange rate may lead to 1% decrease of imports as well. Another factor that affects the
movement of imports is the economic growth, in which 1% increase of Indonesia»s economic
growth causes an increase of imports amounting to 0.64%. Unlike the previous export equation,
which indicates a direct effect of exchange rates to the exports and the exchange rate effects
are transmitted through the terms of trade, in this import equation, the effects of exchange
rate have direct impacts to the import movements, while for the short term there are no indirect
effects through the terms of trade.
The test results of the exchange rate model (by satisfying the BLUE assumption) both in
long and short terms may be concluded in the following table:
Table III.9.Estimate Results of Export Equation
Term of TradeTerm of TradeTerm of TradeTerm of TradeTerm of Trade Production IndexProduction IndexProduction IndexProduction IndexProduction Index Exchange RateExchange RateExchange RateExchange RateExchange Rate
-0.65 -2.2* 1.91*** 0.57 0.21 1.19* -0.61***(0.56) (1.23) (0.35) (0.50) (0.18) (0.64) (0.15)
Long TermLong TermLong TermLong TermLong Term Short TermShort TermShort TermShort TermShort Term Long TermLong TermLong TermLong TermLong Term Short TermShort TermShort TermShort TermShort Term Long TermLong TermLong TermLong TermLong Term Short TermShort TermShort TermShort TermShort TermCoef. ofCoef. ofCoef. ofCoef. ofCoef. of
adjusmentadjusmentadjusmentadjusmentadjusment
R-squared 60% 64%DW stat 2.06 2.18
Short RunShort RunShort RunShort RunShort Run Long RunLong RunLong RunLong RunLong Run

319Effects of Foreign Exchange Supply and Demand Dynamics to Rupiah Exchange Rateand Economic Performance
3 The results of Kurniati»s (2008) study found exchange rate pass through for 0.20 in short term during a post-crisis period.
IV.3.2. Price Equation
a. Import prices
This equation is used to view the relationship between exchange rates and prices of
imports. The test results by using ECM shows that in the long term, the most influencing factor
to Indonesia»s import prices is
the international prices, in which 1% increase of international prices leads to an increase
in import prices of 0.99%. The second factor affecting the long term is the change of exchange
rate, with the effect of 0.42. This exchange rate pass-through figure is consistent with the
findings of Kurniati (2008) obtaining the exchange rates affect against import prices of 0.45 at
a post-crisis period.
Meanwhile, in the short term, exchange rate is most influencing factor to the import
prices within a coefficient of 0.333, followed by the supply shock factor (oil price) with a coefficient
of 0.20. When compared with the previous study, the effects of exchange rate to the import
price movements increasingly get higher, especially in the short term. It means that, as mentioned
earlier due to the large magnitude of foreign supply and demand against exchange rate, it will
also impacts the import price pressures.
The test results of exchange rate model (by satisfying the BLUE assumption) both in long
and short terms may be concluded in the following table:
Tabel III.11.Estimate Results of Import Price Equation
International PriceInternational PriceInternational PriceInternational PriceInternational Price Exchange RateExchange RateExchange RateExchange RateExchange Rate Supply StockSupply StockSupply StockSupply StockSupply Stock G D PG D PG D PG D PG D P
0.99** 0.67 0.42*** 0.33*** 0.20*** 0.21*** 0.02 0.01 -0.26**(0.39) (0.61) (0.13) (0.08) (0.03) (0.03) (0.02) (0.02) (0.12)
Long TermLong TermLong TermLong TermLong Term Short TermShort TermShort TermShort TermShort Term Long TermLong TermLong TermLong TermLong Term Short TermShort TermShort TermShort TermShort Term Long TermLong TermLong TermLong TermLong Term Short TermShort TermShort TermShort TermShort Term Long TermLong TermLong TermLong TermLong Term Short TermShort TermShort TermShort TermShort TermCoef. ofCoef. ofCoef. ofCoef. ofCoef. of
adjusmentadjusmentadjusmentadjusmentadjusment
R-squared 73% 99%DW stat 1.79 2.06
Short RunShort RunShort RunShort RunShort Run Long RunLong RunLong RunLong RunLong Run

320 Bulletin of Monetary, Economics and Banking, January 2010
Table III.12.Indonesia Main Import Commodities, 2000-2008
1 Oil and its derivates2 Organic chemicals3 Iron and steel4 Industrial machinery and the equipments5 Special industrial machinery6 Wheat and processed wheat7 Plastic materials8 Engine power9 Textile fibres and the remaining10 Weaving yarn, textile fabrics, and the products11 Other chemicals12 Pulp and Paper13 Ferrous metal14 Other metal items15 Animal feeds16 Inorganic chemicals17 Metal ores and metal remnants18 Dyes and other colouring19 Sugar, refined sugar and20 Honeymilk and egg products
Average ShareAverage ShareAverage ShareAverage ShareAverage Share(2000-2008)(2000-2008)(2000-2008)(2000-2008)(2000-2008)
28%8%6%6%5%3%3%3%3%3%3%2%2%2%2%1%1%1%1%1%
No. No. No. No. No. CommoditiesCommoditiesCommoditiesCommoditiesCommodities
b. Customer Prices
The second round effect by the presence of changes in exchange rates is pressure on
overall prices. Because of such increased prices of imported goods, the overall prices of the
economy increase as well. In the long term, the price influencing factor of the economy is
Indonesia»s economic growth, namely 1% increase of economic growth causes 0.01% increase
of price. Meanwhile, in the short term, changes in the domestic prices are caused by the
increased price of imported goods, namely 1% increase of imported goods price may cause
0.05% increase of domestic prices. The analysis result presents the existence of the high level
of import dependence for the overall production activities.
When viewing the table III.12 above in more details, the main imported goods coming to
Indonesia are mostly consist of the main goods of manufacturing industry, such as oil and
processed products, organic chemicals, iron and steel. These goods are the main commodity of
industrial production in Indonesia, so in case any subsequent change of exchange rates leads to

321Effects of Foreign Exchange Supply and Demand Dynamics to Rupiah Exchange Rateand Economic Performance
Table III.13.Estimate Results of Customer Price Equation
Import PriceImport PriceImport PriceImport PriceImport Price G D PG D PG D PG D PG D P Supply ShockSupply ShockSupply ShockSupply ShockSupply Shock
-0.01 0.05* -0.01*** 0.00 -0.00 0.01 -0.08(0.02) (0.03) (0.00) (0.00) (0.00) (0.01) (0.20)
Long TermLong TermLong TermLong TermLong Term Short TermShort TermShort TermShort TermShort Term Long TermLong TermLong TermLong TermLong Term Short TermShort TermShort TermShort TermShort Term Long TermLong TermLong TermLong TermLong Term Short TermShort TermShort TermShort TermShort TermCoef. ofCoef. ofCoef. ofCoef. ofCoef. of
adjusmentadjusmentadjusmentadjusmentadjusment
R-squared 85% 99%DW stat 1.81 2.22
Short RunShort RunShort RunShort RunShort Run Long RunLong RunLong RunLong RunLong Run
IV.2.4. Simultaneous Model Simulation
Based on the incorporation of partial models, it is obtained an adjustment result between
the baseline and the actual as viewed in Figure III.18. From such figure, it may be seen that
most of the baseline (data on estimates of the partial models) may estimate the magnitude of
actual figures. For the equations of exchange rates, import prices and domestic prices, the
partial equations are able to capture the actual data movement well. However, during some
periods, especially for the export equation, the partial models cannot capture the actual data
movement perfectly although the direction the actual data movement may fairly be captured.
Furthermore, from the results of processing using a simultaneous model, several simulations
are performed, especially related to the increase/decrease of domestic and overseas forex demand
and supply such as follows:
1. The scenario of changes in the demand and forex supply is in the form of forex supply and
demand increase that reaches 20%. The simulation of a forex supply increase of 20%
coming from foreign players causes the exchange rate appreciation of 4.44% followed by
changes in the other macro variables. Similarly, 20% increase of forex demand generated
from the abroad may also lead to the exchange rate depreciation of 4.68% followed by
changes in other macro variables. Based on the data processing results, it may be seen that
the impacts of foreign forex supply increase are smaller than the impacts of foreign forex
demand increase. This shows a greater opportunity on the rupiah depreciation for each
increase of foreign forex demand.
increased pressure of import prices, they will also give strong impacts to the domestic prices.
The test results of exchange rate model (by satisfying the BLUE assumption) both in long and
short terms may be concluded in the following table.

322 Bulletin of Monetary, Economics and Banking, January 2010
When viewing the impacts of other macroeconomic variables, it may be seen that the
impacts of depreciation contributes higher to the export variables, while appreciation contributes
greater to the import variables. Furthermore, other variables such as GDP, import prices and
domestic prices have the same effects at the time of appreciation or depreciation. Entirely, the
simulation results of two scenarios may be seen in the table below:
Figure III.18.Simultaneous Model of 6 Partial Equations
13000
12000
11000
10000
9000
80002004 2005 2006 2007 2008
ActualER (Baseline)
ER
2004 2005 2006 2007 2008
ActualM (Baseline)
M10000
9000
8000
7000
6000
5000
4000
3000
2000
2004 2005 2006 2007 2008
ActualP (Baseline)
P150
140
130
120
110
100
902004 2005 2006 2007 2008
ActualPM (Baseline)
PM280
240
200
160
110
120
80
2004 2005 2006 2007 2008
ActualX (Baseline)
X35000
30000
25000
20000
15000
100002004 2005 2006 2007 2008
ActualY (Baseline)
Y190000
180000
170000
160000
150000
140000
130000
120000

323Effects of Foreign Exchange Supply and Demand Dynamics to Rupiah Exchange Rateand Economic Performance
2. The change scenario of demand and forex supply is in the form of forex supply and demand
decrease that reaches 20%. Based on the simulation of such scenario, it may be seen that
the impact of forex supply decreased by foreign parties (leading to rupiah depreciation) is
Cap. InflowsCap. InflowsCap. InflowsCap. InflowsCap. Inflows Cap. OutflowsCap. OutflowsCap. OutflowsCap. OutflowsCap. Outflows
EVENTEVENTEVENTEVENTEVENT
Table III.15.Increase on Foreign Demand by 20%
10274 4.68%9815
8155.6 -2.98%8405.7
142.2 0.14%142
227.5 1.79%223.5
28669 2.36%28008
174989 0.52174078
ERERERERERScenario 2Scenario 2Scenario 2Scenario 2Scenario 2BaselineBaselineBaselineBaselineBaseline
MMMMMScenario 2Scenario 2Scenario 2Scenario 2Scenario 2BaselineBaselineBaselineBaselineBaseline
PPPPPScenario 2Scenario 2Scenario 2Scenario 2Scenario 2BaselineBaselineBaselineBaselineBaseline
PMPMPMPMPMScenario 2Scenario 2Scenario 2Scenario 2Scenario 2BaselineBaselineBaselineBaselineBaseline
XXXXXScenario 98152Scenario 98152Scenario 98152Scenario 98152Scenario 98152
BaselineBaselineBaselineBaselineBaselineYYYYY
Scenario 2Scenario 2Scenario 2Scenario 2Scenario 2BaselineBaselineBaselineBaselineBaseline
Cap. InflowsCap. InflowsCap. InflowsCap. InflowsCap. Inflows Cap. OutflowsCap. OutflowsCap. OutflowsCap. OutflowsCap. Outflows
EVENTEVENTEVENTEVENTEVENT
Table III.14.Increase on Foreign Supply by 20%
9379 4.44%9815
8667.5 3.11%8405.7
141.8 -0.14%142
219.5 -1.79%223.5
273.66 -22.9%28008
173174 -0.52%174078
ERERERERERScenario 1Scenario 1Scenario 1Scenario 1Scenario 1BaselineBaselineBaselineBaselineBaseline
MMMMMScenario 1Scenario 1Scenario 1Scenario 1Scenario 1BaselineBaselineBaselineBaselineBaseline
PPPPPScenario 1Scenario 1Scenario 1Scenario 1Scenario 1BaselineBaselineBaselineBaselineBaseline
PMPMPMPMPMScenario 1Scenario 1Scenario 1Scenario 1Scenario 1BaselineBaselineBaselineBaselineBaseline
XXXXXScenario 1Scenario 1Scenario 1Scenario 1Scenario 1BaselineBaselineBaselineBaselineBaseline
YYYYYScenario 1Scenario 1Scenario 1Scenario 1Scenario 1BaselineBaselineBaselineBaselineBaseline
Cap. InflowsCap. InflowsCap. InflowsCap. InflowsCap. Inflows Cap. OutflowsCap. OutflowsCap. OutflowsCap. OutflowsCap. Outflows
EVENTEVENTEVENTEVENTEVENT
Table III.16.Decline on Foreign Supply by 20%
10381 5.77%9815
8101.2 -3.62%8405.7
142.2 0.14%1.42
228.4 2.19%223.5
28820 2.90%28008
175195 0.64%174078\
E RE RE RE RE RScenario 3Scenario 3Scenario 3Scenario 3Scenario 3
BaselineBaselineBaselineBaselineBaselineMMMMM
Scenario 3Scenario 3Scenario 3Scenario 3Scenario 3BaselineBaselineBaselineBaselineBaseline
PPPPPScenario 3Scenario 3Scenario 3Scenario 3Scenario 3
BaselineBaselineBaselineBaselineBaselineP MP MP MP MP M
Scenario 3Scenario 3Scenario 3Scenario 3Scenario 3BaselineBaselineBaselineBaselineBaseline
XXXXXScenario 3Scenario 3Scenario 3Scenario 3Scenario 3
BaselineBaselineBaselineBaselineBaselineYYYYY
Scenario 3Scenario 3Scenario 3Scenario 3Scenario 3BaselineBaselineBaselineBaselineBaseline
Cap. InflowsCap. InflowsCap. InflowsCap. InflowsCap. Inflows Cap. OutflowsCap. OutflowsCap. OutflowsCap. OutflowsCap. Outflows
EVENTEVENTEVENTEVENTEVENT
Table III.17.Decline on Foreign Demand by 20%
9285 -5.40%9815
8727.8 3.83%8405.7
141.8 -0.14%142
218.6 -2.19%223.5
27225 -2.80%28008
172973 0.63%174078
E RE RE RE RE RScenario 4Scenario 4Scenario 4Scenario 4Scenario 4
BaselineBaselineBaselineBaselineBaselineMMMMM
Scenario 4Scenario 4Scenario 4Scenario 4Scenario 4BaselineBaselineBaselineBaselineBaseline
PPPPPScenario 4Scenario 4Scenario 4Scenario 4Scenario 4
BaselineBaselineBaselineBaselineBaselineP MP MP MP MP M
Scenario 4Scenario 4Scenario 4Scenario 4Scenario 4BaselineBaselineBaselineBaselineBaseline
XXXXXScenario 4Scenario 4Scenario 4Scenario 4Scenario 4
BaselineBaselineBaselineBaselineBaselineYYYYY
Scenario 4Scenario 4Scenario 4Scenario 4Scenario 4BaselineBaselineBaselineBaselineBaseline

324 Bulletin of Monetary, Economics and Banking, January 2010
Cap. InflowsCap. InflowsCap. InflowsCap. InflowsCap. Inflows Cap. OutflowsCap. OutflowsCap. OutflowsCap. OutflowsCap. Outflows
EVENTEVENTEVENTEVENTEVENT
Table III.19.Domestic Demand Increase of 20%
9893 0.79%9815
8361.5 0.53%8405.7
142 0.00%142
224.1 0.27%\223.5
28121 0.40%28008
174236 0.09%174078
ERERERERERScenario 2Scenario 2Scenario 2Scenario 2Scenario 2BaselineBaselineBaselineBaselineBaseline
MMMMMScenario 2Scenario 2Scenario 2Scenario 2Scenario 2BaselineBaselineBaselineBaselineBaseline
PPPPPScenario 2Scenario 2Scenario 2Scenario 2Scenario 2BaselineBaselineBaselineBaselineBaseline
PMPMPMPMPMScenario 2Scenario 2Scenario 2Scenario 2Scenario 2BaselineBaselineBaselineBaselineBaseline
XXXXXScenario 98152Scenario 98152Scenario 98152Scenario 98152Scenario 98152
BaselineBaselineBaselineBaselineBaselineYYYYY
Scenario 2Scenario 2Scenario 2Scenario 2Scenario 2BaselineBaselineBaselineBaselineBaseline
Cap. InflowsCap. InflowsCap. InflowsCap. InflowsCap. Inflows Cap. OutflowsCap. OutflowsCap. OutflowsCap. OutflowsCap. Outflows
EVENTEVENTEVENTEVENTEVENT
Table III.18.Domestic Supply Increase of 20%
9738 -0.78%9815
8450.3 0.53%8405.7
142 0.00%142
222.8 0.31%223.5
27895 0.40%28008
173921 -0.09%174078
ERERERERERScenario 5Scenario 5Scenario 5Scenario 5Scenario 5BaselineBaselineBaselineBaselineBaseline
MMMMMScenario 5Scenario 5Scenario 5Scenario 5Scenario 5BaselineBaselineBaselineBaselineBaseline
PPPPPScenario 5Scenario 5Scenario 5Scenario 5Scenario 5BaselineBaselineBaselineBaselineBaseline
PMPMPMPMPMScenario 5Scenario 5Scenario 5Scenario 5Scenario 5BaselineBaselineBaselineBaselineBaseline
XXXXXScenario 5Scenario 5Scenario 5Scenario 5Scenario 5BaselineBaselineBaselineBaselineBaseline
YYYYYScenario 5Scenario 5Scenario 5Scenario 5Scenario 5BaselineBaselineBaselineBaselineBaseline
greater than the impact of forex demand decrease. Similar to the first scenario, it may be
viewed that the impact of rupiah depreciation more influences the exports, while rupiah
appreciation more influences the imports.
3. The change scenario of domestic demand and forex supply is in the form of 20% increase
of forex supply and 20% increase of foreign currency demand. The amount of depreciation
caused by an increase of domestic forex demand amounting to 0.79% is greater than the
appreciation due to the increase of foreign forex supply amounting to 0.78%. Unlike the
impact of foreign forex supply and demand changes affecting the variables of exports and
imports, changes in domestic forex supply and demand may cause changes in the import
prices, where the effect of appreciation is greater than the effect of exchange rate
depreciation. Meanwhile, other macroeconomic variables have the same effects. Another
interesting finding is the influence of changes in foreign forex supply and demand that is
greater than changes in domestic forex supply and demand. The value of such difference
ranges between 3-4%. This proves that the Indonesian forex market is vulnerable to the
movement of domestic forex supply and demand.
4. The scenario of changes in domestic demand and forex supply is in the form of 20% decrease
of forex supply and 20% decrease of foreign currency demand. This scenario shows that
although in net they have the same behaviour, depreciation caused by the supply decrease
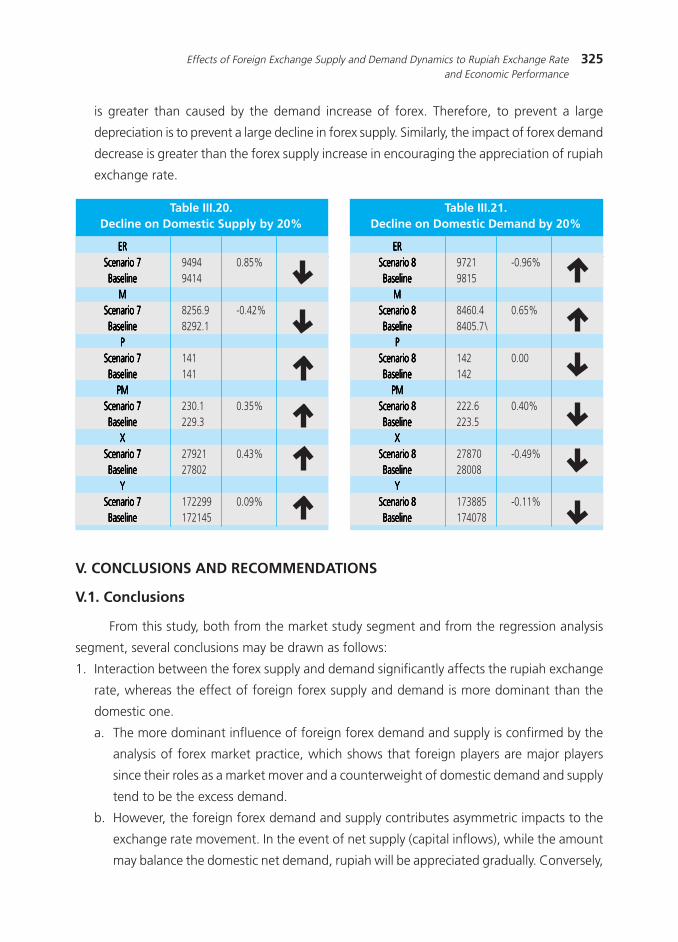
325Effects of Foreign Exchange Supply and Demand Dynamics to Rupiah Exchange Rateand Economic Performance
is greater than caused by the demand increase of forex. Therefore, to prevent a large
depreciation is to prevent a large decline in forex supply. Similarly, the impact of forex demand
decrease is greater than the forex supply increase in encouraging the appreciation of rupiah
exchange rate.
Cap. InflowsCap. InflowsCap. InflowsCap. InflowsCap. Inflows Cap. OutflowsCap. OutflowsCap. OutflowsCap. OutflowsCap. Outflows
EVENTEVENTEVENTEVENTEVENT
Table III.20.Decline on Domestic Supply by 20%
9494 0.85%9414
8256.9 -0.42%8292.1
141141
230.1 0.35%229.3
27921 0.43%27802
172299 0.09%172145
ERERERERERScenario 7Scenario 7Scenario 7Scenario 7Scenario 7BaselineBaselineBaselineBaselineBaseline
MMMMMScenario 7Scenario 7Scenario 7Scenario 7Scenario 7BaselineBaselineBaselineBaselineBaseline
PPPPPScenario 7Scenario 7Scenario 7Scenario 7Scenario 7BaselineBaselineBaselineBaselineBaseline
PMPMPMPMPMScenario 7Scenario 7Scenario 7Scenario 7Scenario 7BaselineBaselineBaselineBaselineBaseline
XXXXXScenario 7Scenario 7Scenario 7Scenario 7Scenario 7BaselineBaselineBaselineBaselineBaseline
YYYYYScenario 7Scenario 7Scenario 7Scenario 7Scenario 7BaselineBaselineBaselineBaselineBaseline
Cap. InflowsCap. InflowsCap. InflowsCap. InflowsCap. Inflows Cap. OutflowsCap. OutflowsCap. OutflowsCap. OutflowsCap. Outflows
EVENTEVENTEVENTEVENTEVENT
Table III.21.Decline on Domestic Demand by 20%
9721 -0.96%9815
8460.4 0.65%8405.7\
142 0.00142
222.6 0.40%223.5
27870 -0.49%28008
173885 -0.11%174078
ERERERERERScenario 8Scenario 8Scenario 8Scenario 8Scenario 8BaselineBaselineBaselineBaselineBaseline
MMMMMScenario 8Scenario 8Scenario 8Scenario 8Scenario 8BaselineBaselineBaselineBaselineBaseline
PPPPPScenario 8Scenario 8Scenario 8Scenario 8Scenario 8BaselineBaselineBaselineBaselineBaseline
PMPMPMPMPMScenario 8Scenario 8Scenario 8Scenario 8Scenario 8BaselineBaselineBaselineBaselineBaseline
XXXXXScenario 8Scenario 8Scenario 8Scenario 8Scenario 8BaselineBaselineBaselineBaselineBaseline
YYYYYScenario 8Scenario 8Scenario 8Scenario 8Scenario 8BaselineBaselineBaselineBaselineBaseline
V. CONCLUSIONS AND RECOMMENDATIONS
V.1. Conclusions
From this study, both from the market study segment and from the regression analysis
segment, several conclusions may be drawn as follows:
1. Interaction between the forex supply and demand significantly affects the rupiah exchange
rate, whereas the effect of foreign forex supply and demand is more dominant than the
domestic one.
a. The more dominant influence of foreign forex demand and supply is confirmed by the
analysis of forex market practice, which shows that foreign players are major players
since their roles as a market mover and a counterweight of domestic demand and supply
tend to be the excess demand.
b. However, the foreign forex demand and supply contributes asymmetric impacts to the
exchange rate movement. In the event of net supply (capital inflows), while the amount
may balance the domestic net demand, rupiah will be appreciated gradually. Conversely,

326 Bulletin of Monetary, Economics and Banking, January 2010
in the event of rupiah net demand by the foreign party, it will be depreciated and the
movement is more volatile.
c. Foreign players tend to be relatively very flexible - able to switch quickly from the net
supply to the net demand, or vice versa - since the characteristic of forex transaction
activities is trading to support short-term investments of foreign investors (portfolio
investment). Meanwhile, the domestic players is divided in two parts, some of them
support the business activities of real sectors (genuine transactions) and others are trading
to gain profits.
2. Furthermore, the exchange rate affects the price developments and the economic output.
Effects of exchange rate to prices in the first round effect - namely from the exchange rates
to import prices - are quite strong and significant, but the second round effects to the
customer prices is more limited. Effects of exchange rate to the exports and imports are only
significant for the short term, mostly to the imports. Subsequently, exports and imports will
affect the economic output. In addition, the asymmetric impact of exchange rate also occurs
in the economy. The impact of exchange rate depreciation is greater than the impact of
exchange rate appreciation, primarily the direct impact to the exports and imports. This
difference causes the accumulation of different impacts on the economy.
3. Thus, the forex market faces several issues that potentially affect the exchange rate, namely:
a. Dependence of forex market and exchange rates against the forex supply of foreign
players is high, and has been met by the forex supply in short-term characteristic.
b. The high trading activity √√performed by almost all foreign players and some domestic
players - indicates the high speculation to the rupiah exchange rate.
c. The development of forex market is less balanced where only the spot market is growing,
while the forward and swap markets are stagnant. Undeveloped forward and swap
markets become an inefficient hedging, though hedging is greatly needed in the market
dominated by speculative activities. In addition, the need to perform forward or swap
transactions, in turn, becomes a burden to the spot market.
Above problems make the forex market and exchange rates are highly vulnerable to the
capital reversal and correction of exchange rate when the motion is due to speculative
transactions are not in line with economic fundamentals.
V.2. Policy Recommendations
The problems occurring in the forex market have a potential to make an unstable exchange
rate and further affect the inflation rate, exports and imports, and output. To minimize the
negative impacts, some measures of policies may be carried out as follows:
327Effects of Foreign Exchange Supply and Demand Dynamics to Rupiah Exchange Rateand Economic Performance
Balancing Forex Supply and Demand
1. The balancing efforts must begin with the monitoring demand and supply developments in
the forex market, including significant player activities, to anticipate the occurrence of
exchange rate imbalance and volatility. In the event of a significant imbalance, the balancing
efforts are required. The supply of forex demand should be conducted as follows:
a. increasing the domestic forex supply or decreasing the domestic forex demand.
Stages to reduce forex demand are relatively limited since the Bank of Indonesia does
not have the authority to restrict them. The only thing that BI can do is not intervening
in order to absorb forex from the market, and by coordinating with the Government to
advise that the purchase of forex by SOE should be restricted or the timing should be set,
for example, when a large amount of capital inflows occur. In contrast, BI can make
some efforts to increase the forex supply by selling forex interventions. BI needs to continue
the selling forex interventions that have been conducted regularly by still taking into
account the level of need (namely to meet the genuine demand) and the implementation
time (namely outflows occur and rupiah is depressed).
b. attracting more foreign forex supply, particularly the more permanent one (such as FDI,
export results that are placed abroad, worker remittances, foreign tourist extradition,
and so forth), or avoiding the capital reversal.
To prevent a reversal capital, there should be some efforts to maintain the condition or
portfolio investment climate in Indonesia to keep it attractive for foreign investors. Stages
may be done cover: maintaining the rupiah stability, maintaining the prudent and
transparent macroeconomic policies and coordinating with the government to encourage
the issuance of new investment instruments (adding alternative investment outlets).
Meanwhile, to attract more forex supply through FDI, worker remittances and foreign
tourists, it is necessary together with the government to create a conducive investment
climate, in order to attract more Indonesian workers who live abroad (especially those
trained and educated) and to increase the attractiveness of tourism in Indonesia. .
To Handle the High Forex Trading and To Promote the Hedging Market Growth
2. Amid the high trading activities that tend to be speculative, some efforts to protect the
genuine demand/supply are required, particularly the scheduled one, such as import
payments, export revenues and foreign debt payments, by developing the hedging markets
(forward and swap markets). Stages may be taken by BI consist of: activating forex intervention
more through forward and swap transactions, as well as making the existing re-swap hedging
facilities be more attractive to banks.
328 Bulletin of Monetary, Economics and Banking, January 2010
REFERENCES
Evans, Martin D.D., dan Richard K. Lyons. 2005. ≈Understanding Order Flow∆. Working Paper
#11748, NBER, Massachusetts.
Husman, Jardine A. 2005.∆≈Estimasi Nilai Tukar Paska Krisis: Pendekatan Model Komposit∆.
The Bank of Indonesia Working Paper 07/2005. Jakarta.
Kurniati, Yati, Tri Yanuarti dan Yanfitri. 2008. ≈Dampak Nilai Tukar terhadap Harga Impor dan
Inflasi Inti∆. The Bank of Indonesia, Catatan Riset 10/6/DKM/BRE/CR.
Kurniati, Yati, 2007. ∆Exchange Rate Pass-Through In Indonesia∆
Lyons, Richard K. 2001. ≈The Microstructure Approach to Exchange Rates∆. MIT Press,
Cambridge, Massachusetts.
Rime, Dagfinn, Lucio Sarno, dan Elvira Sojli. 2007. ≈Exchange Rate Forecasting, Order Flow,
and Macroeconomic Information∆. Oslo ANO 2007/2.