effects of immunosuppressive drugs on human adipose tissue
TRANSCRIPT

Effects of immunosuppressive drugs on human adipose tissue metabolism
Maria João Pereira
UNIVERSITY OF GOTHENBURG
The Lundberg Laboratory for Diabetes Research Department of Molecular and Clinical Medicine Institute of Medicine at Sahlgrenska Academy
University of Gothenburg, Sweden
2012

ISBN 978-91-628-8561-8 http://hdl.handle.net/2077/30256
© 2012 Maria João Pereira
Department of Molecular and Clinical Medicine The Sahlgrenska Academy at University of Gothenburg, Gothenburg, Sweden Printed by Ineko AB, Gothenburg, Sweden

To my family
Especially to my father,
who taught me the value of learning.

5
ABSTRACT The immunosuppressive agents (IAs) rapamycin, cyclosporin A and tacrolimus, as well as glucocorticoids are used to prevent rejection of transplanted organs and to treat autoimmune disorders. Despite their desired action on the immune system, these agents have serious long-term metabolic side-effects, including dyslipidemia and new onset diabetes mellitus after transplantation. The overall aim is to study the effects of IAs on human adipose tissue glucose and lipid metabolism, and to increase our understanding of the molecular mechanisms underlying the development of insulin resistance during immunosuppressive therapy. In Paper I and II, it was shown that rapamycin and the calcineurin inhibitors, cyclosporin A and tacrolimus, at therapeutic concentrations, had a concentration-dependent inhibitory effect on basal and insulin-stimulated glucose uptake in human subcutaneous and omental adipocytes. Rapamycin inhibited mammalian target of rapamycin complex (mTORC) 1 and 2 assembly and phosphorylation of protein kinase B (PKB) at Ser473 and of the PKB substrate AS160, and this leads to impaired insulin signalling (Paper I). On the other hand, cyclosporin A and tacrolimus had no effects on expression or phosphorylation of insulin signalling proteins (insulin receptor substrate 1 and 2, PKB, AS160), as well as the glucose transport proteins, GLUT4 and GLUT1 (Paper II). Instead, removal of GLUT4 from the cell surface was observed, probably mediated through increased endocytosis, as shown in L6 muscle-derived cells. These studies suggest a different mechanism for cyclosporin A and tacrolimus, in comparison to rapamycin, with respect to impairment of glucose uptake in adipocytes. In Paper III, all three IAs increased isoproterenol-stimulated lipolysis and enhanced phosphorylation of one of the main lipases involved in lipolysis, hormone-sensitive lipase. The agents also inhibited lipid storage, and tacrolimus and rapamycin down-regulated gene expression of lipogenic genes in adipose tissue. All three IAs increased interleukin-6 (IL-6), but not tumor necrosis factor α (TNF-α) or adiponectin, gene expression and secretion. In Paper IV, we proposed that FKBP5 is a novel gene regulated by dexamethasone, a synthetic glucocorticoid, in both subcutaneous and omental adipose tissue. FKBP5 expression in subcutaneous adipose tissue is correlated with clinical and biochemical markers of insulin resistance and adiposity. In addition, the FKBP5 gene product was more abundant in omental than in subcutaneous adipose tissue. In conclusion, adverse effects of immunosuppressive drugs on human adipose tissue glucose and lipid metabolism can contribute to the development of insulin resistance, type 2 diabetes and dyslipidemia in patients on immunosuppressive therapy. The cellular mechanisms that are described in this thesis should be further explored in order to mitigate the metabolic perturbations caused by current immunosuppressive therapies. The findings in this thesis could potentially also provide novel pharmacological mechanisms for type 2 diabetes as well as other forms of diabetes. Keywords: Cyclosporin A, tacrolimus, rapamycin, glucocorticoids, new onset diabetes after transplantation, adipocytes, insulin signalling, glucose uptake, lipolysis, lipogenesis ISBN 978-91-628-8561-8 http://hdl.handle.net/2077/30256 Gothenburg 2012

6
LIST OF PAPERS The thesis is based on the following papers, referred to in the text by their Roman numerals:
I. Maria J Pereira, Jenny Palming, Magnus Rizell, Manuel Aureliano, Eugénia Carvalho, Maria K Svensson, Jan W Eriksson
mTOR inhibition with rapamycin causes impaired insulin signalling and glucose uptake in human subcutaneous and omental adipocytes
Mol Cell Endocrinol 355:96-105, 2012
II. Maria J Pereira, Jenny Palming, Magnus Rizell, Manuel Aureliano, Eugénia Carvalho, Maria K Svensson, Jan W Eriksson
Cyclosporin A and tacrolimus reduce cell-surface amount of GLUT4 via increased endocytosis: a potential mechanism for the diabetogenic effects of immunosuppressive agents
Submitted (2012)
III. Maria J Pereira, Jenny Palming, Magnus Rizell, Manuel Aureliano, Eugénia Carvalho, Maria K Svensson, Jan W Eriksson
The immunosuppressive agents rapamycin, cyclosporin A and tacrolimus increase lipolysis, inhibit lipid storage and alter expression of genes involved in lipid metabolism in human adipocytes
Submitted (2012)
IV. Maria J Pereira*, Jenny Palming*, Maria K Svensson, Magnus Rizell, Jan Dalenbäck, Mårten Hammar, Per-Arne Svensson, Jan W Eriksson
Effects of dexamethasone on gene expression in human subcutaneous and omental adipose tissue - is FKBP5 a novel link between insulin resistance and immune modulation?
*these authors contributed equally Submitted (2012)

7
LIST OF ABBREVIATIONS AMPK 5’-AMP-activated protein kinase AS160 Protein kinase B substrate of 160 kDa ATGL Adipose triacylglycerol lipase BMI Body mass index CNR1 Cannabinoid receptor 1 DGAT Diacylglycerol acyltransferase ESRD End-stage renal disease FABP4/aP2 Fatty acid binding protein 4 FAS Fatty acid synthase FFA Free fatty acid FKBP5 FK506-binding protein 5 FKBP51 51 kDa FK506-binding protein GLUT1, 4 Glucose transporter 1, 4 HDL High-density lipoprotein HOMA-IR Homeostasis model assessment - insulin resistance HSL Hormone-sensitive lipase Hsp Heat shock protein IA Immunosuppressive agent IL-6 Interleukin-6 IR Insulin receptor IRS1, 2 Insulin receptor substrate 1, 2 LDL Low-density lipoprotein LPL Lipoprotein lipase MAPK Mitogen-activated protein kinase MGAT Monoacylglycerol acyltransferase mTOR Mammalian target of rapamycin mTORC1, 2 Mammalian target of rapamycin complex 1, 2 NFAT Nuclear factor of activated T cells NODAT New onset diabetes after transplantation p70S6K p70 ribosomal S6 kinase PCR Polymerase chain reaction PI3K Phosphatidylinositol 3-kinase PKA, B, C Protein kinase A, B, C PPARγ Peroxisome proliferator-activated receptor γ SEM Standard error of the mean SERTM1 Serine-rich and transmembrane domain containing 1 SREBP Sterol regulatory element-binding proteins Sin1 Stress-activated protein kinase interacting protein 1 TAG Triacylglycerol TIMP4 Metallopeptidase inhibitor 4 TNF-α Tumor necrosis factor α TSC Tuberous sclerosis complex VLDL Very-low density lipoprotein

8
TABLE OF CONTENTS Abstract ........................................................................................................................................... 5
List of papers .................................................................................................................................. 6
List of abbreviations ...................................................................................................................... 7
Table of contents ............................................................................................................................ 8
Introduction .................................................................................................................................... 9
Insulin resistance and diabetes ................................................................................................................. 9
Type 2 diabetes ..................................................................................................................................... 9
Drug-induced diabetes ........................................................................................................................ 10
Complications of diabetes ................................................................................................................... 10
Immunosuppressive drugs and adverse metabolic effects ....................................................................... 11
New-onset diabetes after transplantation (NODAT) ........................................................................... 11
Dyslipidemia ........................................................................................................................................ 13
Adipose tissue .......................................................................................................................................... 13
Storage of triglycerides........................................................................................................................ 14
Adipose tissue as an endocrine organ ................................................................................................. 16
Adipose tissue distribution and metabolic disease ............................................................................. 16
Insulin action in adipose tissue ............................................................................................................... 17
Glucocorticoids ....................................................................................................................................... 19
The calcineurin inhibitors, cyclosporin A and tacrolimus ...................................................................... 21
Effects of calcineurin inhibitors on glucose and lipid metabolism ...................................................... 21
The mTOR inhibitor rapamycin............................................................................................................... 22
mTOR signalling ................................................................................................................................... 23
Effects of mTOR signalling in adipose tissue: adipogenesis and lipid storage .................................... 25
Effects of rapamycin on glucose and lipid metabolism ....................................................................... 25
Aims ............................................................................................................................................... 27
Methods ......................................................................................................................................... 28
Subjects and samples ............................................................................................................................... 28
Adipocyte isolation and fat cell size ........................................................................................................ 29
Adipocyte and adipose tissue incubation ................................................................................................ 29
Glucose uptake assay .............................................................................................................................. 30
Protein extraction and immunoblotting ................................................................................................... 31
Gene expression ...................................................................................................................................... 32
Microarray ........................................................................................................................................... 32
Real-time PCR ...................................................................................................................................... 32
Lipolysis and lipid storage ...................................................................................................................... 33
GLUT4 trafficking in L6 cells.................................................................................................................. 33
Statistical analyses .................................................................................................................................. 34
Summary of results ...................................................................................................................... 35
Paper I ..................................................................................................................................................... 35
Paper II.................................................................................................................................................... 36
Paper III .................................................................................................................................................. 36
Paper IV .................................................................................................................................................. 38
Discussion ...................................................................................................................................... 39
Effects of rapamycin, cyclosporin A and tacrolimus on glucose uptake ................................................. 39
Effects of rapamycin, cyclosporin A and tacrolimus on insulin signalling ............................................. 41
Effects of rapamycin, cyclosporin A and tacrolimus on lipid metabolism .............................................. 44
Effects of dexamethasone on adipose tissue gene expression ................................................................. 46
Concluding remarks .................................................................................................................... 49
Acknowledgements ....................................................................................................................... 50
References ..................................................................................................................................... 52

Introduction
9
INTRODUCTION
Insulin resistance and diabetes
The term diabetes mellitus describes a metabolic disorder of multiple aetiology characterised by chronic hyperglycaemia, and resulting from defects in insulin secretion, insulin action, or both (1). Diabetes mellitus is classified on the basis of the pathogenic process that results on hyperglycemia or on the circumstances present at the time of diagnosis. There are four main types of diabetes mellitus: type 1, type 2, gestational diabetes and secondary diabetes. Typically type 1 diabetes results from autoimmune destruction of insulin-producing β-cells in the pancreas and type 2 diabetes from insulin resistance combined with insulin deficiency. Gestational diabetes is formally defined as glucose intolerance with onset or first recognition during pregnancy. The last group, so called secondary diabetes, includes genetic defects of β-cell function; diseases of the exocrine pancreas, such as pancreatitis or cystic fibrosis; other endocrinopathies (e.g., acromegaly); and pancreatic dysfunction and/or insulin resistance caused by drugs.
Type 2 diabetes
Type 2 diabetes is the most common form of diabetes and is caused by a combination of genetic and environmental factors (2). Currently, about 200 million people have type 2 diabetes, and the prediction is that by 2030 about 400 million people worldwide will have type 2 diabetes (3). The high prevalence of diabetes and its complications has vast socioeconomic consequences. The development of type 2 diabetes is usually preceded by impaired insulin sensitivity in skeletal muscle, adipose tissue and liver, a metabolic condition called insulin resistance and commonly driven by a sedentary lifestyle and obesity (2). As a consequence the β-cells in the pancreas produce more insulin to overcome the insulin resistance in peripheral tissues. Eventually β-cells fail to produce enough insulin to overcome insulin resistance, leading to hyperglycaemia and development of type 2 diabetes. Several factors have been proposed to contribute to insulin resistance, including increased circulating non-esterified fatty acids, inflammatory cytokines (e.g. tumor necrosis factor α, TNF-α and interleukin-6, IL-6), adipokines (e.g. resistin) and defects in mitochondrial lipid oxidation (2). On the other hand, the β-cell dysfunction has been attributed to glucose toxicity, lipotoxicity and islet amyloid deposits. Moreover, genome-wide association studies have provided support that genetic factors are also important in predisposing some individuals to type 2 diabetes and insulin resistance (4), including polymorphisms of calpain 10 and peroxisome proliferator-activated receptor γ (PPARγ) (5).

Introduction
10
Drug-induced diabetes
It is well known that medications may cause unwanted side-effects, although designed to relieve symptoms and improve quality of life. There are several drugs that may induce diabetes (secondary diabetes) and these include glucocorticoids, other immunosuppressive agents (IAs), diuretics, β-blockers and antipsychotic agents (6). This can be caused by impaired insulin secretion from the pancreatic β-cells or by insulin resistance in peripheral tissues and liver, or, most commonly, by both. In many cases, the underlying mechanisms are not fully understood and warrant further investigation. The focus will be on IAs since this is most relevant in the context of this thesis.
Complications of diabetes
Although, diabetic long-term complications develop gradually, they can eventually be disabling or even life-threatening (7). Generally the diabetic long-term complications are divided into micro- (diabetic nephropathy, neuropathy and retinopathy) and macrovascular complications (coronary artery disease, peripheral arterial disease and stroke) (8). The cardiovascular mortality in type 2 diabetic patients is more than double compared with age-matched subjects, being the major cause of death in people with diabetes. Diabetic nephropathy is the most common cause of end-stage renal disease (ESRD) in many countries. It accounts for approx 45 to 50% of cases of ESRD in the United States and approximately 25% of cases with ESRD in Sweden. Diabetic nephropathy is the aetiology of ESRD in approximately 25% of kidney transplant recipients transplanted in the United States and in Sweden the proportion is somewhat lower (9-11). Diabetes presents particular challenges both in the pre-transplant evaluation and after transplantation (12). These challenges are related to the high incidence of cardiovascular disease among patients with diabetes, and an increased risk of bacterial and fungal infections compared with transplant recipients without diabetes. In addition, glycemic control is often more difficult after transplantation. This is because immunosuppressive regimens used after transplantation have detrimental effects on both pancreatic β-cell function and peripheral insulin action as discussed in detail in this thesis. Therefore, IAs makes it difficult to achieve target glucose levels and prevent the recurrence of the diabetic lesions in the transplanted kidney. Combined kidney-pancreas transplantation is an established treatment for selected patients with type 1 diabetes and ESRD (13). Patients where the potential benefit of a combined transplant outweighs the increased morbidity of the surgical procedure and the use of lifelong immunosuppression are also considered. Combined kidney-pancreas transplantation, if successful, improves both patient survival and quality of life.

Introduction
11
A few patients with type 1 diabetes not controlled by exogenous insulin therapy and without substantial renal disease may be considered as candidates for pancreas transplantation alone (14). An alternative to solid organ pancreas transplantation is transplantation of pancreatic islets. In 2009 ∼400 individuals have received allogenic isolated pancreatic islets with ∼40 centers world-wide actively engaged in further developing this therapy (15). All these modes of transplantation currently require treatment with life-long immunosuppressive therapy.
Immunosuppressive drugs and adverse metabolic effects
In the early/mid-1980s, the discovery and introduction of modern IAs into clinical practice was a major breakthrough to prevent and treat allograft rejection, resulting in an improved long-term patient and graft survival after solid organ transplantation (16). A commonly used basic immunosuppressive protocol uses a higher immunosuppressive load in the early post-transplant phase, commonly a calcineurin inhibitor (cyclosporin A or tacrolimus), glucocorticoids and an antiproliferative agent (e.g. azathioprine or mycophenolate mofetil). During the subsequent maintenance phase, lower levels of a calcineurin inhibitor or a inhibitor of the mammalian target of rapamycin (mTOR) is combined with the lowest dose possible of glucocorticoids and/or one of the anti-proliferative agents. Individualized immunosuppressive protocols aim to combine the most effective drug combination to balance the risk of rejection against long-term adverse drug effects. However, even with these individualized protocols, long-term outcome of solid organ transplantation is hampered by the development of metabolic perturbations, like diabetes, dyslipidemia and hypertension (17-19). Taken together these metabolic complications are associated with an increased risk of non-fatal and fatal cardiovascular events, and other adverse outcomes including infections, malignancies, reduced patient and graft survival (18, 20).
New-onset diabetes after transplantation (NODAT)
Diabetes as a long-term complication after kidney transplantation was first identified in 1964 by Starzl et al. (21). Since then, it has become clear that new onset diabetes after transplantation (NODAT) is a common metabolic complication, with reported incidence rates up to 50% during the first year after transplantation (19, 22). Most patients develop NODAT within the first 6 months after transplantation, although the cumulative incidence continues to increase also after this period (17). Similar to type 2 diabetes, both decreased insulin secretion and increased insulin resistance seem to be principal pathogenic components of NODAT (23, 24). Accordingly, adoption of current American Diabetes Association diagnostic criteria for type 2 diabetes was recommended for the diagnosis of NODAT (25).

Introduction
12
In addition to other risk factors (Table 1), immunosuppressive therapy and obesity are reported to be modifiable risk factors for the development of NODAT. Montori et al reported that 74% of the variability of the incidence of NODAT could be explained by the immunosuppressive therapy (19). This may be due to the fact that different IAs can produce different metabolic perturbations (Table 2). Table 1. Non-modifiable and modifiable risk factors for new onset diabetes (NODAT).
Non-modifiable risk factors Modifiable risk factors - Age > 40 years - Ethnicity - Family history of diabetes - Genetic susceptibility - HLA mismatches - Deceased donor - Acute rejection history - Male donor - Polycystic kidney
- Obesity - Metabolic syndrome - Immunosuppression glucocorticoids cyclosporin A tacrolimus rapamycin - Hyperlipidemia - Pre-transplant IGT - Hepatitis C and cytomegalovirus infection
HLA, human leukocyte antigen; IGT, impaired glucose tolerance. Adapted from (26). The association between glucocorticoid therapy and the development of diabetes was established in the 1960s (21). The diabetogenic effect of glucocorticoids is dose-dependent and includes reduction in insulin synthesis and insulin sensitivity, increased hepatic gluconeogenesis and central obesity (27-30) (Table 2). The introduction of more active IAs, including the calcineurin inhibitors cyclosporin A and tacrolimus, made it possible to lower corticosteroid doses and thereby reduce the incidence of NODAT (31). Unfortunately, cyclosporin A and tacrolimus are also diabetogenic, probably due to both reduced insulin secretion from the pancreas and impaired insulin sensitivity in peripheral tissues (32-39) (Table 2). Moreover, treatment with the newer IA rapamycin also increases the risk for NODAT, in a similar manner (40, 41) (Table 2).

Introduction
13
Table 2. Drug-induced new onset diabetes (NODAT): potential pathogenic mechanisms.
Immunosuppressive drug Pathogenic mechanisms Glucocorticoids ↓ Peripheral insulin sensitivity (27)
↓ Insulin synthesis and secretion (28) ↑ Hepatic gluconeogenesis (29) ↑ Central obesity (30)
Cyclosporin A ↓ Peripheral insulin sensitivity (32-34) ↓ β-cell mass (35) ↓ Insulin synthesis and secretion (CsA<FK) (36)
Tacrolimus ↓ Peripheral insulin sensitivity (37, 38) ↓ β-cell mass (35) ↓ Insulin synthesis and secretion (FK>CsA) (36)
Rapamycin ↓ Peripheral insulin sensitivity (40) ↓ Insulin synthesis and secretion (41)
CsA, cyclosporin A; FK, tacrolimus
Dyslipidemia
Dyslipidemia is a well-recognized metabolic complication of immunosuppressive therapy with reported incidence rates of 20% to 80%, during the first year after transplantation (18, 42, 43). Clinical studies have shown that immunosuppressive therapy, and most markedly rapamycin, may increase serum levels of triacylglycerol (TAG), total cholesterol, low-density lipoprotein (LDL) and very-low-density lipoprotein (VLDL) cholesterol, free-fatty acids (FFA) and apolipoprotein B, in a dose-dependent manner (44-47). Although immunosuppressive therapy has been strongly associated with NODAT and dyslipidemia, its effects on glucose and lipid metabolism in human adipose tissue have not been studied in details previously.
Adipose tissue
Adipose tissue is mainly divided into two subtypes, white and brown fat (48). White fat is widely distributed and represents the primary site of lipid storage. Brown fat is relatively scarce and is specialized in thermogenesis, dissipating heat to maintain body temperature. We will focus on white adipose tissue, since it is most relevant to the context of this thesis. White adipose tissue is mostly composed of adipocytes, surrounded by connective tissue that is highly vascularised and innervated. It also contains macrophages, fibroblasts and adipocyte precursor cells.

Introduction
14
Storage of triglycerides
The classical view of the white adipose tissue is that it stores and delivers energy substrate, under the control of several regulatory factors, such as insulin, catecholamines and the autonomic nervous system (49). The energy stores in adipocytes are determined mainly by a balance between fatty acid storage as TAG and release of FFA from TAG via lipolysis (Figure 1). Approximately 90% of the lipids in the adipocyte is composed of TAG (50). In the fed state, the concurrent increase in insulin, glucose and lipid levels in blood drives the storage of TAG in adipocytes (49). TAG synthesis requires glycerol-3 phosphate and acyl-CoA as substrates (Figure 1). Glycerol-3 phosphate is derived via glycolysis from glucose and via glyceroneogenesis from sources other than glucose and glycerol, like lactate (51). Acyl-CoA is derived from uptake of FFA from the circulation and re-utilization of FFA released from the adipocyte. The acyl-CoA is then attached to glycerol, via esterification or so-called re-esterification (51). FFA from circulation is provided by hydrolysis of TAG in VLDL particles and chylomicrons catalysed by lipoprotein lipase (LPL) at the luminal surface of capillary endothelial cells (52). The hydrolysed FFA are taken up by adipocytes via specific fatty acid transporters (CD36 and fatty-acid-binding protein, FABP). The intracellular FFA is then converted to acyl-CoA (53). In humans’ adipocytes the endogenous synthesis of acyl-CoA from glucose (known as de novo lipogenesis) seems to be of minor importance (54). There are two major pathways for TAG synthesis. The glycerol phosphate pathway includes the acylation of glycerol-3-phosphate, through a step-wise addition of acyl groups, catalysed by distinct enzymes (glycerol-3-phosphate acyltransferase; 1-acylglycerol-3-phosphate acyltransferase; lipin 1) (55). The second pathway generates the acylation of diacylglycerol from monoacylglycerol by monoacylglycerol acyltransferase (MGAT) (56). These 2 pathways share the final step in converting diacylglycerol into TAG, which is catalysed by diacylglycerol acyltransferase (DGAT). Conversely, in the fasting state or when energy expenditure is increased for example during exercise, adipose tissue provides energy via hydrolysis of TAG into glycerol and FFA, a process known as lipolysis (Figure 1) (49). Catecholamines (e.g. epinephrine) stimulate lipolysis through the activation of β-adrenergic receptors, which activates adenylate cyclase, increasing cAMP production. A rise in cAMP activates protein kinase A (PKA), which leads to activation of the lipases adipose triacylglycerol lipase (ATGL), hormone-sensitive lipase (HSL) and monoacylglycerol lipase (57-59). This process leads to the breakdown of TAG into FFA and glycerol. In addition to lipases other proteins, like perilipin, are important for lipolysis (58). Perilipin is a lipid-droplet coating protein that acts as a barrier to lipases, thereby maintaining a low rate of basal lipolysis.

Introduction
15
Insulin is a powerful anti-lipolytic hormone in adipose tissue. Insulin inhibits lipolysis by activation of phosphodiesterase 3B, which degrades cAMP, thus reducing PKA and subsequently HSL activity (Figure 1) (60). Additional, circulation factors, such as, glucocorticoids, TNF-α, IL-6 and adiponectin, can also regulate lipolysis. Disturbances in the pathways regulating the storage and release of energy by adipose tissue may lead to a reduced capacity of adipocytes to keep lipids from the circulation and other tissues. Fatty acids may become elevated in the circulation and TAG may accumulate in pancreas, liver, muscle and heart (61). This so-called ectopic fat deposition may seriously affect the function of these organs and contribute to the pathogenesis of obesity-related conditions such as insulin resistance, diabetes and cardiovascular diseases.
Figure 1 - Overview of the lipid storage and lipolysis in adipocytes. Adapted from (50, 55). Free-fatty acids (FFA); Lipoprotein lipase (LPL); fatty acid binding protein 4 (FABP4/aP2); acyl-CoA synthase (ACS); acetyl-CoA carboxylase (ACC); Fatty acid synthase (FAS); diacylglycerol (DAG); diacylglycerol acyltransferase (DGAT); triacylglycerol (TAG); diacylglycerol (DG); monoacylglycerol (MG); adipose triacylglycerol lipase (ATGL); hormone-sensitive lipase (HSL); monoacylglycerol lipase (MGL); β adrenergic receptor (β-AR); adenylate cyclase (AC); protein kinase A (PKA).

Introduction
16
Adipose tissue as an endocrine organ
In addition to its role as storage for TAG, adipose tissue is also well known to secrete a variety of bioactive peptides, collectively called adipokines (62). Adipokines act at both locally (autocrine/paracrine) and systemically (endocrine) levels and may profoundly influence glucose and lipid metabolism. Increased levels of IL-6 and TNF-α, have been proposed to contribute to insulin resistance and dyslipidemia, while adiponectin is an insulin sensitising adipokine (62).
Adipose tissue distribution and metabolic disease
The main white adipose tissue depots are located subcutaneously and intra abdominally, respectively (48). Subcutaneous adipose tissue is located beneath the skin and can be divided into deep and superficial adipose tissue. Intra abdominal adipose tissue is composed of the retroperitoneal and the visceral depot, which is located inside the peritoneal cavity, and includes the omental and the mesenteric fat. Central obesity, in particular visceral obesity, has been associated with a cluster of metabolic alterations, which include insulin resistance, components of the metabolic syndrome and increased risk of cardiovascular disease (63-65). The physiological basis for these associations may be the anatomical location of the visceral depot in relation to other organs and differences in function and response to regulating signals. Unlike subcutaneous adipose tissue, visceral fat tissue is drained into the portal vein, which has direct contact with the liver (66). Therefore, it can affect hepatic glucose and lipid metabolism directly. Genetic susceptibility combined with environmental factors have major influence on adipose tissue distribution (67). Several endocrine hormones, like growth hormone, sex steroids and cortisol, play fundamental roles in regulating body fat distribution (67). Body mass index (BMI) is the most commonly used index of body composition in clinical practice (68). In adults, a BMI between 18.5 and 24.9 kg/m2 corresponds to normal, BMI between 25.0 and 29.9 kg/m2 to overweight, and BMI of ≥30.0 kg/m2 is defined as obesity. As described above, the common complications of obesity, such as insulin resistance, type 2 diabetes and cardiovascular disease, are more closely related to the distribution of body fat than to the absolute amount of adiposity (63-65). As simple measures, the waist-hip ratio and sagittal abdominal diameter, are often used and reflect the degree of abdominal obesity. Other methods to assess fat distribution include bioelectrical impedance analysis (69), computed tomography and magnetic resonance imaging (68). These last two imaging methods have the advantage of being able to distinguish subcutaneous adipose tissue from visceral adipose tissue, but they are also more expensive and technically complex.

Introduction
17
Obesity is associated with a chronic inflammatory response characterised by abnormal adipokine and cytokine production, and the activation of pro-inflammatory signalling pathways (70). However, the precise physiological events leading to the initiation of the inflammatory response and its potential metabolic consequences are not yet completely understood. It is believed that during expansion of adipose tissue, adipocyte hypertrophy and hyperplasia may lead to cell hypoxia and activation of cellular stress pathways (71). This may cause adipose tissue inflammation and release of cytokines and other pro-inflammatory signals. Cytokines, such as TNF-α and IL-6 produced by adipose tissue, can also promote inflammation and insulin resistance. As a part of the chronic inflammatory process, locally secreted chemokines attract pro-inflammatory macrophages, which in turn also release cytokines and further activate the inflammatory program in adipocytes (72).
Insulin action in adipose tissue
Insulin is a pleiotropic hormone which has diverse anabolic and anti-catabolic functions in adipose tissue (73). This includes stimulation of glucose uptake, inhibition of lipolysis and stimulation of de novo fatty acid synthesis in adipocytes. Insulin also stimulates gene expression of several adipokines and transcription factors, which are important for adipose tissue growth and differentiation, including SREBP1c and PPARγ (74, 75). The major insulin signalling (phosphoinositide 3-kinase (PI3K) dependent) is schematically depicted in Figure 2. Insulin signalling is initiated by the binding of insulin to the extracellular α-subunit of the insulin receptor (IR) on the cell surface, resulting in the autophosphorylation of a number of residues in the transmembrane β-subunits (76). The active tyrosine kinase phosphorylates insulin receptor substrate (IRS) proteins. The IRS proteins function as docking proteins for other signalling proteins containing Src homology 2 domains. IRS1 and IRS2 are best characterised, and are the main docking proteins for the binding of the p85 regulatory subunit of PI3K, which leads to the activation of the catalytic subunit p110 (77). PI3K mediates many of the intracellular effects of insulin, including threonine phosphorylation of PKB and its activation (73). Serine phosphorylation of PKB by the mTOR complex 2 (mTORC2) (78) is also necessary for the full activation of PKB. Moreover, PKB activates AS160 (PKB substrate of 160 kDa) that quickly increases glucose transport by increasing the rate of glucose transporter (GLUT) 4-vesicle exocytosis and slightly decreases the rate of internalization (79). GLUT1 is another glucose transporter present in adipose tissue. GLUT1 is less abundant than GLUT4 and it has been proposed to act as a constitutive transport protein (80). In the basal state, GLUT4 continuously recycles between the plasma membrane and intracellular compartment, with only about 3-10% of the total GLUT4 protein pool localized at the cell surface (81). However, in response to insulin stimulation, up to ~50%

Introduction
18
of GLUT4 is rapidly (within 5-10 min) translocated to the cell surface, thus increasing transmembrane glucose transport. Activation of the described PI3K/PKB pathway is thought to mediate many of the metabolic effects of insulin. Besides glucose transport, it inhibits lipolysis and it promotes mTOR signalling and expression of adipokines and transcription factors. In addition to the PI3K pathway, there are however alternative pathways. Thus, activation of the CAP-Cbl-TC10 signalling pathway has been suggested to play an important role for insulin-stimulated GLUT4 translocation and glucose uptake (73). Moreover, insulin can also stimulate the mitogen-activated protein kinase (MAPK) cascade initiating a transcriptional programme that is involved in cellular proliferation and differentiation.
Figure 2 – Overview of the insulin signalling pathway. Adapted from (73). Insulin receptor (IR); insulin receptor substrate 1, 2 (IRS1, IRS2), phosphoinositide 3-kinase (PI3K), phosphatidylinositol (4,5)-biphosphate (PIP2), phosphatidylinositol (3,4,5)-triphosphate (PIP3), phosphoinositide-dependent kinase 1 (PDK1), protein kinase B (PKB), PKB substrate of 160 kDa (AS160) and glucose transporter 4 (GLUT4).

Introduction
19
Glucocorticoids
Glucocorticoids are steroid hormones produced in the adrenal cortex under the control of the hypothalamic-pituitary-adrenal axis (82). The main glucocorticoid in humans is cortisol. The name glucocorticoid (glucose + cortex + steroid) is derived from the role in the regulation of the metabolism of glucose, synthesis in the adrenal cortex and steroidal structure. Various synthetic glucocorticoids are available, e.g. prednisone, prednisolone and dexamethasone (83). These are used to treat diseases caused by an overactive immune system, such as inflammatory diseases and autoimmune diseases or to prevent organ rejection after transplantation. Glucocorticoids induce their anti-inflammatory and immunosuppressive effects mainly through regulation of gene transcription (84) (Figure 3, pathway A). Glucocorticoids diffuse passively into the cells through the plasma membrane due to their lipophilic structure and form a complex with the glucocorticoid receptor. The glucocorticoid receptor is a multi-protein complex containing co-factors; heat-shock proteins (Hsp, such as Hsp70 and Hsp90) and immunophilins (such as 51 kDa FK506-binding protein, FKBP51) (85). Upon glucocorticoid binding the complex translocates to its site of action in the nucleus. It suppresses the transcription of inflammatory and immune genes (e.g. IL-2) and induces transcription of anti-inflammatory genes (e.g. annexin 1) (84).
Figure 3 – Pathways for inhibition of the immune system by immunosuppressive drugs (84, 86). (A) Glucocorticoids; (B) calcineurin inhibitors cyclosporin A and tacrolimus; and (C) mTOR inhibitor rapamycin. Glucocorticoid receptor (GR); FK506-binding protein (FKBP); interleukin-2 (IL-2); mammalian target of rapamycin (mTOR).

Introduction
20
It is well known that glucocorticoids also produce many serious side-effects that limit their use, including high blood glucose levels, central obesity, depression and anxiety (27, 30), but the metabolic side-effects are the ones most relevant to the context of this thesis. Cortisol, is a powerful insulin-antagonistic hormone (29) that regulates a variety of important metabolic functions and may promote the development of insulin resistance, hyperglycaemia and features of the metabolic syndrome (82). Cortisol opposes the effects of insulin, including impaired insulin-dependent glucose uptake in peripheral tissues, enhanced gluconeogenesis in liver and impaired insulin secretion from pancreatic β-cells (28, 29). The effects of glucocorticoids is exemplified in clinical syndromes of excess (Cushing’s syndrome) or during prolonged corticosteroid therapy (87, 88). Cortisol excess is characterised by central obesity and other components of the metabolic syndrome, such as glucose intolerance and hypertension. Central obesity, in particular visceral adiposity, is associated with insulin resistance, cardiovascular disease and the metabolic syndrome, as previously reported (64). Consequently, it is of interest to further explore the response of adipose tissue to cortisol. Glucocorticoids cause sex- and depot-specific regulation of processes and/or gene expression. For example, glucocorticoids stimulate adipose tissue lipoprotein lipase production and activity, predominantly in visceral fat tissue, particularly in men (89, 90), possibly contributing to central obesity. In contrast, glucocorticoids in subcutaneous adipose tissue stimulate lipolysis, particularly in women (91), resulting in reduced lipid storage and increased release of fatty acids to the circulation. This may partly explain the excess of visceral obesity observed in conditions with elevated levels of cortisol. Furthermore, the capacity of glucocorticoids to impair glucose uptake appears to be more prominent in the visceral compared to the subcutaneous fat depot (92). Accordingly, dexamethasone has been demonstrated to down regulate critical signalling proteins in the visceral fat depot, e.g. IRS1 and PKB (92, 93). However, the molecular mechanisms for the underlying differential regulation of subcutaneous and visceral adipose tissue by glucocorticoids are still unknown. Recently, key metabolic pathways regulated by dexamethasone treatment were identified by microarray analysis in human subcutaneous and omental adipose tissue from severely obese individuals (94) and in human skeletal muscle (95). In these studies, dexamethasone increases gene networks that promote carbohydrate and amino acid catabolism and lipid deposition, while genes related to inflammatory pathways were suppressed. Identification of biomarkers and new pharmacological targets would be valuable in the prevention and treatment of glucocorticoid-induced metabolic dysregulation and could potentially also be of relevance for other metabolic conditions.
Introduction
21
The calcineurin inhibitors, cyclosporin A and tacrolimus
The introduction of calcineurin inhibitors has significantly improved the outcome of transplantation and autoimmune diseases (96). In addition to the expected beneficial action on the immune system, calcineurin inhibitors are associated with long-term side-effects. These include dose-dependent renal and hepatic toxicity and metabolic effects important for the patient’s long-term outcome. Cyclosporin A and tacrolimus are the calcineurin inhibitors currently used in the clinic.
Cyclosporin A is a lipid-soluble cyclic undecapeptide produced by Tolypocladium inflatum, a fungus first isolated in 1970, from a soil sample collected in Norway (97). Since its clinical introduction in 1983, cyclosporin A has become the first line treatment for prevention of rejection of transplanted organs and for certain autoimmune diseases. Tacrolimus (also known as FK506) is a lipid-soluble macrocyclic lactone, first isolated in 1987, from the soil fungus Streptomyces tsukubaensis, in the Tsukuba region of northern Japan. Cyclosporin A and tacrolimus mediate its immunosuppressive actions by blocking the expression of the IL-2 gene in activated T-lymphocytes, a growth factor critical for T-cell proliferation (98) (Figure 3, pathway B). Although they are structurally related, upon entering the T-cell cytoplasm they bind distinct intracellular receptors referred to as immunophilins; cyclophilin for cyclosporin A and FK506-binding protein (FKBP) for tacrolimus (99). The drug-immunophilin complexes bind to and inhibit the activity of calcineurin, a calcium dependent serine/threonine phosphatase required for early T-cell activation (99, 100). Furthermore, by preventing the calcineurin-mediated dephosphorylation of the transcription nuclear factor of activated T-cells (NFAT), cyclosporin A and tacrolimus block the translocation of the NFAT from the cytoplasm to the nucleus (100). NFAT is involved in the transcription activation of genes for cytokines such as IL-2. In all parameters of T-cell inhibition, tacrolimus appears to be 10-100 fold more active than cyclosporin A. Moreover, tacrolimus is more potent and the clinical therapeutic plasma concentration is lower than for cyclosporin A, 6-20 nM and 40-120 nM, respectively (101, 102).
Effects of calcineurin inhibitors on glucose and lipid metabolism
Both in vitro and biopsy studies in man and animals indicate that calcineurin inhibitors inhibit insulin production and secretion from the β-cells of the islets of Langerhans in a dose dependent manner (35, 36, 103). This effect is mediated through cell death, impaired insulin production, and/or diminished insulin secretion. Clinical studies have mainly confirmed these pre-clinical results (23, 104, 105). However, a recent study with healthy human volunteers treated during 5 h with clinically relevant doses of cyclosporin A and

Introduction
22
tacrolimus, reported that both drugs acutely increased insulin sensitivity, while the first phase and pulsatile insulin secretion remained unaffected (106). These contradictory results may be explained by the fact, that a younger and healthier population were exposed short-term to the effect of calcineurin inhibitors, whereas previous studies usually include longer exposures and older populations. The divergent results also highlight the complexity of these drugs and suggest that their diabetogenicity may be time, dose and situation dependent. Furthermore, studies in both human and mice/rodents have indicated that calcineurin inhibitors are associated with reduced insulin sensitivity in peripheral tissues, as well as, impaired endothelial function (23, 32-34). In humans, the simultaneous use of glucocorticoids has made it difficult to define the underlying mechanism of the calcineurin inhibitors in insulin resistance, since glucocorticoids per se, are associated with increased insulin resistance (107). Direct effects of cyclosporin A and tacrolimus on human adipocytes have never been studied previously and such results are now reported in the present thesis. The calcineurin inhibitors, cyclosporin A and tacrolimus, also increase serum levels of cholesterol, TAG, LDL and VLDL, in a dose-dependent manner (44-47). In addition, cyclosporin A and tacrolimus increase LDL oxidation and fatty acid content in LDL (108). Although, calcineurin inhibitor therapy has been associated with reduced LPL (109) and hepatic triglyceride lipase (110) activity, little is known about the effects of calcineurin inhibitors on adipocyte lipid metabolism and on adipose tissue expression of genes involved in regulation of lipid metabolism. Several randomised clinical trials and meta-analyses, have suggested that tacrolimus has a more diabetogenic profile than cyclosporin A (96, 111-113), although in other reports the differences between the two agents were not significant (114, 115). In contrast, cyclosporin A has been associated with greater adverse effects on the patient’s lipid profile (44, 108, 111).
The mTOR inhibitor rapamycin
Rapamycin (also known as sirolimus) is a lipophilic macrocyclic lactone, produced by the bacterium Streptomyces hygroscopicus, which was isolated in 1970 on the Easter Island Rapa Nui, and from here the name rapamycin is derived (116). Rapamycin was developed initially as an antifungal agent, but was abandoned because of its immunosuppressive effect. In the early 1990s rapamycin-related research renewed the clinical interest, and in 1997 rapamycin was approved as an IA in kidney transplantation. For the time being the role of rapamycin in transplant immunosuppression remains undecided (117). The

Introduction
23
prevailing belief is that the calcineurin inhibitors, mycophenolate mofetil and glucocorticoids should be standard therapy in renal transplantation both in terms of tolerability and outcomes. In addition, rapamycin displays a wide range of organ and tissue toxicity owing to the critical role of its site of action (the mTOR) in the signal transduction pathways of numerous cytokines, growth factors, hormones and nutrients. Rapamycin is structurally similar to tacrolimus, and it binds the same FKBP immunophilin species (Figure 3, pathway C) (118). However, the resulting complex does not affect calcineurin activity, and therefore it does not block the calcineurin-dependent activation of cytokine genes (118). Instead, rapamycin renders the T-cells unresponsive to IL-2. The molecular target of the rapamycin-FKBP complex in T-cells is mTOR. mTOR controls proteins that regulate mRNA translation initiation and progression from the G1 to the S phase of the cell cycle, and thus its suppression inhibits T-cells proliferation (119). The therapeutic concentration in plasma for rapamycin is 10 to 26 nM (120).
mTOR signalling
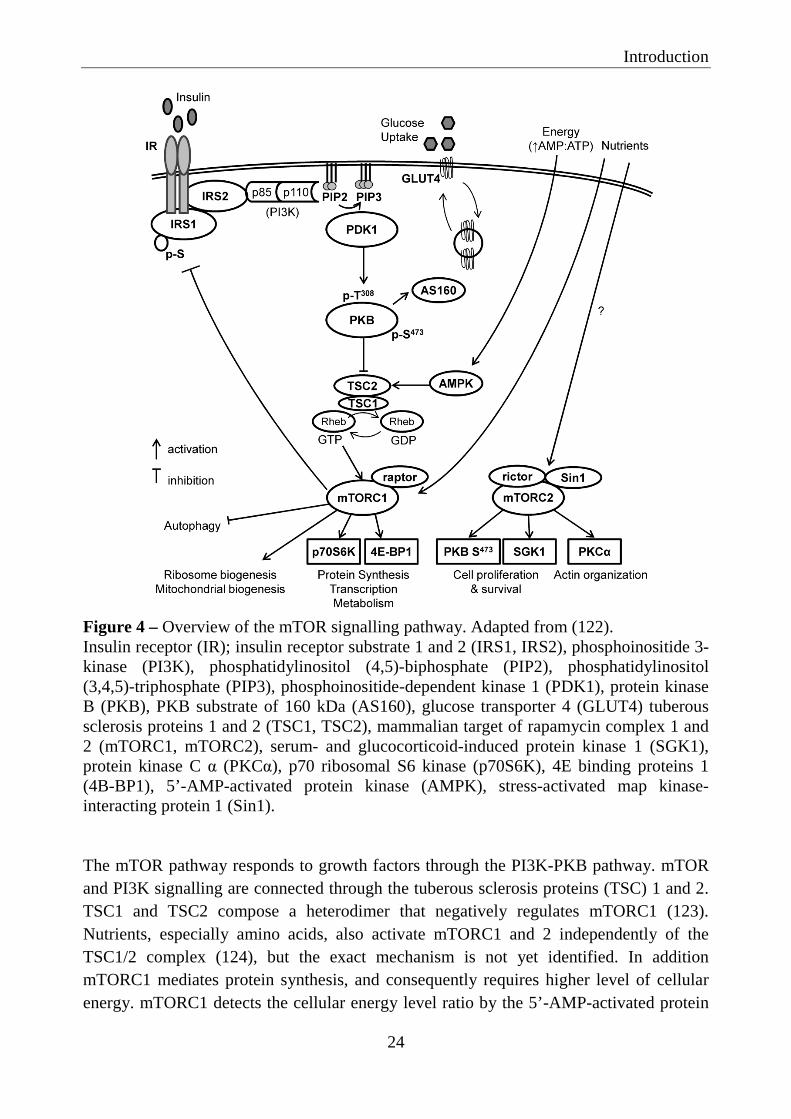
mTOR is a conserved serine-threonine kinase that controls protein synthesis, cell survival and proliferation (121). mTOR is a large protein (289 kDa) that belongs to the phosphatidylinositol kinase-related kinase family and is detected in nearly all eukaryotic organisms and cell types (122). mTOR forms two physically and functionally distinct multi-protein complexes, the mTOR complex 1 (mTORC1) and 2 (mTORC2). Several components of mTORC1 and mTORC2 have been identified. Raptor is a unique component of mTORC1, while rictor and stress-activated map kinase-interacting protein 1 (Sin1) are unique components of mTORC2. mTOR signalling is regulated by growth factors, insulin, nutrients (e.g. amino-acids), stress, oxygen and energy status. The mTOR signalling pathway is shown in Figure 4.
Introduction
24
Figure 4 – Overview of the mTOR signalling pathway. Adapted from (122). Insulin receptor (IR); insulin receptor substrate 1 and 2 (IRS1, IRS2), phosphoinositide 3-kinase (PI3K), phosphatidylinositol (4,5)-biphosphate (PIP2), phosphatidylinositol (3,4,5)-triphosphate (PIP3), phosphoinositide-dependent kinase 1 (PDK1), protein kinase B (PKB), PKB substrate of 160 kDa (AS160), glucose transporter 4 (GLUT4) tuberous sclerosis proteins 1 and 2 (TSC1, TSC2), mammalian target of rapamycin complex 1 and 2 (mTORC1, mTORC2), serum- and glucocorticoid-induced protein kinase 1 (SGK1), protein kinase C α (PKCα), p70 ribosomal S6 kinase (p70S6K), 4E binding proteins 1 (4B-BP1), 5’-AMP-activated protein kinase (AMPK), stress-activated map kinase-interacting protein 1 (Sin1). The mTOR pathway responds to growth factors through the PI3K-PKB pathway. mTOR and PI3K signalling are connected through the tuberous sclerosis proteins (TSC) 1 and 2. TSC1 and TSC2 compose a heterodimer that negatively regulates mTORC1 (123). Nutrients, especially amino acids, also activate mTORC1 and 2 independently of the TSC1/2 complex (124), but the exact mechanism is not yet identified. In addition mTORC1 mediates protein synthesis, and consequently requires higher level of cellular energy. mTORC1 detects the cellular energy level ratio by the 5’-AMP-activated protein

Introduction
25
kinase (AMPK) (125). Upon activation, mTORC1 regulates protein synthesis and transcription of many genes involved in glucose and lipid metabolism by activation of p70 ribosomal S6 kinase (p70S6K) and 4E binding proteins 1 (126). The phosphorylation of p70S6K and 4E binding proteins 1 are standard markers of mTORC1 activity. A crucial element of mTORC1 signalling is its inhibitory feedback loop on insulin-induced glucose uptake through inhibitory phosphorylation of IRS1 on multiple serine residues (127). Phosphorylation of IRS1 on serine residues interferes with PI3K/PKB pathway, inhibiting insulin action on glucose uptake (128). mTORC1 is also thought to modulate protein synthesis through stimulation and transcription of ribosomal RNA and ribosomal biogenesis (129) and to play a role in mitochondrial biosynthesis and autophagy (130). On the other hand, mTORC2 regulates cell proliferation and survival, metabolism and actin organization (122). mTORC2 promote serine phosphorylation of PKB, which is required for its maximal activation (78). Often, mTORC2 activation is determined by measuring the serine phosphorylation of PKB. Rapamycin is known to be an mTORC1 inhibitor (131). However, it has been proposed, that prolonged rapamycin treatment of 3T3-L1 adipocytes and other cell types, can also disrupt the mTORC2 complex and thereby decrease serine phosphorylation of PKB (132).
Effects of mTOR signalling in adipose tissue: adipogenesis and lipid storage
mTORC1 is essential for differentiation and maintenance of adipocytes by regulating transcription factors critical for the early commitment of embryonic stem cells to adipogenic progenitors (133). It also regulates the transcription of factors for terminal differentiation, including the master regulators PPARγ and SREBP1 (134, 135). In addition, mTORC1 activates lipin 1 (136). Lipin 1 is involved in diacylglycerol synthesis and also a coactivator of transcription factors involved in lipid metabolism, including PPARγ and SREBP1.
Effects of rapamycin on glucose and lipid metabolism
The diabetogenic effect of rapamycin is well-documented. Clinical studies have demonstrated that treatment with rapamycin alone or in combination with calcineurin inhibitors (137, 138) is associated with insulin resistance, higher incidence of NODAT and dyslipidemia. However, the observed in vitro effects of rapamycin on glucose metabolism are conflicting and its mechanisms of actions have not yet been clarified. In fact, some in vitro studies have shown that rapamycin relieves the mTORC1 repression of IRS-
Introduction
26
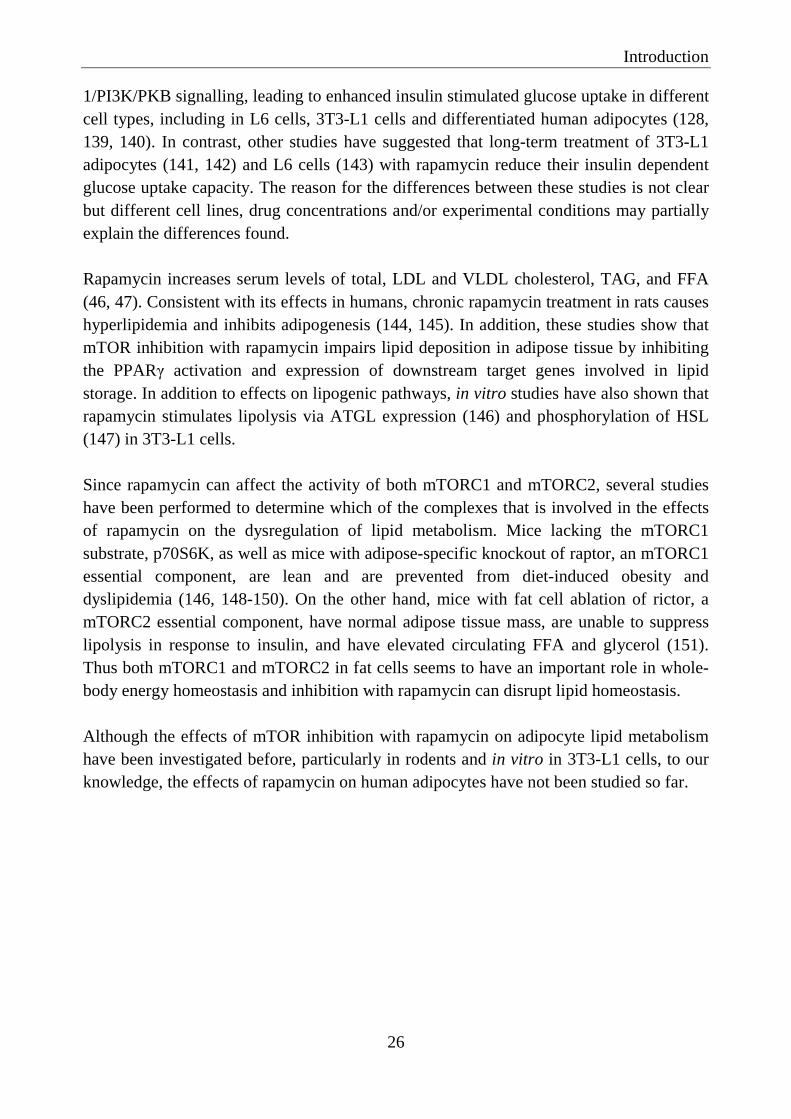
1/PI3K/PKB signalling, leading to enhanced insulin stimulated glucose uptake in different cell types, including in L6 cells, 3T3-L1 cells and differentiated human adipocytes (128, 139, 140). In contrast, other studies have suggested that long-term treatment of 3T3-L1 adipocytes (141, 142) and L6 cells (143) with rapamycin reduce their insulin dependent glucose uptake capacity. The reason for the differences between these studies is not clear but different cell lines, drug concentrations and/or experimental conditions may partially explain the differences found. Rapamycin increases serum levels of total, LDL and VLDL cholesterol, TAG, and FFA (46, 47). Consistent with its effects in humans, chronic rapamycin treatment in rats causes hyperlipidemia and inhibits adipogenesis (144, 145). In addition, these studies show that mTOR inhibition with rapamycin impairs lipid deposition in adipose tissue by inhibiting the PPARγ activation and expression of downstream target genes involved in lipid storage. In addition to effects on lipogenic pathways, in vitro studies have also shown that rapamycin stimulates lipolysis via ATGL expression (146) and phosphorylation of HSL (147) in 3T3-L1 cells. Since rapamycin can affect the activity of both mTORC1 and mTORC2, several studies have been performed to determine which of the complexes that is involved in the effects of rapamycin on the dysregulation of lipid metabolism. Mice lacking the mTORC1 substrate, p70S6K, as well as mice with adipose-specific knockout of raptor, an mTORC1 essential component, are lean and are prevented from diet-induced obesity and dyslipidemia (146, 148-150). On the other hand, mice with fat cell ablation of rictor, a mTORC2 essential component, have normal adipose tissue mass, are unable to suppress lipolysis in response to insulin, and have elevated circulating FFA and glycerol (151). Thus both mTORC1 and mTORC2 in fat cells seems to have an important role in whole-body energy homeostasis and inhibition with rapamycin can disrupt lipid homeostasis. Although the effects of mTOR inhibition with rapamycin on adipocyte lipid metabolism have been investigated before, particularly in rodents and in vitro in 3T3-L1 cells, to our knowledge, the effects of rapamycin on human adipocytes have not been studied so far.

Aims
27
AIMS The overall aim was to study the effects of immunosuppressive agents on human adipose tissue glucose and lipid metabolism. These studies could contribute to increase our understanding of the molecular mechanism for the metabolic adverse effects of such drugs. The specific aims were to: Investigate the direct effects of the mTOR inhibitor rapamycin on glucose uptake in human subcutaneous and omental adipocytes, and to characterise its interaction with the insulin signalling pathway (Paper I). Investigate the effects of the calcineurin inhibitors, cyclosporin A and tacrolimus, on glucose uptake in human adipocytes and their impact on insulin action and on the glucose transport machinery (Paper II). Explore the effects of rapamycin, cyclosporin A and tacrolimus on lipolysis, lipid storage and expression of genes involved in lipid metabolism in human subcutaneous and omental adipocytes and adipose tissue (Paper III). Study the effects of dexamethasone on gene expression in human subcutaneous and omental adipose tissues, aiming to identify novel mechanisms explaining glucocorticoid-induced insulin resistance (Paper IV).

Methods
28
METHODS Detailed description of material and methods is given in each individual paper.
Subjects and samples
Subjects were recruited via advertisement or before elective abdominal surgery, mainly kidney donation. Subjects with diabetes, endocrine disorders and cancer or other major illnesses, as well as ongoing medication with systemic glucocorticoids and immune-modulating therapies were excluded from the studies. Anthropometric measurements including body composition assessed by bioimpedance were obtained in all subjects (69). Subjects were fasted overnight (>10 h) and venous blood samples were collected for analysis of glucose, insulin and lipids by routine methods at the Department of Clinical Chemistry, Sahlgrenska University Hospital. A more detailed description of adipose tissue donors is found in Papers I-IV. The studies were approved by the Regional Ethics Review Board in Gothenburg. All participants gave their written informed consent. Due to limited amount of tissue, not all experiments were performed in the adipose sample from each subject. The clinical characteristics of adipose tissue donors and samples used in Papers I-IV are shown in Table 3. Table 3 – Clinical characteristics of adipose tissue donors and samples in Papers I-IV. Paper I Paper II Paper III Paper IV Male/Female (n) 25M/39F 19M/25F 26M/34F 10M/15F Age (years) 23-72 23-70 18-72 28-60 BMI (kg/m 2) 21-37 20-36 21-36 21-31 Fat mass (%) 14-45 18-49 14-49 13-39 Incubations Rapamycin CsA/FK CsA/FK/Rap Dexamethasone Adipocytes Subcutaneous Glucose uptake
Insulin signalling Glucose uptake Insulin signalling
Lipolysis Lipid storage Lipolytic proteins
Glucose uptake
Omental Glucose uptake Glucose uptake - Glucose uptake Adipose tissue Subcutaneous IRS1/2 (PCR) - Lipogenic genes
and proteins (PCR, WB)
Gene expression (Microarray and PCR) and WB
Omental - - Lipogenic genes and proteins (PCR, WB)
Gene expression (Microarray and PCR) and WB
CsA, cyclosporin A; FK, tacrolimus; Rap, rapamycin; PCR, real-time polymerase chain reaction; WB, western blot

Methods
29
Subcutaneous adipose tissue biopsies were obtained by needle aspiration from the lower part of the abdomen after local dermal anaesthesia with lidocaine. Alternatively, subcutaneous and omental biopsies were obtained during elective abdominal surgery, after induction of general anaesthesia. Biopsies were transferred to the laboratory for immediate processing and biopsies obtained from surgery were cut into smaller pieces (approximately 1-2 mm3).
Adipocyte isolation and fat cell size
Adipocytes were isolated from adipose tissue (Paper I-IV) according to methods previously reported (152). Briefly, adipose tissue was digested with collagenase type II (from Clostridium histolyticum) in Hank’s medium supplemented with 6 mM glucose, 4% BSA, 0.15 µM adenosine, pH 7.4, in a gently shaking water-bath at 37ºC for 60 min. Isolated adipocytes were filtered through a 250 µm nylon mesh and were washed four times and suspended in Hank’s medium. The first media collected from the isolated adipocytes contains the stromal vascular fraction, and was used for culture and differentiation of the pre-adipocytes (Paper II). The average cell diameter was measured in subcutaneous and omental adipocytes isolated from all subjects (Paper I-IV), as previously reported (153) and is described in Paper I.
Adipocyte and adipose tissue incubation
In Paper I and II, isolated subcutaneous and omental adipocytes were pre-incubated for short- (15 min and/or 3h) or long-term (20 h) with either rapamycin (0.001–10 µM), cyclosporin A (0.001–1 µM) or tacrolimus (0.001–1 µM) to study effects on glucose uptake and on relevant proteins of the insulin signalling pathway. For short-term incubations, adipocytes were diluted to a lipocrit of 5% in Hank’s medium (4% bovine serum albumin, 0.15 µM adenosine and pH 7.4) without glucose, while for long-term incubations adipocytes were placed in polystyrene flasks containing DMEM (6 mM glucose, 10% foetal bovine serum, 1% penicillin-streptomycin) at 37ºC, 5% CO2 with gentle rotation (~30 rpm) in a culture chamber. In Paper III, subcutaneous adipocytes were incubated with or without rapamycin (0.01 µM), cyclosporin A (0.1 µM) or tacrolimus (0.1 µM) in a gently shaking water bath at 37ºC for 2 h, to study the effects of the IAs on lipolysis and lipid storage. In addition, to study the effects of the IAs on lipolytic proteins, subcutaneous adipocytes were pre-incubated for 15 minutes, with or without rapamycin (0.01 µM), cyclosporin A (0.1 µM)
Methods
30
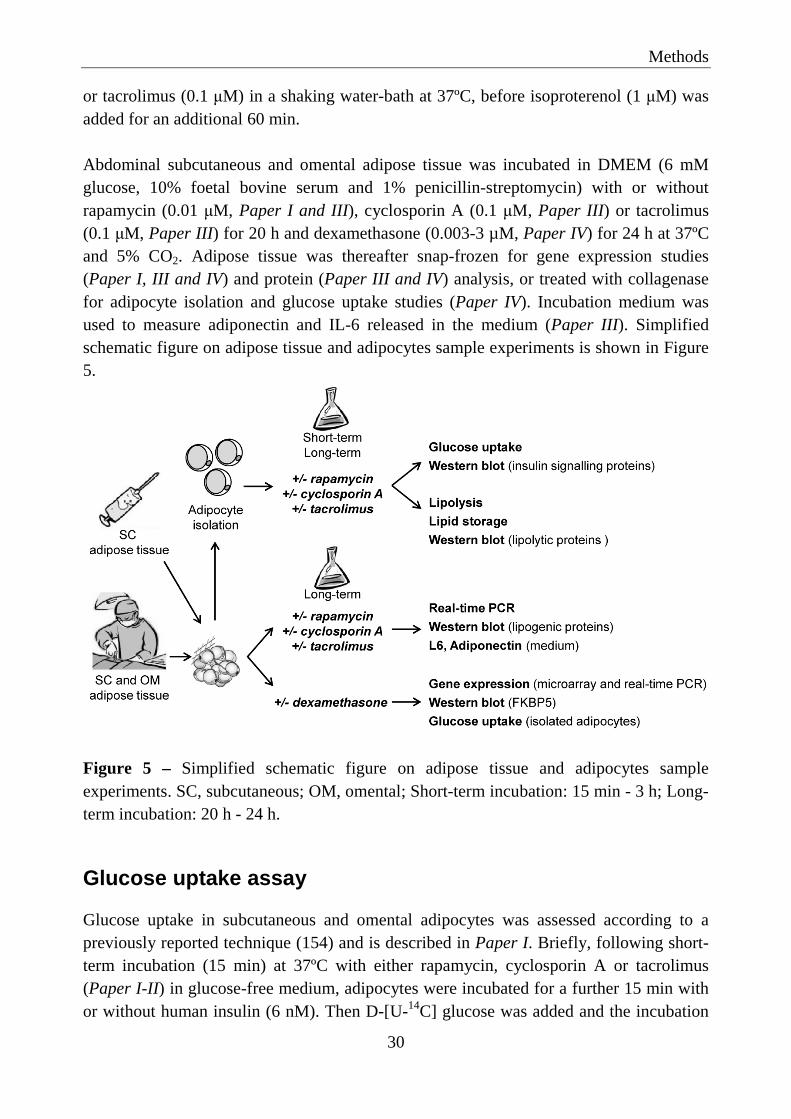
or tacrolimus (0.1 µM) in a shaking water-bath at 37ºC, before isoproterenol (1 µM) was added for an additional 60 min. Abdominal subcutaneous and omental adipose tissue was incubated in DMEM (6 mM glucose, 10% foetal bovine serum and 1% penicillin-streptomycin) with or without rapamycin (0.01 µM, Paper I and III), cyclosporin A (0.1 µM, Paper III) or tacrolimus (0.1 µM, Paper III) for 20 h and dexamethasone (0.003-3 µM, Paper IV) for 24 h at 37ºC and 5% CO2. Adipose tissue was thereafter snap-frozen for gene expression studies (Paper I, III and IV) and protein (Paper III and IV) analysis, or treated with collagenase for adipocyte isolation and glucose uptake studies (Paper IV). Incubation medium was used to measure adiponectin and IL-6 released in the medium (Paper III). Simplified schematic figure on adipose tissue and adipocytes sample experiments is shown in Figure 5.
Figure 5 – Simplified schematic figure on adipose tissue and adipocytes sample experiments. SC, subcutaneous; OM, omental; Short-term incubation: 15 min - 3 h; Long-term incubation: 20 h - 24 h.
Glucose uptake assay
Glucose uptake in subcutaneous and omental adipocytes was assessed according to a previously reported technique (154) and is described in Paper I. Briefly, following short-term incubation (15 min) at 37ºC with either rapamycin, cyclosporin A or tacrolimus (Paper I-II) in glucose-free medium, adipocytes were incubated for a further 15 min with or without human insulin (6 nM). Then D-[U-14C] glucose was added and the incubation
Methods
31
continued for another 45 min. The cells were then separated from the medium by centrifugation through silicone oil and the cell-associated radioactivity was determined by scintillation counting. Under these experimental conditions, glucose uptake is mainly determined by the rate of transmembrane glucose transport (155) and calculated according to the following formula: cellular clearance of medium glucose = (cell-associated
radioactivity × volume)/(radioactivity of medium × cell number × time) (154). After long-term incubation (20 h) with either rapamycin, cyclosporin A or tacrolimus (Paper I and II) in a glucose containing medium, the cells were washed and diluted in a glucose-free medium and glucose uptake was assessed as described above. After incubation of adipose tissue with or without dexamethasone (Paper IV), adipocytes were isolated and glucose uptake was performed as described above.
Protein extraction and immunoblotting
After the indicated pre-incubations (Paper I-III), adipocytes were stimulated with or without a maximal insulin concentration (6 nM) for an additional 15 min. Thereafter, the cells were lysed in ice-cold buffer at 4ºC during 2 h and the insoluble substances were sedimented through centrifugation. The protein content of adipocytes lysate was measured with the bicinchoninic acid protein assay kit and stored at -80ºC. To obtain adipose tissue lysates (Paper III and IV), adipose tissue was homogenized in lysis buffer using a Tissue Lyser. Thereafter the protocol continues as previously described for adipocyte lysates. Immunoblotting (Paper I-IV) was performed as described in Paper I. Briefly, equal amount of protein from each sample were loaded in polyacrylamide gels and proteins were separated according to their electrophoretic mobility using SDS-PAGE. The proteins were then transferred to a nitrocellulose membrane and detection of the proteins of interest was done with the respective primary antibodies, followed by the corresponding secondary antibody linked to horseradish peroxidase. Detection of the proteins was made with a chemiluminescence reagent and visualized using Chemidoc XRS detection system or on high performance chemiluminescence film. For mTOR and IRS1 immunoprecipitation (Paper I), the primary antibodies were coupled with protein G-coupled Dynabeads, as suggested by the manufacturer. Thereafter, 0.5 mg of cell lysates were incubated overnight at 4ºC with 1 µg of antibody coupled with G-coupled Dynabeads. Samples were subjected to SDS-PAGE and continued, as previously reported, for immunoblotting.

Methods
32
Gene expression
RNA from subcutaneous and omental adipose tissue (Paper I, III and IV) was extracted according to the manufacturer’s instructions using the Qiagen Lipid Tissue Kit. The extracted RNA was quantified at 260 nm in a spectrophotometer and cDNA was synthesized with the Applied Biosystems High Capacity cDNA Reverse Transcriptase kit.
Microarray
Microarrays provide a powerful research tool for determination of thousands of genes (transcripts) in a single experiment. It allows visualization of which genes are expressed in a particular tissue under a particular set of conditions, and that can be used to test, as well as, generate new hypothesis. Microarray analysis was performed as described in Paper IV. Briefly, we used the Human Exon 1.0 ST Array from Affymetrix that allows monitoring of over 28,000 gene transcripts in the human genome. For gene expression analysis of human adipose tissues that was incubated either with or without dexamethasone (Paper IV), total RNA was extracted, amplified and used to generate sense-strand cDNA synthesis. The sense-strand cDNA was fragmented and biotin-labelled before hybridization with the microarray. After scanning, the microarray results were analysed with Array Studio Microanalysis Software. To compare the effects of dexamethasone treatment on subcutaneous and omental adipose tissue the statistical general linear model was used.
Real-time PCR
Real-time polymerase chain reaction (real-time PCR) is one of the most sensitive techniques to verify DNA microarray results and further explore the expression of genes of interest. Real-time PCR was performed as described in Paper I, III and IV. We used the ABI Prism 7900 HT Sequencing Detection System that takes advantage of the 5’ nuclease activity of Taq DNA polymerase to generate a fluorescent signal during the thermal cycling of the PCR. The measured fluorescence reflects the amount of amplified product in each cycle. The cycle number at which enough amplified product accumulates to yield a detectable fluorescent signal, is called the threshold cycle. To adjust for differences between the samples not caused by the incubation, for example dilutions and pipetting errors, the data needs to be normalized. Therefore, it is crucial the use of a reference (housekeeping) gene. The normalization was performed with the housekeeping gene 18S rRNA. In Paper I and III, quotient of the expression for each gene was normalized to control, and calculated as a relative fold change. In Paper IV, a standard curve for each primer-probe set of pooled adipose tissue cDNA was used. Therefore, the relative concentrations of the target gene and the housekeeping gene were calculated from the standard curve.

Methods
33
Lipolysis and lipid storage
Lipolysis was performed according to a previous reported technique (156) and as described in Paper III. In brief, the isolated adipocytes were incubated with or without rapamycin (0.01 µM), cyclosporin A (0.1 µM) and tacrolimus (0.1 µM) and with or without isoproterenol (0.01 and 1 µM) and insulin (0-100 µU/ml) in a shaking water bath at 37ºC for 2 h. The medium was then separated from the adipocytes, and the glycerol concentration on the medium was measured by colorimetric absorbance in a kinetic enzymatic analyser and used for estimations of the effects of the IAs on the lipolysis. 14C-glucose and 14C-palmitate incorporation into TAG were used to measure adipocyte lipid storage (Paper III). Briefly, isolated adipocytes were incubated with or without rapamycin (0.01 µM), cyclosporin A (0.1 µM) or tacrolimus (0.1 µM) in a gentle shaking water bath at 37ºC for 2 h. For 14C-glucose incorporation, the medium was supplemented with or without insulin (1000 µU/ml) and D-[U-14C] glucose (0.26 mCi/L, 0.86 µM). For 14C-palmitate incorporation, the medium was supplemented with [1-14C] palmitic acid (1.0 µCi/ml) and sodium-palmitate/BSA-mix (0.12 mM sodium palmitate, 40% BSA). Adipocytes were then separated from medium, and the triglyceride associated radioactivity was measured by scintillation counting after lipid extraction according to Dole and Meinertz method (157).
GLUT4 trafficking in L6 cells
The L6 cell line was originally isolated in 1968 from primary cultures of rat thigh muscle (158). L6 cell exhibits many of the skeletal muscle characteristics seen in vivo, like the ability to differentiate into myotubes, express several proteins typical of skeletal muscle, including GLUT4 glucose transporter, respond to insulin and glucose uptake. In Paper II, we used L6 cells that express the GLUT4 protein with a c-myc epitope inserted into the first ectodomain. One advantage of the L6-GLUT4myc cells is that this cell line provides a quantitative colorimetric assay to measure the dynamic availability of the myc-epitope to the extracellular milieu, without the need to permeabilize or fractionate the cells. Differentiation into myotubes is not necessary to measure glucose uptake or GLUT4myc translocation. L6-GLUT4myc cells were cultured in MEM-α supplemented with 10% FCS, at 37ºC, 5% CO2. At confluence 2 days after seeding, L6-GLUT4myc cells were used to study the effects of either cyclosporin A (0.1 µM) or tacrolimus (0.1 µM) on glucose uptake, cell surface GLUT4myc and GLUT4myc internalization and externalization, as described in Paper II. Cellular transport of 2-deoxy-glucose was measured according to a previously described technique (159). The amount of cell surface GLUT4myc and GLUT4myc

Methods
34
internalization and externalization was determined by an antibody-coupled colorimetric absorbance assay, as previously described (160). The data for the kinetics of GLUT4 endocytosis traffic were fitted by nonlinear regression for a single exponential association (161).
Statistical analyses
Results are given as mean ± standard error of the mean (SEM) unless otherwise stated. Comparisons between treated and untreated cells or tissue were performed within the same individuals to minimize the effects of confounding variables. A p-value <0.05 was considered statistically significant. All variables were tested for normality using the Shapiro-Wilk test. The Student’s paired t-test was applied to compare means of continuous and normally distributed variables; otherwise, the Wilcoxon test was used. Bivariate correlations were performed with Pearson or Spearman correlation coefficients, as appropriate, and statistically significant (p<0.05) variables were log-transformed (if not normally distributed) and subjected to multivariate analysis via step-wise linear regression analysis. Statistical analysis was performed using the SPSS package version 18 (SPSS Inc. Chicago, IL).
Summary of results
35
SUMMARY OF RESULTS Details of the results can be found in Papers I-IV.
Paper I
Rapamycin impairs glucose uptake and alters mTOR and insulin signalling in human subcutaneous and omental adipocytes
Short- and long-term incubation of human subcutaneous and omental adipocytes with a therapeutic concentration of rapamycin (0.01 µM), reduced basal and insulin stimulated glucose uptake by 20-30%, when compared to untreated cells. This effect was concentration dependent (1 nM-10 µM), with a maximal reduction of glucose uptake by 40%. In addition, the degree by which rapamycin inhibited insulin-stimulated glucose uptake, correlated positively with body fat mass and the subcutaneous fat cell diameter, and negatively with the serum levels of HDL cholesterol. Thus, the inhibition of glucose uptake by rapamycin was more pronounced in adipocytes from lean patients (lower fat mass) with smaller adipocytes, and higher serum levels of HDL-cholesterol. Rapamycin inhibited mTORC1 and mTORC2 complex assembly and also inhibited insulin-stimulated PKB Ser473 phosphorylation, an mTORC2 substrate. Short- and long-term incubation with rapamycin had no effect on p70S6K protein levels, but as expected, reduced the insulin-stimulated phosphorylation (~80 %) of p70S6K, an mTORC1 substrate. Rapamycin did not change the amount of IRS1 or its tyrosine phosphorylation in subcutaneous adipocytes, but reduced phosphorylation of IRS1 on several serine residues (307, 616 and 636), compared with untreated adipocytes. Rapamycin incubation induced a time-depended decrease in IRS2 protein levels (up to ~35% reduction after 20 h incubation) in adipocytes, whereas IRS2 mRNA levels were increased by ~50% in adipose tissue. In addition, rapamycin incubation reduced insulin-stimulated phosphorylation of IR by up to 50% after 20 h incubation, but had no effects on IR, PKB, GLUT4/1 and p85-PI3K protein levels.

Summary of results
36
Paper II
Cyclosporin A and tacrolimus reduce glucose uptake in human subcutaneous and omental adipocytes without effecting expression or activation of insulin signalling proteins. Cyclosporin A and tacrolimus remove GLUT4 from the cell surface via an increased rate constant of endocytosis in L6 cells.
Short- and long-term incubation with either cyclosporin A or tacrolimus reduced both basal and insulin stimulated glucose uptake in subcutaneous and omental adipocytes. The inhibitory effect was concentration-dependent (10 nM-1 µM), by up to 40%, and occurred at therapeutic concentrations used as immunosuppressive therapy. Incubation of adipocytes with tacrolimus reduced IR phosphorylation by ~30%. However, the proteins levels and phosphorylation of relevant insulin signalling proteins (IRS1, IRS2, PKB, AS160, GLUT4/1, mTOR and p70S6K) was unaffected by both cyclosporin A and tacrolimus. In addition, cyclosporin A and tacrolimus, reduced by 60% the amount of insulin-stimulated GLUT4 at the adipocyte surface, but had no effect on basal amounts of GLUT4 at the cell surface. The effects of cyclosporin A and tacrolimus on glucose uptake and amount of GLUT4 at the cell surface were also investigated in L6 cells. Cyclosporin A and tacrolimus inhibited insulin-stimulated glucose uptake and the amount of GLUT4myc at the cell surface in L6 cells. No effects of the agents were detected in basal (non-stimulated) conditions. In addition, cyclosporin A and tacrolimus increased the insulin-stimulated GLUT4myc rate for endocytosis by 30 and 47%, respectively. This suggests an increased rate of GLUT4 internalization, which may reduce the exposure of the GLUT4 at the cell surface membrane, and contribute to the reduction in glucose uptake.
Paper III
Rapamycin, cyclosporin A and tacrolimus enhance lipolysis and inhibit lipid storage in human subcutaneous adipocytes. Tacrolimus and rapamycin altered the expression of lipogenic genes in human subcutaneous and omental adipose tissue.
All three IAs, rapamycin, cyclosporin A and tacrolimus, increased isoprenaline-induced lipolysis by 20-35%, and isoprenaline-stimulated phosphorylation of HSL Ser563, one of the main lipases involved in lipolysis. In addition, rapamycin increased basal lipolysis by ~20% in subcutaneous adipocytes, and reduced both gene and protein expression of perilipin. Perilipin is a lipid droplet coating protein that serves important functions in the

Summary of results
37
regulation of basal and hormonally stimulated lipolysis. Rapamycin reversed the antilipolytic effect of insulin, whereas no effects were observed for cyclosporin A or tacrolimus. Furthermore, the IAs reduced lipid storage by 20-35%, whereas the insulin-stimulated lipogenesis was down regulated by ~10%. Rapamycin reduced the expression levels of genes involved on fatty acid uptake and storage (FABP4/aP2 and SREBP1, respectively) in subcutaneous adipose tissue. In contrast, the gene expression of LPL was increased by rapamycin in both depots. It was also observed that tacrolimus inhibited the gene expression of genes involved in the uptake and transport of fatty acids (CD36 and FABP4/aP2, respectively) in both subcutaneous and omental adipose tissue. No effects were observed with cyclosporin A in any of the studied lipogenic genes. The gene expression of IL-6, an adipokine known to have pro-inflammatory effects, was increased in subcutaneous and omental adipose tissue that was incubated with all three IAs, although only significant for the subcutaneous depot. An increase in IL-6 was also observed in the incubation media from the subcutaneous adipose tissue, upon incubation with rapamycin. On the other hand, no changes were observed on the expression of either TNF-α or adiponectin upon exposition of adipose tissue to the three IAs. Table 3 shows a summary of the effects of the IA on human adipocytes/adipose tissue glucose and lipid metabolism (Paper I-III). Table 3. Summary of IA effects on human adipocytes/adipose tissue. From Paper I-III. Rapamycin Cyclosporin A Tacrolimus Glucose uptake ↓ ↓ ↓ IR-phosphorylation ↓ ↔ ↓ IRS1 Ser phosphorylation ↓ nd nd IRS2 protein ↓ ↔ ↔ PKB Ser473 phosphorylation ↓ ↔ ↔ GLUT4 endocytosis nd ↑ ↑ Lipolysis ↑ ↑ ↑ Lipid storage ↓ ↓ ↓ Lipogenic genes ↓ ↔ ↓ IL6 gene expression/production ↑ ↑ ↑ ↓, decreased; ↑, increased; ↔, no change; nd, not done

Summary of results
38
Paper IV
Dexamethasone increased the expression of FKBP5 is human subcutaneous and omental adipose tissue and the expression of FKBP5 was correlated with clinical and biochemical markers of insulin resistance. DNA microarray analysis showed that dexamethasone at a supra-physiological and a maximally effective concentration (3 µM) suppressed genes related to immune/inflammatory responses. The two genes with the greatest increase in gene expression after dexamethasone incubation were FKBP5 and cannabinoid receptor 1 (CNR1). In contrast, rapamycin decreased FKBP5 gene expression in both adipose tissue depots. Moreover, dexamethasone increased the FKBP5 gene and its protein (FKBP51) expression in a dose-dependent manner in both fat depots. Basal FKBP51 protein levels were 10-fold higher in omental than in subcutaneous adipose tissue. FKBP5 gene expression in subcutaneous depot positively correlated with serum insulin, homeostasis model assessment-insulin resistance (HOMA-IR) and subcutaneous adipocyte diameter. This suggests that its gene expression in subcutaneous adipose tissue may be increased in states of insulin resistance. In addition, the fold change in gene expression exerted by dexamethasone was negatively correlated with HbA1c, BMI, HOMA-IR and serum insulin, but only in subcutaneous adipose tissue. In this study only serine-rich and transmembrane domain containing 1 (SERTM1) gene displayed a different response to dexamethasone in the two fat depots. SERTM1 gene expression was clearly down-regulated in omental adipose tissue, but unchanged in subcutaneous adipose tissue. The leptin and metallopeptidase inhibitor 4 (TIMP4) genes, encoding for secreted factors, were also up-regulated by incubation with dexamethasone in both subcutaneous and omental adipose tissue. In addition, dexamethasone reduced basal and insulin-stimulated glucose uptake in subcutaneous and omental adipocytes, but omental adipocytes had a greater sensitivity to the metabolic effects of dexamethasone.

Discussion
39
DISCUSSION Immunosuppressive agents have remarkably improved the success rate of organ transplantation. Besides the expected increase in infection susceptibility, development of other adverse effects has become evident following long-term use of these drugs. These undesired effects include diabetes, dyslipidemia, cardiovascular diseases and malignancies, and have an adverse effect on patient morbidity and mortality. Thus, studies on the underlying mechanisms by which these drugs affect glucose and lipid metabolism, are warranted in order to develop pharmacological approaches for treatment and prevention that mitigate these unwanted side-effects. Adipose tissue is a well recognized endocrine organ that participates actively in energy regulation, through a network of endocrine, paracrine and autocrine signals (62). Importantly, dysregulation of adipose tissue metabolism may lead to a cluster of metabolic alterations that may affect total body glucose and lipid metabolism and insulin sensitivity.
Effects of rapamycin, cyclosporin A and tacrolimus on glucose uptake
Similar to type 2 diabetes, new onset diabetes (NODAT) results from an imbalance between insulin sensitivity and insulin secretion (23, 24). It is well established by both in vitro and clinical studies that IAs impair pancreatic β-cell proliferation and insulin production in a dose dependent manner (35, 36, 41, 103). The potential impact of the IAs on insulin sensitivity is less clearly defined. Several clinical studies have indicated that treatment with IAs can reduce insulin sensitivity in peripheral tissues (23, 32, 33, 137, 162), but the underlying mechanism(s) are not known. In Paper I and II we show, for the first time, that rapamycin, cyclosporin A and tacrolimus, within the range of the clinical therapeutic concentrations, impair both basal and insulin stimulated glucose uptake in human subcutaneous and omental adipocytes. The inhibitory effects of the IAs on glucose uptake could be detected already after a short-term incubation time (75 min) and at concentrations even lower than those recommended during immunosuppressive therapy. Results from randomized clinical trials and meta-analyses demonstrate a higher incidence of NODAT in patients treated with tacrolimus than with cyclosporin A (96, 111-113), but these findings has not been confirmed by others (114, 115). In our in vitro model (Paper I

Discussion
40
and II), rapamycin, cyclosporin A and tacrolimus had similar dose-response effects on glucose uptake, with a maximal inhibition of ~40% in subcutaneous adipocytes. It is thought that visceral adiposity is more metabolically active than subcutaneous fat and more strongly associated with adverse metabolic risk, including insulin resistance (63, 64). However, in our in vitro model we did not find any differences in the IAs effects on glucose uptake between subcutaneous and omental adipocytes. Interestingly, subcutaneous adipocytes from lean subjects and with a normal lipid pattern (higher HDL-cholesterol levels) may be more sensitive to the inhibitory effects of rapamycin on glucose uptake (Paper I). On the other hand, adipocytes from obese individuals are usually larger (hypertrophic) and characterised by reduced insulin sensitivity already at baseline (163). This may mask a worsening of glucose uptake by rapamycin incubation. Newly all transplanted patients need to take at least one of the IAs for the rest of their life, and the long-term effects may take place over a long period of time. Therefore, we investigated whether a longer incubation time (20 h) with the IAs could have a more pronounced inhibitory effect on adipocyte glucose uptake. The degree of inhibition of insulin-stimulated glucose uptake after short- and long-term incubation with either rapamycin, cyclosporin A or tacrolimus (Paper I and II) appear to be similar. However, we can not directly translate our findings from long-term incubation (20 h) in an in vitro model, to long-term clinical use for several years. Adipose tissue only accounts for ~10% of the insulin-stimulated whole body glucose uptake, whereas skeletal muscle and liver are the major sites for insulin-stimulated glucose uptake (164). A reduction in the relatively small glucose uptake by adipose tissue is unlikely to lead to a marked whole body insulin resistance during immunosuppressive therapy in vivo. However, there is strong evidence that dysfunction of the adipose tissue plays a crucial role in the development of insulin resistance (165). In line with this, a mouse with adipose tissue-selective depletion of GLUT4 promotes impaired glucose intolerance, apparently due to secondary insulin resistance in muscle and liver (166). This suggests that besides contributing to whole-body glucose uptake, adipose tissue can also regulate glucose metabolism in other-insulin sensitive tissues. In addition, impaired insulin signalling in adipose tissue, including reduced IRS1 expression, impaired PKB activity and reduced GLUT4 expression, is detected in normoglycemic individuals with genetic predisposition to type 2 diabetes (167). Therefore, impaired insulin action in adipose tissue could represent an early stage before whole body glucose intolerance (165). In addition, all three IAs reduced L6 muscle-derived cells insulin-stimulated glucose uptake. This suggests that these agents may not only reduce glucose uptake in adipocytes, but also in other insulin-sensitive cells such as muscle cells.

Discussion
41
Effects of rapamycin, cyclosporin A and tacrolimus on insulin signalling
In our study (Paper I), we show that rapamycin reduces mTOR-raptor (components of mTORC1), mTOR-rictor and mTOR-Sin1 (components of mTORC2) interactions. This suggests that rapamycin inhibits both mTORC1 and mTORC2 complex formation in human adipocytes. Rapamycin is known to be an mTORC1 inhibitor. Sarbassov et al (132) has previously demonstrated that in several cell types, including 3T3-L1 cells, prolonged rapamycin treatment also inhibits mTORC2 complex formation. mTORC2 assembly is necessary for the serine phosphorylation of PKB (78). An impairment of mTORC2 could therefore contribute to the decreased PKB serine phosphorylation and down-regulation of AS160 phosphorylation observed in adipocytes incubated with rapamycin. Phosphorylation of AS160 is required for GLUT4 translocation to the plasma membrane and subsequent glucose uptake (79). Several studies have shown that activation of the mTOR pathway is implicated in development of insulin resistance and type 2 diabetes (128, 168). These studies have demonstrated that the mTOR-p70S6K pathway directly increases phosphorylation of IRS1 at several serine residues and thus inhibits its function, promotes its degradation, and, possibly, inhibits insulin signalling (127). In contrast, more recent studies have demonstrated that adipocytes from obese patients with type 2 diabetes have attenuated mTOR signalling (169). In fact, multi-site serine phosphorylation of IRS1, has been shown to modulate both negative and positive feedback signals (170). Surprisingly, in Paper I, reduction of phosphorylation of several IRS1 serine residues by rapamycin did not alter the insulin-stimulated tyrosine phosphorylation of IRS1 or its association with the p85 subunit of PI3K. Interestingly, a previous study has demonstrated that long-term treatment with rapamycin reduces insulin-stimulated IRS1 tyrosine phosphorylation in circulating mononuclear cells, and that this reduction is correlated to the increase in the patient’s insulin resistance (171). In addition, rapamycin reduced IRS2 protein expression levels. IRS2 together with IRS1, are the most important IRS proteins in the regulation of glucose uptake (77). IRS2 knockout mice did not only show insulin resistance of muscle, fat and liver, but also manifest diabetes as a result of β-cell failure (172). mTOR inhibition with rapamycin has often shown discrepant findings, but in our in vitro model, mTOR inhibition with rapamycin resulted in inhibition of glucose uptake and impaired insulin signalling. These effects may contribute to insulin resistance during therapy with rapamycin.

Discussion
42
In Paper II, we show that although phosphorylation of IR was inhibited by tacrolimus, the expression and phosphorylation of insulin signalling proteins (IRS1, IRS2, p85-PI3K and PKB) was unaffected by both cyclosporin A and tacrolimus, as was mTOR and p70S6K. In addition, we demonstrate that cyclosporin A and tacrolimus reduced insulin-stimulated levels of the glucose transporter GLUT4 at the plasma membrane but they did not change total protein levels of GLUT4 or GLUT1. These results suggest that the inhibitory effect of cyclosporin A and tacrolimus on cell surface GLUT4 and glucose uptake are not mediated thought effects on insulin signalling proteins. Other alternatives to PKB signalling also need to be considered in future studies. For example, the atypical PKC isoforms, PKCλ and PKCζ, increase GLUT4-dependent glucose uptake when activated by PI3K (173). Conversely, overexpression of dominant-negative forms of these PKC isoforms inhibits insulin-stimulated glucose transport and translocation of the GLUT4 to the plasma membrane (174). The intracellular trafficking that regulates the amount of GLUT4 at the cell surface is a dynamic complex itinerary that involves different steps (175). The translocation of GLUT4 to the plasma membrane, a process called exocytosis, is initiated by the release of GLUT4 storage vesicles from intracellular retention and GLUT4 translocation to the cell surface (which likely involves transport of GLUT4 storage vesicles along cytoskeleton structures). Subsequent tethering, docking and fusion of GLUT4 storage vesicles at the plasma membrane are also required for an efficient GLUT4 surface delivery. Finally, GLUT4 is internalized from the plasma membrane through a process called endocytosis. In Paper II, we used L6 muscle derived cells to determine the exocytic and endocytic rates of the GLUT4 transporter (160). We show, for the first time, that in L6 cells, cyclosporin A and tacrolimus inhibit insulin-stimulated glucose uptake and affect GLUT4 trafficking by increasing the insulin-stimulated rate for endocytosis. In contrast to the effects on human adipocytes, cyclosporin A and tacrolimus did not affect non-stimulated glucose uptake and GLUT4 trafficking in muscle cells. In both muscle and adipose cells GLUT4 internalization occurs through both clathrin-dependent and clathrin-independent endocytosis, but different mechanisms may operate in muscle and adipocyte cells (175). In addition, internalization is also distinctly regulated in the two cell types, since insulin reduces the rate of endocytosis in adipocytes (176), but not in muscle (177) cells. A key question is how cyclosporin A and tacrolimus alter intracellular trafficking of GLUT4? Additional studies, evaluating the effects on protein expression or co-localization experiments with other proteins involved in GLUT4 trafficking (e.g. clathrin and transferrin) are necessary to confirm that cyclosporin A and tacrolimus can affect the GLUT4 endocytosis rate.
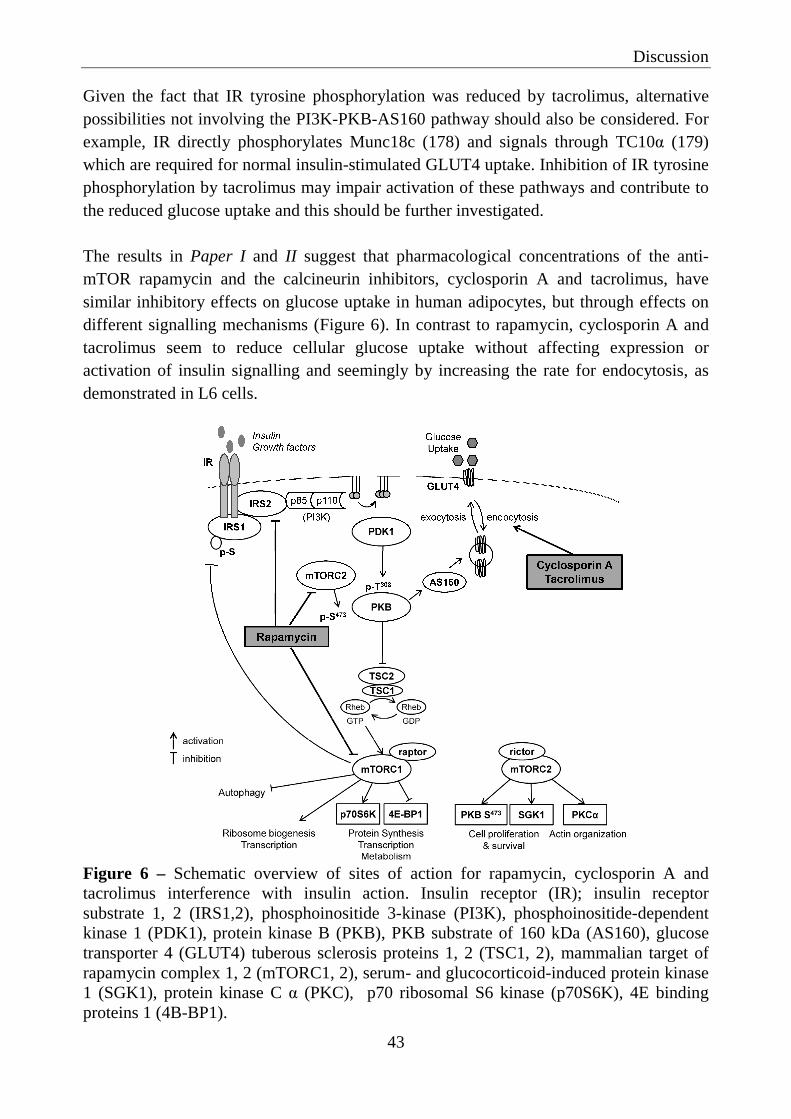
Discussion
43
Given the fact that IR tyrosine phosphorylation was reduced by tacrolimus, alternative possibilities not involving the PI3K-PKB-AS160 pathway should also be considered. For example, IR directly phosphorylates Munc18c (178) and signals through TC10α (179) which are required for normal insulin-stimulated GLUT4 uptake. Inhibition of IR tyrosine phosphorylation by tacrolimus may impair activation of these pathways and contribute to the reduced glucose uptake and this should be further investigated. The results in Paper I and II suggest that pharmacological concentrations of the anti-mTOR rapamycin and the calcineurin inhibitors, cyclosporin A and tacrolimus, have similar inhibitory effects on glucose uptake in human adipocytes, but through effects on different signalling mechanisms (Figure 6). In contrast to rapamycin, cyclosporin A and tacrolimus seem to reduce cellular glucose uptake without affecting expression or activation of insulin signalling and seemingly by increasing the rate for endocytosis, as demonstrated in L6 cells.
Figure 6 – Schematic overview of sites of action for rapamycin, cyclosporin A and tacrolimus interference with insulin action. Insulin receptor (IR); insulin receptor substrate 1, 2 (IRS1,2), phosphoinositide 3-kinase (PI3K), phosphoinositide-dependent kinase 1 (PDK1), protein kinase B (PKB), PKB substrate of 160 kDa (AS160), glucose transporter 4 (GLUT4) tuberous sclerosis proteins 1, 2 (TSC1, 2), mammalian target of rapamycin complex 1, 2 (mTORC1, 2), serum- and glucocorticoid-induced protein kinase 1 (SGK1), protein kinase C α (PKC), p70 ribosomal S6 kinase (p70S6K), 4E binding proteins 1 (4B-BP1).

Discussion
44
Effects of rapamycin, cyclosporin A and tacrolimus on lipid metabolism
In Paper III, we show that rapamycin, cyclosporin A and tacrolimus increase isoproterenol-stimulated lipolysis in human subcutaneous adipocytes and that rapamycin also increase basal lipolysis. The mechanism underlying these effects on lipolysis is not known, but our results show that the three IAs increased phosphorylation of HSL on Ser552, one of the major sites controlling HSL activity (180). Soliman et al (147), also demonstrated that rapamycin increases lipolysis and phosphorylation of HSL, without affecting cellular cAMP levels, or PKA phosphorylation. Besides PKA, HSL phosphorylation on Ser552 is also regulated by glycogen synthase kinase-4 (181). Other protein kinases (e.g. extracellular signal-regulated kinase and AMPK) have also been shown to regulate HSL enzyme activity by phosphorylation of other serine sites. Thus assessment of activation of other regulators of HSL will be important in further work evaluating the effects of IAs on lipolysis. In addition, rapamycin also reduced perilipin gene and protein expression. Isolated adipocytes of perilipin null mice exhibit elevated basal lipolysis because of the loss of the protective function of perilipin (58). Therefore reduced perilipin protein levels may contribute to increase basal lipolysis during rapamycin incubation. Notably, rapamycin impaired the antilipolytic effect of insulin, while cyclosporin A and tacrolimus did not (Paper III). PKB is critical for the ability of insulin to activate phosphodiesterase 3B, and thereby its antilipolytic effect (182). Thus, the inhibitory effect of rapamycin on PKB serine phosphorylation (Paper I) could also have contributed to this finding. In Paper III we also show that rapamycin, cyclosporin A and tacrolimus reduce the synthesis of TAG from fatty acids (esterification) and glucose (lipogenesis). The inhibition on glucose uptake by rapamycin (Paper I) and by cyclosporin A and tacrolimus (Paper II) could also contribute to the reduced lipogenesis. Surprisingly in Paper III, we show that LPL gene expression was increased by rapamycin in both subcutaneous and omental adipose tissue. LPL mediated hydrolysis of circulating lipoprotein-TAG provides the adipocytes with fatty acids (52). Thus increased LPL gene expression by rapamycin would contribute to adipose tissue clearance of circulating lipoprotein-TAG. Previous studies have shown that rapamycin reduces LPL gene expression and activity in the retroperitoneal adipose tissue of rats (144, 145) and LPL activity in human plasma (183). When considering the conflicting results between our and previous studies regarding LPL expression in adipose tissue, it should be emphasized that activity, rather than gene expression, is most relevant to measure, and this has been not measured so far.

Discussion
45
We also observed an inhibition of the expression of two PPARγ target genes, the CD36 and FABP4/aP2 in adipose tissue incubated with tacrolimus. PPARγ is a “master regulator” of adipogenesis and adipocyte lipid metabolism (184). In addition, it has been implicated in playing an important role in obesity-related metabolic diseases such as hyperlipidemia, insulin resistance, and coronary artery disease. A co-ordinated down-regulation of CD36 and PPARγ by tacrolimus has been shown in a human THP-1 macrophage model (185). Therefore it is important to further investigate effects of tacrolimus on PPARγ in human adipose tissue in future studies. Recent studies have demonstrated that mTORC1 plays an active role in lipid synthesis by promoting activation of SREBP1, a fundamental transcription factor involved in insulin mediated fatty acid synthesis (186). The SREBP1 gene gives rise to two proteins, SREBP1a and SREBP1c, by alternative splicing. The transcription potency of SREBP1a is higher than that of SREBP1c, but SREBP1c is the dominant isoform involved in insulin-mediated fatty acid synthesis. In Paper III, we show that rapamycin, during non-stimulated conditions, inhibits SREBP1 gene expression (both isoforms), as well as it co-activator lipin 1 (186) in subcutaneous adipose tissue. In contrast, FAS gene expression was not changed by rapamycin, indicating that SREBP1c activity was not affected. Consequently, the effects of rapamycin on SREBP1a and SREBP1c in human adipose tissue should be further investigated and especially insulin-stimulated conditions should be evaluated. In addition to effects on lipid storage, treatment of subcutaneous and omental adipose tissue with either rapamycin, cyclosporin A or tacrolimus (Paper III), lead to an increase in IL-6 gene expression and secretion. IL-6 is a circulating cytokine that is involved in different cellular processes and has both pro-inflammatory and anti-inflammatory properties (62). Adipose tissue IL-6 expression and circulating IL-6 concentrations are positively correlated with obesity, dyslipidemia, impaired glucose tolerance and insulin resistance (187). In addition, high levels of IL-6 in the circulation are associated with reduced adipose tissue glucose uptake (188) and increased lipolysis (189). Thus, we can not exclude that reduction of glucose uptake or stimulation of lipolysis after incubation with the IAs, could be an indirect effect of secreted IL-6 in the incubation media. In Paper I, II and III, incubation with either rapamycin, cyclosporin A or tacrolimus reduced both basal and insulin stimulated glucose uptake in human adipocytes, enhanced lipolysis stimulation and impaired lipid storage partially via down-regulation of lipogenic genes in adipose tissue. Hence, these findings may contribute to higher circulating levels of glucose, glycerol and FFA production, and a reduced plasma lipid clearance, promoting insulin resistance in skeletal muscle, liver and pancreatic β-cells (61). Plasma FFA are recognized as one of the major substrates for hepatic VLDL production (190). Therefore, simultaneous increase in FFA delivery and reduced VLDL catabolism by adipocytes
Discussion
46
during immunosuppressive therapy can contribute to increased hepatic VLDL secretion. This can provide one explanation for the increased plasma VLDL levels observed during immunosuppressive therapy (44, 46). Fatty acid flux into muscle can also increase the intramuscular levels of lipid metabolites, such as acyl CoA and diacylglycerol (191) and contribute to insulin resistance in skeletal muscle by defects in insulin signalling (192).
Effects of dexamethasone on adipose tissue gene expression
Endogenous glucocorticoid excess (e.g. Cushing’s syndrome) or during prolonged corticosteroid therapy, induces hyperglycemia, insulin resistance, central obesity and other components of the metabolic syndrome including dyslipidemia and hypertension (82, 193). Central obesity, in particular visceral obesity, is associated with increased risk of cardiovascular diseases (194). It also contributes to the development of the components of the metabolic syndrome and inflammation, as well as activation of the immune system. Thus, identification of genes regulated by glucocorticoids in adipose tissue, that may be associated with insulin resistance and activation of the inflammatory/immune system, are of interest and may indicate novel biomarkers for adipose tissue insulin resistance induced by glucocorticoids. In Paper IV, we identified an expected down-regulation of expression of genes related to immune/inflammatory responses in both subcutaneous and omental adipose tissue incubated with dexamethasone, according to microarray analysis. The genes with the greatest increase in gene expression after dexamethasone incubation were CNR1 and FKBP5. CNR1 is mostly expressed in central nervous system, but it is also found in other peripheral tissues, including adipose tissue (195). Recently, it has been suggested that CNR1 modulation alters cytokine production (e.g. adiponectin) in human omental adipose tissue (196). CNR1 has not previously been identified as a gene regulated by glucocorticoids in adipose tissue and our findings thus warrant further investigations. FKBP5 is a member of the family of immunophilins with peptidyl cis-trans isomerase activity (197). The protein encoded by this gene, FKBP51 was firstly shown to mediate T-cell inhibition by forming a complex with tacrolimus and rapamycin (198, 199). Subsequently, the protein was shown to be involved in the modulation of glucocorticoid receptor function, by forming a complex with the heat shock proteins Hsp70/Hsp90 (200). It is well established that FKBP5 reduces glucocorticoid sensitivity and several studies have presented data supporting the induction of FKBP5 by glucocorticoids (85, 201). To the best of our knowledge, this is the first study reporting that FKBP5 gene and protein levels are regulated by dexamethasone in both human subcutaneous and omental adipose tissue. In contrast, rapamycin reduced FKBP5 gene expression (Paper IV). This suggests

Discussion
47
that the dexamethasone-mediated increase in FKBP5 gene expression is not a general effect related to immunosuppressive therapy. A recent discovery suggests that FKBP5 has functions extending beyond its role in glucocorticoid receptor signalling. It was shown that FKBP51 acts as a scaffolding protein for PKB and to its phosphatase, PH domain leucine-rich repeat protein phosphatase, and it promotes dephosphorylation of PKB (202). This has potentially important implications for PKB activity and down-stream effects. Interestingly, basal FKBP5 gene expression in subcutaneous adipose tissue was correlated positively with HOMA-IR, subcutaneous adipocyte diameter and serum insulin. This suggests that FKBP5 gene expression is increased in states of insulin resistance. Some studies have shown a correlation between plasma cortisol concentration and components of the metabolic syndrome and insulin resistance (calculated as HOMA-IR) (203, 204), although this has not been found by others (205). In addition, obesity and insulin resistance are associated with increase expression of adipose tissue 11-beta hydroxysteroid dehydrogenase type 1, that converts inactive cortisone into active cortisol locally (206). Thus we can not exclude the possibility that the observed high basal levels of FKBP5 in subcutaneous adipose tissue in individuals displaying insulin resistance may be due to increased circulating and/or tissue levels of cortisol in these individuals. Unfortunately plasma cortisol levels and other parameters of glucocorticoid metabolism were not measured in the blood samples from the subjects in Paper IV. Therefore, FKBP5 gene expression seems to be correlated with insulin resistance and adiposity and is altered by dexamethasone and rapamycin. These findings suggest that FKBP5 can be one important link between the insulin resistance and the immune modulation caused by these drugs and awaits further confirmation. In an attempt to identify potential links between genes induced by dexamethasone and secreted factors, we also identified leptin and TIMP4. Leptin appear to be regulated by dexamethasone in both subcutaneous and omental adipose tissue, as reported by microarray studies (94). However, plasma leptin levels increase with adiposity (207), thus, it may not be an optimal biomarker to study effects of glucocorticoids. TIMP4 is a metalloproteinase inhibitor and it is up-regulated in human cardiovascular disorders, suggesting its use as a marker for vascular inflammation (208). TIMP4 has not previously been identified as a gene regulated by glucocorticoids in adipose tissue, and our findings may warrant further investigations on its potential utility as a biomarker. Previous studies have demonstrated sex- and depot-specific differences in sensitivity and responsiveness to glucocorticoid effects. Our group has previously reported that glucocorticoids reduce the glucose uptake capacity in omental but not in subcutaneous

Discussion
48
human adipocytes (92). In parallel, a down-regulation of the cellular levels of the insulin signalling proteins IRS1 and PKB were demonstrated in omental adipocytes. Thus, identification of genes differentially regulated by dexamethasone may help to identify mechanisms by which glucocorticoids contribute to depot differences in adipose tissue function. Surprisingly, in our study (Paper IV) only one gene, SERTM1, was differently regulated by dexamethasone at supra-physiological concentrations in the two fat depots. SERTM1 displayed a clear change only in the omental adipose tissue. However, SRETM1 is a gene with unknown function, thus further studies are needed to determine whether this gene can contribute to the depot differences in sensitivity and responsiveness to glucocorticoid effects. The primary advantages of in vitro studies are that they give rapid readouts, are relatively inexpensive and permit simplification, so that a specific mechanism in tissues or cells can be tested. But, even though we have used human adipose tissue in our studies, we need to be cautions when extrapolating in vitro results to the in vivo situation. Nonetheless, impairment of glucose uptake and dysregulated lipolysis and lipid storage in adipocytes may be mechanisms underlying impaired glucose and lipid metabolism observed in patients treated with immunosuppressive agents. The perturbations found in adipose tissue, may also have an impact in other insulin sensitive tissue such as skeletal muscle and liver. Firstly, similar mechanisms could be relevant in those tissues and, secondly, dysregulated adipose metabolism can lead to altered inter-tissue signalling, i.e. via adipokines that in turn affect metabolism in other tissues. We have elucidated effects of immunosuppressive agents on human adipose metabolism and we propose links to inflammatory mechanisms. Figure 7 gives an overview of the demonstrated drug effects and the hypothetical interactions between pathways.
Figure 7 – Hypothetically schematic overview of effects of rapamycin, cyclosporin A and tacrolimus and dexamethasone on adipose tissue metabolism.

References
49
CONCLUDING REMARKS Taken together, our results suggest that therapeutic concentrations of rapamycin, cyclosporin A and tacrolimus impair glucose uptake in human subcutaneous and omental adipocytes, via partly different mechanisms. The effects of rapamycin on glucose uptake may be explained by the decreased mTORC1 and mTORC2 assembly and by alterations in the insulin signalling pathway. Tacrolimus and cyclosporin A, on the other hand, seem to reduce cellular glucose uptake without affecting expression or activity of insulin signalling components. Instead, cyclosporin A and tacrolimus may enhance the rate of endocytosis of the glucose transporter GLUT4, thus leading to a redistribution from the surface to the interior of the cell. In addition, rapamycin, cyclosporin A and tacrolimus enhance lipolysis in adipocytes and they inhibit lipid storage and the expression of related genes. This may contribute to dyslipidemia and also to insulin resistance found in patients on immunosuppressive therapy. Furthermore, we show that dexamethasone influences gene expression similarly in the two studied fat depots, i.e. subcutaneous and omental adipose tissue. FKBP5 was identified as being strongly regulated by dexamethasone, in both subcutaneous and omental adipose tissue. In addition, its expression appears to be correlated with markers of insulin resistance and adiposity. FKBP5 may be a mechanism involved in glucocorticoid-induced insulin resistance and it could potentially also provide a link between regulation of nutrient metabolism and immune response. It should be acknowledged that the molecular mechanisms associated with the development of insulin resistance and dyslipidemia during immunosuppressive therapy need to be explored in more detail, and tissues other than adipose should also be addressed. Importantly, the clinical relevance of the present findings needs to be demonstrated in controlled trials in patients treated with immunosuppressive agents. In conclusion, adverse effects of immunosuppressive agents on human adipose tissue glucose and lipid metabolism may contribute to the development of insulin resistance, diabetes and dyslipidemia in patients receiving such drugs. The cellular mechanisms described in this thesis may provide novel pharmacological approaches for prevention and treatment of metabolic disorders associated with immunosuppressive therapy. Such mechanisms could potentially also be of relevance for future treatments for type 2 as well as other forms of diabetes.

References
50
ACKNOWLEDGEMENTS This thesis would not have been possible without the help and support from many people. Especially I would like to thank: Jan Eriksson, my main supervisor, for valuable inputs, caring, patience, support and for allowing me to work independently. Thank you for all the non-scientific and scientific discussions that inspired me both in times of success and failure. I am grateful for your belief in me and for the challenge of changing my PhD registration from Portugal to Sweden. Aureliano Alves, my co-supervisor, for always being supportive and a challenger. Since we met, you have been my professor, mentor and friend. Thank you for inspiring me into “drawing” a scientist in my life. Eugénia Carvalho, my co-supervisor, thank you for all the support and inspiration. I admire your energy and optimism. Jenny Palming, my co-supervisor, a special thank for the limitless support and friendship you gave me since I first arrived to Sweden. You were always there when I needed help (and still are) or advice. Thank you simply for being who you are. Maria Svensson, my co-supervisor, thank you for your valuable inputs, never-ending kind concern and consideration, for so many biopsies and immense social skills with the patients, for keeping track of all our adipose tissue donors and always giving me “a little more” in many, many ways... Ulf Smith, for being always willing to share your immense scientific knowledge with me. Thank you for your great advice. My co-authors, especially Per-Arne Svensson and Mårten Hammar, for valuable comments and fruitful scientific discussions. Gunilla Lindell and Lisbeth Eriksson for administrative help during these years. Silvia Gogg thank you for all the great moments we spend together, all the scientific valuable comments, and essentially for your friendship and great pieces of advice. Emmelie Cansby, for many hours of chatting and laughing, for your energy and enthusiasm and above all for your friendship!

References
51
Ida Sterner, Ann Hammarstedt, Shahram Hedjazifar, Christian Andersson, Lachmi Jenndahl, Birgit Gustafson, Margit Mahlapuu, Annika Nerstedt, Carina Blomgren, John Grünberg, Manoj Amrutkar, Lena Silberberg, Sofia Bertolino, Lena Strindberg, Per-Anders Jansson and Aino Johansson, for taking your time to answer all my questions, scientific advice, for many great times, dinners and for introducing me to the Swedish culture! All other past and present co-workers at the Lundberg Laboratory for Diabetes Research. The surgeons, Margus Rizell, Marcus Gabel, Niclas Kvarnström, Bengt Gustafsson and Jan Dalenbäck for all your precious collaboration and many, many adipose tissue samples. The patient coordinator at Transplantationscentrum, Sahlgrenska Universitetssjukhuset, Ulla-Maj Andersson and the study coordinator, Ingela Broman for your collaboration and keeping track of the patients. Maria Falkdal, Ellen Christoffersen and Karin Bengtsson for help with recruitment of patients and biopsies. All patients and volunteers that donated fat biopsies and made this work possible. Thank you for all my friends and relatives that have been always supporting me “at the distance”. And at last but not the least... Minha mãe, irmão e querida sobrinha Raquel, por todas as palavras e conselhos, e especialmente amor condicional não apenas nestes últimos anos, mas desde toda a minha vida. Sem o vosso suporte e amizade eu nunca teria alcançado este dia na minha vida. Meu companheiro, Luís Amoroso, que se prontificou a doar tecido adiposo para os meus estudos e que tão pacientemente tem esperado por mim ao longo destes anos. Mais uma vez a tua vida deu uma volta e aqui estás ao meu lado nesta jornada na Suécia. Amo-te muito e nunca esquecerei todo teu apoio em tantas decisões. This work was supported by research grants from the Portuguese Foundation for Science and Technology (SFRH/BD/41044/2007 and PTDC/SAU-OSM/104124/2008), the University of Gothenburg/Sahlgrenska University Hospital (LUA/ALF ALFGBG-11379), AstraZeneca R&D, the Regional FoU-support Västra Götalandsregionen (VGFOUREG-12052) and the Swedish Heart and Lung Foundation project (20100648), Sweden.
References
52
REFERENCES 1. 2012 Diagnosis and classification of diabetes mellitus. Diabetes Care 35 Suppl
1:S64-71 2. Stumvoll M, et al. 2005 Type 2 diabetes: principles of pathogenesis and therapy.
Lancet 365:1333-1346 3. Shaw JE, et al. 2010 Global estimates of the prevalence of diabetes for 2010 and
2030. Diabetes Res Clin Pract 87:4-14 4. Frayling TM 2007 Genome-wide association studies provide new insights into
type 2 diabetes aetiology. Nat Rev Genet 8:657-662 5. Freathy RM, et al. 2008 Common variation in the FTO gene alters diabetes-
related metabolic traits to the extent expected given its effect on BMI. Diabetes 57:1419-1426
6. Izzedine H, et al. 2005 Drug-induced diabetes mellitus. Expert Opin Drug Saf 4:1097-1109
7. Haffner SM, et al. 1998 Mortality from coronary heart disease in subjects with type 2 diabetes and in nondiabetic subjects with and without prior myocardial infarction. N Engl J Med 339:229-234
8. Engelgau MM, et al. 2004 The evolving diabetes burden in the United States. Ann Intern Med 140:945-950
9. http://www.usrds.org/, accessed on 12 October 2012. 10. http://www.unos.org/and, accessed on 12 October 2012. 11. http://www.medscinet.net/snr/, accessed on 12 October 2012. 12. Gaston RS, et al. 2004 Transplantation in the diabetic patient with advanced
chronic kidney disease: a task force report. Am J Kidney Dis 44:529-542 13. Tyden G, et al. 2000 Combined pancreas and kidney transplantation improves
survival in patients with end-stage diabetic nephropathy. Clin Transplant 14:505-508
14. Boggi U, et al. 2012 Long-term (5 years) efficacy and safety of pancreas transplantation alone in type 1 diabetic patients. Transplantation 93:842-846
15. Harlan DM, et al. 2009 Current advances and travails in islet transplantation. Diabetes 58:2175-2184
16. Pascual M, et al. 2002 Strategies to improve long-term outcomes after renal transplantation. N Engl J Med 346:580-590
17. Cosio FG, et al. 2001 Post-transplant diabetes mellitus: increasing incidence in renal allograft recipients transplanted in recent years. Kidney Int 59:732-737
18. Parekh J, et al. 2012 Diabetes, hypertension and hyperlipidemia: prevalence over time and impact on long-term survival after liver transplantation. Am J Transplant 12:2181-2187
19. Montori VM, et al. 2002 Posttransplantation diabetes: a systematic review of the literature. Diabetes Care 25:583-592
20. Vanrenterghem YF, et al. 2008 Risk factors for cardiovascular events after successful renal transplantation. Transplantation 85:209-216
21. Starzl TE, et al. 1964 Factors in Successful Renal Transplantation. Surgery 56:296-318
References
53
22. Luan FL, et al. 2010 Abnormal glucose metabolism and metabolic syndrome in non-diabetic kidney transplant recipients early after transplantation. Transplantation 89:1034-1039
23. Ekstrand AV, et al. 1992 Insulin resistance and insulin deficiency in the pathogenesis of posttransplantation diabetes in man. Transplantation 53:563-569
24. van Hooff JP, et al. 2004 Evaluating mechanisms of post-transplant diabetes mellitus. Nephrol Dial Transplant 19 Suppl 6:vi8-vi12
25. Davidson J, et al. 2003 New-onset diabetes after transplantation: 2003 International consensus guidelines. Proceedings of an international expert panel meeting. Barcelona, Spain, 19 February 2003. Transplantation 75:SS3-24
26. Sharif A, et al. 2010 Risk factors for new-onset diabetes after kidney transplantation. Nat Rev Nephrol 6:415-423
27. Andrews RC, et al. 1999 Glucocorticoids and insulin resistance: old hormones, new targets. Clin Sci (Lond) 96:513-523
28. Delaunay F, et al. 1997 Pancreatic beta cells are important targets for the diabetogenic effects of glucocorticoids. J Clin Invest 100:2094-2098
29. Rizza RA, et al. 1982 Cortisol-induced insulin resistance in man: impaired suppression of glucose production and stimulation of glucose utilization due to a postreceptor detect of insulin action. J Clin Endocrinol Metab 54:131-138
30. Bjorntorp P, et al. 2000 Obesity and cortisol. Nutrition 16:924-936 31. Valderhaug TG, et al. 2007 Reduced incidence of new-onset posttransplantation
diabetes mellitus during the last decade. Transplantation 84:1125-1130 32. Kutkuhn B, et al. 1997 Development of insulin resistance and elevated blood
pressure during therapy with cyclosporine A. Blood Press 6:13-17 33. Asberg A, et al. 2009 Calcineurin inhibitor effects on glucose metabolism and
endothelial function following renal transplantation. Clin Transplant 23:511-518 34. Menegazzo LA, et al. 1998 Mechanism of the diabetogenic action of cyclosporin
A. Horm Metab Res 30:663-667 35. Drachenberg CB, et al. 1999 Islet cell damage associated with tacrolimus and
cyclosporine: morphological features in pancreas allograft biopsies and clinical correlation. Transplantation 68:396-402
36. Ozbay LA, et al. 2011 Cyclosporin and tacrolimus impair insulin secretion and transcriptional regulation in INS-1E beta-cells. Br J Pharmacol 162:136-146
37. van Hooff JP, et al. 1999 Tacrolimus and glucose metabolism. Transplant Proc 31:49S-50S
38. Ozbay LA, et al. 2012 The impact of calcineurin inhibitors on insulin sensitivity and insulin secretion: a randomized crossover trial in uraemic patients. Diabet Med
39. Redmon JB, et al. 1996 Effects of tacrolimus (FK506) on human insulin gene expression, insulin mRNA levels, and insulin secretion in HIT-T15 cells. J Clin Invest 98:2786-2793
40. Teutonico A, et al. 2005 Glucose metabolism in renal transplant recipients: effect of calcineurin inhibitor withdrawal and conversion to sirolimus. J Am Soc Nephrol 16:3128-3135
41. Niclauss N, et al. 2011 Rapamycin impairs proliferation of transplanted islet beta cells. Transplantation 91:714-722
42. Kesten S, et al. 1997 Lack of left ventricular dysfunction associated with sustained exposure to hyperlipidemia following lung transplantation. Chest 112:931-936

References
54
43. Ong CS, et al. 1994 Hyperlipidemia in renal transplant recipients: natural history and response to treatment. Medicine (Baltimore) 73:215-223
44. Ichimaru N, et al. 2001 Changes in lipid metabolism and effect of simvastatin in renal transplant recipients induced by cyclosporine or tacrolimus. Atherosclerosis 158:417-423
45. Li HY, et al. 2012 Higher tacrolimus blood concentration is related to hyperlipidemia in living donor liver transplantation recipients. Dig Dis Sci 57:204-209
46. Morrisett JD, et al. 2002 Effects of sirolimus on plasma lipids, lipoprotein levels, and fatty acid metabolism in renal transplant patients. J Lipid Res 43:1170-1180
47. Spinelli GA, et al. 2011 Lipid profile changes during the first year after kidney transplantation: risk factors and influence of the immunosuppressive drug regimen. Transplant Proc 43:3730-3737
48. Wronska A, et al. 2012 Structural and biochemical characteristics of various white adipose tissue depots. Acta Physiol (Oxf) 205:194-208
49. Large V, et al. 2004 Metabolism of lipids in human white adipocyte. Diabetes Metab 30:294-309
50. Thompson BR, et al. 2010 Fatty acid flux in adipocytes: the in's and out's of fat cell lipid trafficking. Mol Cell Endocrinol 318:24-33
51. Nye C, et al. 2008 Reassessing triglyceride synthesis in adipose tissue. Trends Endocrinol Metab 19:356-361
52. Goldberg IJ, et al. 2009 Regulation of fatty acid uptake into tissues: lipoprotein lipase- and CD36-mediated pathways. J Lipid Res 50 Suppl:S86-90
53. Coleman RA, et al. 2004 Enzymes of triacylglycerol synthesis and their regulation. Prog Lipid Res 43:134-176
54. Diraison F, et al. 2003 Differences in the regulation of adipose tissue and liver lipogenesis by carbohydrates in humans. J Lipid Res 44:846-853
55. Shi Y, et al. 2004 Lipid metabolic enzymes: emerging drug targets for the treatment of obesity. Nat Rev Drug Discov 3:695-710
56. Shi Y, et al. 2009 Beyond triglyceride synthesis: the dynamic functional roles of MGAT and DGAT enzymes in energy metabolism. Am J Physiol Endocrinol Metab 297:E10-18
57. Kraemer FB, et al. 2002 Hormone-sensitive lipase: control of intracellular tri-(di-)acylglycerol and cholesteryl ester hydrolysis. J Lipid Res 43:1585-1594
58. Tansey JT, et al. 2004 The central role of perilipin a in lipid metabolism and adipocyte lipolysis. IUBMB Life 56:379-385
59. Schweiger M, et al. 2006 Adipose triglyceride lipase and hormone-sensitive lipase are the major enzymes in adipose tissue triacylglycerol catabolism. J Biol Chem 281:40236-40241
60. Degerman E, et al. 1990 Evidence that insulin and isoprenaline activate the cGMP-inhibited low-Km cAMP phosphodiesterase in rat fat cells by phosphorylation. Proc Natl Acad Sci U S A 87:533-537
61. Roden M, et al. 1996 Mechanism of free fatty acid-induced insulin resistance in humans. J Clin Invest 97:2859-2865
62. Kershaw EE, et al. 2004 Adipose tissue as an endocrine organ. J Clin Endocrinol Metab 89:2548-2556

References
55
63. Fujioka S, et al. 1987 Contribution of intra-abdominal fat accumulation to the impairment of glucose and lipid metabolism in human obesity. Metabolism 36:54-59
64. Despres JP, et al. 2006 Abdominal obesity and metabolic syndrome. Nature 444:881-887
65. Kissebah AH, et al. 1994 Regional adiposity and morbidity. Physiol Rev 74:761-811
66. Bjorntorp P 1990 "Portal" adipose tissue as a generator of risk factors for cardiovascular disease and diabetes. Arteriosclerosis 10:493-496
67. Bjorntorp P 1997 Hormonal control of regional fat distribution. Hum Reprod 12 Suppl 1:21-25
68. Cornier MA, et al. 2011 Assessing adiposity: a scientific statement from the american heart association. Circulation 124:1996-2019
69. Lukaski HC, et al. 1986 Validation of tetrapolar bioelectrical impedance method to assess human body composition. J Appl Physiol 60:1327-1332
70. Bastard JP, et al. 2006 Recent advances in the relationship between obesity, inflammation, and insulin resistance. Eur Cytokine Netw 17:4-12
71. Hosogai N, et al. 2007 Adipose tissue hypoxia in obesity and its impact on adipocytokine dysregulation. Diabetes 56:901-911
72. Weisberg SP, et al. 2003 Obesity is associated with macrophage accumulation in adipose tissue. J Clin Invest 112:1796-1808
73. Saltiel AR, et al. 2001 Insulin signalling and the regulation of glucose and lipid metabolism. Nature 414:799-806
74. Vidal-Puig AJ, et al. 1997 Peroxisome proliferator-activated receptor gene expression in human tissues. Effects of obesity, weight loss, and regulation by insulin and glucocorticoids. J Clin Invest 99:2416-2422
75. Le Lay S, et al. 2002 Insulin and sterol-regulatory element-binding protein-1c (SREBP-1C) regulation of gene expression in 3T3-L1 adipocytes. Identification of CCAAT/enhancer-binding protein beta as an SREBP-1C target. J Biol Chem 277:35625-35634
76. Gammeltoft S, et al. 1986 Protein kinase activity of the insulin receptor. Biochem J 235:1-11
77. Thirone AC, et al. 2006 Tissue-specific roles of IRS proteins in insulin signaling and glucose transport. Trends Endocrinol Metab 17:72-78
78. Sarbassov DD, et al. 2005 Phosphorylation and regulation of Akt/PKB by the rictor-mTOR complex. Science 307:1098-1101
79. Sano H, et al. 2003 Insulin-stimulated phosphorylation of a Rab GTPase-activating protein regulates GLUT4 translocation. J Biol Chem 278:14599-14602
80. Yang J, et al. 1993 Comparison of GLUT4 and GLUT1 subcellular trafficking in basal and insulin-stimulated 3T3-L1 cells. J Biol Chem 268:4600-4603
81. Thong FS, et al. 2005 Turning signals on and off: GLUT4 traffic in the insulin-signaling highway. Physiology (Bethesda) 20:271-284
82. Wang M 2005 The role of glucocorticoid action in the pathophysiology of the Metabolic Syndrome. Nutr Metab (Lond) 2:3
83. Frerichs VA, et al. 2004 Determination of the glucocorticoids prednisone, prednisolone, dexamethasone, and cortisol in human serum using liquid

References
56
chromatography coupled to tandem mass spectrometry. J Chromatogr B Analyt Technol Biomed Life Sci 802:329-338
84. Lowenberg M, et al. 2007 Glucocorticoid signaling: a nongenomic mechanism for T-cell immunosuppression. Trends Mol Med 13:158-163
85. Vermeer H, et al. 2003 Glucocorticoid-induced increase in lymphocytic FKBP51 messenger ribonucleic acid expression: a potential marker for glucocorticoid sensitivity, potency, and bioavailability. J Clin Endocrinol Metab 88:277-284
86. Kobashigawa JA, et al. 2006 Immunosuppression for heart transplantation: where are we now? Nat Clin Pract Cardiovasc Med 3:203-212
87. Rebuffe-Scrive M, et al. 1988 Muscle and adipose tissue morphology and metabolism in Cushing's syndrome. J Clin Endocrinol Metab 67:1122-1128
88. Lonn L, et al. 1994 Changes in body composition and adipose tissue distribution after treatment of women with Cushing's syndrome. Metabolism 43:1517-1522
89. Fried SK, et al. 1993 Lipoprotein lipase regulation by insulin and glucocorticoid in subcutaneous and omental adipose tissues of obese women and men. J Clin Invest 92:2191-2198
90. Ottosson M, et al. 1994 The effects of cortisol on the regulation of lipoprotein lipase activity in human adipose tissue. J Clin Endocrinol Metab 79:820-825
91. Lundgren M, et al. 2008 Sex- and depot-specific lipolysis regulation in human adipocytes: interplay between adrenergic stimulation and glucocorticoids. Horm Metab Res 40:854-860
92. Lundgren M, et al. 2004 Glucocorticoids down-regulate glucose uptake capacity and insulin-signaling proteins in omental but not subcutaneous human adipocytes. J Clin Endocrinol Metab 89:2989-2997
93. Buren J, et al. 2002 Dexamethasone impairs insulin signalling and glucose transport by depletion of insulin receptor substrate-1, phosphatidylinositol 3-kinase and protein kinase B in primary cultured rat adipocytes. Eur J Endocrinol 146:419-429
94. Lee MJ, et al. 2011 Pathways regulated by glucocorticoids in omental and subcutaneous human adipose tissues: a microarray study. Am J Physiol Endocrinol Metab 300:E571-580
95. Viguerie N, et al. 2012 Multiple effects of a short-term dexamethasone treatment in human skeletal muscle and adipose tissue. Physiol Genomics 44:141-151
96. Vincenti F, et al. 2002 A long-term comparison of tacrolimus (FK506) and cyclosporine in kidney transplantation: evidence for improved allograft survival at five years. Transplantation 73:775-782
97. Kino T, et al. 1987 FK-506, a novel immunosuppressant isolated from a Streptomyces. II. Immunosuppressive effect of FK-506 in vitro. J Antibiot (Tokyo) 40:1256-1265
98. Kronke M, et al. 1984 Cyclosporin A inhibits T-cell growth factor gene expression at the level of mRNA transcription. Proc Natl Acad Sci U S A 81:5214-5218
99. Liu J, et al. 1991 Calcineurin is a common target of cyclophilin-cyclosporin A and FKBP-FK506 complexes. Cell 66:807-815
100. Fruman DA, et al. 1992 Calcineurin phosphatase activity in T lymphocytes is inhibited by FK 506 and cyclosporin A. Proc Natl Acad Sci U S A 89:3686-3690

References
57
101. Ekberg H, et al. 2007 Reduced exposure to calcineurin inhibitors in renal transplantation. N Engl J Med 357:2562-2575
102. Schiff J, et al. 2007 Therapeutic monitoring of calcineurin inhibitors for the nephrologist. Clin J Am Soc Nephrol 2:374-384
103. Polastri L, et al. 2002 Secretory defects induced by immunosuppressive agents on human pancreatic beta-cells. Acta Diabetol 39:229-233
104. Duijnhoven EM, et al. 2001 Influence of tacrolimus on glucose metabolism before and after renal transplantation: a prospective study. J Am Soc Nephrol 12:583-588
105. Hjelmesaeth J, et al. 2007 The impact of short-term ciclosporin A treatment on insulin secretion and insulin sensitivity in man. Nephrol Dial Transplant 22:1743-1749
106. Ozbay LA, et al. 2012 Calcineurin inhibitors acutely improve insulin sensitivity without affecting insulin secretion in healthy human volunteers. Br J Clin Pharmacol 73:536-545
107. Oterdoom LH, et al. 2007 Determinants of insulin resistance in renal transplant recipients. Transplantation 83:29-35
108. Bakar F, et al. 2009 Low-density lipoprotein oxidizability and the alteration of its fatty acid content in renal transplant recipients treated with cyclosporine/tacrolimus. Transplant Proc 41:1630-1633
109. Tory R, et al. 2009 Tacrolimus-induced elevation in plasma triglyceride concentrations after administration to renal transplant patients is partially due to a decrease in lipoprotein lipase activity and plasma concentrations. Transplantation 88:62-68
110. Derfler K, et al. 1991 Decreased postheparin lipolytic activity in renal transplant recipients with cyclosporin A. Kidney Int 40:720-727
111. Vincenti F, et al. 2007 Results of an international, randomized trial comparing glucose metabolism disorders and outcome with cyclosporine versus tacrolimus. Am J Transplant 7:1506-1514
112. Webster AC, et al. 2005 Tacrolimus versus ciclosporin as primary immunosuppression for kidney transplant recipients: meta-analysis and meta-regression of randomised trial data. BMJ 331:810
113. Knoll GA, et al. 1999 Tacrolimus versus cyclosporin for immunosuppression in renal transplantation: meta-analysis of randomised trials. BMJ 318:1104-1107
114. Shihab FS, et al. 2008 Conversion from cyclosporine to tacrolimus in patients at risk for chronic renal allograft failure: 60-month results of the CRAF Study. Transplantation 85:1261-1269
115. Margreiter R 2002 Efficacy and safety of tacrolimus compared with ciclosporin microemulsion in renal transplantation: a randomised multicentre study. Lancet 359:741-746
116. Sehgal SN, et al. 1975 Rapamycin (AY-22,989), a new antifungal antibiotic. II. Fermentation, isolation and characterization. J Antibiot (Tokyo) 28:727-732
117. Webster AC, et al. 2006 Target of rapamycin inhibitors (sirolimus and everolimus) for primary immunosuppression of kidney transplant recipients: a systematic review and meta-analysis of randomized trials. Transplantation 81:1234-1248

References
58
118. Abraham RT, et al. 1996 Immunopharmacology of rapamycin. Annu Rev Immunol 14:483-510
119. Chung J, et al. 1992 Rapamycin-FKBP specifically blocks growth-dependent activation of and signaling by the 70 kd S6 protein kinases. Cell 69:1227-1236
120. Wyeth L 2011 Rapamune (sirolimus) oral solution and tablets. Philadelphia, PA 121. Howell JJ, et al. 2011 mTOR couples cellular nutrient sensing to organismal
metabolic homeostasis. Trends Endocrinol Metab 22:94-102 122. Wullschleger S, et al. 2006 TOR signaling in growth and metabolism. Cell
124:471-484 123. Inoki K, et al. 2002 TSC2 is phosphorylated and inhibited by Akt and suppresses
mTOR signalling. Nat Cell Biol 4:648-657 124. Smith EM, et al. 2005 The tuberous sclerosis protein TSC2 is not required for the
regulation of the mammalian target of rapamycin by amino acids and certain cellular stresses. J Biol Chem 280:18717-18727
125. Inoki K, et al. 2003 TSC2 mediates cellular energy response to control cell growth and survival. Cell 115:577-590
126. Tee AR, et al. 2002 Tuberous sclerosis complex-1 and -2 gene products function together to inhibit mammalian target of rapamycin (mTOR)-mediated downstream signaling. Proc Natl Acad Sci U S A 99:13571-13576
127. Um SH, et al. 2006 Nutrient overload, insulin resistance, and ribosomal protein S6 kinase 1, S6K1. Cell Metab 3:393-402
128. Tremblay F, et al. 2005 Activation of the mammalian target of rapamycin pathway acutely inhibits insulin signaling to Akt and glucose transport in 3T3-L1 and human adipocytes. Endocrinology 146:1328-1337
129. Mayer C, et al. 2004 mTOR-dependent activation of the transcription factor TIF-IA links rRNA synthesis to nutrient availability. Genes Dev 18:423-434
130. Codogno P, et al. 2005 Autophagy and signaling: their role in cell survival and cell death. Cell Death Differ 12 Suppl 2:1509-1518
131. Guertin DA, et al. 2007 Defining the role of mTOR in cancer. Cancer Cell 12:9-22
132. Sarbassov DD, et al. 2006 Prolonged rapamycin treatment inhibits mTORC2 assembly and Akt/PKB. Mol Cell 22:159-168
133. Carnevalli LS, et al. 2010 S6K1 plays a critical role in early adipocyte differentiation. Dev Cell 18:763-774
134. Le Bacquer O, et al. 2007 Elevated sensitivity to diet-induced obesity and insulin resistance in mice lacking 4E-BP1 and 4E-BP2. J Clin Invest 117:387-396
135. Porstmann T, et al. 2008 SREBP activity is regulated by mTORC1 and contributes to Akt-dependent cell growth. Cell Metab 8:224-236
136. Peterson TR, et al. 2011 mTOR complex 1 regulates lipin 1 localization to control the SREBP pathway. Cell 146:408-420
137. Johnston O, et al. 2008 Sirolimus is associated with new-onset diabetes in kidney transplant recipients. J Am Soc Nephrol 19:1411-1418
138. Sulanc E, et al. 2005 New-onset diabetes after kidney transplantation: an application of 2003 International Guidelines. Transplantation 80:945-952
139. Berg CE, et al. 2002 Rapamycin partially prevents insulin resistance induced by chronic insulin treatment. Biochem Biophys Res Commun 293:1021-1027

References
59
140. Tremblay F, et al. 2001 Amino acid and insulin signaling via the mTOR/p70 S6 kinase pathway. A negative feedback mechanism leading to insulin resistance in skeletal muscle cells. J Biol Chem 276:38052-38060
141. Cho HJ, et al. 2004 Regulation of adipocyte differentiation and insulin action with rapamycin. Biochem Biophys Res Commun 321:942-948
142. Veilleux A, et al. 2010 Chronic inhibition of the mTORC1/S6K1 pathway increases insulin-induced PI3K activity but inhibits Akt2 and glucose transport stimulation in 3T3-L1 adipocytes. Mol Endocrinol 24:766-778
143. Sipula IJ, et al. 2006 Rapamycin-mediated inhibition of mammalian target of rapamycin in skeletal muscle cells reduces glucose utilization and increases fatty acid oxidation. Metabolism 55:1637-1644
144. Houde VP, et al. 2010 Chronic rapamycin treatment causes glucose intolerance and hyperlipidemia by upregulating hepatic gluconeogenesis and impairing lipid deposition in adipose tissue. Diabetes 59:1338-1348
145. Blanchard PG, et al. 2012 Major involvement of mTOR in the PPARgamma-induced stimulation of adipose tissue lipid uptake and fat accretion. J Lipid Res 53:1117-1125
146. Chakrabarti P, et al. 2010 Mammalian target of rapamycin complex 1 suppresses lipolysis, stimulates lipogenesis, and promotes fat storage. Diabetes 59:775-781
147. Soliman GA, et al. 2010 mTORC1 inhibition via rapamycin promotes triacylglycerol lipolysis and release of free fatty acids in 3T3-L1 adipocytes. Lipids 45:1089-1100
148. Um SH, et al. 2004 Absence of S6K1 protects against age- and diet-induced obesity while enhancing insulin sensitivity. Nature 431:200-205
149. Selman C, et al. 2009 Ribosomal protein S6 kinase 1 signaling regulates mammalian life span. Science 326:140-144
150. Polak P, et al. 2008 Adipose-specific knockout of raptor results in lean mice with enhanced mitochondrial respiration. Cell Metab 8:399-410
151. Kumar A, et al. 2010 Fat cell-specific ablation of rictor in mice impairs insulin-regulated fat cell and whole-body glucose and lipid metabolism. Diabetes 59:1397-1406
152. Smith U, et al. 1972 Comparison of two methods for determining human adipose cell size. J Lipid Res 13:822-824
153. Lundgren M, et al. 2007 Fat cell enlargement is an independent marker of insulin resistance and 'hyperleptinaemia'. Diabetologia 50:625-633
154. Yu ZW, et al. 1997 Peroxovanadate and insulin action in adipocytes from NIDDM patients. Evidence against a primary defect in tyrosine phosphorylation. Diabetologia 40:1197-1203
155. Kashiwagi A, et al. 1983 In vitro insulin resistance of human adipocytes isolated from subjects with noninsulin-dependent diabetes mellitus. J Clin Invest 72:1246-1254
156. Lundgren M, et al. 2004 No in vitro effects of fatty acids on glucose uptake, lipolysis or insulin signaling in rat adipocytes. Horm Metab Res 36:203-209
157. Dole VP, et al. 1960 Microdetermination of long-chain fatty acids in plasma and tissues. J Biol Chem 235:2595-2599
158. Yaffe D 1968 Retention of differentiation potentialities during prolonged cultivation of myogenic cells. Proc Natl Acad Sci U S A 61:477-483
References
60
159. Somwar R, et al. 2001 GLUT4 translocation precedes the stimulation of glucose uptake by insulin in muscle cells: potential activation of GLUT4 via p38 mitogen-activated protein kinase. Biochem J 359:639-649
160. Ishikura S, et al. 2010 Documenting GLUT4 exocytosis and endocytosis in muscle cell monolayers. Curr Protoc Cell Biol Chapter 15:Unit 15 15
161. Habtemichael EN, et al. 2011 Kinetic evidence that Glut4 follows different endocytic pathways than the receptors for transferrin and alpha2-macroglobulin. J Biol Chem 286:10115-10125
162. Gillard P, et al. 2009 Functional beta-cell mass and insulin sensitivity is decreased in insulin-independent pancreas-kidney recipients. Transplantation 87:402-407
163. Weyer C, et al. 2000 Enlarged subcutaneous abdominal adipocyte size, but not obesity itself, predicts type II diabetes independent of insulin resistance. Diabetologia 43:1498-1506
164. DeFronzo RA, et al. 1992 Pathogenesis of NIDDM. A balanced overview. Diabetes Care 15:318-368
165. Smith U 2002 Impaired ('diabetic') insulin signaling and action occur in fat cells long before glucose intolerance--is insulin resistance initiated in the adipose tissue? Int J Obes Relat Metab Disord 26:897-904
166. Abel ED, et al. 2001 Adipose-selective targeting of the GLUT4 gene impairs insulin action in muscle and liver. Nature 409:729-733
167. Carvalho E, et al. 2001 Insulin resistance with low cellular IRS-1 expression is also associated with low GLUT4 expression and impaired insulin-stimulated glucose transport. FASEB J 15:1101-1103
168. Tremblay F, et al. 2005 Overactivation of S6 kinase 1 as a cause of human insulin resistance during increased amino acid availability. Diabetes 54:2674-2684
169. Ost A, et al. 2010 Attenuated mTOR signaling and enhanced autophagy in adipocytes from obese patients with type 2 diabetes. Mol Med 16:235-246
170. Weigert C, et al. 2008 Interplay and effects of temporal changes in the phosphorylation state of serine-302, -307, and -318 of insulin receptor substrate-1 on insulin action in skeletal muscle cells. Mol Endocrinol 22:2729-2740
171. Di Paolo S, et al. 2006 Chronic inhibition of mammalian target of rapamycin signaling downregulates insulin receptor substrates 1 and 2 and AKT activation: A crossroad between cancer and diabetes? J Am Soc Nephrol 17:2236-2244
172. Previs SF, et al. 2000 Contrasting effects of IRS-1 versus IRS-2 gene disruption on carbohydrate and lipid metabolism in vivo. J Biol Chem 275:38990-38994
173. Bandyopadhyay G, et al. 1999 Dependence of insulin-stimulated glucose transporter 4 translocation on 3-phosphoinositide-dependent protein kinase-1 and its target threonine-410 in the activation loop of protein kinase C-zeta. Mol Endocrinol 13:1766-1772
174. Kotani K, et al. 1998 Requirement of atypical protein kinase clambda for insulin stimulation of glucose uptake but not for Akt activation in 3T3-L1 adipocytes. Mol Cell Biol 18:6971-6982
175. Foley K, et al. 2011 Endocytosis, recycling, and regulated exocytosis of glucose transporter 4. Biochemistry 50:3048-3061
176. Shigematsu S, et al. 2003 The adipocyte plasma membrane caveolin functional/structural organization is necessary for the efficient endocytosis of GLUT4. J Biol Chem 278:10683-10690

References
61
177. Li D, et al. 2001 Hyperosmolarity reduces GLUT4 endocytosis and increases its exocytosis from a VAMP2-independent pool in l6 muscle cells. J Biol Chem 276:22883-22891
178. Jewell JL, et al. 2011 Munc18c phosphorylation by the insulin receptor links cell signaling directly to SNARE exocytosis. J Cell Biol 193:185-199
179. Chang L, et al. 2007 TC10alpha is required for insulin-stimulated glucose uptake in adipocytes. Endocrinology 148:27-33
180. Anthonsen MW, et al. 1998 Identification of novel phosphorylation sites in hormone-sensitive lipase that are phosphorylated in response to isoproterenol and govern activation properties in vitro. J Biol Chem 273:215-221
181. Lampidonis AD, et al. 2011 The resurgence of Hormone-Sensitive Lipase (HSL) in mammalian lipolysis. Gene 477:1-11
182. Berggreen C, et al. 2009 Protein kinase B activity is required for the effects of insulin on lipid metabolism in adipocytes. Am J Physiol Endocrinol Metab 296:E635-646
183. Tory R, et al. 2008 Cyclosporine A and Rapamycin induce in vitro cholesteryl ester transfer protein activity, and suppress lipoprotein lipase activity in human plasma. Int J Pharm 358:219-223
184. Lee CH, et al. 2003 Minireview: lipid metabolism, metabolic diseases, and peroxisome proliferator-activated receptors. Endocrinology 144:2201-2207
185. Jin S, et al. 2004 Effect of tacrolimus on the expression of macrophage scavenger and nuclear hormone receptors in THP-1-derived human macrophages. Transplantation 77:1281-1287
186. Bakan I, et al. 2012 Connecting mTORC1 signaling to SREBP-1 activation. Curr Opin Lipidol 23:226-234
187. Fernandez-Real JM, et al. 2003 Insulin resistance and chronic cardiovascular inflammatory syndrome. Endocr Rev 24:278-301
188. Bastard JP, et al. 2002 Adipose tissue IL-6 content correlates with resistance to insulin activation of glucose uptake both in vivo and in vitro. J Clin Endocrinol Metab 87:2084-2089
189. van Hall G, et al. 2003 Interleukin-6 stimulates lipolysis and fat oxidation in humans. J Clin Endocrinol Metab 88:3005-3010
190. Nielsen S, et al. 2012 Determinants of VLDL-triglycerides production. Curr Opin Lipidol 23:321-326
191. Kim JK, et al. 2004 Inactivation of fatty acid transport protein 1 prevents fat-induced insulin resistance in skeletal muscle. J Clin Invest 113:756-763
192. Petersen KF, et al. 2006 Etiology of insulin resistance. Am J Med 119:S10-16 193. Nosadini R, et al. 1983 Insulin resistance in Cushing's syndrome. J Clin
Endocrinol Metab 57:529-536 194. de Heredia FP, et al. 2012 Obesity, inflammation and the immune system. Proc
Nutr Soc 71:332-338 195. Bluher M, et al. 2006 Dysregulation of the peripheral and adipose tissue
endocannabinoid system in human abdominal obesity. Diabetes 55:3053-3060 196. Ge Q, et al. 2012 Endocannabinoids regulate adipokine production and the
immune balance of omental adipose tissue in human obesity. Int J Obes (Lond)

References
62
197. Kay JE 1996 Structure-function relationships in the FK506-binding protein (FKBP) family of peptidylprolyl cis-trans isomerases. Biochem J 314 ( Pt 2):361-385
198. Baughman G, et al. 1995 FKBP51, a novel T-cell-specific immunophilin capable of calcineurin inhibition. Mol Cell Biol 15:4395-4402
199. Dumont FJ, et al. 1990 Distinct mechanisms of suppression of murine T cell activation by the related macrolides FK-506 and rapamycin. J Immunol 144:251-258
200. Wochnik GM, et al. 2005 FK506-binding proteins 51 and 52 differentially regulate dynein interaction and nuclear translocation of the glucocorticoid receptor in mammalian cells. J Biol Chem 280:4609-4616
201. Woodruff PG, et al. 2007 Genome-wide profiling identifies epithelial cell genes associated with asthma and with treatment response to corticosteroids. Proc Natl Acad Sci U S A 104:15858-15863
202. Pei H, et al. 2009 FKBP51 affects cancer cell response to chemotherapy by negatively regulating Akt. Cancer Cell 16:259-266
203. Filipovsky J, et al. 1996 The relationship of blood pressure with glucose, insulin, heart rate, free fatty acids and plasma cortisol levels according to degree of obesity in middle-aged men. J Hypertens 14:229-235
204. Phillips DI, et al. 1998 Elevated plasma cortisol concentrations: a link between low birth weight and the insulin resistance syndrome? J Clin Endocrinol Metab 83:757-760
205. Baudrand R, et al. 2011 Increased urinary glucocorticoid metabolites are associated with metabolic syndrome, hypoadiponectinemia, insulin resistance and beta cell dysfunction. Steroids 76:1575-1581
206. Walker BR 2007 Glucocorticoids and cardiovascular disease. Eur J Endocrinol 157:545-559
207. Fried SK, et al. 1998 Omental and subcutaneous adipose tissues of obese subjects release interleukin-6: depot difference and regulation by glucocorticoid. J Clin Endocrinol Metab 83:847-850
208. Koskivirta I, et al. 2006 Tissue inhibitor of metalloproteinases 4 (TIMP4) is involved in inflammatory processes of human cardiovascular pathology. Histochem Cell Biol 126:335-342