effects of increased wind loads on tall...
TRANSCRIPT

CIVIL ENGINEERING PRACTICE FALL/WINTER 2003 5
MASOUD SANAYEI, LEWIS EDGERS, JOSEPH ALONGE & PAUL KIRSHEN
Arecent report accepted by most nationsof the world, and supported by mostscientists in the United States, stated
that “emissions of greenhouse gases andaerosols due to human activities continue toalter the atmosphere in ways that are expectedto affect the climate.”1 In Boston, Massachu-setts, the average annual temperature couldincrease by as much as 6 to 10ºF by 2090. Thelower limit increase in annual average tem-perature would make Boston’s climate similarto that of present-day Richmond, Virginia. Thehigher temperature increase would makeBoston’s average temperature more like thatof Atlanta, Georgia.2 Other expected changes
in metropolitan Boston’s climate due to thiswarming are increased precipitation and acontinued rise in sea level. The likelihood andspeed of extreme winds may also increaseand, thus, wind loadings on tall structuresmay also be increased.
To analyze the possible effects of increasedwind loads due to climate change on tallbuildings in Boston, a finite-element buildingmodel was used. This model represented anidealized representation of a fifty-story tall,slender structure on a shallow continuousconcrete mat foundation. The frame wasassumed to be a moment resisting steel framewith concentric bracing at the core for lateralresistance to wind forces. The assumed sub-surface conditions, typical of the original colo-nial Boston peninsula, consisted of dense gla-cial till capable of supporting the large loadsof a tall structure.
IntroductionMetropolitan Boston has experienced a num-ber of periods of active construction andexpansion over the past three hundred years,each producing some unique elements ofurban infrastructure. Johnson notes that someof the buildings that have survived from the1700s were built on solid ground and were
Study
Effects of IncreasedWind Loads on TallBuildings
Long-term global warmingand climate change mayincrease wind loads, whichmay have negative effects onthe performance of existingtall structures.
probably supported on granite footings.3
Other buildings, such as Faneuil Hall andQuincy Market, had to be supported on tim-ber pilings driven through fill and underlyingmud. The Back Bay was filled during the sec-ond half of the nineteenth century and experi-enced the construction of many three- to six-story townhouses as well as some large publicbuildings such as Trinity Church, Horticultur-al Hall and the Copley Square Library. Most ofthese structures were founded on untreatedtimber piles that were driven through shallowfill and organic layers to underlying sands andclays. The twentieth century brought littlemajor new urban construction until the 1960s.The construction of the Prudential Center atabout this time began a period of active con-struction that has continued to this day.Currently, the tallest building in Boston is the788-foot-high, sixty-story John HancockBuilding, which was built in 1969.3
A structure of the size and foundation typeselected for this study, a fifty-story office
tower founded on a concrete mat, must besupported on very strong soil or rock. Theglacial till in Boston is capable of supportingloads from such large structures, with allow-able bearing pressures as large as 10 tons persquare foot (tsf).4 Several different types offraming systems are associated with tallstructures. Braced frames rely on the axialstiffness of the framing members to resist lat-eral loads. The geometry of these systems isoften governed by the specific needs foraccess and openings in a structure. Momentresisting frames consist of rigidly connectedbeams and columns. The resistance to lateralloads in these framing systems comes fromthe flexural stiffness of the framing members.Although moment resisting frames are bene-ficial for architectural purposes, they becomeinefficient for structures exceeding twenty tothirty stories in height due to the quantity ofmaterial necessary to obtain adequate stiff-ness.5 In order to achieve adequate lateralresistance to loads brought on by wind or
6 CIVIL ENGINEERING PRACTICE FALL/WINTER 2003
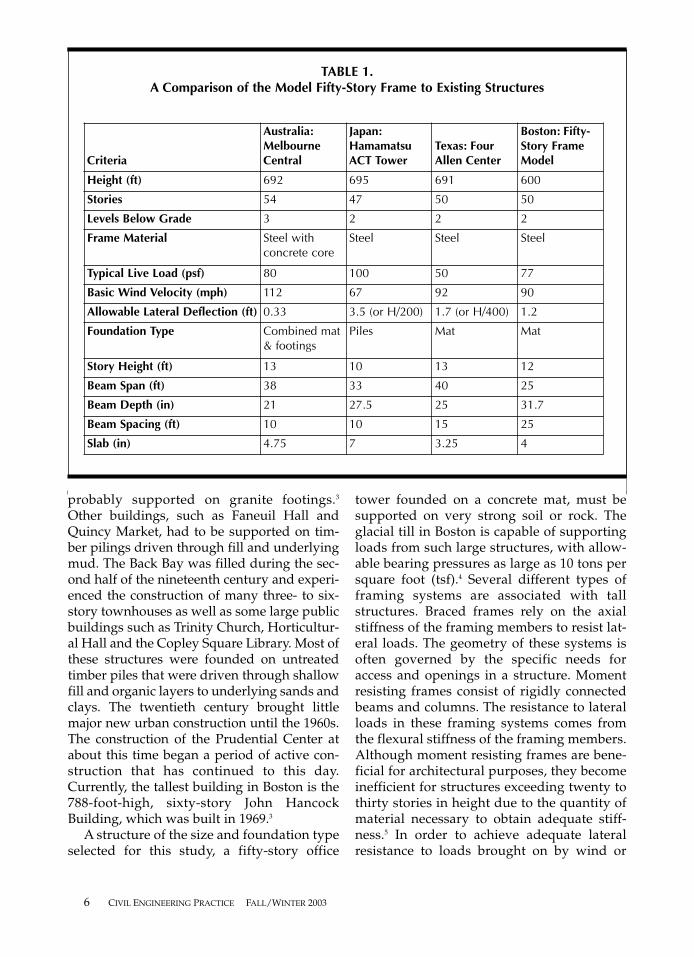
TABLE 1.A Comparison of the Model Fifty-Story Frame to Existing Structures
Criteria
Australia:MelbourneCentral
Japan:HamamatsuACT Tower
Texas: FourAllen Center
Boston: Fifty-Story FrameModel
Height (ft) 692 695 691 600
Stories 54 47 50 50
Levels Below Grade 3 2 2 2
Frame Material Steel with concrete core
Steel Steel Steel
Typical Live Load (psf) 80 100 50 77
Basic Wind Velocity (mph) 112 67 92 90
Allowable Lateral Deflection (ft) 0.33 3.5 (or H/200) 1.7 (or H/400) 1.2
Foundation Type Combined mat& footings
Piles Mat Mat
Story Height (ft) 13 10 13 12
Beam Span (ft) 38 33 40 25
Beam Depth (in) 21 27.5 25 31.7
Beam Spacing (ft) 10 10 15 25
Slab (in) 4.75 7 3.25 4
seismic activity, braced moment resistingframes are commonly used in forty- to fifty-story buildings.5 For this study, a momentresisting steel frame with concentric bracingat the core was used. This combined systemprovided sufficient lateral stiffness for thefifty-story building model. Table 1 summa-rizes the features of this structural model andshows that it is characteristic of some exist-ing structures around the world as describedby Kowalczyk.5
Boston lies in a region susceptible to hurri-canes, which are tropical storms withSaffir/Simpson Hurricane Scale Category 1winds ranging from 74 to 95 miles per hour(mph) and Category 5 winds greater than 155mph. The highest sustained 1-minute windspeed ever recorded from a hurricane in NewEngland was 121 mph; the highest gust was186 mph. Both of these were measured duringthe 1938 Great New England Hurricane at theBlue Hill Observatory in Milton, Massachu-setts, located on a 627-foot-high mountainabout 10 miles south of Boston.6 Because ofthe inability to accurately model hurricanes inclimate change models (Generalized Circula-tion Models, or GCMs), it is not possible tostate with certainty how hurricane formationand associated wind speeds will change in thefuture. One of the most recent internationalpanels of climate experts stated that there isnot a consensus on changes in the intensitiesof tropical storms under climate change.7 Anearlier summary in 2000 stated that there is thepossibly of increased intensities but notenough knowledge to state if the increases areunlikely, likely or very likely.8 One experimen-tal model study working under a scenario of a1 percent annual increase in CO2 reported thatby approximately 2095 maximum hurricanesurface wind speed in the northwestern tropi-cal Atlantic region could increase by 3.3 to 5.0percent.9
For this study, sensitivity analysis was usedon wind velocities to determine if there shouldbe concern for the integrity of tall buildingsdue to changing wind loads in the future.Because there is great uncertainty on howwind loads on tall buildings in Boston maychange in the future, a wide range of possiblewind speed increases of 10, 20, and 30 percent
in design wind speeds were used in the sensi-tivity analysis.
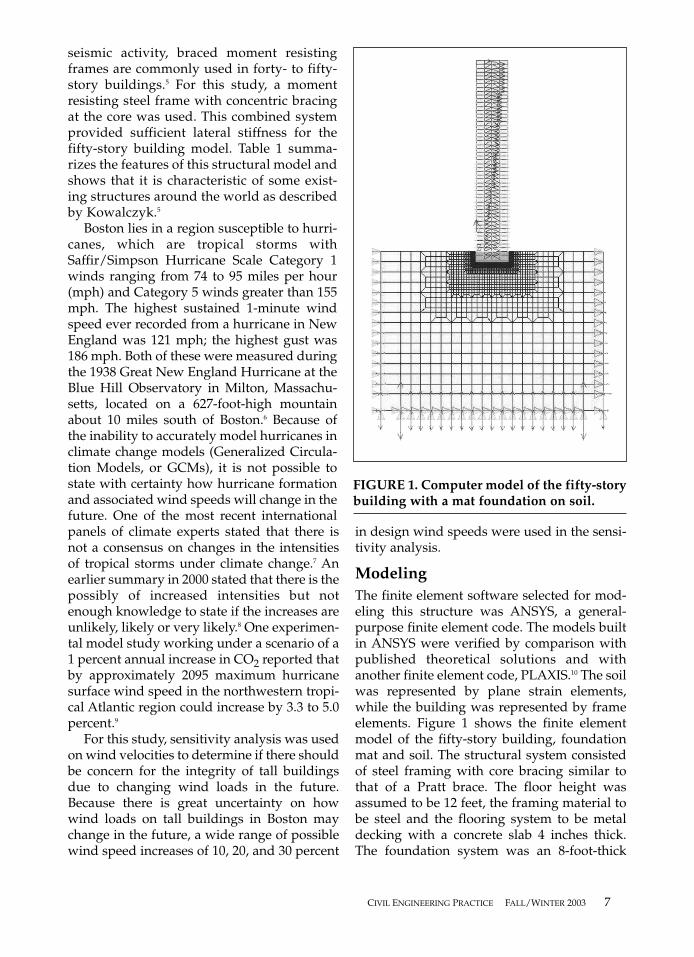
ModelingThe finite element software selected for mod-eling this structure was ANSYS, a general-purpose finite element code. The models builtin ANSYS were verified by comparison withpublished theoretical solutions and withanother finite element code, PLAXIS.10 The soilwas represented by plane strain elements,while the building was represented by frameelements. Figure 1 shows the finite elementmodel of the fifty-story building, foundationmat and soil. The structural system consistedof steel framing with core bracing similar tothat of a Pratt brace. The floor height wasassumed to be 12 feet, the framing material tobe steel and the flooring system to be metaldecking with a concrete slab 4 inches thick.The foundation system was an 8-foot-thick
CIVIL ENGINEERING PRACTICE FALL/WINTER 2003 7
FIGURE 1. Computer model of the fifty-storybuilding with a mat foundation on soil.

reinforced concrete mat. This combined soil,foundation and structural model was createdto study the soil-structure interaction for vari-ous wind speeds. It allowed for more realisticresponse calculations since it took intoaccount the flexibility of the foundations andthe supporting soil. The soil-structure interac-tion model also influenced the structural dis-placements and internal forces.
Structural response to wind loads is ordi-narily performed in the direction of the princi-pal axes of buildings with rectangular foot-prints. The building was transformed into twodimensions for gravity and wind analysis, andthe spacing of one bay was assumed to be 25feet for the purpose of this transformation.Structural properties and loadings wereadjusted to represent a unit two-dimensionalslice of the three-dimensional structure. Theunit slice of the fifty-story building model didnot require any scaling for continuous compo-nents (e.g., mat foundation and soil) and dis-tributed loadings in the third direction.However, properties of discrete components(e.g., beams and columns) and concentrated
loadings required scaling by the inverse of thespacing used in the third direction. The stiff-ness of beams and columns was based on elas-tic modulus (E) and area (A) for axial loadingand elastic modulus and moment of inertia (I)for bending. The stiffness of the building’sbeams and columns, located at the 25-foot bayspacing, were scaled by reducing by a factor of1/25 the one common stiffness parameter, theelastic modulus. Doing so automaticallyreduced the bending stiffness (EI) and axialstiffness (EA) without adjusting the momentof inertia or cross-sectional area of each mem-ber. Also, the material density for the discretemembers was scaled by the same 1/25 factorso that full self-weight was applied consistentwith the scaling performed over each 25-footbay. Table 2 summarizes the assumptionsmade for the material properties.
Loading conditions were based on the 1997Massachusetts Building Code.4 The loads usedin this analysis included dead, live and wind.Seismic loads were not considered in order tosimplify the analysis and to focus on theeffects of increased wind loads. Dead load
8 CIVIL ENGINEERING PRACTICE FALL/WINTER 2003
TABLE 2.Material Properties for the ANSYS Model
Material Property Full Values (U.S. Units) Scaled Values (U.S. Units)
Concrete Beamsin Basement
� 150 pcf 6 pcf� 0.15 0.15� 580,000,000 psf 23,200,000 psf
Steel Beams
& Columns
� 490 pcf 19.6 pcf� 0.30 0.30� 4,176,000,000 psf 167,040,000 psf
Concrete Beamsin Basement
� 150 pcf 6 pcf� 0.15 0.15� 580,000,000 psf 23,200,000 psf
ConcreteMat Foundation
� 150 pcf 150 pcf� 0.15 0.15� 580,000,000 psf 580,000,000 psf
Soil � 130 pcf 130 pcf� 0.25 0.25� 10,000,000 psf 10,000,000 psf

included the weight of the framing, flooring,ceiling and mechanical, and partition load(assumed to be office space). The live load wastaken directly from the MassachusettsBuilding Code (Table 1606.1) and wasassumed to be representative of the typicalloads found in offices, office lobbies and corri-dors. The dead and live loads applied to thestructure, as uniformly distributed loads, aresummarized in Table 3. These loads were notscaled for the two-dimensional transforma-tion because they were continuous.
For wind loads, the Massachusetts BuildingCode separates the state geographically intothree zones of exposure with the Boston metro-politan area falling into Zone 3. The code fur-ther separates these zones into three exposurecategories. They include Exposure A (for thecenters of large cities), Exposure B (for townsand cities) and Exposure C (for open, level ter-rain). These wind load zones are based on a“fastest-mile” wind velocity at 30 feet above theground surface as described in Section 1611.3 inthe Massachusetts Building Code. The “fastest-mile” wind velocity is based on statistical datafor each region of the United States.
The reference wind loads, unaffected byglobal climate change, were calculated from theMassachusetts Building Code (Table 1611.4)assuming Zone 3 for the Boston metropolitanarea, and Exposure B for towns and cities asmay be typical for design of a structure of thistype. The wind loads were calculated by multi-plying the Massachusetts code wind pressuresby the area exposed to wind (a typical floorheight of 12 feet by one bay [or 25 feet]). The
resulting point loads were scaled by 1/25 totransform for the two-dimensional analysisand applied to the corresponding floors.
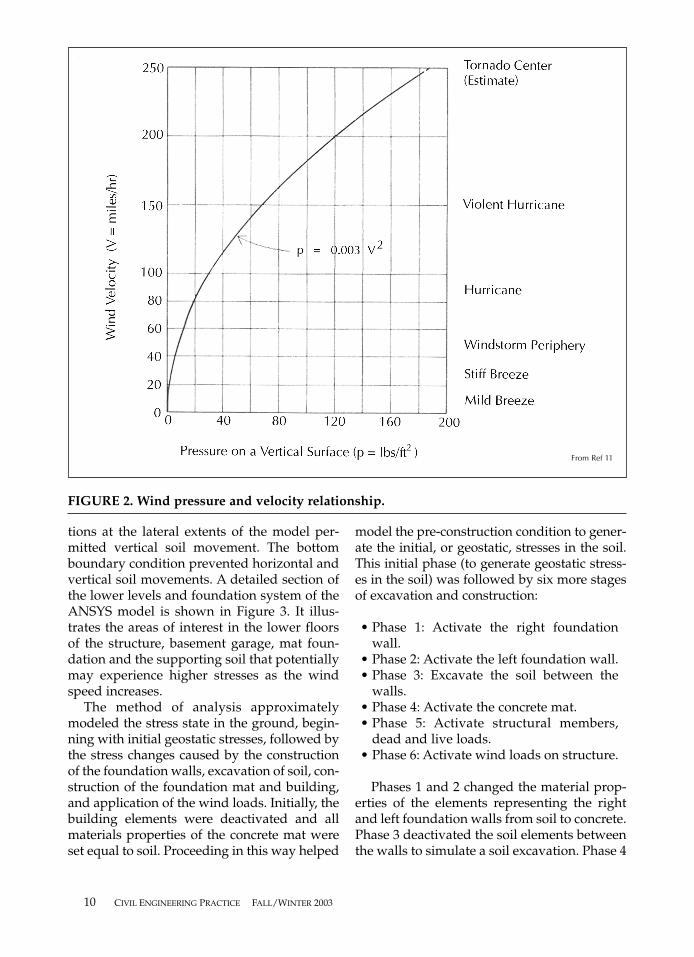
Three climate change scenarios were ana-lyzed by increasing the wind velocity. CurrentMassachusetts building code defines values ofwind pressure based on a reference windvelocity (V30) of 90 mph. This parametricstudy considered the effects of increased windpressures based on increased wind speeds of10, 20 and 30 percent. While there is someuncertainty about the magnitude of anychanges in wind speeds due to long-term cli-mate change, this range of wind velocities waschosen to determine if there should be concernfor the integrity of tall buildings due to chang-ing wind loads in the future. Since theMassachusetts code does not offer a relation-ship between wind velocity (V) and pressure(p), the general design equation was used:11
p = CV2 1
In Equation 1, C is an empirical coefficient.Figure 2 on the next page graphs this equa-tion. Table 4 (on page 11) summarizes thewind loads calculated by the 1997Massachusetts Building Code and theincreased corresponding values usingEquation 1. One twenty-fifth of these valueswere applied to the unit slice model of thefifty-story building.
Method of AnalysisThe complete structure, foundation and soilmodel is shown in Figure 1. Boundary condi-
CIVIL ENGINEERING PRACTICE FALL/WINTER 2003 9
TABLE 3.Summary of Dead & Live Loads
Dead Loads (psf) Live Loads (psf)
Floor 50 Offices 50
Ceiling/Mechanical 10 Lobbies 100
Partition 20 Corridors 80
Steel 16 Average 77
Total Applied 96 Total Applied 77
Total Dead & Live Load Applied = 96 + 77 = 173 psf
tions at the lateral extents of the model per-mitted vertical soil movement. The bottomboundary condition prevented horizontal andvertical soil movements. A detailed section ofthe lower levels and foundation system of theANSYS model is shown in Figure 3. It illus-trates the areas of interest in the lower floorsof the structure, basement garage, mat foun-dation and the supporting soil that potentiallymay experience higher stresses as the windspeed increases.
The method of analysis approximatelymodeled the stress state in the ground, begin-ning with initial geostatic stresses, followed bythe stress changes caused by the constructionof the foundation walls, excavation of soil, con-struction of the foundation mat and building,and application of the wind loads. Initially, thebuilding elements were deactivated and allmaterials properties of the concrete mat wereset equal to soil. Proceeding in this way helped
model the pre-construction condition to gener-ate the initial, or geostatic, stresses in the soil.This initial phase (to generate geostatic stress-es in the soil) was followed by six more stagesof excavation and construction:
• Phase 1: Activate the right foundationwall.
• Phase 2: Activate the left foundation wall.• Phase 3: Excavate the soil between the
walls.• Phase 4: Activate the concrete mat.• Phase 5: Activate structural members,
dead and live loads.• Phase 6: Activate wind loads on structure.
Phases 1 and 2 changed the material prop-erties of the elements representing the rightand left foundation walls from soil to concrete.Phase 3 deactivated the soil elements betweenthe walls to simulate a soil excavation. Phase 4
10 CIVIL ENGINEERING PRACTICE FALL/WINTER 2003
FIGURE 2. Wind pressure and velocity relationship.
From Ref 11

CIVIL ENGINEERING PRACTICE FALL/WINTER 2003 11
TABLE 4.Applied Wind Loads for Massachusetts Building Code
Base Values & Increased Wind Speeds
Wind SpeedScenarios
Code WindSpeeds
Increased Wind Speeds
10% 20% 30%
Floors/Units (lb) (kN) (lb) (kN) (lb) (kN) (lb) (kN)
1-8 252 1.12 305 1.36 363 1.61 426 1.89
9-12 312 1.39 378 1.68 449 2.00 527 2.34
13-16 360 1.60 436 1.94 518 2.30 608 2.71
17-21 408 1.81 494 2.20 588 2.62 690 3.07
22-26 444 1.98 537 2.39 639 2.84 750 3.34
27-34 492 2.19 595 2.65 708 3.15 831 3.70
35-42 552 2.46 668 2.97 795 3.54 932 4.15
43-49 612 2.72 741 3.30 881 3.92 1,034 4.60
50-Roof Gets Half 306 1.36 370 1.65 440 1.96 517 2.30
FIGURE 3. Detail section of the ANSYS foundation model and lower floors of the structure.

reactivated the soil elements in the vicinity ofthe building’s mat foundation and changedtheir material properties to concrete. Phases 1through 4 neglected excavation support issuesand used a linear elastic soil model in order tosimplify the analyses. The foundation wallsand mat were “wished” into place. Phase 5activated the building elements and appliedthe dead and live loads. The final phase(Phase 6) applied the wind loads to the struc-ture. Note that the effects of increased soilstresses and deformations due to climateinduced wind load changes must be furtherevaluated by additional studies (which arebeyond the scope of this research) that incor-porate inelastic soil models.
ResultsVertical stress distributions 1 foot below themat foundation are shown in Figure 4. The x-axis shows the horizontal distance under themat as measured from the windward edge ofthe building. The stress concentrations at the
25-, 50- and 75-foot markers coincided withthe building’s column locations. For all windloading cases, the soil contact stresses weregreater on the leeward (toe) side of the build-ing than the windward (heel) side of the build-ing. The increased wind loads increased thedifference in vertical soil pressures from thewindward to leeward side of the building. Inthe central region of the building, the soilstresses changed by less than 5 percent due tothe 30 percent wind load increase over thefrom the Massachusetts Code reference val-ues. In the exterior bays, the correspondingsoil stresses changed by about 20 percent (or2000 psf). The stress increases on the leewardside of the building were not large enough tooverload the very strong foundation soils,which had allowable bearing capacities aslarge as 8 to 10 tsf by the MassachusettsBuilding Code (Table 1201). The decreasedstresses on the windward side of the buildingwere still positive (compressive) so that therewas no dangerous uplift condition.
12 CIVIL ENGINEERING PRACTICE FALL/WINTER 2003
FIGURE 4. The effect of increased wind loads on vertical contact stresses.

Figure 5 shows the foundation displace-ments due to two phases prior to the additionof the wind loads. The displacements were allreferenced to the initial geostatic stress condi-tion due to the self-weight of the soil. Theaddition of the building weight, dead loadand live load caused a uniform 1-inch verticaldisplacement (settlement). Finally, the code,10, 20 and 30 percent wind loads changed thesettlement distribution. The code wind loadschanged the settlements by about 15 percent,with the settlements decreasing on the wind-ward side to a minimum of about 0.9 inchesand increasing on the leeward side to a maxi-mum of about 1.2 inches. The 30 percentincrease of the code wind values furtherchanged the foundation settlements so thatthey varied from a minimum of 0.8 inches(windward) to a maximum of about 1.3 inches(leeward). This increased tilting of the founda-tion mat provided a secondary contribution tothe building’s structural response, especiallybuilding sway.
Figure 6 compares the computed lateraldeflections (sway) caused by the differentwind load cases. The 30 percent increasedwinds produced a large sway deflection with
a maximum value of 2.3 feet, which is almostdouble the sway calculated using the windpressures given by Massachusetts Code thatresulted in a maximum sway of 1.2 feet. Theselarge wind-induced sways potentially couldcause human discomfort and costly architec-tural damage. They could also cause crackingand spalling of fire protection materials fromthe surface of steel structural members lead-ing to a reduction in protection against fire.
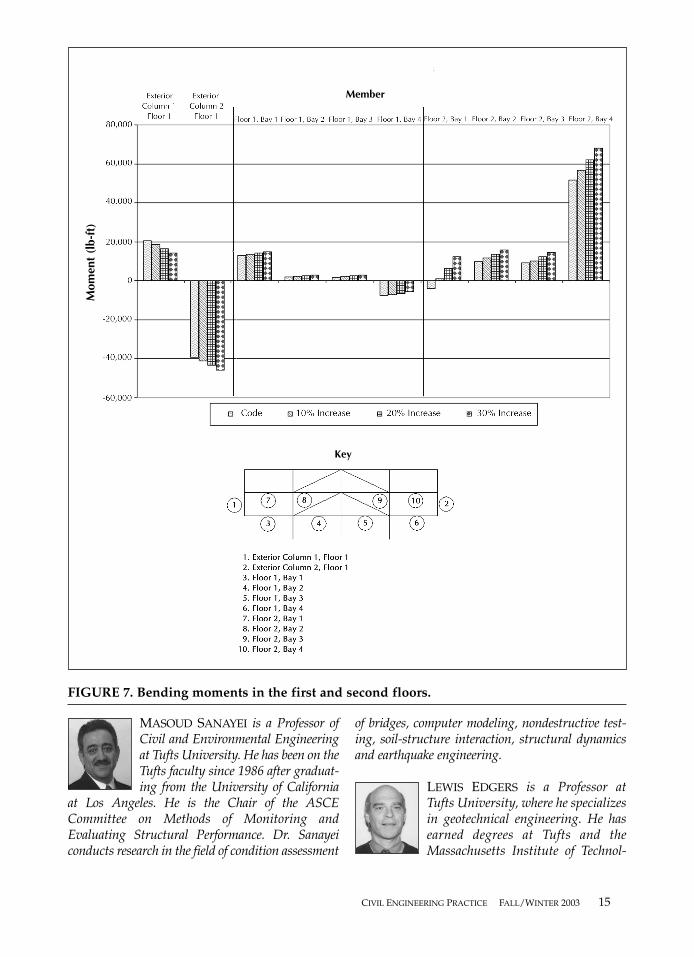
Figure 7 shows the bending moments inbeams and columns of the first and secondfloors computed for each of the wind loadcases. (The key inside Figure 7 shows themembers of the frame selected for the presen-tation and discussion of building structuraleffects.) The moments in the columnsincreased by a maximum of 10 percent on theleeward side and decreased by a similaramount on the windward side as the windloads increased. These changes were withinthe structural capacity of the columns. Thechanges in the beams’ bending moments onthe first floor were small and within the struc-tural capacity of the beams. However, thegreatest changes occurred in the second floorbeams in Bay 4, where the bending moments
CIVIL ENGINEERING PRACTICE FALL/WINTER 2003 13
FIGURE 5. The effect of increased wind loads on vertical displacements.

increased by about 30 percent as the windloads increased, which represents a largereduction in the reserve capacity of the lee-ward beam elements and is cause for concern.
ConclusionsThis study investigated the effects of increasedwind loads due to climate change on a fifty-story building typical of large structures in theBoston metropolitan area. The effects of a 30percent increase in design wind velocities overpresent Massachusetts Building Code require-ments were evaluated. The increases of soilbearing stresses on the leeward side of thebuilding were not large enough to overloadthe very strong foundation soils. Thedecreased soil bearing stresses on the wind-ward side of the building were still compres-sive so that there was no dangerous uplift con-dition. This increased tilting of the foundationmat due to the wind load increases provided asecondary contribution to the building struc-tural response, especially building sway.
The effects of a 30 percent increase in designwind velocities on building columns weresmall but bending moments increased signifi-cantly in the lower floors of the building, result-
ing in a large reduction in the reserve capacityof the leeward beam elements, which is causefor concern. The greatest effect of the increasedwind load was an almost doubling of lateraldeflections (sway) of the building. These largewind-induced sways potentially could causehuman discomfort and costly architecturaldamage. They could also cause cracking andspalling of fire protection materials from thesurface of steel structural members leading to areduction in protection against fire. The struc-ture might also experience increased crackingof non-structural architectural finishes, leadingto increased maintenance costs.
These analyses in no way relate to anexisting structure. Although a 30 percentwind speed increase significantly impactsthe serviceability of the model building, thepossible effects of climate change on windspeed may not produce changes that wouldbe of this magnitude. In fact, some researchindicates that there may be only a 3 to 5 per-cent wind speed increase in 2095.9 On theother hand, this research presents initial con-clusions that suggest these types of analyseswill become important with changing cli-mate conditions.
14 CIVIL ENGINEERING PRACTICE FALL/WINTER 2003
FIGURE 6. Lateral deflection of building center line for increased wind loads.
MASOUD SANAYEI is a Professor ofCivil and Environmental Engineeringat Tufts University. He has been on theTufts faculty since 1986 after graduat-ing from the University of California
at Los Angeles. He is the Chair of the ASCECommittee on Methods of Monitoring andEvaluating Structural Performance. Dr. Sanayeiconducts research in the field of condition assessment
of bridges, computer modeling, nondestructive test-ing, soil-structure interaction, structural dynamicsand earthquake engineering.
LEWIS EDGERS is a Professor atTufts University, where he specializesin geotechnical engineering. He hasearned degrees at Tufts and theMassachusetts Institute of Technol-
CIVIL ENGINEERING PRACTICE FALL/WINTER 2003 15
FIGURE 7. Bending moments in the first and second floors.
Key
Mom
ent
(lb-
ft)
Member
ogy. He is a fellow of the American Society of CivilEngineers, past president of the Boston Society ofCivil Engineers and is currently a director of theFoundation for Professional Practice. Dr. Edgers isa registered engineer in the state of Massachusetts.
JOSEPH ALONGE is currently aGeotechnical Engineer at Hardesty &Hanover, LLP. His responsibilitiesinclude the design and analysis ofdeep foundations for bridges and
earth-retaining structures. He has worked in thefield of Civil Engineering with involvement in sitedevelopment projects. He holds a M.S.C.E fromTufts University and a B.C.E from the GeorgiaInstitute of Technology.
PAUL KIRSHEN is Research Prof-essor in the Civil and EnvironmentalEngineering Department and theInternational Environment andResource Policy Program of the
Fletcher School of Law and Diplomacy, TuftsUniversity. He also directs the Tufts Water,Sustainability, Health, and Ecological Diversity(WaterSHED) Center. He conducts research indeveloped and developing countries on climatechange impacts and adaptation, integrated waterresources management, water resources operations,decision support systems and hydrology. He teach-es integrated water resources management. He is agraduate of Brown University and the Massachu-setts Institute of Technology.
REFERENCES
1. Intergovernmental Panel on Climate Change,Summary for Policy Makers, Climate Change 2001: TheScientific Basis, Working Group I, Third AssessmentReport, Cambridge University Press, 2001.
2. New England Regional Assessment Group,Preparing for a Changing Climate, New EnglandRegional Overview, U.S. Global Change ResearchProgram, University of New Hampshire, August2001.
3. Johnson, E.G., “Major Engineered Structures inBoston,” Civil Engineering Practice: Journal of theBoston Society of Civil Engineers, Volume 4, No. 1,Spring/Summer 1989.
4. Commonwealth of Massachusetts Building StateCode, William Francis Galvin, 1997.
5. Kowalczyk, R.M., Structural Systems for TallBuildings, 2nd ed., New York, McGraw Hill, Inc.,1995.
6. Vallee, D., Southern New England StormClimatology, U.S. National Weather Service ForecastOffice, Taunton, Mass., 1997.
7. Intergovernmental Panel on Climate Change,IPCC Workshop on Changes in Extreme Weatherand Climate Events, Beijing, China, June 11–13,2002.
8. Easterling, D.R., Meehl, G.A., Parmesan, C.,Changnon, S., Thomas, K., & Mearns, L., “ClimateExtremes: Observations, Modeling, and Impacts,”Science, No. 289, September 22, 2000.
9. Knutson, T.R., Tuleya, R.E., Shen, W., & Ginis, I.,“Impact of CO2 Induced Warming on HurricaneIntensities as Simulated in a Hurricane Modelwith Ocean Coupling,” Journal of Climate, Vol. 14,2001.
10. Alonge, J., Modeling the Soil-StructureInteraction on a 50 Story Building, Tufts University,Medford, Mass., M.S. Thesis No. 5923, September2001.
11. Ambrose, J., & Vergun, D., Simplified BuildingDesign for Wind and Earthquake Forces, New York,John Wiley & Sons, Inc., 1995.
16 CIVIL ENGINEERING PRACTICE FALL/WINTER 2003