effects of light and carbon on phytoplankton production ...782024/fulltext01.pdf · this experiment...
TRANSCRIPT
Effects of light and carbon on phytoplankton production and phyto-microzooplankton trophic interactions in the Baltic Sea: a mesocosm experiment
Mohammad Habibur Rahman
Student
Degree Thesis in Biology 30 ECTS
Master’s Level
Report Passed: January 16 2015
Supervisor: Dr. Antonia Liess

Effects of light and carbon on phytoplankton production and phyto-microzooplankton trophic interactions in the Baltic Sea: a mesocosm experiment
Mohammad Habibur Rahman
ABSTRACT
A mesocosm experiment with four triplicated treatments (control, clear carbon, pigment and dissolved organic matter) was carried out to investigate the effects of light (by pigment addition) and carbon (C) on phytoplankton communities and on the grazing pressure of microzooplankton on phytoplankton in the Baltic Sea. Phytoplankton concentration and species composition were determined by using an inverted microscope following the Utermöhl method. In order to measure differences in phyto-zooplankton trophic interactions between treatments, a dilution experiment was performed at the end of the mesocosm experiment. Surprisingly, the results show that light attenuation was beneficial to phytoplankton production while carbon enrichment had negative effects on phytoplankton production, the highest phytoplankton production was in the low light treatment and lowest phytoplankton production was in the clear C treatment. Cyanobacteria were the most dominant group, representing over 95% of the phytoplankton community. Diatoms were the least dominant group, representing less than 5% of the phytoplankton community. Microzooplankton grazing pressure was affected by light attenuation and C enrichment. Grazing pressure was highest on cyanobacteria in the clear C treatment, but chrysophytes experienced low grazing pressure and had high growth rates in the Control treatment where microzooplankton fed selectively on chrysophytes. The least abundant group, diatoms, decreased although they experienced no grazing pressure in the Control and clear C treatments. This experiment resulted in two surprising findings. First, increased light intensity reduced phytoplankton biomass, especially in the clear C treatment, and second, cyanobacteria constituted an important food source for microzooplankton grazers. This study adds to the increasing evidence that light effects can be counterintuitive and that cyanobacteria are not necessarily grazing resistant and can meditate nutrient transport to higher trophic levels.
Key words: phytoplankton, microzooplankton, trophic interactions, light, carbon, Baltic Sea, dissolved organic matter, pigment
Table of contents
1 Introduction………….…………….………………………..…….....……..1
2 Material and methods………………………..……………….………..2
2.1 Mesocosms location………..…..………………..……………………………………..….…..…...……2
2.2 Mesocosms set up…………………………………….…..….….…………………………..……….…..2
2.3 Dilution experiments……………..………………………………………………………………………3
2.4 Sample analyses………………………………………..….………………………….………….....……..4
2.5 Phytoplankton community composition……………………………………………...…………..4
2.6 Growth and grazing calculation………………………………………………………………………4
3 Results…………………………………………………………………………...5
3.1 Total phytoplankton biovolume……………..………………………….………..……..….…….….5
3.2 Phytoplankton community composition………………………………………………..….………5
3.3 Growth and grazing calculation………………………..……………………………………..……….7
4 Discussion………………………………………………………………….….9
4.1 Overview………………………………………………………….……………………………………..…..…9
4.2 Light and nutrient effects on the phytoplankton community……….………………..…...9
4.3 Microzooplankton grazing on the phytoplankton community…………………..………10
4.4 Conclusions…………………………………………………………………………………………………10
5 Acknowledgements………………………………………………..……11
6 References………………………...................................................11
1
1 INTRODUCTION
Marine phytoplankton are generally accepted to form the basis of the pelagic food web and constitute the staple food of many zooplankton species. Besides their trophic role, phytoplankton are important drivers of nutrient cycles since they assimilate inorganic nutrients such as phosphate, nitrate and carbon dioxide which they convert into organic molecules (Verlencar and Desai 2004). These key primary producers are directly affected by many abiotic variables and are very responsive to environmental changes (Wasmund et al. 2011). Light, in addition to other important nutrients, is a major controlling parameter of life on Earth and governs the production and dispersion of phototrophic organisms. Thus, phytoplankton growth occurs only if sufficient light is available (Calbet et al. 2012), and consequently the growth and reproduction of higher trophic levels, which depend on phytoplankton as a food source are severely dependent on light availability (Hall et al. 2007).
Terrestrial runoff constitutes an important source of nutrients for coastal and estuarine waters (Mozetic and Lipej 1998). Aquatic ecosystems generally receive material that comprises organic matter from the surrounding catchment. The organic matter of terrestrial origin (i.e. allochthonous) can enter into the aquatic ecosystems either in particulate or dissolved form. This allochthonous organic matter may subsidize the aquatic food web (Bartels et al. 2012) supporting heterotrophic bacterial production. Energy and carbon (C) transferred through bacteria and the microbial loop (i.e. trophic path way in the marine microbial food web where dissolved organic C is returned to higher trophic levels via bacteria and protozoans instead of via phytoplankton, Azam et al. 1983) are generally exposed to significant respiration losses and result in poorer efficiency. Importantly, this terrestrial subsidy usually also contains coloured substances like humic acids that change the light regime and decrease light availability for photosynthesis, resulting in lower phytoplankton production (Klug 2005). Light climate can be significantly altered by river inflow that carries particles (Particulate organic matter, POM), suspended particulate matter (SPM) and colored materials (e.g. Colored dissolved organic matter, CDOM and humic substances) (Devlin et al. 2008). Terrestrial organic matter has both positive and negative effects on aquatic food web dynamics and production. There is some evidence that terrestrial organic matter can act as a source of energy for lower trophic levels, despite reducing the light availability for autotrophic production (Lefebure et al. 2013). These inputs might therefore either subsidize or reduce consumer production (Jones et al. 2012). Dissolved organic C (DOC) and particulate organic C (POC) have a great capacity to attenuate light, and high levels of DOC can lead to light limitation of primary producers (Carpenter et al. 1998, Jones et al. 2012), thus possibly switching the base of the food web from a phytoplankton to a bacterial dominated state (Wikner and Andersson 2012).
However, factors that influence primary production and the balance of basal production, also affect higher trophic levels in aquatic food webs. Basal autotrophic species such as algae fix inorganic C and thus efficiently support the growth of higher trophic levels. Thus higher basal production is capable of promoting the production at higher trophic levels and eventually total productivity becomes higher in aquatic ecosystems. Basal production relies on the availability of C and light climate, but in addition to light, the biomass and production of phytoplankton tends to be decreased by grazing. Grazing by zooplankton is an important factor influencing growth rates, biomass, competitiveness and the morphology of phytoplankton (Burian et al. 2012). The principal systematic groups of zooplankton encompass several taxa which feed on phytoplankton and judicious grazing by zooplankton is a major factor affecting phytoplankton communities (Goldyn and Madura 2008). Generally, zooplankton are capable of reducing the number of phytoplankton species by increasing mortality and thus stochastic local extinction of phytoplankton, or they can boost phytoplankton richness by feeding on dominant algal taxa, releasing scarce species from interspecific competition (Lewandowska et al. 2014). The impacts of grazing on the general density of phytoplankton species depends on the grazer feeding preferences and
2
phytoplankton quality (i.e. nutritional value and essential compounds) (Lewandowska et. al 2014). For instances, cyanobacteria are generally believed to be poor quality food and might cause problems for zooplankton grazers due to their filamentous and colonial structure, toxicity or deficit of nutritional value (Leonard and Paerl 2005). It was assumed that the growth of phytoplankton is controlled only by grazers, so that the reduced encounter rates in diluted samples bring about higher phytoplankton net growth. Microzooplankton (250-100 µm) consume phytoplankton and protozoans and are critical in channelling energy from the microbial loop to higher trophic levels (Burian et al. 2012). Thus, measuring the grazing effects of zooplankton on phytoplankton is central for understanding C flow and the consequences of altered basal production in marine ecosystems.
Since coastal water and estuaries are important locations for studying interactions between phytoplankton and zooplankton, due to their high nutrient levels and high phytoplankton concentrations (Mozetic and Lipej 1998), this study was conducted in coastal mesocosms. Furthermore, climate change predictions for the region indicate that the runoff of terrestrial matter in the studied region will strongly increase by 2100 (Meier et al. 2014).
The aims of this study were to test the effects of light and C on different phytoplankton taxa and to test the grazing effects of microzooplankton on phytoplankton at the end of the mesocosm experiment. The following hypotheses were tested:
(I) Decreased light availability will decrease phytoplankton production.
(II) Cyanobacteria will be resistant to microzooplankton grazing impacts.
2 MATERIAL AND METHODS
In order to determine the qualitative and quantitative effects of light and C on plankton communities, a mesocosm experiment was conducted in the Baltic Sea. Further, I investigated the impact of light and C on phyto-zooplankton interactions using dilution experiments with sub-samples collected during the mesocosm experiment.
2.1 Mesocosms location
The mesocosm experiment was carried out in a sheltered bay of the Baltic Sea close to Norrbyn, Sweden (61° 17' 00" N; 16° 57' 00" E). The Baltic Sea is a shallow intra-continental shelf Sea which is connected to the Atlantic Ocean and North Sea (Wasmund and Uhlig 2003). The Baltic Sea was a freshwater lake at the melting of the ice edge and later turned into a brackish-water sea (Fonselius and Valderrama 2003). The mixture of freshwater input from the rivers surrounding the Northern Baltic Sea and salt water input from the Southern connection with the North Sea creates a salinity gradient from around 15 ppt in the Danish Belts surface water to 2-3 ppt in the northern Bothnian Bay (Wasmund et al. 2011). The mesocosm study was carried out in Southern Bothnian Bay where the salinity is around 1-2 ppt.
2.2 Mesocosms set up
In order to disentangle the effects of light attenuation and C enrichment on phytoplankton communities, a mesocosm experiment including four triplicated treatments was performed. The first treatment was the Control (Sea water). In the second treatment, dissolved organic matter (DOM) was added to the mesocosms in order to have both a shading and a C fertilization treatment. The third treatment consisted of adding clear C as a resource while excluding the effect of shading and in the last treatment a pigment was added to stain the water causing similar shading as the CDOM, without adding a C resource. The clear C

3
treatment was made from different carbon compounds that were selected from Biology Ecoplates. The DOM added was a natural soil extract made from soil collected on the banks of a nearby river. Mesocosms consisted of cylinders of 2 m height and 1.6 m width and integrated benthic sediments as well as a pelagic food web. The mesocosm experiments were initiated in July 2013 and ran for six weeks.
2.3 Dilution experiments
A dilution experiment was performed at the end of the mesocosm experiment to measure differences in phyto-zooplankton trophic interactions driven by the treatments. Dilution experiments are a common approach to the measurement of herbivory by micro zooplankton in natural seawater communities (Landry and Hassett 1982). Dilution reduces encounter rates between phytoplankton and their micro zooplankton grazers. The method consists of amending natural assemblages of phytoplankton and grazers with varying proportions of filtered seawater creating a dilution series, and then estimating the grazing rate as the increase in apparent phytoplankton growth rate with the dilution factor (Fig. 1). Specifically, the micro zooplankton grazing rate is estimated as the slope of a regression of apparent phytoplankton growth in the various dilutions against dilution factor. The growth rate of the phytoplankton is estimated as the apparent growth rate extrapolated to 100% dilution (growth in the absence of grazers).
Figure 1. Phytoplankton growth rate and microzooplankton grazing rate
The approach relies on relatively few assumptions: (1) phytoplankton growth rate is limited neither by nutrients nor by density dependence, (2) phytoplankton growth is exponential, and (3) consumption rates by micro zooplankton are linear with respect to phytoplankton concentration.
A dilution series of 12.5, 50 and 100% of undiluted mesocosm water was prepared from each mesocosm. The mesocosm water was previously sieved through a 100-μm mesh to remove large zooplankton. The dilution was realized with water filtered with 0.45+0.2 μm sterile inline membrane filters. The incubations were performed in 2-L polycarbonate bottles which were slowly filled with water from each dilution series (n = 36: 12 mesocosms × 3 dilutions ). The incubations were performed in a temperature controlled room set at 18°C (water
4
temperature of the mesocosms) under a 16:-8 light:-dark cycle. Sterile filtered nutrient solutions were added to the dilution series in order to prevent nutrient limitation biases (Löder et al. 2011). One undiluted water bottle from each mesocosm was incubated without addition of nutrients to count as control for the nutrient addition. Samples were taken into 100 mL glass bottles just after completion of dilution series and after ca. 40 h of incubation. Lugol’s iodine solution was used to fix the samples. All samples were stored under cool and dark conditions until further analysis.
2.4 Sample analyses
Phytoplankton concentration and species composition (Chlorophyte, Chrisophyte, Cyanobacteria, Diatom, Haptophyte) were determined using an inverted microscope following the Utermöhl method ( Utermöhl 1931, Utermöhl 1958). The samples were gently turned 100 times for homogenisation before pouring the samples into the sedimentation chamber. After homogenisation, the 12.5% and 50% diluted samples were sedimented over night using a 25 mL sedimentation column. The 100% undiluted samples were directly placed in the 2.973 mL counting chamber and sedimented for at least two hours. Species counting and identification were done at 200 and 400 fold magnification respectively. The sedimentation chambers were cleaned immediately after analysis with a soft brush to prevent salt precipitate formation and kept dust free to avoid contamination of the next samples.
2.5 Phytoplankton community composition
Biovolume of each phytoplankton species was calculated from the measurement of cell dimensions using geometric formulae according to (Hillebrand et al. 1999). In order to highlight clear trends and responses to the different treatments, phytoplankton species were taxonomically grouped in chlorophyte, chrisophyte, cyanobacteria, diatom and haptophyte. The phytoplankton community composition was then determined by calculating the relative contribution of each phytoplankton group (in terms of biovolume) to the total phytoplankton community using the 100% undiluted samples taken before the incubations.
2.6 Growth and grazing calculation
Growth rates of phytoplankton groups (see above) and grazing rates of the microzooplankton community were calculated using linear regressions of apparent phytoplankton growth (calculated for phytoplankton groups as well as for the total phytoplankton community) against the dilution factor (Landry and Hassett 1982, Landry 1993 Fig. 1). The growth of phytoplankton (hour-1) was described by the exponential growth model:
Pt = P0 e(k-g)t
where P0 is the concentration of phytoplankton biomass at the beginning of the incubation, Pt after ca. 40 h, k is the phytoplankton growth coefficient, g is the microzooplankton grazing coefficient and t is the incubation time in hours (Fig. 1). I tested the significance of regression with the analysis of variance (ANOVA) method. The instantaneous (natural) growth rate of phytoplankton μ0 was calculated by adding grazing mortality to values of apparent phytoplankton growth obtained from the incubation bottles without added nutrients (Landry 1993, Caron 2000); negative values of g were set to zero for calculation.

5
3 RESULTS
3.1 Total phytoplankton biovolume
The different treatments significantly affected the total phytoplankton biovolume (Figure 2). These results reflect the effect of the different treatments after a month of mesoscosm experiment. While the clear C treatment resulted in a much smaller phytoplankton community biovolume, the pigment treatment did not significantly affect the phytoplankton community biovolume. Phytoplankton biovolume in the DOM treatment, which in essence combines both the clear C and the pigment treatment, affecting light and C availability, decreased two fold compared to the control. Interestingly, these differences were only driven by the abundances of the two dominant phytoplankton species, the cyanobacteria Anabaena sp. and Pseudanabaena sp. (data not shown).
Figure 2. Total phytoplankton biovolume in the 4 different treatments shown as means ± 1 S.D. Letters indicate significant differences between treatments (one-way ANOVA, p<0.05, posthoc test, Tukey HSD).
3.2 Phytoplankton community composition
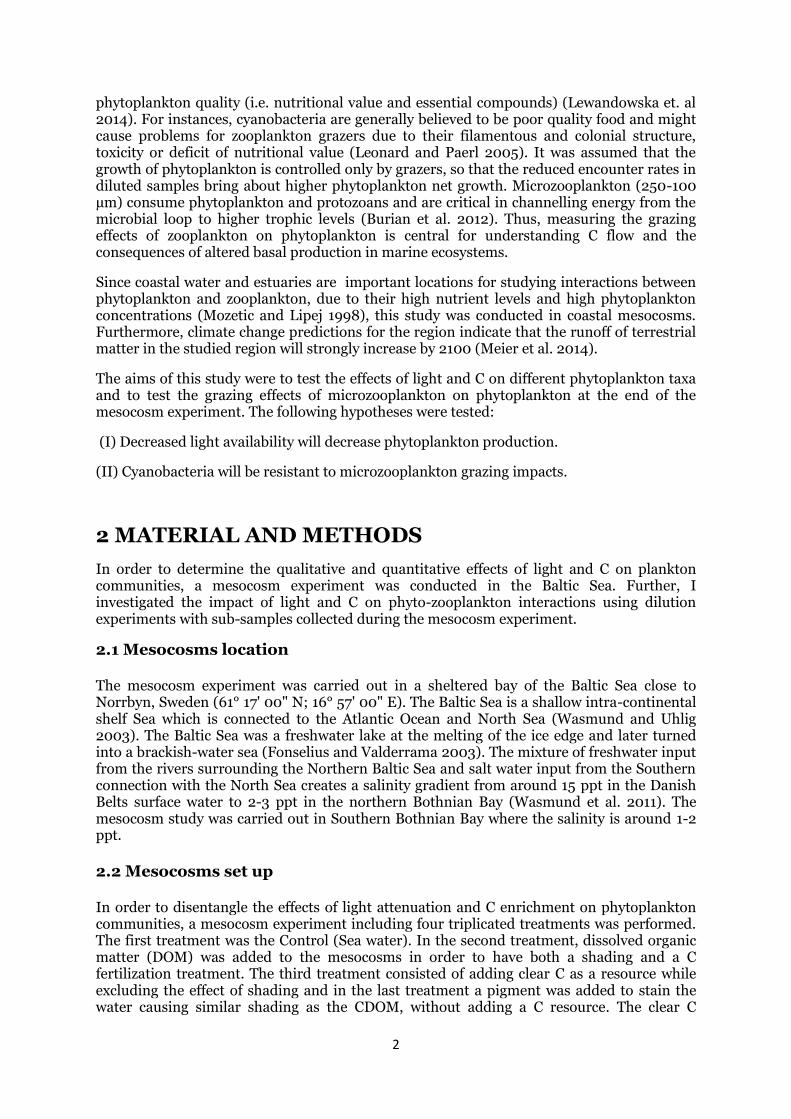
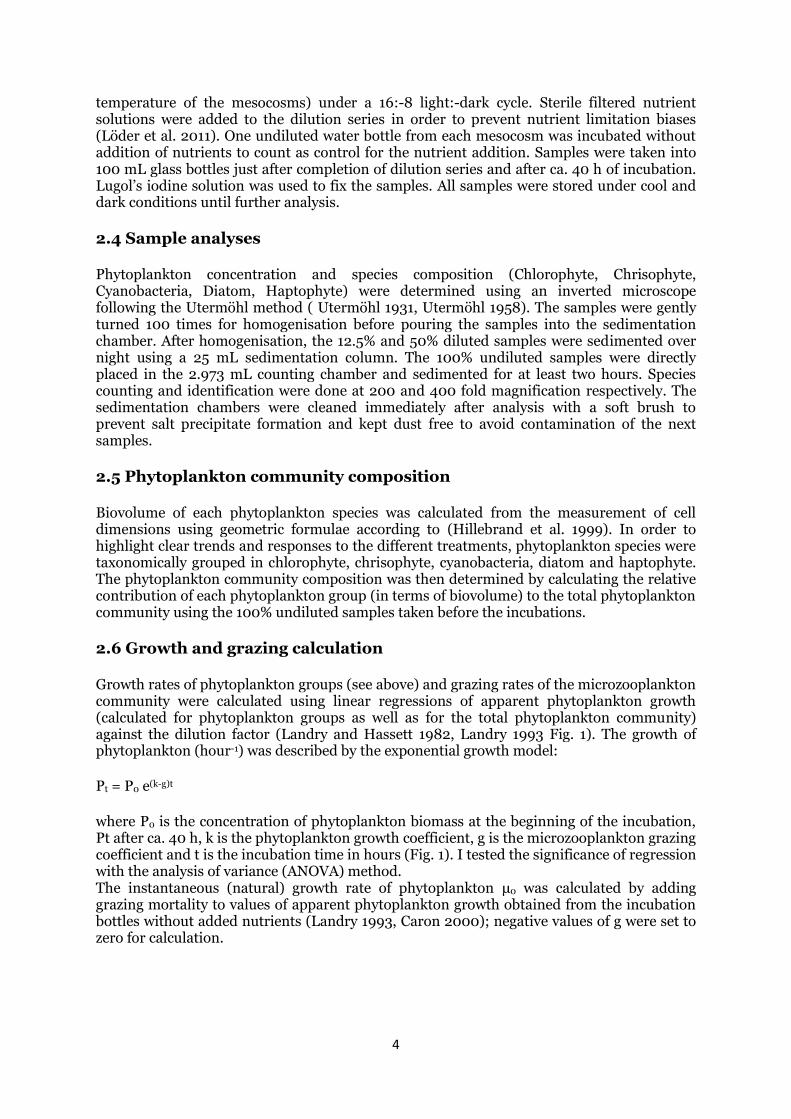
The phytoplankton community was dominated by cyanobacteria, which represented over 95% of the total algal biovolume, in all treatments (Figure 3A, 5A, and 6A) but the clear C treatment (Figure 4). The clear C treatment was dominated by chlorophyte which contributed to 76% of the phytoplankton community. Furthermore, one species, Tetraedron sp., represented 51% of the total phytoplankton biovolume in this treatment (Figure 4).
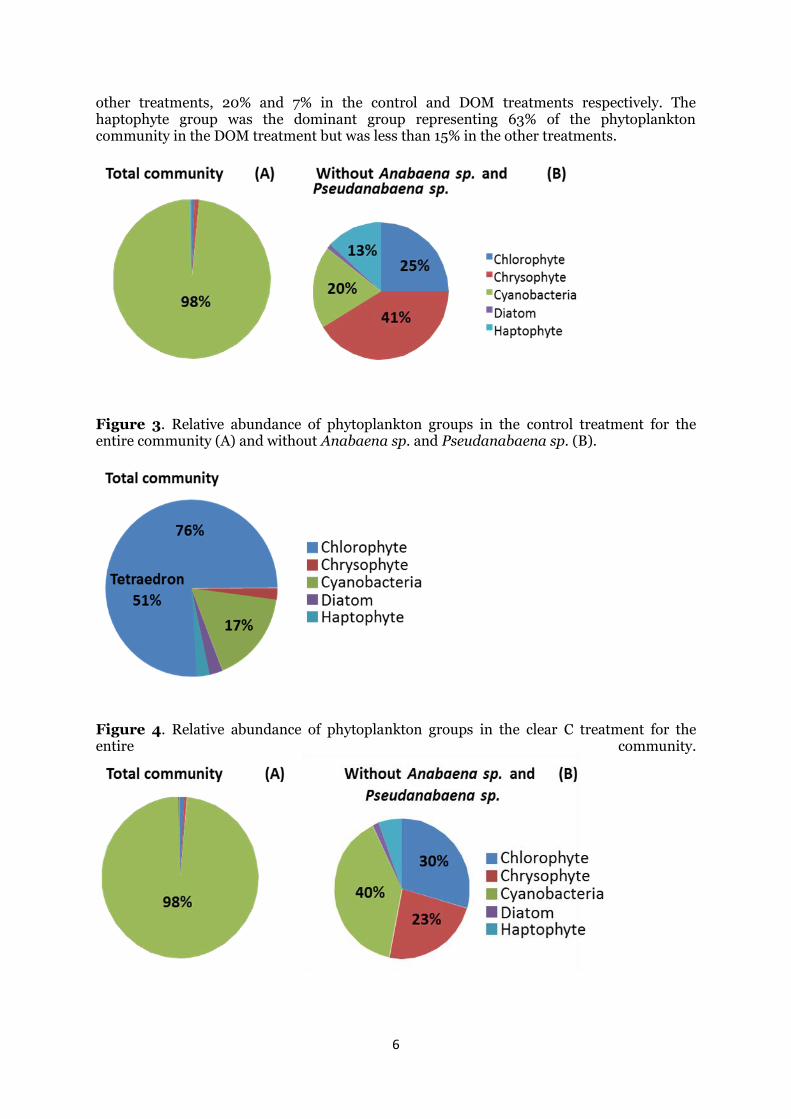
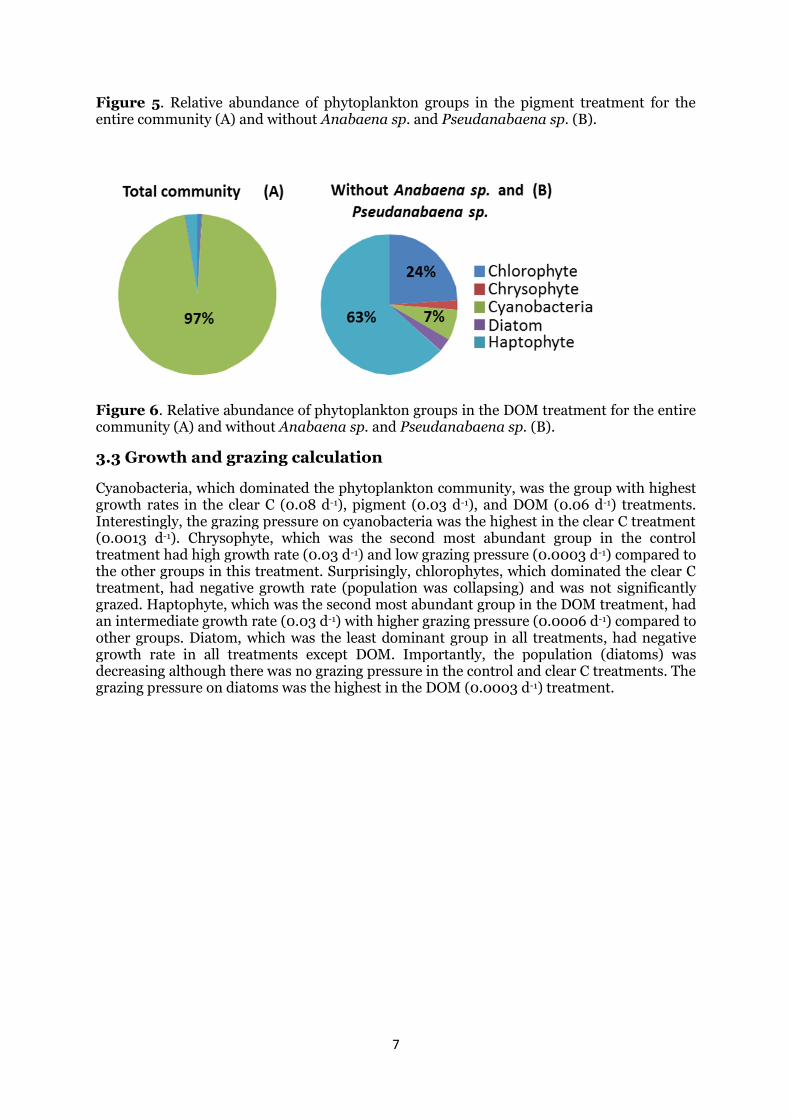
In order to compare differences between treatments for the lesser abundant groups (Figure 3B, 5B, and 6B), I excluded the two most abundant cyanobacteria species (Anabaena sp. and Pseudanabaena sp.) for the control, pigment, and DOM treatments. Consequently, the chlorophyte group accounted for about a quarter of the total community while diatoms represented less than 5% of the community in the control, pigment, and DOM treatments. Chrysophytes represented 41% and 23% of the community in the control and pigment treatment respectively, but less than 5% in the DOM treatment. Even after removing the two most abundant species, cyanobacteria dominated the phytoplankton community in the pigment treatment, making up 40% of the remaining biovolume, but were less abundant in
6
other treatments, 20% and 7% in the control and DOM treatments respectively. The haptophyte group was the dominant group representing 63% of the phytoplankton community in the DOM treatment but was less than 15% in the other treatments.
Figure 3. Relative abundance of phytoplankton groups in the control treatment for the entire community (A) and without Anabaena sp. and Pseudanabaena sp. (B).
Figure 4. Relative abundance of phytoplankton groups in the clear C treatment for the entire community.
7
Figure 5. Relative abundance of phytoplankton groups in the pigment treatment for the entire community (A) and without Anabaena sp. and Pseudanabaena sp. (B).
Figure 6. Relative abundance of phytoplankton groups in the DOM treatment for the entire community (A) and without Anabaena sp. and Pseudanabaena sp. (B).
3.3 Growth and grazing calculation
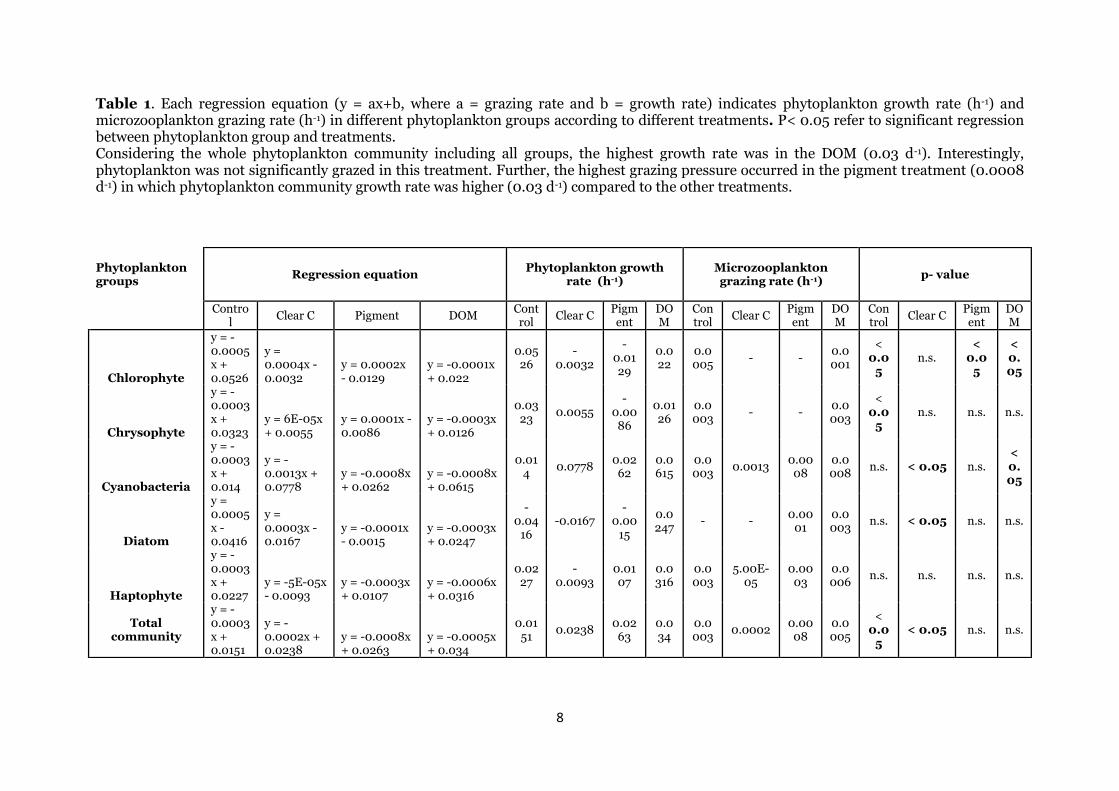
Cyanobacteria, which dominated the phytoplankton community, was the group with highest growth rates in the clear C (0.08 d-1), pigment (0.03 d-1), and DOM (0.06 d-1) treatments. Interestingly, the grazing pressure on cyanobacteria was the highest in the clear C treatment (0.0013 d-1). Chrysophyte, which was the second most abundant group in the control treatment had high growth rate (0.03 d-1) and low grazing pressure (0.0003 d-1) compared to the other groups in this treatment. Surprisingly, chlorophytes, which dominated the clear C treatment, had negative growth rate (population was collapsing) and was not significantly grazed. Haptophyte, which was the second most abundant group in the DOM treatment, had an intermediate growth rate (0.03 d-1) with higher grazing pressure (0.0006 d-1) compared to other groups. Diatom, which was the least dominant group in all treatments, had negative growth rate in all treatments except DOM. Importantly, the population (diatoms) was decreasing although there was no grazing pressure in the control and clear C treatments. The grazing pressure on diatoms was the highest in the DOM (0.0003 d-1) treatment.
8
Table 1. Each regression equation (y = ax+b, where a = grazing rate and b = growth rate) indicates phytoplankton growth rate (h-1) and microzooplankton grazing rate (h-1) in different phytoplankton groups according to different treatments. P< 0.05 refer to significant regression between phytoplankton group and treatments. Considering the whole phytoplankton community including all groups, the highest growth rate was in the DOM (0.03 d-1). Interestingly, phytoplankton was not significantly grazed in this treatment. Further, the highest grazing pressure occurred in the pigment treatment (0.0008 d-1) in which phytoplankton community growth rate was higher (0.03 d-1) compared to the other treatments.
Phytoplankton groups
Regression equation Phytoplankton growth
rate (h-1) Microzooplankton grazing rate (h-1)
p- value
Contro
l Clear C Pigment DOM
Control
Clear C Pigment
DOM
Control
Clear C Pigment
DOM
Control
Clear C Pigment
DOM
Chlorophyte
y = -0.0005x + 0.0526
y = 0.0004x - 0.0032
y = 0.0002x - 0.0129
y = -0.0001x + 0.022
0.0526
-0.0032
-0.0129
0.022
0.0005
- - 0.0001
< 0.0
5 n.s.
< 0.0
5
< 0.05
Chrysophyte
y = -0.0003x + 0.0323
y = 6E-05x + 0.0055
y = 0.0001x - 0.0086
y = -0.0003x + 0.0126
0.0323
0.0055 -
0.0086
0.0126
0.0003
- - 0.0003
< 0.0
5 n.s. n.s. n.s.
Cyanobacteria
y = -0.0003x + 0.014
y = -0.0013x + 0.0778
y = -0.0008x + 0.0262
y = -0.0008x + 0.0615
0.014
0.0778 0.0262
0.0615
0.0003
0.0013 0.0008
0.0008
n.s. < 0.05 n.s. < 0.05
Diatom
y = 0.0005x - 0.0416
y = 0.0003x - 0.0167
y = -0.0001x - 0.0015
y = -0.0003x + 0.0247
-0.04
16 -0.0167
-0.00
15
0.0247
- - 0.00
01 0.0003
n.s. < 0.05 n.s. n.s.
Haptophyte
y = -0.0003x + 0.0227
y = -5E-05x - 0.0093
y = -0.0003x + 0.0107
y = -0.0006x + 0.0316
0.0227
-0.0093
0.0107
0.0316
0.0003
5.00E-05
0.0003
0.0006
n.s. n.s. n.s. n.s.
Total community
y = -0.0003x + 0.0151
y = -0.0002x + 0.0238
y = -0.0008x + 0.0263
y = -0.0005x + 0.034
0.0151
0.0238 0.0263
0.034
0.0003
0.0002 0.0008
0.0005
< 0.0
5 < 0.05 n.s. n.s.

9
4 DISCUSSION
4.1 Overview
My experiment showed that decreased light availability did not decrease phytoplankton production (refuting hypothesis I). Bloom-forming cyanobacteria were grazed by microzooplankton, and thus were not grazing resistant (refuting hypothesis II).
4.2 Light and nutrient effects on the phytoplankton community
Surprisingly, phytoplankton biomass and production was highest in the pigment treatment, where light levels were reduced compared to the other treatments. The lowest phytoplankton production was found in clear C treatment where light levels were high. This shows that phytoplankton were not light limited, but probably instead nutrient limited. It is also possible that light inhibition occurred in the treatments with no shading. Or it is possible that clear C had negative effects on the growth of several phytoplankton taxa. This might be because C enrichment acidified the water in clear C treatment and inhibited phytoplankton growth (Wang et al. 2011). In the DOM treatment (which combines the effects of the clear C and pigment treatment), phytoplankton growth was intermediate levels but lower than the control treatment. This might be due to the impact of shading, C enrichment and coloured DOC (Carpenter et al. 1998). DOM has the capacity to attenuate light and reduces light penetration through the water column, causing less photosynthesis and therefore decreasing phytoplankton growth (Jones et al. 2012).
However, there is an alternative explanation for the observed patterns. Phytoplankton compete with bacteria for nutrients, but at the same time provide bacteria with labile C. Bacteria are better nutrient competitors, due to their small cell size (Vadstein 2000), whereas bacteria depend on phytoplankton for labile C exudations (Baines and Pace 1991, Cole et al. 1982). At high irradiances and low nutrient levels, phytoplankton exudate C and provide bacteria with large amounts of autochthonous (Algal) C. At the same time bacteria limit phytoplankton growth by taking up all available nutrients. Therefore phytoplankton might suffer more severely from nutrient limitation in the control and the clear C treatment, thus having lower levels of biomass than in the shaded and DOM treatment. In the shaded treatment, bacterial growth may have been C limited due to low algal exudations, thus relieving algae from their nutrient competition with bacteria, whereas in the DOM treatment nutrients are provided in addition to organic C, thus relieving phytoplankton from nutrient limitation.
Cyanobacteria were the dominating group in all treatments except the clear C treatment. Interestingly, the clear C treatment was dominated by the chlorophyte group. This might be because, perhaps cyanobacteria could not survive in C enriched water or because clear C inhibited the growth of cyanobacteria (Wang et al. 2011). When the two most abundant cyanobacteria species (Anabaena sp. and Pseudanabaena sp,) were excluded from the analyses in order to analyse the treatment differences between the less abundant groups, data showed that chlorophytes represented a considerable portion (ca. 25%) of the rest of the phytoplankton community in all treatments. This indicates that there is no significant impact of pigment and DOM treatments on the growth of chlorophytes.
Diatoms comprised less than 5% of the entire phytoplankton biovolume in all treatments including clear C. This means that diatoms were probably silica deficient in all treatments. The group chrysophyta represented 41% of the total community in control, 23% in pigment treatment and less than 5% in the DOM treatment. There were negative effects of reduced light availability on the growth of chrysophyta, which supports the results of Kim et al. (2007), Klug (2002) and Wang et al. (2011). Interestingly, there were positive effects of the DOM treatment on the growth of haptophytes (Klug 2002) which was the dominating group in this treatment, representing 63% of the phytoplankton community.

10
Notably, cyanobacteria were the dominating group occupying 40% of the community in the pigment treatment even after removing the two most abundant cyanobacteria species (Anabaena sp. and Pseudanabaena sp.) from the analyses. Perhaps, the nutrients contained in the DOM helped the growth of cyanobacteria, since it has previously been shown that anthropogenic nutrient enrichment aided cyanobacterial growth (Riha and Krawezyk 2013).
4.3 Microzooplankton grazing on the phytoplankton community
The most dominant group in the phytoplankton community were the cyanobacteria. They had highest growth rates (0.08 d-1) in the clear C treatments. Interestingly, microzooplankton grazing pressure on cyanobacteria was also highest (0.0013 d-1) in this treatment, indicating that cyanobacteria were selectively grazed by microzooplankton under clear C conditions. This finding is in contrast to the traditional belief that cyanobacteria are grazing resistant, toxic and generally a poor food source for zooplankton. However, my results support recent findings from studies in the Baltic Sea which showed that cyanobacteria were used as food source and can support the growth of higher trophic levels (Högfors et al. 2014).
Chrysophytes were the second most dominant group, with especially high abundances and growth rates (0.03 d-1) in the control treatment. This was probably due to the low grazing pressure (0.0003 d-1) compared to grazing pressure on other phytoplankton groups. That microzooplankton may feed selectively, as suggested by Calbet et al (2012) has been documented before (Goldyn and Madura 2008, Lewandowska et al. 2014). Unexpectedly, chlorophyte biovolume, which dominated the clear C treatment, was collapsing, with negative growth rates, although they were not significantly grazed. This might be due to C enrichment in this treatment inhibiting chlorophyte growth by acidification (Wang et al. 2011); and fewer chlorophytes would result in fewer encounters by microzooplankton and therefore insignificant microzooplankton grazing. Another group, the haptophyte dominated the DOM treatment with intermediate growth rates (0.03 d-1), indicating that the DOM treatment favoured haptophytes. But microzooplankton grazing pressure on haptophytes were higher (0.0006 d-1) compared to other groups which reveals that more haptophytes were grazed in the DOM treatment. This could be illustrated by the conclusion of Lewandowska et al. (2014) and Burian et al. (2012). They found that consumers’ effects on the phytoplankton species depend on the consumer quality, it’s integrity (i.e. purity), feeding preferences, phytoplankton quality, growth rate, competitiveness and morphology of prey organisms. The diatoms were the least abundant phytoplankton, and the diatoms were decreasing in all treatments except the DOM treatment. Carbon enrichment could have inhibited diatom growth by acidification (Wang et al. 2011). Possibly diatoms also became silicate limited, which is an element commonly limiting diatom growth. Acidification or nutrient limitation in control and clear C treatments, might be the cause of why diatoms were decreasing despite no grazing pressure. Only in the DOM treatment, microzooplankton grazed on diatom (0.0003 d-1), probably because here phytoplankton biomass was increasing and more encounters occurred (Kim et al. 2007).
Considering all phytoplankton groups, the highest phytoplankton growth rate was found in DOM treatments, which supported intermediate grazing rates. The DOM treatment was favourable for all groups of phytoplankton. The highest overall grazing pressure was observed in the pigment treatment, which suggests that phytoplankton, despite being dominated by cyanobacteria in this treatment, were highly palatable.
4.4 Conclusions
The aim of this study was to evaluate the impacts of light and C on the qualitative and quantitative prosperity of phytoplankton taxa as well as to determine phyto-microzooplankton trophic interactions in the Baltic Sea. From my findings, I conclude that the DOM treatment, which combines both light reduction and addition of terrestrial C and
11
nutrients is best at boosting phytoplankton growth. Additionally, the high grazing rates on cyanobacteria in DOM treatment, mean that cyanobacteria can support the growth of higher trophic levels. The knowledge gained from this experiment can be utilized for Baltic Sea management purposes by understanding the growth of phytoplankton, how these most efficiently support zooplankton growth, which in turn supports fish growth which is a valuable economic purpose.
5 ACKNOWLEDGEMENTS
I would like to thank my supervisor Dr. Antonia Liess for her impressive help, encouraging comments and constructive criticism in completing my thesis. I am really grateful to Dr. Cedric Meunier and would like to thank him for his great help in field work, laboratory work with the topic and for always having answer to my questions. I would like to thank Dr. Owen Rowe, who organised and led the mesocosm experiment and provided useful comments on my thesis. I would also like to thank Anne Deininger for helping me to use the microscope and for sharing the laboratory.
6 REFERENCES
Azam F, Fenchel T, Field JG, Gray JS, Meyerreil LA, Thingstad, F. 1983. The ecological role of water-column microbes in the sea. Marine Ecology Progress Series, 19:257-263.
Baines, S.B., and Pace, M.L. 1991. The production of dissolved organic-matter by phytoplankton and its importance to bacteria - patterns across marine and fresh-water systems. Limnology and Oceanography, 36:1078-1090.
Bartels, P., J. Cucherousset, C. Gudasz, M. Jansson, J. Karlsson, L. Persson, K. Premke, A. Rubach, K. Steger, L. J. Tranvik, and P. Eklöv. 2012. Terrestrial subsidies to lake food webs: an experimental approach. Oecologia, 168:807-818.
Burian, A., M. Schagerl, and A. Yasindi. 2012. Microzooplankton feeding behaviour: grazing on the microbial and the classical food web of African soda lakes. Hydrobiologia Do Leonard, J. A., and H. W.Paerl. 2005. Zooplankton community structure, micro-zooplankton grazing impact and seston energy content in the St. Johns river system, Florida asinfluenced by the toxic cyanobacterium Cylindrospermopsis raciborskii. Hydrobiologia, 537:89-97.
Calbet, A., A. M. Rodrigo, I. Stamatina, Z. Soultana, J. C. Nejstgaard, P. Pitta, A. F Sazhin, D. Sousoni, A. Gomes, S. A. Berger, T. M. Tsagaraki, and R. Ptacnik. 2012. Effects of light availability on mixotrophy and microzooplankton grazing in an oligotrophic plankton food web: Evidences from a mesocosm study in eastern Mediterranean waters. Journal of Experimental Marine Biology and Ecology, 66:424-425.
Caron, DA. 2000. Protistan herbivory and bacteriovory. In: Paul J (ed). Methods in Microbiology. Academic Press, 30:289-315.
Carpenter, S. R., J. J. Cole, J. F. Kitchell, and M. L. Pace. 1998. Impact of dissolved organic carbon, phosphorus and grazing on phytoplankton biomass and production in experimental lakes. Limnology and Oceanography, 43:73-80.
12
Cole, J.J., Likens, G.E., and Strayer, D.L. 1982. Photosynthetically produced dissolved organic-carbon-an important carbon source for planktonic bacteria. Limnology and Oceanography, 27:1080-1090.
Devlin, M. J., J. Barry, D. K. Mills, R. J. Gowen, J. Foden, D. Sivyer, and P.Tett. 2008. Relationships between suspended particulate material, light attenuation and Secchi depth in UK marine waters. Estuarine, Coastal and Shelf Science, 79:429-439.
Fonselius, S., and J. Valderrama. 2003. One hundred years of hydrographic measurements in the Baltic Sea. Journal of Sea Research, 49:229-241.
Goldyn, R., and K. K. Madura. 2008. Interactions between phytoplankton and zooplankton In the hypertrophic Swarzedzkie lake in western Poland. Journal of Plankton Research, 30:33-42.
Hall, S. R., M. A. Leibold, D. A. Lytle, and V. H. Smith. 2007. Grazers, producer stoichiometry, and the light : nutrient hypothesis revisited. Ecology, 88:1142-1152.
Hillebrand, H., C-D. Diirselen, D. Kirschtel, U. Pollingher, and T. Zohary. 1999. Biovolume calculation for pelagic and benthic microalgae. Journal of Phycology, 35:403-424.
Högfors, H., N. H. Motwani, S. Hajdu, R. El- Shehawy, T. Holmborn, A. Vehmaa, J. E.-Öst, A. Brutemark, and E. Gorokhova. 2014. Bloom-forming cyanobacteria support copepod reproduction and development in the Baltic Sea. Plos One, 9:e112692. Doi:10,1371/ journal. pone. 0112692.
Jones, S.E., C. T. Solomon, and B. C. Weidel. 2012. Subsidy or subtraction: how do terrestrial inputs influence consumer production in lakes? Freshwater Reviews, 5:37-49.
Kim, S., M. G. Park, C. Moon, K. Shin, and M. Chang. 2007. Seasonal variation in phytoplankton growth and microzooplankton grazing in a temperate coastal embayment, Korea. Estuarine, Coastal and Shelf Science, 71:159-169.
Klug, J. L. 2002. Positive and negative effects of allochthonous dissolved organic matter and inorganic nutrients on phytoplankton growth. Canadian Journal of Fisheries and Aquatic Sciences, 59:85-95.
Klug, J. L. 2005. Bacterial response to dissolved organic matter affects resource availability for algae. Canadian Journal of Fisheries and Aquatic Sciences, 62:472-481.
Landry, M.R., and R. P. Hassett. 1982. Estimating the grazing impact of marine micro-zooplankton. Marine Biology, 67:283-288.
Landry, MR. 1993. Estimating rates of growth and grazing mortality of phytoplankton by the dilution method. In: Kemp PF, Sherr BF, Sherr EB, Cole JJ (eds). Handbook of methods in aquatic microbial ecology. Lewis Publishers, Boca Raton:715-722.
Lefebure, R., R. Degerman, A. Andersson, S. Larsson, L-O. Eriksson, U.B. Amstedt, and P. Byström. 2013. Impacts of elevated terrestrial nutrient loads and temperature on pelagic Food-web efficiency and fish production. Global Change Biology, 19:1358-1372.
Leonard, J. A., and H. W. Paerl. 2005. Zooplankton community structure, microzooplankton grazing impact and seston energy content in the St. Johns river
13
system, Florida as influenced by the toxic cyanobacterium Cylindrospermopsis raciborskii. Hydrobiologia, 537:89-97.
Lewandowska, A. M., H. Hillebrand, K. Lengfellner, and U. Sommer. 2014. Temperature effects on phytoplankton diversity – The zooplankton link. Journal of Sea Research, 85:359-364.
Löder, M. G. J., C. Meunier, K. H. Wiltshire, M. Boersma, and N. Aberle. 2011. The role of ciliates, heterotrophic flagellates and copepods in structuring spring plankton communities at Helgoland Roads, North Sea. Marine Biology, 158:1551-1580.
Meier, H. E. M., Andersson, H. C., Arheimer, B., Donnelly, C., Eilola, K., Gustafsson, B. G., Kotwicki, L., Neset, T.-S., Niiranen, S., and Piwowarczyk, J. 2014. Ensemble Modeling of the Baltic Sea Ecosystem to Provide Scenarios for Management. A Journal of the Human Environment, 43:37-48.
Mozetic, P., and L. Lipej. 1998. Phytoplankton-Zooplankton trophic interactions along the salinity gradient (Gulf of Trieste). Rapid Communication Internationale Mer Mediterranee, 35:468-469.
Riha, S., and H. Krawezyk. 2013. Remote sensing of cyanobacteria and green algae in the Baltic sea. ASPRS 2013 Annual Conference, March 24-28, 2013.
Utermöhl, H. 1931. New approaches to the quantification of plankton ( With special Berücksichtigun of Ultra plankton). Limnology, 5:567-596.
Utermöhl, H. 1958. The improvement of quantitative phytoplankton methodology. Limnology, 9:1-38.
Vadstein, O. 2000. Heterotrophic, planctonic bacteria and cycling of phosphorus - Phosphorus requirements, competitve ability, and food web interactions. Advances in Microbial Ecology (ed B. Schink):115-167. Kluwer Academic / Plenum Publ, New York, USA.
Verlencar, X. N., and S. Desai. 2004. Phytoplankton identification manual. National Institute of Oceanography. Dona Paula, Goa - 403 004.
Wang x., C. Hao, F. Zhang, C. Feng, and Y. Yang. 2011. Inhibition of the growth of two Blue-green algae (Microsystis aruginosa and Anabaena spiroides) by acidification treatments using carbon dioxide. Bioresource Technology, 102:5742-5748.
Wasmund, N., and S. Uhlig. 2003. Phytoplankton trends in the Baltic Sea. Journal of Marine Science, 60:177-186.
Wasmund, N., J. Tuimala, S. Suikkanen, L. Vandepitte, and A. Kraberg. 2011. Long-term trends in phytoplankton composition in the western and central Baltic Sea. Journal of Marine Systems, 87:145-159.
Wikner, J., and A. Andersson. 2012. Increased freshwater discharge shifts the trophic balance in the coastal zone of the northern Baltic Sea. Global Change Biology, 18:2509-2519.

14
Dept. of Ecology and Environmental Science (EMG) S-901 87 Umeå, Sweden
Telephone +46 90 786 50 00
Text telephone +46 90 786 59 00 www.umu.se