effects of mixing ratio of binary fine particles on the ...(ca.#: mx-500), respectively. their...
TRANSCRIPT

296 ©2016 Hosokawa Powder Technology Foundation
KONA Powder and Particle Journal No. 33 (2016) 296–303/Doi:10.14356/kona.2016013 Original Research Paper
Effects of Mixing Ratio of Binary Fine Particles on the Packing Density and Filtration Characteristics †
Kuo-Jen Hwang * and Iou-Liang Lin1 Department of Chemical and Materials Engineering, Tamkang University, Taiwan
AbstractBinary fine particles were dispersed in glycerol aqueous solutions with different mixing ratios to study the effects of particle size distribution and fluid viscosity on the cake properties in dead-end filtration, such as average porosity, average specific filtration resistance and compressibility of cake. The average specific cake filtration resistance increases with increasing the fraction of small particles. However, the lowest cake porosity occurs under the volume fraction of large particles of 0.75. Comparing different methods for porosity estimations, model estimation is more accurate for those particles near pure composition, while simulation method is more suitable for moderate composition of particle mixtures. Furthermore, the cake porosity increases but the average specific cake filtration resistance decreases with increasing fluid viscosity. An 18 % porosity increase and a 30 % filtration resistance decrease are obtained when fluid viscosity increases from 1 to 10 × 10–3 Pa·s. The cake properties, such as the particle packing structure in the cake and the resulting filtration resistance, are affected not only by the particle size distribution but also by the fluid viscosity. The particle size distribution plays a much more important role on the cake compressibility than the fluid viscosity does.
Keywords: particle size distribution, microfiltration, cake properties, fluid viscosity, packing porosity, filtration.
1. Introduction
Microfiltration has been widely used for separating fine particles from liquids in various industrial processes. In such a filtration, how to enhance filtration rate and sepa-ration efficiency are the most important issues on process engineers concern. In general, the cake properties, such as porosity and specific filtration resistance, are the most important parameters affecting filtration performance. The cake properties are determined mainly by many fac-tors, for instance, the particle size distribution, fluid rhe-ology and operating conditions. Therefore, understanding the effects of particle size distribution and fluid viscosity on the cake properties is an essential step in grasping a filtration problem.
Tiller F.M. et al. (1972) proposed power-type empirical equations to correlate cake porosity or specific filtration resistance with solid compressive pressure. The cake compressibility could be indicated by the exponent of those empirical equations. Lu W.M. and Hwang K.J.
(1993) employed a force balance model to discuss the crit-ical friction angle for particle deposition on the cake sur-face in constant pressure filtration. The packing structure in cake could then be simulated using the friction angle under various conditions. When the critical friction angle was larger, the particles were more stable on the cake sur-face, the packing structure would be looser, and the cake porosity increased but the specific filtration resistance de-creased. To discuss how the properties of cakes formed by dual-sized submicron particles affect the performance of cross-flow microfiltration, Hwang K.J. and Lin K.P. (2002) used packing theories of cavern and displacement effects to estimate the cake porosities with different parti-cle compositions. Although the fluid flow effect in the tangential direction was ignored, the theoretical results agreed with the experimental data in the region near uni-form sized particles.
The basic filtration equation was frequently used for estimating filtration flux based on the well-known Darcy’s law, that is,
c m c av mRP PqR w R
(1)
where q is the filtration flux, ΔP is the filtration pressure, μ is the fluid viscosity, wc is the cake mass, αav is the average specific cake filtration resistance, and Rc and Rm are the filtration resistances of filter cake and medium,
† Received 7 June 2015; Accepted 4 August 2015 J-STAGE Advance published online 12 September 2015
1 No.151, Yingzhuan Rd., Tamsui Dist., New Taipei City 25137, Taiwan
* Corresponding author: Kuo-Jen Hwang; E-mail: [email protected] TEL: +886-2-2621-5656 ext.2726 FAX: +886-2-2620-9887

297
Kuo-Jen Hwang et al. / KONA Powder and Particle Journal No. 33 (2016) 296–303
respectively. According to this equation, the fluid viscos-ity is separated from cake filtration resistance. It implies that the cake properties are independent on the fluid flow behavior. The hypothesis is questionable because the par-ticle packing is possible to be affected by the drag force exerted on the particles. This point will be discussed in this study.
Although the particle size distribution is believed an important factor affecting cake properties, few research-ers devoted their efforts on the theoretical study of this is-sue. In this study, the effects of particle size distribution and fluid viscosity on the cake porosity and specific filtra-tion resistance in dead-end microfiltration were studied. The cake properties under various conditions were esti-mated using theoretical models and simulation method, and were compared with experimental data.
2. Estimation of cake properties
2.1 Models
2.1.1 Cake porosityMany models were derived for estimating the packing
density of binary particles in the past 30 years (German, R.M., 1989), in which to consider the cavern and displace-ment effects are the simplest models for random packing. Cavern effect is used for the condition that few small par-ticles are filled into the vacant space in a packed bed con-structed by large particles. The packing porosity can then be estimated by a material balance (German R.M., 1989)
L Lav
L
1
(2)
where ϕ is the volume fraction of particles, and the sub-script L represents large particles. Another effect is con-sidered that some small particles are replaced by few large particles in a packed bed constructed by most of small particles. The packing porosity in such a condition can also be estimated by a material balance (German R.M., 1989)
Sav
S L
111
(3)
where the subscripts S represent small particles. Because both cake porosity and particle volume fraction are smaller than 1, the cakes formed by dual-sized particles have smaller porosity than that by uniform-sized, and the difference becomes more obvious when the composition is far distant from uniform. The lowest porosity can then be given from the intersection point of the curves plotted using Eqs. (2) and (3), that is,
av s L (4)
2.1.2 Specific cake filtration resistanceAccording to Kozeny equation, the average specific
filtration resistance of cake can be estimated using the following equation:
2o av
av 3s av
1kS
(5)
where k is the Kozeny constant, and So is the specific sur-face area of particles. The theoretical Kozeny constant is 5.0 for a compact packed bed constructed by smooth spheres. For a random packing, the relationship between Kozeny constant and packing porosity can be derived theoretically using the free cell model (Happel J. and Brenner H., 1965) as:
3
2
2
21 111 ln
1 1 1
k
(6)
The mean particle diameter, dp,av for dual-sized particles can be calculated by the primary sizes and the volume fractions of particles, that is,
L S
p,av p,L p,S
1d d d
(7)
Because the specific surface area exactly equals 6/dp for a spherical particle, the value of So for a particle mixture can be estimated using the mean particle diameter as following:
op,av
6Sd
(8)
Once the variables in Eq.(5), such as k, So and εav, are known, the average specific filtration resistance of cake can be calculated.
Fig. 1 Forces exerted on a depositing particle in microfiltration.

298
Kuo-Jen Hwang et al. / KONA Powder and Particle Journal No. 33 (2016) 296–303
2.2 Numerical simulation
A numerical method for simulating the particle packing structure and cake porosity in dead-end filtration was proposed by Lu W.M. and Hwang K.J. (1993). It was modified to be used for the system of this study. Refer to Fig. 1, the external forces exerted on a depositing parti-cle, Particle A, include the drag force due to permeate flow, Fp, the net inter-particle force, Fi, and the net gravi-tational force, Fg. The drag force can be estimated using the modified Stokes law (Lu W.M. and Hwang K.J., 1993). The inter-particle force can be estimated using the DLVO theory based on a pair-wise assumption. According to this theory, the net inter-particle force is a summation of van der Waals force and electrostatic force (Hwang K.J. et al., 1997).
The Newton’s second law of motion is integrated to es-timate the velocity and the displacement of particle mi-gration during filtration. Particle migrations are simulated until they can deposit stably. The details can be referred to Lu W.M. and Hwang K.J. (1993, 1995).
3. Materials and methods
Two uniform-sized polymethyl methacrylate (PMMA) spherical particles with a density of 1210 kg/m3 were used in experiments. The particles were purchased from Soken Co., Japan. Their density was 1210 kg/m3, and their mean diameters were 0.45 μm (Ca.#: MP-1000) and 5.0 μm (Ca.#: MX-500), respectively. Their particle size distribu-tions were measured using a HORIBA LA-300 laser par-ticle size analyzer and are shown in Fig. 2. Propane-1,2,3-triol (glycerol) with a density of 1255 kg/m3 and purity of 99.5 % in volume was purchased from Fisher Scientific Co. in USA (Ca.#: G33-4). Different amounts of glycerol were added into de-ionized water to prepare aqueous
solutions with different viscosities. The fluid viscosity was measured using a viscometer (Brookfield LVDV-II CP, USA). The particle suspensions with a concentration of 3 kg/m3 were prepared by dispersing particles into those aqueous solutions under different particle mixing ratios. The particle size distributions were then adjusted by dif-ferent mixing ratios of the dual-sized particulate samples. The pH and temperature of the suspension were kept at 7.0 and 20 °C, respectively. The zeta potential of particles un-der such a condition was measured as –25 mV. A mem-brane manufactured by ADVANTEC Co. in Japan (Ca.#: A010A142C) was used in filtration as filter medium. The membrane was made of mixed cellulose ester, its mean pore size was 0.1 μm, and its filtration resistance was 2.26 × 10¹¹ m–1 under a filtration pressure of 2 × 10⁴ N/m2.
Dead-end microfiltration experiments were performed using a bomb filter shown in Fig. 3. The filtration area in the filter chamber was 8.04 × 10⁻⁴ m2. Suspension was prepared in the filter and prevented particle settling using a magnetic stirrer. The filter chamber was installed to orient to the filter wall, as shown in Fig. 3, to prevent the obstruction or destruction of cake formation by stirring. The filtration pressure was supplied by a compressed air, adjusted using a regulator, and indicated by a pressure gauge. The filtrate was received into a flask and weighed using a load cell. The data of filtrate weight was trans-ferred to volume and recorded on a personal computer during the whole course of filtration. An orifice plate was installed in the filter chamber to indicate the cake growth. When the growing cake surface reached the orifice plate, the filtration area decreased suddenly, and the tangent slope of the filtration curve of dt/dv vs. v increased drasti-cally. Therefore, the average cake porosity could be calcu-lated using the received filtrate volume based on a mass balance, and the average specific cake filtration resistance was determined by the tangent slope of the filtration curve before the sudden change.
Fig. 2 Size distributions of particles used in this study.
Fig. 3 Schematic diagram of the dead-end microfiltration system.

299
Kuo-Jen Hwang et al. / KONA Powder and Particle Journal No. 33 (2016) 296–303
4. Results and discussion
Fig. 4 shows the filtration curves of dt/dv versus v un-der various filtration pressures for uniform PMMA parti-cle with a mean size of 0.4 μm. The dispersion medium was de–ionized water with a viscosity of 1 × 10⁻³ Pa·s. The filtration curves have the same trend; each of them can be divided into two parts. The first part is a straight line. This implies that the average specific cake filtration resistance is constant during filtration. When the filter chamber is filled with cake, the received filtrate volume reaches vf, and the tangent slope of the filtration curve suddenly increases due to the decrease in filtration area. The average specific cake filtration resistance is then cal-culated by the slope of the straight line before the transi-tion point, as those shown in the figure. The average cake porosity can be obtained using the mass balance at the transition point because the cake volume is known. Com-paring the values of vf under various pressures, a smaller vf value under lower pressure indicates a higher cake po-rosity in such condition. Furthermore, because the value of dt/dv is the reciprocal of filtration flux, the curves shown in Fig. 4 also reveal that a lower filtration pressure results in a lower filtration flux.
Fig. 5 shows the comparisons of cake porosity among the experimental data, simulated results and model calcu-lated results under various large particle fractions and various filtration pressures. The dispersed medium was de-ionized water with a viscosity of 1 × 10⁻³ Pa·s. The values of cake porosity of dual-sized particles are lower than those of mono-sized under a given filtration pressure, and the lowest cake porosity occurs around the large par-ticle fraction ϕL = 0.75. When a few large particles exist in a small particle packing, some original packing positions of small particles are replaced by large particles, and the cake porosity due to this “displacement effect” can be es-timated using Eq. (3). The cake porosity decreases with
increasing the volume fraction of larger particles. On the other hand, when a small portion of small particles packs into a cake constructed by large particles, small particles may pack into the void space among large particles, and the cake porosity due to the “carven effect” can be esti-mated using Eq. (2). This effect causes the cake porosity decreases with increasing the fraction of small particles. The curves calculated using Eqs. (2) and (3) show that the lowest cake porosities occurring at εLεS where is the inter-section point of those two curves, i.e, Eq. (4). These re-sults agree qualitatively with the experimental data. However, the estimated results are always lower than experimental data, and obvious deviations between them can be found under moderate fractions of large (or small) particles. The maximum deviation is as high as 30 % occurring at the lowest cake porosity. This demonstrates that the models of cavern and displacement effects can be used properly only when a few different-sized particles are added into a cake formed by uniform-sized particles. Those models were originally used for estimating the ran-dom packing of particles under gravity. All particles have opportunities to migrate to reach stable positions. This is similar to the conditions under high filtration rates. How-ever, when filtration rate is not high enough, the deposit-ing particles may have no enough drag force to push them to form a compact cake. Thus, the packing porosity increases with decreasing filtration rate. This is therefore another reason why the deviation between the model esti-mations and experimental data becomes larger for a more compact cake. Furthermore, comparing the cake porosi-ties under various filtration pressures at a fixed volume fraction of large particles, an increase in filtration pres-sure leads to lower cake porosity. It is attributed to more
Fig. 4 Filtration curves of dt/dv vs. v under various filtration pressures.
Fig. 5 Comparisons of cake porosity among model estima-tions, simulated results, and experimental data for var-ious mixing fractions of large particles.

300
Kuo-Jen Hwang et al. / KONA Powder and Particle Journal No. 33 (2016) 296–303
severe cake compression under a higher pressure. Another method for cake porosity estimation is computer simula-tion. Although the simulation results are scattered, the trend of the simulated curve is much closer to that of experimental data. Comparing those estimations obtained by different methods, model estimation is more accurate for those particles near pure composition, while simula-tion method is more suitable for moderate composition of particle mixtures, especially for the compositions to result in the lowest cake porosity.
Fig. 6 shows the effects of small particle fraction, ϕS, and filtration pressure, ΔP, on the average specific cake filtration resistance, αav. The theoretical curves were cal-culated by substituting the calculated average cake poros-ity into Eq. (5), in which the values of Kozeny constant and specific surface area of particles were estimated using Eqs. (6)–(8), respectively. Comparing those factors affect-ing specific filtration resistance, specific surface area and particle size play the most important roles. The mean par-ticle size decreases from 5 to 1 μm as ϕS value increases from 0 to 0.3. However, there has only a 50 % decrease in the mean particle size when ϕS increases from 0.3 to 1.0. Therefore, the value of αav increases very rapidly with increasing ϕS when ϕS value is smaller than 0.3. The slight increase in cake porosity and decrease in mean particle size with ϕS cause the αav values to become nearly invari-ant when ϕS > 0.5. The calculated results agree with ex-perimental data except for the overestimations occurring around ϕS = 0.3. This is attributed to the marked underes-timations of cake porosity at that particle mixing fraction, as shown in Fig. 5.
The experimental data of average specific cake filtra-tion resistance are plotted against filtration pressure for different large particle fractions in logarithm scales in Fig. 7. The data can be regressed to a straight line for a given particle mixing fraction. This reveals that the rela-
tionship between αav and ΔP follows a power function proposed by Tiller et al. (1980). The αav value increases with increasing pressure and decreasing the fraction of large particles. The αav value of pure small particles is ca two order-of-magnitudes higher than that of pure large particles under a given pressure. This is because the αav value is proportional to the inverse square of particle size. According to the Tiller’s empirical equation, the slope of a curve represents the cake compressibility. Comparing the slopes of the curves shown in the figure, the cake compressibility is very low (around 0.07) for uni-form-sized particles and shows the highest value around 0.55 occurring at the fraction of large particles of 0.7. This result indicates that the cake compressibility is sensitive to particle size distribution and will be discussed in more detail later.
The viscosity of dispersed fluid was adjusted by adding different amounts of glycerol into de-ionized water. The aqueous solutions were measured as Newtonian fluids, and the values of viscosity were 10 and 5 × 10⁻³ Pa·s for
Fig. 6 Comparisons of average specific cake filtration resis-tance between calculated results and experimental data for various mixing fractions of small particles.
Fig. 7 Plots of αav versus ΔP under various mixing fractions of large particles.
Fig. 8 Effects of fluid viscosity and particle mixing fraction on the average cake porosity.
301
Kuo-Jen Hwang et al. / KONA Powder and Particle Journal No. 33 (2016) 296–303
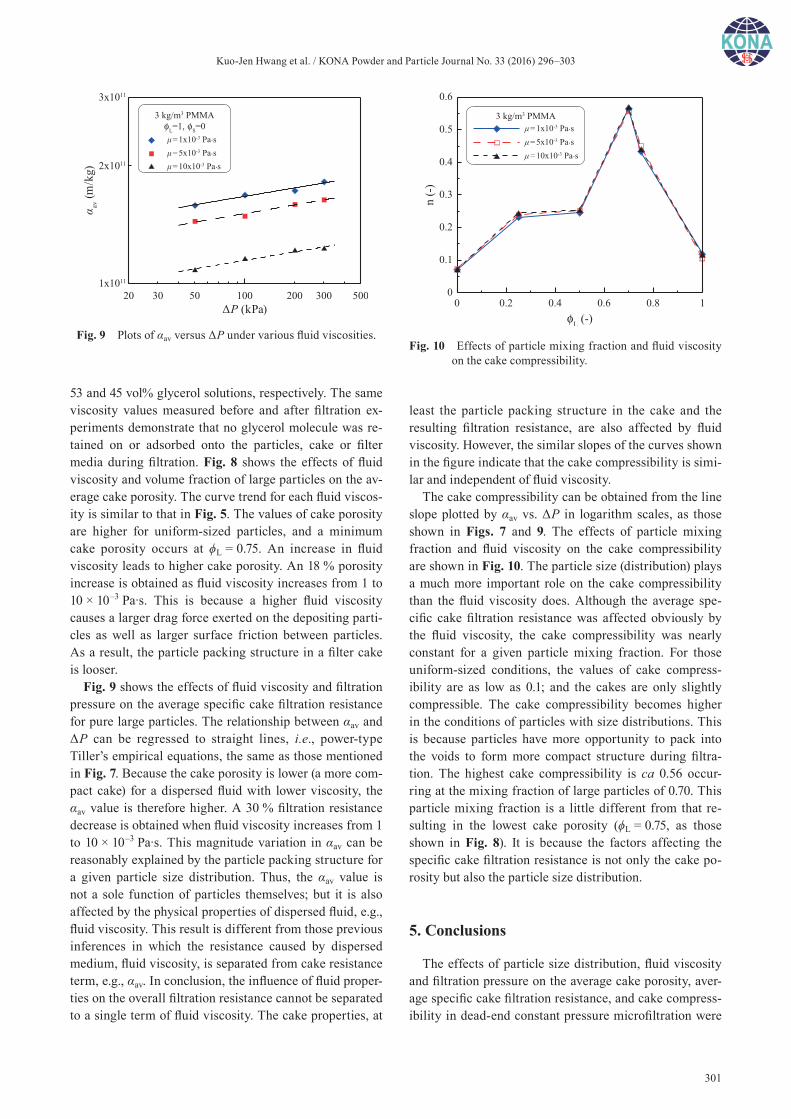
53 and 45 vol% glycerol solutions, respectively. The same viscosity values measured before and after filtration ex-periments demonstrate that no glycerol molecule was re-tained on or adsorbed onto the particles, cake or filter media during filtration. Fig. 8 shows the effects of fluid viscosity and volume fraction of large particles on the av-erage cake porosity. The curve trend for each fluid viscos-ity is similar to that in Fig. 5. The values of cake porosity are higher for uniform-sized particles, and a minimum cake porosity occurs at ϕL = 0.75. An increase in fluid viscosity leads to higher cake porosity. An 18 % porosity increase is obtained as fluid viscosity increases from 1 to 10 × 10–3 Pa·s. This is because a higher fluid viscosity causes a larger drag force exerted on the depositing parti-cles as well as larger surface friction between particles. As a result, the particle packing structure in a filter cake is looser.
Fig. 9 shows the effects of fluid viscosity and filtration pressure on the average specific cake filtration resistance for pure large particles. The relationship between αav and ΔP can be regressed to straight lines, i.e., power-type Tiller’s empirical equations, the same as those mentioned in Fig. 7. Because the cake porosity is lower (a more com-pact cake) for a dispersed fluid with lower viscosity, the αav value is therefore higher. A 30 % filtration resistance decrease is obtained when fluid viscosity increases from 1 to 10 × 10–3 Pa·s. This magnitude variation in αav can be reasonably explained by the particle packing structure for a given particle size distribution. Thus, the αav value is not a sole function of particles themselves; but it is also affected by the physical properties of dispersed fluid, e.g., fluid viscosity. This result is different from those previous inferences in which the resistance caused by dispersed medium, fluid viscosity, is separated from cake resistance term, e.g., αav. In conclusion, the influence of fluid proper-ties on the overall filtration resistance cannot be separated to a single term of fluid viscosity. The cake properties, at
least the particle packing structure in the cake and the resulting filtration resistance, are also affected by fluid viscosity. However, the similar slopes of the curves shown in the figure indicate that the cake compressibility is simi-lar and independent of fluid viscosity.
The cake compressibility can be obtained from the line slope plotted by αav vs. ΔP in logarithm scales, as those shown in Figs. 7 and 9. The effects of particle mixing fraction and fluid viscosity on the cake compressibility are shown in Fig. 10. The particle size (distribution) plays a much more important role on the cake compressibility than the fluid viscosity does. Although the average spe-cific cake filtration resistance was affected obviously by the fluid viscosity, the cake compressibility was nearly constant for a given particle mixing fraction. For those uniform-sized conditions, the values of cake compress-ibility are as low as 0.1; and the cakes are only slightly compressible. The cake compressibility becomes higher in the conditions of particles with size distributions. This is because particles have more opportunity to pack into the voids to form more compact structure during filtra-tion. The highest cake compressibility is ca 0.56 occur-ring at the mixing fraction of large particles of 0.70. This particle mixing fraction is a little different from that re-sulting in the lowest cake porosity (ϕL = 0.75, as those shown in Fig. 8). It is because the factors affecting the specific cake filtration resistance is not only the cake po-rosity but also the particle size distribution.
5. Conclusions
The effects of particle size distribution, fluid viscosity and filtration pressure on the average cake porosity, aver-age specific cake filtration resistance, and cake compress-ibility in dead-end constant pressure microfiltration were
Fig. 9 Plots of αav versus ΔP under various fluid viscosities.Fig. 10 Effects of particle mixing fraction and fluid viscosity
on the cake compressibility.

302
Kuo-Jen Hwang et al. / KONA Powder and Particle Journal No. 33 (2016) 296–303
studied. An increase in filtration pressure led to lower average cake porosity and higher specific cake filtration resistance. The effect of particle mixing fraction on the cake porosity was explained using packing models, such as cavern and displacement effects. The lowest cake po-rosity occurred under the volume fraction of large parti-cles of 0.75. Model estimation for cake porosity was more accurate for those particles near pure composition, while simulation method was more suitable for moderate com-position of particle mixtures, especially for the composi-tions resulting in the lowest cake porosity. The average specific cake filtration resistance increased with increas-ing the fraction of small particles, especially for low frac-tion of small particles. Furthermore, the cake properties were affected by fluid viscosity. The cake porosity in-creased but the average specific cake filtration resistance decreased with increasing fluid viscosity. An 18 % poros-ity increase and a 30 % filtration resistance decrease were obtained when f luid viscosity increases from 1 to 10 × 10–3 Pa·s. This was attributed to the larger surface friction causing by higher viscous flow. The cake proper-ties, such as the particle packing structure in the cake and the resulting filtration resistance, were indeed affected not only by particle size distribution but also by fluid viscos-ity. The particle size distribution played a much more important role on the cake compressibility than the fluid viscosity does, and the highest cake compressibility occurred approximately at the particle mixing fraction resulting in the lowest cake porosity.
Acknowledgements
The authors wish to express their sincere gratitude to the Ministry of Science and Technology of the Republic of China for its financial support (Grant number: MOST 103-2221-E-032-057-MY3).
Nomenclature
dp particle diameter (μm)
Fg net gravitational force (N)
Fi net inter-particle force (N)
Fp drag force due to permeate flow (N)
k Kozeny constant (–)
ΔP filtration pressure (Pa)
q filtration flux (m3/m2 s)
Rc filtration resistance of cake (m–1)
Rm filtration resistance of medium (m–1)
So specific surface area of particles (m2/m3)
t filtration time (s)
v filtrate volume per unit filtration area (m3/m2)
vf filtrate volume per unit filtration area at which the growing cake surface reached the orifice plate (m3/m2)
wc cake mass (kg/m2)
α specific filtration resistance of cake (m/kg)
ε cake porosity (–)
ϕ volume fraction of particles (–)
μ fluid viscosity (Pa·s)
Subscripts
av average cake property
L large particle
S small particle
References
German R.M., Particle Packing Characteristics, Chap. 6, Metal Powder Industries Federation, Princeton, New Jersey, USA, 1989.
Happel J., Brenner H., Low Reynolds Number Hydrodynamics, Englewood Cliffs, NJ, Prentice Hall, 1965.
Hwang K.J., Yu M.C., Lu W.M., Migration and deposition of submicron particles in crossflow microfiltration, Separation Science and Technology, 32 (1997) 2723–2747.
Hwang, K.J., Lin, K.P., Cross-Flow Microfiltration of dual-sized submicron particles, Separation Science and Technology, 37 (2002) 2231–2249.
Lu W.M., Hwang K.J., Mechanism of cake formation in con-stant pressure filtrations, Separation Technology, 3 (1993) 122–132.
Lu W.M., Hwang K.J., Cake formation in 2-D cross-flow filtra-tion, A.I.Ch.E. Journal, 41 (1995) 1443–1455.
Tiller F.M., Haynes S., Lu W.M., The role of porosity in filtration VII Effect of side-wall friction in compression-permeability cells, A.I.Ch.E. Journal, 18 (1972) 13–20.

303
Kuo-Jen Hwang et al. / KONA Powder and Particle Journal No. 33 (2016) 296–303
Author’s short biography
Kuo-Jen Hwang
Dr. Kuo-Jen Hwang is now a Professor at Tamkang University, Taiwan. After getting his PhD degree in National Taiwan University in 1992, he moved to the Department of Chemical Engineering at Tamkang University, as an Associate Professor. He became a full professor at Tamkang University in 1997. He was appointed as the Chairman of the Department of Chemical Engineering, Tamkang University from 1997 to 2001.
His research interests focus on solid-liquid separation and powder technology, espe-cially for microfiltration of fine and soft particles, and hydrocyclone for separation and classification of fine particles. He has published over 100 papers in peer reviewed jour-nals and 150 conference papers. He is also the Chairmen of the Taiwan Filtration and Separations Society and the International Delegates on Filtration since 2012.
Iou-Liang Lin
Mr. Iou-Liang Lin received his MS degree at the Department of Chemical and Materi-als Engineering, Tamkang University in 2009. He is a System Engineer in INNOLUX Corporation, Taiwan now.