effects of neutralization, decoloration, and deodorization
TRANSCRIPT

Research ArticleEffects of Neutralization, Decoloration, and Deodorization onPolycyclic Aromatic Hydrocarbons during Laboratory-Scale OilRefining Process
Yuxiang Ma, Longkai Shi, Yulan Liu, and Qiyu Lu
College of Food Science and Technology, Henan University of Technology, Zhengzhou 450001, China
Correspondence should be addressed to Qiyu Lu; [email protected]
Received 16 November 2016; Revised 13 February 2017; Accepted 9 April 2017; Published 28 May 2017
Academic Editor: Feng Xu
Copyright © 2017 Yuxiang Ma et al. This is an open access article distributed under the Creative Commons Attribution License,which permits unrestricted use, distribution, and reproduction in any medium, provided the original work is properly cited.
The influence of technological operations during oil refining process on polycyclic aromatic hydrocarbons (PAHs) in neutralized,bleached, and deodorized oils was investigated on the basis of laboratory-scale study. Under the best experimental conditions,benzo[a]pyrene decreased by 85.1%, 99.7%, and 40.8% in neutralized, bleached, and deodorized oils, respectively. Total of 16 analytesdecreased by 55.7%, 87.5%, and 47.7%, respectively. Bleaching with activated charcoal was the most efficient procedure to reducePAHs in crude oil. Neutralization had a modest influence on sixteen analytes; however, deodorization was only responsible for aslight decrease in the light PAHs and heavy PAHs contents. Data obtained in this study suggest that the use of activated carbonduring oil refining process is highly recommended; moreover, these results provide a useful guidance for oil refining plant to reducesecurity risk and ensure the quality of the vegetable oil products.
1. Introduction
Edible vegetable oils consist of a complex mixture of glyc-erides (mainly triacylglycerols and partially diacylglycerolsand monoacylglycerols), hydrocarbons, alcohols, phospho-lipids, free fatty acids, pigments, sterols, tocopherols, andvolatile compounds, and so on [1, 2]. Usually, oil refiningprocess is done to eliminate the unwanted minor compo-nents, whichmake oils not suitable for sale and consumption.Furthermore, the purification process is trying to reducepossible damage to the neutral oil as well asminimize refiningloss [3, 4]. All compounds, which are detrimental to flavour,color, stability, and safety of the refined final oil productswill be removed. They are primarily phospholipids, free fattyacids, pigments, trace metals, volatiles, persistent organicpollutants (POPs), and other impurities [1, 5].
Among various POPs, polycyclic aromatic hydrocarbons(PAHs) are a class of ubiquitous chemical contaminationsin vegetable oils. Academically, they are divided into twoparts, light PAHs (LPAHs, up to four fused rings) and heavyPAHs (HPAHs, more than four fused rings). The persistent
nature of PAHs related to their great chemical stability leadsto their significant accumulation in the food chain; moreover,their high liposolubility results in their occurrence in oilsand fatty foods, particularly in edible oils. In 2005, Chinahas set a limit of 10 𝜇g/kg for benzo[a]pyrene (BaP) in ediblevegetable oils for the sake of dietary safety associated withoil consumption [6]. Meanwhile, Commission RegulationNumber 835/2011 legislated the maximum levels for PAHsin fats and oils for direct human consumption or ingredientfor food products [7]. It established 2𝜇g/kg for BaP and10 𝜇g/kg for summed four PAHs (called PAH
4, includ-
ing BaP, benzo[b]fluoranthene (BbFlu), benz[a]anthracene(BaA), and chrysene (Chr)) as the most suitable indicator ofPAHs in foodstuffs. However, no countries or organizationsworldwide have set the regulations and limits for the contentof total PAHs in commercial oils, partly due to the fact thatthere are hundreds of these sorts of pollutants in the world,thus resulting in difficulty in separation, determination, andcalculation. Previously, we developed and validated a liq-uid chromatography-atmospheric pressure photoionization-tandem mass spectrometry method for analyzing United
HindawiJournal of ChemistryVolume 2017, Article ID 7824761, 9 pageshttps://doi.org/10.1155/2017/7824761
2 Journal of Chemistry
States Environmental Protection Agency (EPA) 16 PAHs inedible oils [8], and the occurrence as well as concentration of16 analytes in eighty-five brands of vegetable oils in Chinawasdetected and statistically analyzed [9]. Now, investigationson technologies for the removal of PAHs from edible oilsreach considerable importance for reducing health risks toconsumers and the efficiency related to PAHs reduction isstill questioned due to the fact that available informationregarding specific process conditions is limited.
Normally, the amount of PAHs in crude vegetable oilscan be eliminated during oil refining process, thus gener-ating low levels of contamination in the final oil productscompared to in the crude ones [10]. In China, conventionaloil refining process consists of four steps (i.e., degumming,neutralization, decoloration, and deodorization), and the lastthree procedures were reported with good removing effecton PAHs in edible vegetable oils [10–14]. Neutralization,also known as alkali refining, is used to eliminate free fattyacids that can promote lipid oxidation by forming soapstock.Adsorbents, such as activated clay and activated carbon,can be used to remove oil-solubility pigments (e.g., caroteneand chlorophyll), metals, and oxidation products as wellas remaining phospholipids and soaps, and this procedureis defined as decoloration or bleaching. Deodorization, orsometimes called steam distillation, removes volatile compo-nents and small molecular decomposed peroxides at elevatedtemperature under vacuum to improve flavour quality, shelflife, and stability of the final oil products.
The aim of this study is to investigate the effects ofthree main steps, namely, neutralization, decoloration, anddeodorization, on PAHs in crude vegetable oils, to examinethe respective influence of parameters employed on theirefficiencies in reducing of PAHs, and to characterize thedistribution and evaluate the behaviour of PAHs during thewhole technological procedure adopted.This is a comprehen-sive effort to report on the levels of selected PAHs measuredin different stages of the oil refining.Meanwhile, the inclusionof multiple PAHs provides a full-scale representation of theentire group of pollutants in edible oils during the refiningprocess.
2. Materials and Methods
2.1. Materials and Chemicals. Mixture of EPA 16 PAHs wasprovided by O2si (Charleston, South Carolina, USA) withthe concentration of 200𝜇g/mL (dissolved in acetonitrile);the full names and abbreviations of 16 analytes related tothis study are shown in Table 1. Sixteen correspondingisotopical analogues were obtained from Dr. EhrenstorferGmbH (Augsburg, Germany) and C/D/N Isotopes (Pointe-Claire, Quebec, Canada). Purities of individual standardcomponents were guaranteed to be above 97.9%.
Acetonitrile and toluene (HPLC grade) were purchasedfrom Sigma (St. Louis, MO, USA). Deionized water wasobtained from a Millipore Milli-Q water purification system(Billerica, MA, USA). Degummed peanut oil sample witha high contamination level of PAHs, which was used forneutralization, bleaching, and deodorization, was prepared
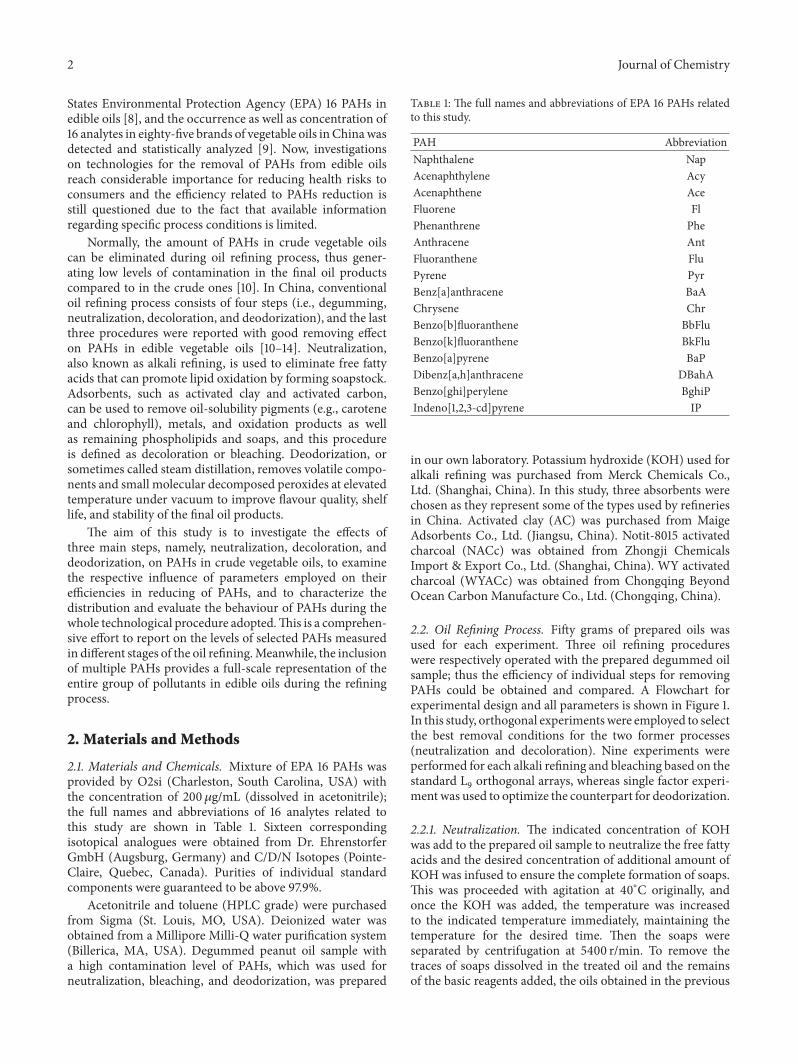
Table 1: The full names and abbreviations of EPA 16 PAHs relatedto this study.
PAH AbbreviationNaphthalene NapAcenaphthylene AcyAcenaphthene AceFluorene FlPhenanthrene PheAnthracene AntFluoranthene FluPyrene PyrBenz[a]anthracene BaAChrysene ChrBenzo[b]fluoranthene BbFluBenzo[k]fluoranthene BkFluBenzo[a]pyrene BaPDibenz[a,h]anthracene DBahABenzo[ghi]perylene BghiPIndeno[1,2,3-cd]pyrene IP
in our own laboratory. Potassium hydroxide (KOH) used foralkali refining was purchased from Merck Chemicals Co.,Ltd. (Shanghai, China). In this study, three absorbents werechosen as they represent some of the types used by refineriesin China. Activated clay (AC) was purchased from MaigeAdsorbents Co., Ltd. (Jiangsu, China). Notit-8015 activatedcharcoal (NACc) was obtained from Zhongji ChemicalsImport & Export Co., Ltd. (Shanghai, China). WY activatedcharcoal (WYACc) was obtained from Chongqing BeyondOcean Carbon Manufacture Co., Ltd. (Chongqing, China).
2.2. Oil Refining Process. Fifty grams of prepared oils wasused for each experiment. Three oil refining procedureswere respectively operated with the prepared degummed oilsample; thus the efficiency of individual steps for removingPAHs could be obtained and compared. A Flowchart forexperimental design and all parameters is shown in Figure 1.In this study, orthogonal experimentswere employed to selectthe best removal conditions for the two former processes(neutralization and decoloration). Nine experiments wereperformed for each alkali refining and bleaching based on thestandard L
9orthogonal arrays, whereas single factor experi-
ment was used to optimize the counterpart for deodorization.
2.2.1. Neutralization. The indicated concentration of KOHwas add to the prepared oil sample to neutralize the free fattyacids and the desired concentration of additional amount ofKOH was infused to ensure the complete formation of soaps.This was proceeded with agitation at 40∘C originally, andonce the KOH was added, the temperature was increasedto the indicated temperature immediately, maintaining thetemperature for the desired time. Then the soaps wereseparated by centrifugation at 5400 r/min. To remove thetraces of soaps dissolved in the treated oil and the remainsof the basic reagents added, the oils obtained in the previous

Journal of Chemistry 3
Neutralization DeodorizationDecoloration
Degummed peanut oil sample
Laboratory-scale oilrefining process
Alkali solution concentration:5.1%, 6.6%, 8.1%
Additional alkali content:0.2%, 0.4%, 0.6%;
Temperature:
Time:
Temperature:
Time:
AC additive amount:2%, 3%, 4%, 5%
NACc additive amount:0.05%, 0.10%, 0.15%, 0.20%
WYACc additive amount:0.2%, 0.5%, 1%, 2%
Temperature:
Time:
20, 30, 40min
60, 80, 100, 120min25min
60, 70, 80∘C
100∘C 210, 230, 250, 270∘C
Figure 1: Flowchart for experimental design and all parameters.
stages were washed with three successive additions of 10%of 95∘C pure water. Then removing the washing water bycentrifuging and the neutralized oil was obtained.
2.2.2. Decoloration. Theremoval of PAHs by the oil bleachingprocedure was compared using three commercial sorbents:AC, NACc, and WYACc. According to the actual amountof these three kinds of processing agents used in the oilrefinery, the proportions of AC, NACc, and WYACc wereoptimized and set between 2 and 4%, 0.05 and 0.2%, and0.2 and 2%, respectively. Vacuum bleaching was performedin 30–35mbar by using a vacuum pump and the treatmentprocess was as follows: the adopted adsorbent was add tothe prepared oil sample, and the mixture was maintained byagitation for the desired time at the indicated temperature ina vacuum atmosphere. Then the adsorbents were separatedby centrifugation at 5400 r/min, and the bleached oil wasobtained.
2.2.3. Deodorization. Thedeodorizationwas accomplished atthe indicated temperature and 80 Pa with the use of directstream (20 kg/T⋅h) in order to remove volatile compoundsand thermolabile pigments. Under the high temperature andhigh vacuum conditions, tested oil was maintained for thedesired time and then cooled down to ambient temperatureand the deodorized oil was obtained.
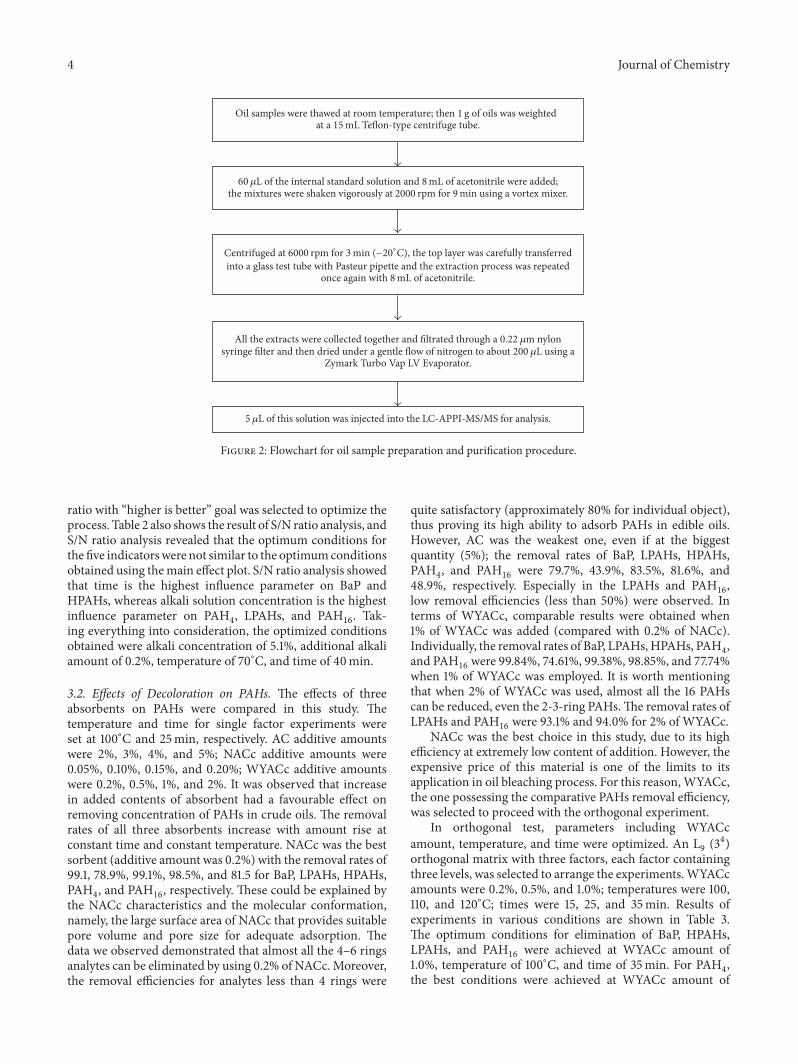
2.3. Oil PAHs Determination and Analytical Conditions. OilPAHs determination scheme and analytical means weredescribed in detail in a previous published paper [8]; all ofthe oil samples were prepared and determined in triplicate. Aflowchart describing the sample preparation and purificationprocedure is provided in Figure 2. Ion pairs of 16 analytes andtheir analogous are given in Table S1 (Supplementary Mate-rial, available online at https://doi.org/10.1155/2017/7824761);data of the method validation are provided in Tables S2 andS3. Briefly, the calibration curves of each analyte showed a
linear response with correlation coefficients between 0.9992and 0.9999. The recoveries of 16 analytes at three spikinglevels were ranging from 77.8 to 106.4%, and the relativestandard deviations were lower than 10%. The limits ofquantitation for 16 PAHswere in the range of 0.02–0.43𝜇g/kg.Table S4 shows the LC conditions and all of the requiredinstrumental parameters. Data analysis was performed usingOrigin 8.0 and Microsoft Office Excel 2015.
3. Results and Discussion
3.1. Effects of Neutralization on PAHs. As it is known,parameters (alkali concentration, amount of additional alkali,temperature, and time) of the alkali refining process havea significant impact on the quantity and composition ofthe neutralized oil. An L
9(34) orthogonal matrix with four
factors, each factor containing three levels, was selected toarrange the experiments. Alkali solution concentrations were5.1%, 6.6%, and 8.1%; additional alkali contents were 0.2%,0.4%, and 0.6%; temperatures were 60, 70, and 80∘C; timeswere 20, 30, and 40min. The levels for each parametervariables were selected from a series of preliminary trialswithout using particular experimental designs (data were notshown).
Results of experiments in various conditions are dis-played in Table 2. Optimum condition of each parameter wasshown as the highest value of the removal rate. The optimumconditions for elimination of BaP, LPAHs, and PAH
16were
achieved at alkali concentration of 5.1%, additional alkaliamount of 0.6%, temperature of 80∘C, and time of 40min. ForHPAHs, the best results were achieved at alkali concentrationof 6.6%, additional alkali amount of 0.6%, temperature of70∘C, and time of 20min. And for PAH
4, the best conditions
were alkali concentration of 5.1%, additional alkali amount of0.4%, temperature of 70∘C, and time of 30min. In additionto the main effect, the signal-to-noise (S/N) ratio analysiswas used to evaluate the quality of the results obtained. S/N
4 Journal of Chemistry
Oil samples were thawed at room temperature; then 1 g of oils was weightedat a 15 mL Teflon-type centrifuge tube.
60 �휇L of the internal standard solution and 8mL of acetonitrile were added;the mixtures were shaken vigorously at 2000 rpm for 9min using a vortex mixer.
into a glass test tube with Pasteur pipette and the extraction process was repeatedonce again with 8mL of acetonitrile.
Centrifuged at 6000 rpm for 3min (−20∘C), the top layer was carefully transferred
Zymark Turbo Vap LV Evaporator.
All the extracts were collected together and filtrated through a 0.22 �휇m nylonsyringe filter and then dried under a gentle flow of nitrogen to about 200 �휇L using a
5 �휇L of this solution was injected into the LC-APPI-MS/MS for analysis.
Figure 2: Flowchart for oil sample preparation and purification procedure.
ratio with “higher is better” goal was selected to optimize theprocess. Table 2 also shows the result of S/N ratio analysis, andS/N ratio analysis revealed that the optimum conditions forthe five indicatorswere not similar to the optimumconditionsobtained using themain effect plot. S/N ratio analysis showedthat time is the highest influence parameter on BaP andHPAHs, whereas alkali solution concentration is the highestinfluence parameter on PAH
4, LPAHs, and PAH
16. Tak-
ing everything into consideration, the optimized conditionsobtained were alkali concentration of 5.1%, additional alkaliamount of 0.2%, temperature of 70∘C, and time of 40min.
3.2. Effects of Decoloration on PAHs. The effects of threeabsorbents on PAHs were compared in this study. Thetemperature and time for single factor experiments wereset at 100∘C and 25min, respectively. AC additive amountswere 2%, 3%, 4%, and 5%; NACc additive amounts were0.05%, 0.10%, 0.15%, and 0.20%; WYACc additive amountswere 0.2%, 0.5%, 1%, and 2%. It was observed that increasein added contents of absorbent had a favourable effect onremoving concentration of PAHs in crude oils. The removalrates of all three absorbents increase with amount rise atconstant time and constant temperature. NACc was the bestsorbent (additive amount was 0.2%) with the removal rates of99.1, 78.9%, 99.1%, 98.5%, and 81.5 for BaP, LPAHs, HPAHs,PAH4, and PAH
16, respectively. These could be explained by
the NACc characteristics and the molecular conformation,namely, the large surface area of NACc that provides suitablepore volume and pore size for adequate adsorption. Thedata we observed demonstrated that almost all the 4–6 ringsanalytes can be eliminated by using 0.2% of NACc.Moreover,the removal efficiencies for analytes less than 4 rings were
quite satisfactory (approximately 80% for individual object),thus proving its high ability to adsorb PAHs in edible oils.However, AC was the weakest one, even if at the biggestquantity (5%); the removal rates of BaP, LPAHs, HPAHs,PAH4, and PAH
16were 79.7%, 43.9%, 83.5%, 81.6%, and
48.9%, respectively. Especially in the LPAHs and PAH16,
low removal efficiencies (less than 50%) were observed. Interms of WYACc, comparable results were obtained when1% of WYACc was added (compared with 0.2% of NACc).Individually, the removal rates of BaP, LPAHs,HPAHs, PAH
4,
and PAH16were 99.84%, 74.61%, 99.38%, 98.85%, and 77.74%
when 1% of WYACc was employed. It is worth mentioningthat when 2% of WYACc was used, almost all the 16 PAHscan be reduced, even the 2-3-ring PAHs.The removal rates ofLPAHs and PAH
16were 93.1% and 94.0% for 2% of WYACc.
NACc was the best choice in this study, due to its highefficiency at extremely low content of addition. However, theexpensive price of this material is one of the limits to itsapplication in oil bleaching process. For this reason,WYACc,the one possessing the comparative PAHs removal efficiency,was selected to proceed with the orthogonal experiment.
In orthogonal test, parameters including WYACcamount, temperature, and time were optimized. An L
9(34)
orthogonal matrix with three factors, each factor containingthree levels, was selected to arrange the experiments.WYACcamounts were 0.2%, 0.5%, and 1.0%; temperatures were 100,110, and 120∘C; times were 15, 25, and 35min. Results ofexperiments in various conditions are shown in Table 3.The optimum conditions for elimination of BaP, HPAHs,LPAHs, and PAH
16were achieved at WYACc amount of
1.0%, temperature of 100∘C, and time of 35min. For PAH4,
the best conditions were achieved at WYACc amount of

Journal of Chemistry 5
Table 2: Results of neutralization on PAHs.
Run Parameter Removal rate (%)Alkali concentration (%) Temperature (∘C) Additional alkali (%) Time (min) BaP HPAHsa PAH
4
b LPAHsc PAH16
1 5.1 60 0.2 20 67.9 47.5 42.6 53.6 52.82 5.1 70 0.4 30 64.2 43.3 47.2 52.7 51.53 5.1 80 0.6 40 80.4 43.4 40.1 56.9 55.24 6.6 60 0.4 40 80.3 41.7 38.7 48.4 47.65 6.6 70 0.6 20 77.1 47.8 40.7 50.4 50.06 6.6 80 0.2 30 75.4 45.2 42.0 50.0 49.47 8.1 60 0.6 30 38.8 33.6 30.3 40.7 39.88 8.1 70 0.2 40 77.1 44.8 39.8 55.1 53.89 8.1 80 0.4 20 71.3 41.8 37.8 48.4 47.6
Item Level Alkali concentration (%) Temperature (∘C) Additional alkali (%) Time (min)
BaP
1 70.8 62.4 73.5 72.12 77.6 72.8 72.0 59.53 62.4 75.7 65.4 79.3Δ 15.2 13.3 8.1 19.8
Rank 2 3 4 1
HPAHsa
1 44.7 40.9 45.8 45.72 44.9 45.3 42.3 40.73 40.1 43.5 41.6 43.3Δ 4.8 4.4 4.2 5
Rank 2 3 4 1
PAH4
b
1 43.3 37.2 41.5 40.42 40.5 42.6 41.2 39.83 36.0 40.0 37.0 39.5Δ 7.3 5.4 4.5 0.9
Rank 1 2 3 4
LPAHsc
1 54.4 47.6 52.9 50.82 49.6 52.7 49.8 47.83 48.1 51.8 49.3 53.5Δ 6.3 5.1 3.6 5.7
Rank 1 3 4 2
PAH16
1 53.2 46.7 52.0 50.12 49.0 51.8 48.9 46.93 47.1 50.7 48.3 52.2Δ 6.1 5.1 3.7 5.3
Rank 1 3 4 2aHPAHs, including BbFlu, BkFlu, BaP, DBahA, BghiP, and IP; bPAH4, including BaA, Chr, BbFlu, and BaP; cLPAHs, including Nap, Acy, Ace, Fl, Phe, Ant,Flu, Pyr, BaA, and Chr.
1.0%, temperature of 120∘C, and time of 25min (see Table 3).S/N ratio analysis revealed that the optimum conditions forthe five indicators were similar to the optimum conditionsobtained by using the main effect plot. S/N ratio analysisshowed that WYACc amount is the highest influenceparameter on all the five indicators, whereas temperatureis the lowest influence parameter. Taking everything intoconsideration, the optimized conditions chosen wereWYACc amount of 1.0%, temperature of 110∘C, and time of35min.
3.3. Effects of Deodorization on PAHs. Steam distillation ofprepared oil sample was accomplished using the single factor
experiment. temperature and time were tested; temperatureswere 210, 230, 250, and 270∘C and times were 60, 80, 100,and 120min. To study the effect of time on the deodorizationefficiency, the related test was performed at different timesranging from 60 to 120min; similarly, to study the effect oftemperature on the deodorization efficiency, the related testwas performed at different temperatures ranging from 210 to270∘C. Figures 3 and 4 show the effects of deodorization timeand temperature on BaP and PAH
16, respectively. Increase
in temperature had a favourable effect on removal of BaPat short time of operation (60min), both at 210 and 230∘C.Independently of the temperature conditions, longer timeof deodorization had a more positive effect on the amount

6 Journal of Chemistry
Table 3: Results of decoloration on PAHs.
Run Parameter Removal rate (%)Absorbent amount (%) Temperature (∘C) Time (min) BaP HPAHsa PAH
4
b LPAHsc PAH16
1 0.2 100 15 66.5 67.9 60.3 11.5 18.62 0.2 110 25 78.3 77.0 65.8 20.8 27.93 0.2 120 35 87.9 87.6 80.4 17.2 26.14 0.5 100 25 96.6 96.1 92.9 54.8 60.05 0.5 110 35 97.8 96.9 94.9 56.2 61.36 0.5 120 15 84.3 78.1 76.0 42.3 46.87 1.0 100 35 99.7 99.1 97.7 80.7 83.08 1.0 110 15 98.8 97.6 97.0 74.8 77.79 1.0 120 25 98.9 98.4 97.8 74.9 77.9
Item Level Absorbent amount (%) Temperature (∘C) Time (min)
BaP
1 77.6 87.6 83.22 92.9 91.6 91.33 99.1 90.4 95.1Δ 21.5 4.0 11.9
Rank 1 3 2
HPAHsa
1 68.8 83.6 77.82 87.9 85.9 85.53 97.5 84.7 91.0Δ 28.7 2.3 13.2
Rank 1 3 2
PAH4
b
1 77.5 87.7 81.22 90.4 90.5 90.53 98.4 88.1 94.6Δ 20.9 2.8 13.4
Rank 1 3 2
LPAHsc
1 16.5 49.0 42.92 51.1 50.6 50.23 76.8 44.8 51.4Δ 60.3 5.8 8.5
Rank 1 3 2
PAH16
1 24.2 53.9 47.72 56.1 55.6 55.33 79.5 50.3 56.8Δ 55.3 5.3 9.1
Rank 1 3 2aHPAHs, including BbFlu, BkFlu, BaP, DBahA, BghiP, and IP; bPAH4, including BaA, Chr, BbFlu, and BaP; cLPAHs, including Nap, Acy, Ace, Fl, Phe, Ant,Flu, Pyr, BaA, and Chr.
of PAHs removed, and vice versa. The residue amounts ofBaP, LPAHs, HPAHs, PAH
4, and PAH
16in the deodorized oil
decrease with temperature and time increase. The optimumresults were achieved at temperature of 270∘C and time of120min, and the removal rates obtained were 40.8%, 48.4%,42.7%, 42.2%, and 47.7%.
3.4. Comparison of Effects of Three Refining Stages on PAHs.Optimum conditions obtained above frommeans calculationand orthogonal method must be evaluated through realexperiment to check the accuracy of proposed optimumcondition. Confirmation experiments (for neutralization and
decoloration processes) were individually performed usingthe proposed optimum conditions from the orthogonalexperiments. Concentrations of individual PAHs as well asLPAHs, HPAHs, PAH
4, and PAH
16in crude oil and each step
of the oil refining process are presented in Table 4. All theanalyses were carried out in triplicate and the experimentalresults obtained were expressed as means ± SD.
The amounts of BaP, PAH4, and PAH
16in crude oil
were 24.00 ± 1.51, 129.20 ± 8.11, and 763.94 ± 16.97 𝜇g/kg,respectively. Meanwhile, LPAHs and HPAHs were 667.44 ±15.96 and 96.50 ± 7.34 𝜇g/kg, respectively. Individual levels ofPAHs ranged from 2.84± 0.16 to 212.74± 8.66 𝜇g/kg, showing

Journal of Chemistry 7
Table 4: PAHs content (mean ± SD (𝑛 = 3)) in crude oil and each step of the oil refining process.
PAH Mean ± SD (𝑛 = 3)Crude oil Neutralized oil Bleached oil Deodorized oil
Nap 34.20 ± 2.28 10.75 ± 0.78 3.17 ± 1.32 4.25 ± 0.63Acy 5.20 ± 0.45 2.74 ± 0.14 1.06 ± 0.01 1.38 ± 0.05Ace 22.38 ± 1.95 4.80 ± 0.52 5.80 ± 0.28 3.61 ± 0.11Fl 67.85 ± 5.35 44.40 ± 2.22 11.05 ± 1.00 19.61 ± 1.28Phe 212.74 ± 8.66 47.73 ± 2.39 44.00 ± 2.54 134.40 ± 3.32Ant 41.67 ± 2.56 27.00 ± 1.42 4.62 ± 0.05 18.11 ± 1.22Flu 135.80 ± 9.01 64.60 ± 4.03 14.48 ± 0.63 77.88 ± 6.00Pyr 71.60 ± 5.48 39.60 ± 2.58 9.52 ± 0.11 40.95 ± 2.33BaA 38.80 ± 2.22 24.11 ± 0.98 0.54 ± 0.01 22.19 ± 0.98Chr 37.20 ± 2.63 22.60 ± 0.82 0.87 ± 0.01 22.09 ± 1.36BbFlu 29.20 ± 1.98 23.10 ± 1.13 0.27 ± 0.01 16.15 ± 1.11BkFlu 12.36 ± 0.63 4.24 ± 0.51 0.16 ± 0.01 7.10 ± 0.58BaP 24.00 ± 1.51 3.58 ± 0.37 0.06 ± 0.01 14.21 ± 1.08DBahA 2.84 ± 0.16 0.69 ± 0.01 0.05 ± 0.01 1.09 ± 0.02BghiP 14.10 ± 1.13 9.91 ± 1.28 0.12 ± 0.01 8.06 ± 0.05IP 14.00 ± 1.18 8.56 ± 0.80 0.03 ± 0.00 8.74 ± 1.08LPAHsa 667.44 ± 15.96 288.33 ± 7.28 95.11 ± 3.33 344.46 ± 8.57HPAHsb 96.50 ± 7.34 50.08 ± 3.00 0.69 ± 0.02 55.34 ± 2.22PAH4
c 129.20 ± 8.11 73.39 ± 4.82 1.74 ± 0.01 74.64 ± 2.54PAH16
763.94 ± 16.97 338.41 ± 7.54 95.80 ± 4.51 399.8 ± 9.22aLPAHs, including Nap, Acy, Ace, Fl, Phe, Ant, Flu, Pyr, BaA, and Chr; bHPAHs, including BbFlu, BkFlu, BaP, DBahA, BghiP, and IP; cPAH4, including BaA,Chr, BbFlu, and BaP.
210∘C230∘C
250∘C270∘C
60 80Initial value 120100Time (min)
12
14
16
18
20
22
24
BaP
conc
entr
atio
n (�휇
g/kg
)
Figure 3: Effect of deodorization on BaP.
a broad range of PAHs concentrations in crude vegetable oil.Phe, Flu, and Pyr were the three kinds of compounds with thehighest concentrations; levels of 3 analytes were 212.74 ± 8.66,135.80± 9.01, and 71.60± 5.48 𝜇g/kg, respectively. DBahAwasthe lowest one oppositely, with the concentration of 2.84 ±0.16 𝜇g/kg.
210∘C230∘C
250∘C270∘C
Initial value 1008060 120Time (min)
400
500
600
700
800
PAH
16
conc
entr
atio
n (�휇
g/kg
)
Figure 4: Effect of deodorization on PAH16.
Determination of other intermediary oils (neutralized,bleached, and deodorized oils) revealed that all analytesshowed reduction in their levels (see Table 4). Percent reduc-tions of intermediary oils were relative to the initial crudeoil levels. As a whole, bleaching with WYACc was the mostefficient means to eliminate PAHs in crude oil, while stream

8 Journal of Chemistry
distillation was the worst. BaP contents decreased by 85.1%,99.7%, and 40.8% in neutralized, bleached, and deodorizedoils, respectively. Similarly, PAH
4contents diminished by
43.2%, 98.7%, and 42.2%, respectively, and PAH16
contentsdecreased by 55.7%, 87.5%, and 47.7%, respectively. Previousliteratures reported the decrease of PAHs during oil refiningprocess was 27%–82% [11], 82%–84% [12], and 72%–87% [14],and all the oil samples (crude, neutralized, bleached, anddeodorized oils) were sampled in the vegetable oil refinery.The differences among technological parameters used in theoil refining process, and the situations of samples or thelaboratory conditions in refined process, may result in thesmall variances among the data obtained by this study andother authors.
A decrease of PAHs amounts is clearly observed fromboth of the LPAHs andHPAHs, in higher or lower percentage,independent of the treatments adopted. Neutralization and,chiefly, decoloration with WYACc were the more effectivesteps contributing to the LPAHs decrease, with the removalrates being 56.8% and 85.8%, respectively. For HPAHs,decoloration was the best, with the removal rate of 99.3%.Meanwhile, neutralization was also involved in the reductionof the 5-6 rings analytes, with the HPAHs contents dimin-ished by 48.1%. However, deodorization was only responsiblefor a slight decrease in the LPAHs and HPAHs contents,with the removal rates being 48.4% and 42.7%, respectively.In comparison, other results published previously showeda more modest reduction in the HPAHs content during oilrefining process: 41% [11] and 22% [12]. Meanwhile, activatedcarbon was not used in any of these studies. The differencesof removal rates of LPAHs during deodorization reported bythis study (48.4%) and by Cejpek et al. [11] and Larsson et al.[12] (varied between 57% and 92%)may be resulting from thediscrepancy of operating conditions applied. Because LPAHswere in greater abundance than HPAHs in tested oil samples,the former had a higher relative contribution to the summedtotal PAHs. Thus, the PAH
16profile and removal behaviour
observed in this study were similar to LPAHs (see Table 4).
4. Conclusion
Effects of neutralization, decoloration, and deodorization onPAHs during oil refining process were investigated in thisstudy.The results of the experiment showed that the optimumconditions of neutralizationwere alkali concentration of 5.1%,additional alkali amount of 0.2%, temperature of 70∘C, andtime of 40min. The optimum conditions of decolorationwere WYACc amount of 1.0%, temperature of 110∘C, andtime of 35min and the optimum conditions of deodorizationwere temperature of 270∘C and time of 120min. An evidentdecrease of PAHs contents during oil refining process wasobserved, and bleaching with activated charcoal was thebest to reduce PAHs in crude oil. Under the optimumexperimental conditions, BaP contents decreased by 85.1%,99.7%, and 40.8% in neutralized, bleached, and deodorizedoils, respectively. PAH
4contents diminished by 43.2%, 98.7%,
and 42.2%, respectively, and PAH16
contents decreased by55.7%, 87.5%, and 47.7%, respectively. Bleaching withWYACc
was the most efficient method in the comparison study toabsorb PAHs in crude oil, while stream distillation was theworst. Neutralization had a modest influence on 16 analytes,with the removal rate of 55.7%. However, deodorization wasonly responsible for a slight decrease in the LPAHs andHPAHs contents (removal rateswere 48.4% and 42.7%, resp.).It is worth mentioning that the high efficiency of activatedcharcoal indicates that the use of this material to eliminatePAHs during oil refining process is highly recommended.
Conflicts of Interest
No conflicts of interest exist in the submission of thismanuscript, and themanuscript is approved by all authors forpublication.
Acknowledgments
This work was supported by the Research Fund of National13th Five-Year Plan of China (2016YFD0401405-2) and theearmarked fund for Modern Agro-industry TechnologyResearch System (CARS15-1-10). Longkai Shi and Yulan Liumust thank Hongwei Hou from China National TobaccoQuality Supervision & Test Center (Zhengzhou, China) forproviding the LC-APPI-MS/MS system.
References
[1] S. Chumsantea, K. Aryusuk, S. Lilitchan, N. Jeyashoke, and K.Krisnangkura, “Reducing oil losses in alkali refining,” Journal ofthe American Oil Chemists’ Society, vol. 89, no. 10, pp. 1913–1919,2012.
[2] M. V. Ruiz-Mendez, “Contribution of denaturing and deodor-ization processes of oils to toxic oil syndrome,” Chemico-Biological Interactions, vol. 192, no. 1-2, pp. 142–144, 2011.
[3] J. Ortega-Garcıa, N. Gamez-Meza, J. A. Noriega-Rodriguez etal., “Refining of high oleic safflower oil: effect on the sterols andtocopherols content,” European Food Research and Technology,vol. 223, no. 6, pp. 775–779, 2006.
[4] E. Sabah and M. Majdan, “Removal of phosphorus fromvegetable oil by acid-activated sepiolite,” Journal of Food Engi-neering, vol. 91, no. 3, pp. 423–427, 2009.
[5] R. Ajemba and O. Onukwuli, “Adsorptive removal of colourpigment from palm oil using acid activated Nteje clay. Kinet-ics, equilibrium and thermodynamics. Physicochem,” ProblemMiner. Process, vol. 49, no. 1, pp. 369–381, 2013.
[6] GB 2716-2005, “Hygienic standard for edible vegetable oil,” (InChinese).
[7] “Commission Regulation (EU) No. 835/2011 of 19 August 2011amending Regulation EC No. 1881/2006 as regards maximumlevels for foodstuffs,” 2011.
[8] L.-K. Shi, Y.-L. Liu, H.-M. Liu, and M.-M. Zhang, “One-step solvent extraction followed by liquid chromatography-atmospheric pressure photoionization tandem mass spectrom-etry for the determination of polycyclic aromatic hydrocarbonsin edible oils,” Analytical and Bioanalytical Chemistry, vol. 407,no. 13, pp. 3605–3616, 2015.
[9] L.-K. Shi, D.-D. Zhang, and Y.-L. Liu, “Incidence and surveyof polycyclic aromatic hydrocarbons in edible vegetable oils inChina,” Food Control, vol. 62, pp. 165–170, 2016.

Journal of Chemistry 9
[10] M. C. Rojo Camargo, P. R. Antoniolli, and E. Vicente, “Evalu-ation of polycyclic aromatic hydrocarbons content in differentstages of soybean oils processing,” Food Chemistry, vol. 135, no.3, pp. 937–942, 2012.
[11] K. Cejpek, J. Hajslova, V. Kocourek, M. Tomaniova, and J.Cmolik, “Changes in PAH levels during production of rapeseedoil,” Food Additives and Contaminants, vol. 15, no. 5, pp. 563–574, 1998.
[12] B. K. Larsson, A. T. Eriksson, and M. Cervenka, “Polycyclicaromatic hydrocarbons in crude and deodorized vegetable oils,”Journal of the American Oil Chemists’ Society, vol. 64, no. 3, pp.365–370, 1987.
[13] M. Leon-Camacho, I. Viera-Alcaide, and M. V. Ruiz-Mendez,“Elimination of polycyclic aromatic hydrocarbons by bleachingof olive pomace oil,” European Journal of Lipid Science andTechnology, vol. 105, no. 1, pp. 9–16, 2003.
[14] V. H. Teixeira, S. Casal, and M. B. P. P. Oliveira, “PAHscontent in sunflower, soybean and virgin olive oils: evaluationin commercial samples and during refining process,” FoodChemistry, vol. 104, no. 1, pp. 106–112, 2007.

Submit your manuscripts athttps://www.hindawi.com
Hindawi Publishing Corporationhttp://www.hindawi.com Volume 2014
Inorganic ChemistryInternational Journal of
Hindawi Publishing Corporation http://www.hindawi.com Volume 201
International Journal ofInternational Journal ofPhotoenergy
Hindawi Publishing Corporationhttp://www.hindawi.com Volume 2014
Carbohydrate Chemistry
International Journal ofInternational Journal of
Hindawi Publishing Corporationhttp://www.hindawi.com Volume 2014
Journal of
Chemistry
Hindawi Publishing Corporationhttp://www.hindawi.com Volume 2014
Advances in
Physical Chemistry
Hindawi Publishing Corporationhttp://www.hindawi.com
Analytical Methods in Chemistry
Journal of
Volume 2014
Bioinorganic Chemistry and ApplicationsHindawi Publishing Corporationhttp://www.hindawi.com Volume 2014
SpectroscopyInternational Journal of
Hindawi Publishing Corporationhttp://www.hindawi.com Volume 2014
The Scientific World JournalHindawi Publishing Corporation http://www.hindawi.com Volume 2014
Medicinal ChemistryInternational Journal of
Hindawi Publishing Corporationhttp://www.hindawi.com Volume 2014
Chromatography Research International
Hindawi Publishing Corporationhttp://www.hindawi.com Volume 2014
Applied ChemistryJournal of
Hindawi Publishing Corporationhttp://www.hindawi.com Volume 2014
Hindawi Publishing Corporationhttp://www.hindawi.com Volume 2014
Theoretical ChemistryJournal of
Hindawi Publishing Corporationhttp://www.hindawi.com Volume 2014
Journal of
Spectroscopy
Analytical ChemistryInternational Journal of
Hindawi Publishing Corporationhttp://www.hindawi.com Volume 2014
Journal of
Hindawi Publishing Corporationhttp://www.hindawi.com Volume 2014
Quantum Chemistry
Hindawi Publishing Corporationhttp://www.hindawi.com Volume 2014
Organic Chemistry International
ElectrochemistryInternational Journal of
Hindawi Publishing Corporation http://www.hindawi.com Volume 2014
Hindawi Publishing Corporationhttp://www.hindawi.com Volume 2014
CatalystsJournal of