effects of outer surface paint color on crude oil
TRANSCRIPT

BRAZILIAN JOURNAL OF PETROLEUM AND GAS | v. 5 n. 3 | p. 123-137 | 2011 | ISSN 1982-0593
123
EFFECTS OF OUTER SURFACE PAINT COLOR ON CRUDE OIL EVAPORATIVE LOSS FROM THE KHARK ISLAND STORAGE TANKS
a Farzaneh-Gord, M.;
a Nabati, A.1 ;
a Rasekh, A.;
a Saadat-Targhi, M.
a The Faculty of Mechanical Engineering, Shahrood University of Technology, Iran
ABSTRACT The aim of the present work is to determine crude oil evaporation rates from external floating storage tanks in the Khark Island and to study the effects of its outer surface paint on the losses. In this study, the temperature distribution within the crude oil storage was calculated by employing numerical modeling and then the effects of outer surface paint color on the tank’s temperature has been investigated. The research performed the validation of the numerical modeling against the measured values of the storage tank’s temperature at different times during a given day, when reasonable agreements were observed. The API AP-42 standard was employed to estimate the evaporation loss from storage tanks. The results show that the annual evaporation loss from all Khark Island storage tanks is of 6,800 barrels, when the outer surface has light color paint. The total loss would be of 13,200 barrels for the case that utilized dark color. This indicates a difference in total evaporation loss of 6,400 barrels per year, when the outer surface painting color varied.
KEYWORDS storage tank; crude oil; evaporation loss; paint color; Wintherm
1 To whom all correspondence should be addressed.
Address: The Faculty of Mechanical Engineering, Shahrood University of Technology, Shahrood, Iran Telephone / fax number: +982733395440| E-mail: [email protected] doi:10.5419/bjpg2011-0013

BRAZILIAN JOURNAL OF PETROLEUM AND GAS | v. 5 n. 3 | p. 123-137 | 2011 | ISSN 1982-0593
124
1. INTRODUCTION
There are about 40 storage tanks in Khark Island (main Iranian oil export terminal), which are being used to store crude oil for brief periods of time in order to stabilize the flow between production wells and transporting ships. Crude oil consists of various hydrocarbons, some of which are lighter components that may evaporate in the storage tanks at ambient temperature and pressure. The evaporated fraction, when released to the atmosphere causes environmental pollution and reduces the quality of the crude oil. Considering the economic importance of petroleum and the relevance of restricting standards in air pollution, any reductions in evaporative losses are of significant practical value. Due to an increase in air pollution, federal and state laws have changed progressively over the years, requiring controls on storage tanks to reduce the emission of certain pollutants (Digrado and Thorp, 2004).
The design of storage tanks depends on various parameters such as vapor pressure, storage temperature and pressure, and toxicity of the liquid (Abdel et al., 2003). The fixing-roof tanks are mainly used for petroleum materials with a vapor pressure less than 1.5 psia (Laverman, 1992), while floating-roof tanks are used for petroleum materials with a vapor pressures of 1.12 to 11.5 psia (Abdel et al., 2003). An external floating roof tank typically consists of an open topped cylindrical steel shell equipped with a roof that floats on the surface of the stored liquid, which rises and falls as the liquid level changes. Floating roof tanks are equipped with a sealing system. This system is located attached to the roof’s perimeter and covers the gap between the roof and the tank’s wall (Ramachandran, 2000). The basic designs, available for external floating roof rim seals, are mechanical shoe seals, liquid-mounted seals, and vapor-mounted systems called primary seals (Ciolek, 2006a). A secondary seal is often used for covering the entire primary seal. The floating roof structure and the sealing system are designed to reduce evaporative losses from petroleum materials. Evaporative losses from the external floating roof tanks are limited to losses from the sealing system, roof fittings, and any remaining liquids on the tank walls, when the floating roof falls down.
There are very limited studies related to storage
tank evaporative losses. Wongwises et al. (1997) evaluated gasoline evaporation losses from Thailand storage sites and service stations during refueling and loading. They estimated total gasoline evaporative losses of about 21,000 tons/year throughout Thailand. Ramachandran (2000) also investigated the underlying causes of storage thank emissions and analyzed the options for reducing them. Asharif and Zorgani (2007) calculated evaporative losses from large existing crude oil storage tanks located in a Libyan oil field, and investigated the operating variables including the number of separation stages, operating temperature, and pressure of each separator. They concluded that the operation variables of the existing process facilities can be adjusted in order to minimize the losses from storage tanks.
Digrado and Thorp (2004) compared the evaporation losses between internal and external floating roofs. They also determined the losses associated with different sealing arrangements based on the American Petroleum Institute (API) standards (API 2517, 1989; API 2519, 1990).
Zareie et al. (2007) determined experimentally the amount of volatile organic compounds emitted from an industrial external floating roof tank by monitoring the level of the liquid in the tank and its temperature for a period of 35 days. They also compared their findings with the values computed, based on the API standards, and found that the API predictions are slightly lower than the ones from experimental data.
There are also studies on the effects of exterior surface paint color. Farzaneh-Gord et al. (2010a) developed a practical analytical model for predicting temperature development of incompressible flow inside an aboveground pipeline. The outer surface of the pipeline was exposed to solar radiation and wind stream. The radiation heat exchange with ambient was also taken into account. The researchers investigated the effects of exterior surface paint color by emission and absorptivity measurements. The model was developed to study crude oil flow temperature development through a specific pipeline. Farzaneh-Gord et al. (2011a) has employed the model for predicting oil temperature at the pipeline exit (the metering point) based on climate and geographical conditions of the Khark Island. The temperature at the metering point was

BRAZILIAN JOURNAL OF PETROLEUM AND GAS | v. 5 n. 3 | p. 123-137 | 2011 | ISSN 1982-0593
125
calculated and the effects of envelope color were investigated. Further, the uncertainty in the measurement system due to temperature rise was studied. Farzaneh-Gord et al. (2011b) determined the evaporative losses from external floating storage tanks due to the solar irradiation when the tank is modeled as a lump system. Farzaneh-Gord et al. (2010b) has also studied the effects of exterior surface paint color on sludge formation on the bottom of a crude oil storage tank.
This study employed the API AP-42 standard to estimate evaporation losses from storage tanks. The standard requires a careful evaluation of the crude oil temperature. Crude oil temperature distribution has been calculated by employing numerical modeling and more importantly, the effect of surface paint color on the crude oil temperature and evaporative loss has been investigated. The study compared numerical predictions with the experimental data provided from a storage tank, with the capacity of one million barrels of light crude oil, located in Khark Island, the main Iranian oil export terminal.
2. THE CASE STUDY
Khark Island is a continental island in the Persian Gulf that belongs to Iran. The Khark Island
provides a marine port for the export of oil, and it extends Iranian territorial sea claims into the Persian Gulf oil fields. There are about 40 crude oil storage tanks with a capacity of 1 million barrels within the Island. These tanks are used to hold oil for a brief period in order to stabilize the flow between production wells and transporting ships.
The problem under consideration is a typical storage tank in Khark Island, shown in Figure 1. As seen in the picture, the outer surface of the tank is white in color, with two small rings of blue and yellow color indicating that the tank is suitable for storing both heavy and light crude oils.
The tank is an external pontoon floating roof type with 114 meters in diameter and 17 meters in height, with a storage capacity of 1 million barrels of crude oil. Table 1 lists the types and the numbers of deck fittings.
During the current study, light crude oil with API of 33.36, which chemical composition is given in Table 2, has been stored in the tank. The composition of the crude oil was approximated by a true boiling point (TBP) curve. The experiment was carried out by the Iranian Oil Terminal company laboratory located in the Khark Island. These data have been used to calculate the thermal properties of the crude oil employing the commercial software HYSYS version 3.1.
Figure 1. The oil storage tank under consideration in Khark Island.

BRAZILIAN JOURNAL OF PETROLEUM AND GAS | v. 5 n. 3 | p. 123-137 | 2011 | ISSN 1982-0593
126
3. CLIMATE CONDITIONS IN KHARK ISLAND
Climate conditions such as ambient temperature, wind speed, and solar irradiation have important effects on the temperature of crude oil inside the storage tank. These climate conditions induce evaporative losses and sludge formation in crude oil storage tanks. The climatic data came from the Iran Weather Institute, information for 2007.
3.1 Ambient temperature
The ambient temperature variations for the 5th day of each month are shown in Figures 2 and 3 for the year 2007. The spring and summer months are shown in Figure 2, while the fall and winter months are plotted in Figure 3. Clearly, Khark Island has hot summers and the temperature can reach as high as 40oC with August being the hottest month.
Table 1. Types of tank fittings.
Fitting Type Construction Details Number
Access hatch Bolted cover, gasketed 3
Vacuum breaker Weighted mechanical actuation, gasketed 14
Roof drain 100% open 5
Unslotted Guide Pole Ungasketed sliding cover 2
Deck leg Adjustable, pontoon area, gasketed 301
Rim vent Weighted mechanical actuation, gasketed 13
Rim-seal
Primary Liquid-mounted seal
1 Secondary Weather shield
Table 2. Assay data of the light crude oil under consideration.
Assay Liq. Volume % Boiling Temp (C) Light Ends Liq. Mass %
2.08 15 Methane 0.00
7.51 65 Ethane 0.00
14.43 100 Propane 0.02
17.42 125 I-Butane 0.06
22.05 150 N-Butane 0.36
26.84 175 I-Pentane 0.80
31.36 200 N- Pentane 1.16
35.67 225 2,2DiMethyl Butane 0.02
40.56 250 2,3DiMethyl Butane 0.17
45.00 275 2Methyl Pentane 0.56
48.65 300 3Methyl Pentane 0.33
51.71 325 N-Hexane 0.36
55.48 350 Methyl Cyclo Pentane 0.06
Benzene 0.04
API 33.36 Cyclo Hexane 0.01
RVP 7.89 TOTAL 3.95

BRAZILIAN JOURNAL OF PETROLEUM AND GAS | v. 5 n. 3 | p. 123-137 | 2011 | ISSN 1982-0593
127
3.2 Wind speed
Wind speed is another important environmental parameter, which influences evaporative losses both directly, as will be discussed later, and indirectly through temperature, as it affects the heat balance of the storage tank. Figure 4 shows wind speed variations in the island throughout the months observed.
3.3 Solar radiation
Solar radiation is the main cause of evaporative losses in floating roof tanks. Several engineering models propose equations to estimate solar radiation on earth’s surface. In all of the models, weather condition and geographic location are important factors (Zekai, 2008). Kamali and Moradi, (2005) examined various models including Angstrom, Bristow and Campbell, and Hargreaves
and Reddy for locations and weather conditions relevant to the present problem. They compared their findings with the experimental data. It was suggested that the Angstrom model with some modifications is more suitable for the Khark Island conditions, and, therefore, it was the one adopted in the present study.
Based on the Angstrom model, the solar radiation (H) can be estimated using the following equation:
OO S
Sba
H
H (1)
where, a and b are coefficients that must be chosen according to the location and weather conditions; H0 is the cloudless hourly global irradiation received by earth surface (defined below), and S and S0, are average sunshine
Figure 2. Khark Island ambient temperature during spring and summer 2007.
Figure 3. Khark Island ambient temperature during fall and winter 2007.

BRAZILIAN JOURNAL OF PETROLEUM AND GAS | v. 5 n. 3 | p. 123-137 | 2011 | ISSN 1982-0593
128
duration and cloudless sunshine duration, respectively. According to Kamali and Moradi, (2005), the values of a and b, for Khark Island, are shown in Table 3.
HO could be calculated the following equation:
(2)
where Isc, solar constant is set to 1367 W/m2, according to the world radiation center (Kamali and Moradi, 2005), N is the day of the year, φ is latitude, and δ is the declination angle that is obtained by (Duffie and Beckman, 1991):
365
284360sin45.23
N (3)
Also in equation 2, ω1 and ω2 are the sunset hour angle for period of one hour (where ω2 is the larger). The sunset hour angle is the angular displacement of the sun east or west of the local
meridian due to rotation of the earth on its axis at 15 degrees per hour and given by the following equation:
15)12( ti (4)
where, t is local time for each hour angle.
Figures 5 and 6 show variations of solar radiation (H) with time throughout the 5th day of each month in spring-summer and autumn-winter months throughout the year 2007, respectively. The solar radiation usually occurs between 5:30AM and 18:30PM,with a pick around noon. Figures 5 and 6 also show that the strongest solar radiation occurs in June.
The solar radiation explained above is a function of other required climate conditions (e.g. ambient temperature and wind speed, which were extracted from the Iranian weather society database). These results were employed to build a thermal file, which is required for the thermal analysis of the tank.
Figure 4. Wind speed during twelve months in Khark
Island.
Table 3. Adjustment coefficients for Khark Island based on the Angstrom model.
coefficient spring Summer autumn winter
a 0.37 0.37 0.37 0.37
b 0.35 0.35 0.38 0.38
Figure 5. Time variations of solar radiation with
times in spring and summer months on Khark
Island.
Figure 6. Time variations of solar radiation with
times in autumn and winter months on Khark
Island.

BRAZILIAN JOURNAL OF PETROLEUM AND GAS | v. 5 n. 3 | p. 123-137 | 2011 | ISSN 1982-0593
129
4. API METHOD FOR ESTIMATION OF EVAPORATION LOSS (API, 1994; Ciolek, 2006b)
Before implementing the API method, it is important to highlight that the original API relations are in British units, based on a one-month period. In this work, the original relations were converted to the SI unit.
Total evaporative losses from external floating roof tanks are equal to the sum of the rim seal loss, withdrawal loss, and deck fitting loss and can be calculated as:
FWDR mmmm (5)
where, m is the total loss, Rm is the rim-seal loss,
WDm is the withdrawal loss, and Fm is the deck
fitting loss.
Rim seal loss from floating roof tanks can be estimated using the following equation:
CV
n
RbRaR KMDPVkkm )(105.2 8 (6)
where, kRa is the zero-wind-speed rim-seal loss factor, kRb is the wind speed dependent rim-seal loss factor, and V is the average ambient wind speed at the tank site. Also, n is the seal related wind speed exponent, D is the tank diameter, P* is the vapor pressure function, MV is the average vapor molecular weight; and Kc is the product factor, which equals 0.4 for crude oils. kRa, kRb, and n depend on the type of seal used.
To calculate the vapor pressure function (P*), the following equation can be used:
25.0
11
A
VA
A
VA
P
P
P
P
P (7)
where, PA is atmospheric pressure and PVA is vapor pressure at daily average liquid surface temperature that can be determined using the following equation:
S
VAT
BAP exp895.6 (8)
where, exp is the exponential function, TS is daily average liquid surface temperature. The constants A and B can be calculated from these equations:
RVPLnB
RVPLnA
12167261
9672.082.12 (9)
where, RVP is Reid vapor pressure and Ln is natural logarithm function.
Deck fitting losses from floating roof tanks can be estimated with the following equation:
CVFR KMPFm 8105.2 (10)
The value of total deck fitting loss factor (FF) may be calculated by using actual tank-specific data for each group of different fittings, for which the number of units are known (NF), and then multiplied by the loss factor for each fitting (KF).
)](.....)()[( 2211 FnFnFFFFF KNKNKNF (11)
The deck fitting loss factor (KFi) for a particular type of fitting, can be estimated by the following equation:
mi
VFbiFaiFi VKKKK )( (12)

BRAZILIAN JOURNAL OF PETROLEUM AND GAS | v. 5 n. 3 | p. 123-137 | 2011 | ISSN 1982-0593
130
For external floating roof tanks, the fitting wind speed correction factor (Kv) is equal to 0.7.
The withdrawal loss from floating roof storage tanks can be estimated using Equation 13.
]1[10829.2 7
D
FN
D
WQCm CCLS
WD (13)
In this equation, Q is the annual throughput; CS is the shell factor, WL is the average crude oil density, NC is the number of fixed roof support columns, and FC is the effective column diameter. Where, NC is zero for the external floating roof.
It is worth mentioning that in the API method (API, 1994; Ciolek, 2006b) a simple correlation has been proposed for computing monthly-averaged tank temperatures, which can also be used for estimating the monthly-averaged evaporative losses as:
31.010586.1 5
HTTS (14)
5. NUMERICAL METHOD TO CALCULATE CRUDE OIL TEMPERATURE
Equations that describe heat transfer through flat roofs and around storage tanks are almost impossible to be solved by analytical methods due to the variation of solar radiation and ambient temperature. Therefore, researchers have employed finite element methods to solve the energy equation. A four-node quadrilateral grid is used to depict the computational domain in discreet elements. The Wintherm software version 8.1 was utilized for the finite element (FE) modeling of the crude oil storage tank. The FE model consists of 16,772 elements and 17,969 nodes. Figure 7 shows the computation mesh of a cylindrical-shaped storage tank (114 m in diameter and 17 m in height). Although the Wintherm software is capable of modeling solar radiation, one found that a separate solar modeling provides better agreement with experimental values. For this purpose, the thermal file, created previously, works as an input file in the Wintherm software. Note that the radiation between the tank’s surface and the earth’s surface affected the tank’s temperature. For this reason, conditions of the earth surface have an important role when modeling the tank with the software.
The computational domain contains two parts: a fluid domain and a solid domain. The fluid domain contains crude oil. The solid domain is further divided in two parts: the storage tank and the area around the tank. In this modeling, the sheet thickness of the storage tank reflects similar conditions of actual storage tanks. Therefore, the thicknesses of the floor and the top sheets are 6.35 µm and 4.76 µm, respectively. The thickness of lateral sheets is 25 µm.
The sheets have a steel structure, which has a density of 7,768.98 kg/m3. The tank’s surface has the radiation characteristics of being 0.9 emissive, and its estimated absorptivity ranges between 0.2 and 0.9 in the calculation. The soil around the tank
Figure 7. The computation mesh.
Table 4. Material properties.
Material Density (kg/m3) Conductivity (W/m-K) Heat Capacity (J/kg-K)
steel 7,768.98 52.019 460.968
soil 1,500 1 1,840

BRAZILIAN JOURNAL OF PETROLEUM AND GAS | v. 5 n. 3 | p. 123-137 | 2011 | ISSN 1982-0593
131
has the radiation characteristics 0.94 emissive and 0.39 absorptive surfaces; it has a density of 1,500 kg/m3. Other properties of the steel and the soil are available in Table 4.
The crude oil properties are depended on oil temperature. Table 5 describes crude oil properties as a function of oil temperature. These data were acquired from the HYSYS analyses.
It is necessary to adopt proper external boundary conditions depending on the weather. For this purpose, the software contemplates an input of weather conditions such as ambient temperature, solar radiation, wind speed, relative humidity, wind direction, rain rate, and cloudiness index. These parameters were monitored for 24 hours during each month of the program, and the storage tank was analyzed at time increments of 1 hour.
The convection heat transfer for the external tank’s surface is composed of two constituents: natural and forced convection. Considering the fact that the wind speed in Khark Island ranges from 2 to 6m/s, the Reynolds (Re) and Grashof (Gr) numbers have been calculated for the storage tank. The results show that the values of Re for the external tank’s surface ranged between 15 × 106 and 45 × 106, and the values of Gr ranged between 5 × 10¹⁰ and 8 × 10¹⁰. It is known that natural convection is negligible when Gr/Re2 < 0.1, and forced convection is negligible when Gr/Re2 > 10. Neither is negligible when 0.1 < Gr/Re2 < 10. Therefore, both natural and forced convection are essential to heat transfer calculations when Gr and Re2 are of the same order of magnitude (one is typically within a factor of 10 times the other) (Cengel, 2002). This work also observed that natural convection can be neglected, whilst only forced convection occurs around the tank.
The residuals were checked for each element at each time step to ensure that conservation of energy was attained. The residual of the continuity equation for each element must be less than 10-6. Initial temperature condition is one of the most effective parameters to account for possible rapid convergence. In order to impose an appropriate initial temperature distribution, the computer program run for 24 hours, and repeated several times. The initial condition considered the resulting temperature distribution, with a corresponding time step of 60 min.
6. RESULTS AND DISCUSSION
6.1 Average crude oil temperature
As the first step in the evaluation of the evaporation loss from the storage tank, the crude oil temperature is required. Therefore, the temperature distribution has been calculated using numerical analyses with the Wintherm software in the first step. The boundary (ambient) and initial conditions for each day studied has been applied to the software through a thermal file, as discussed above. Figure 8 shows the results obtained with the Wintherm software for four different times during a given day, where the X-axis refers to the northern direction. It was observed that the tank’s temperature is nearly the same as the ambient temperature at 6:30 AM, and that, as the day passes, the tank’s surface picks up solar heat and its temperature rises.
One particular characteristic of the storage tank is the auto-shading effect, which occurs during most of the day, except at noon. On the other hand, the intensity solar radiation around the tank is not uniform over its entire surface. Depending on the hour of the day, a portion of the surface receives strong direct sunbeams, while the other parts of the tank’s surface stay in the shade. In the morning, the eastern part of tank is exposed to direct beam radiation, while its western part is in the shade. In the afternoon, the opposite phenomenon occurs. According to the direction of solar radiation, shades occur around the storage tank and on its roof during the entire day.
To check the validity of the results for mean crude oil temperature, one made a comparison between the results provided by the Wintherm software and the measured values. Five-temperature sensors located in the storage tank, as
Table 5. Properties of crude oil.
Properties Function
Density (kg/m3) ρ = - 0.735 T +1,070
Heat Capacity (J/kg-K) Cp = 4.348 T +635.2
Conductivity (W/m-K) k = -0.000023 T+ 0.21417
Viscosity (kg/m-s) µ =10-5
T2 – 0.007 T +1.163
Prandtl Number Pr =0.125 T2 – 81.21 T + 13,152

BRAZILIAN JOURNAL OF PETROLEUM AND GAS | v. 5 n. 3 | p. 123-137 | 2011 | ISSN 1982-0593
132
shown in Figure 9, measured the experimental temperature. The hourly measured values were averaged over the day for all sensors. For more accuracy, another comparison was made by measuring external surface temperatures with an infrared thermometer, as shown in Figure 10.
Data have been taken from various positions of the surface of the storage tank on December 7, 2008, February 25, 2009, and June 2, 2009, at
different times, throughout each day. Table 6 compares the average surface temperatures by numerical analysis, and the crude oil temperatures are compared by the numerical analyses in Tables 7 and 8. The positions of the sensors shown in Figure 9 are as follow: sensor 1 located at 1.25 m from the floor; sensors 2, 3, 4, and 5 located at 3.85, 6.45, 9.05, and 11.64 m from the floor, respectively. A comparison between measured and computed values of average daily surface tank temperature
Figure 8. Tank temperature variations on 15th
of August 2007.
Figure 9. Schematic of five temperature sensors. Figure 10. Infrared thermometer.

BRAZILIAN JOURNAL OF PETROLEUM AND GAS | v. 5 n. 3 | p. 123-137 | 2011 | ISSN 1982-0593
133
and crude oil temperature for the three days mentioned above shows that numerical analyses could correctly predict the crude oil temperature.
In addition to crude oil surface temperature comparisons preformed daily, the averaged liquid surface temperature calculated monthly was compared with their corresponding values from the API correlation (API 1994; Ciolek, 2006b) given by equation 13, as depicted in Figure 11. Considering the similarities between both methods, the results
agree fairly well. It is important to emphasize that it is only the numerical method that provides a proper base for the study of the absorptivity of the paint effects on the transient tank temperature.
It is observable that the crude oil encountered its highest temperatures in July, August, and September because there is a higher solar radiation in these months. The lowest crude oil temperature occurred during January and February.
Table 6. Comparison between numerical & experimental values of tank surface temperature.
Date Time Experimental Numerical Analysis
7th
December 2008 9:30 A.M. 18.8 oC 18.25
oC
7th
December 2008 1:30 P.M. 21.2 oC 20.63
oC
25th
February 2009 8:30 A.M. 19.8 oC 19.14
oC
25th
February 2009 2:30 P.M. 22.7 oC 21.83
oC
2nd
June 2009 10:30 A.M. 41.8 oC 40.90
oC
Table 7. Comparison between numerical and experimental values of crude oil temperature (7
th of December 2008).
Experimental data Numerical Analysis
Time Sensor 1 Sensor 2 Sensor 3 Sensor 4 Sensor 1 Sensor 2 Sensor 3 Sensor 4
11:30 25.54 25.61 25.72 25.78 25.62 25.59 25.62 25.68
12:30 25.55 25.61 25.72 25.78 25.70 25.59 25.62 25.71
13:30 25.55 25.64 25.72 25.78 25.76 25.60 25.62 25.72
14:30 25.55 25.64 25.72 25.78 25.84 25.60 25.65 25.76
15:30 25.55 25.64 25.72 25.78 25.87 25.60 25.65 25.76
16:30 25.55 25.64 25.72 25.78 25.87 25.60 25.65 25.74
Table 8. Comparison between numerical and experimental values of crude oil temperature (25
th of February 2009).
Experimental data Numerical Analysis
Time Sensor 1 Sensor 2 Sensor 3 Sensor 1 Sensor 2 Sensor 3
8:30 21.39 22.11 - 21.36 21.39 21.31
9:30 21.39 22.11 - 21.44 21.39 21.35
10:30 21.39 22.11 - 21.51 21.40 21.37
11:30 21.39 22.11 - 21.64 21.41 21.46
12:30 21.39 22.22 - 21.79 21.42 21.54
13:30 21.39 22.22 22.39 21.93 21.42 21.61
14:30 21.39 22.22 22.39 22.01 21.43 21.64
15:30 21.39 22.39 22.39 22.08 21.44 21.66
16:30 21.39 22.39 22.39 22.11 21.44 21.66
BRAZILIAN JOURNAL OF PETROLEUM AND GAS | v. 5 n. 3 | p. 123-137 | 2011 | ISSN 1982-0593
134
The numerical method developed allows the investigation of the effects of the absorptivity of the surface tank paint on the crude oil surface temperature. This method enables the designer to select the paint that best suits the desired application. Figure 12 shows the effects of the paint absorptivity on the monthly averaged oil surface temperature. The results show that the crude oil temperature increases when absorptivity increases from 0.2 to 0.9 in all months. The monthly averaged oil surface temperature can
increase by about 20 C in September, when absorptivity increases from 0.1 to 0.9. Thermal changes for June and September are more intense than in other months when absorptivity increases, because there is higher solar radiation in June (Figure 5) and wind speed is lower in September (Figure 4).
6.2 Evaporation Loss
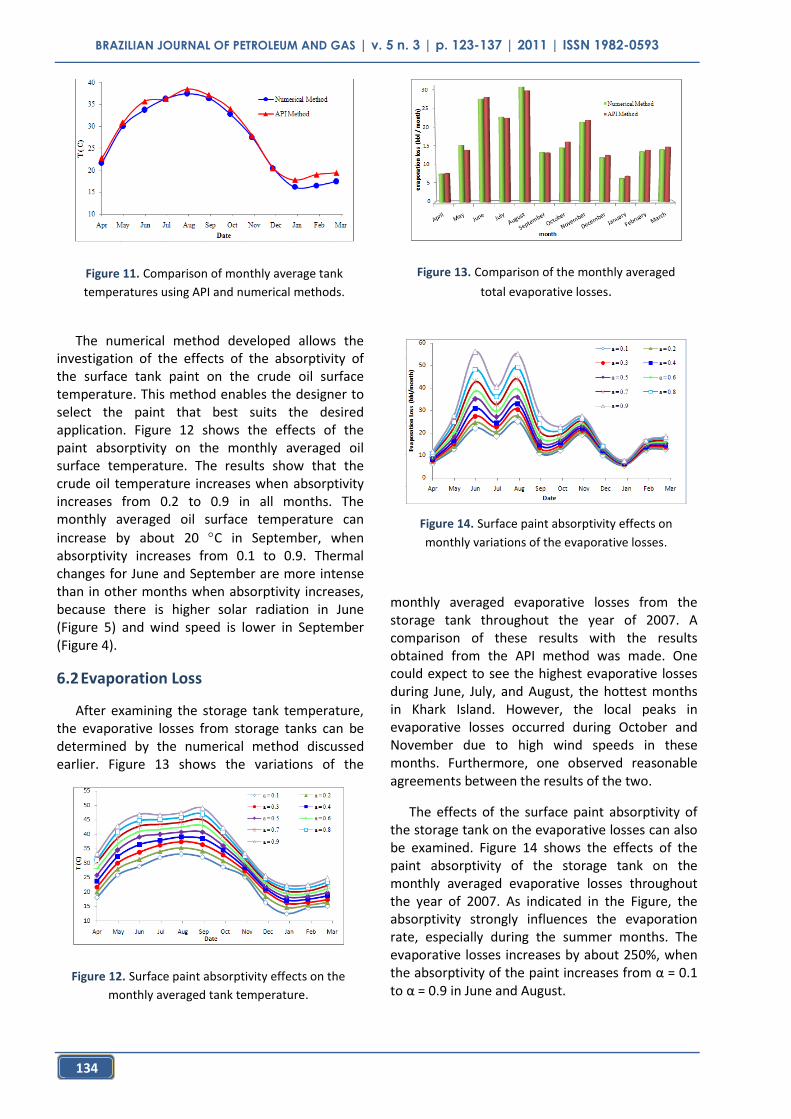
After examining the storage tank temperature, the evaporative losses from storage tanks can be determined by the numerical method discussed earlier. Figure 13 shows the variations of the
monthly averaged evaporative losses from the storage tank throughout the year of 2007. A comparison of these results with the results obtained from the API method was made. One could expect to see the highest evaporative losses during June, July, and August, the hottest months in Khark Island. However, the local peaks in evaporative losses occurred during October and November due to high wind speeds in these months. Furthermore, one observed reasonable agreements between the results of the two.
The effects of the surface paint absorptivity of the storage tank on the evaporative losses can also be examined. Figure 14 shows the effects of the paint absorptivity of the storage tank on the monthly averaged evaporative losses throughout the year of 2007. As indicated in the Figure, the absorptivity strongly influences the evaporation rate, especially during the summer months. The evaporative losses increases by about 250%, when the absorptivity of the paint increases from α = 0.1 to α = 0.9 in June and August.
Figure 11. Comparison of monthly average tank
temperatures using API and numerical methods.
Figure 13. Comparison of the monthly averaged
total evaporative losses.
Figure 14. Surface paint absorptivity effects on
monthly variations of the evaporative losses.
Figure 12. Surface paint absorptivity effects on the
monthly averaged tank temperature.

BRAZILIAN JOURNAL OF PETROLEUM AND GAS | v. 5 n. 3 | p. 123-137 | 2011 | ISSN 1982-0593
135
Figure 15 depicts the annual averaged evaporative losses from the storage tank for different absorptivity coefficients. The results indicate that there is difference of approximately 160 barrels between light-color (α = 0.1) and dark-color (α = 0.9) paints for a single storage tank. Since there are about 40 storage tanks in Khark Island, one can calculate the total evaporative losses. The total annual evaporation loss (for the 40 storage tanks) was calculated to be around 6,800 barrels when using light-colored paint, and around 13,200 barrels when applying dark-colored paint. This shows a difference equivalent of 6,400 barrels in evaporation losses between two paintings.
Furthermore, the amount of evaporative losses for lighter hydrocarbons is probably much higher than the ones for crude oils under investigation; therefore, the absorptivity of the outer surface paint of the storage tanks for such products plays more important roles, which require special emphasis.
Considering the fact that the evaporation occurs in crude oil layers adjacent to the floating roof, the local temperature in this area is a key factor in this process. Clearly, the insulation of the tank roof, which absorbs the largest portion of the solar irradiation, reduces its temperature and the amount of evaporative losses accordingly.
7. CONCLUSIONS
One of the major difficulties related to crude oil storage tanks, is the control of evaporation losses. Light hydrocarbons vaporize in the space between the crude oil and the tank roof. This process affects
the quality of the crude oil and causes environmental pollution.
This study developed a numerical method for estimating the temperature in storage tanks. The results of the numerical method were validated against measured, experimental values of the crude oil and storage tank temperatures at different times during a day, observing reasonable agreements. The numerical value of monthly averaged evaporation loss, when compared to the value of API AP-42 standard, also showed a good agreement. These observations prove that the proposed numerical method is able to predict the tank’s temperature and the evaporation loss accurately.
The results showed that maximum losses for the considered storage tank in Khark Island occur in June, July, and August due to the combined effects of high solar radiation and relatively strong wind speeds. The value of annual evaporation loss from all tanks of the Khark Island, for present paint color (α = 0.3), corresponds to 8,000 barrels. Under the estimation of oil prices at USD 80.0 per barrel, then, a financial loss of USD 160,000 will take place each year.
The analysis of the effects of surface paint absorptivity on the temperature of storage tanks and, consequently, on the evaporative losses used a numerical method of investigation. The results indicated that the annual evaporative losses increase up to 200 % if the absorptivity of the tank’s surface increases to where 90 percent of the solar radiation is absorbed. In addition, evaporative loss increases when the absorptivity of the paint increases.
For all crude oil storage tanks located in Khark Island, the annual evaporation loss is calculated to be around 6,800 barrels, when the outer surface of the tank was painted by light-color paint (α = 0.1). The total annual evaporation loss would be of 13,200 barrels in the case of application of dark-colored (α = 0.9) paint to outer surface of the tanks. If the cost of each barrel of crude oil is USD 80.0, one could save 512,000 USD/year by simply applying light-colored painting (e.g. white) to the outer surface of the tanks.
Figure 15. Annual evaporative losses for several
surface paint absorption coefficients.

BRAZILIAN JOURNAL OF PETROLEUM AND GAS | v. 5 n. 3 | p. 123-137 | 2011 | ISSN 1982-0593
136
NOMENCLATURE
A – constant in the vapor pressure equation, (dimensionless) B – constant in the vapor pressure equation, (°K) cp – special heat capacity (J/kg-K) Cs – shell factor, (m) D – tank diameter, (m) Fc – effective column diameter, (m) FF – total deck fitting loss factor, (kg-mole/yr) H0 – cloudless daily global irradiation received, (MJ/m2.hour) H – daily global irradiation, (MJ/m2.hour) k – conductivity, (W/m K) KRa – Zero-wind-speed rim-seal loss factor, ( kg-mole/m@ yr) KRb – wind speed dependent rim-seal loss factor, (kg- mole/(m/s)n m @yr) MV – vapor molecular weight, (kg/kg-mole) mo – total loss, (kg/s) mF – deck fitting loss, (kg/s) mR – rim seal loss, (kg/s) mWD – withdrawal loss, (kg/s) N – number of day in year NC – number of fixed roof support columns, (dimensionless) Nu – Nusselt number, (dimensionless) PA – atmospheric pressure, (kpa) P* – vapor pressure function, (dimensionless) Pr – Perantel Number, (dimensionless) PVA – true vapor pressure, (kpa) Q – annual throughput, (m3/yr) Ra – Rayleigh number, (dimensionless) S – average sunshine duration, (hour) S0 – cloudless sunshine duration, (hour) TS – oil surface temperature, (oK) T∞ – ambient temperature, (oK) V – average ambient wind speed, (m/s) WL – average organic liquid density, (kg/m3) Greek Symbols α – absorption coefficient, (dimensionless)
– declination angle, (degree)
– hour angle, (degree)
– latitude, (degree)
8. REFERENCES
Abdel-Aal, H. K.; Aggour, M.; Fahim, M. A. Petroleum and gas field processing. In: Chapter 8- Storage Tanks and Other Field Facilities. New York: Marcel Dekker Inc; 2003. p. 1.
Asharif, H.; Zorgani, E. Adjustment of Process Variables to Reduce Evaporation Losses from High pour point-crude oil storage tanks. The 8th conference on petroleum phase behavior and fouling, France, 2007.
API. Manual of Petroleum Measurement Standards. In: Chapter 19- Evaporative Loss Measurement, Section 2- Evaporative Loss From Floating Roof Tanks. American Petroleum Institute, Washington DC, 1994.
API 2517 Evaporative Loss from External Floating Roof Tanks, Bulletin No. 2517, Third Edition, American Petroleum Institute, Washington, DC, 1989.
API 2519 Evaporative Loss from Internal Floating Roof Tanks, API Publication 2519, American Petroleum Institute, Washington, DC, 1990.
Cengel,Y. Fundamental of Heat Transfer - Chapter 9: Natural Convection, 2002. p. 487.
Ciolek Michael. Emission Factor Documentation for AP-42 Section 7.1 Organic Liquid Storage Tanks. In: Chapter 2- Storage Tank Descriptions. U S Environmental Protection Agency. 2006a. p. 1-5.
Ciolek Michael. Emission Factor Documentation for AP-42 Section 7.1 Organic Liquid Storage Tanks. In: Chapter 3-Emission Estimation Procedure. U S Environmental Protection Agency; 2006b, p. 9-11: 15-18.
Digrado Brian D.; Thorp Gregory, A. The aboveground steel storage tank handbook. In: chapter 13: new field-erected aboveground storage tank products. New Jersey: John Wiley & Sons Inc. 2004. p. 237-247.
Duffie J. A.; Beckman, W. A. Solar Engineering of Thermal Processes, Willy. New York, USA, 1991. p. 15.
Farzaneh-gord, M.; Rasekh, A.; Nabati, A.; Saadat-targhi, M. Investigation about the effects of exterior surface paint color on temperature development in aboveground pipeline, Solar Energy 84, p. 1997–2008. 2010a.

BRAZILIAN JOURNAL OF PETROLEUM AND GAS | v. 5 n. 3 | p. 123-137 | 2011 | ISSN 1982-0593
137
Farzaneh-gord, M.; Saadat-targhi, M.; Nabati, A.; Rasekh, A.; Niazmand, H. Effects of exterior surface paint color on sludge formation in a crude oil storage tank (case study: Khark Island), Energy & Fuels, Volume 24, Issue 12, p. 6489-6500, 2010b. doi:10.1021/ef1010644
Farzaneh-gord, M.; Rasekh, A.; Saadat-targhi, M.; Nabati, A. Lowering uncertainty in crude oil measurement by selecting optimized envelope color of a pipeline, Journal of Thermal Science, Vol. 15, No. 1, p. 91-104. 2011a. doi:10.2298/TSCI100601079F
Farzaneh-Gord, M.; Nabati, A.; Niazmand, H. Solar radiation effects on evaporative losses of floating roof storage tanks, Int. J. of Oil, Gas and Coal Technology (IJOGCT), Vol. 4, No. 2, 2011b.
Kamali, G. A.; Moradi, E. Solar radiation fundamentals and application in farms and new energy. Tehran: publication 21 century. 2005.
Laverman, R. J. Emission Reduction Options for Floating Roof Tanks. Second International Symposium on Aboveground Storage Tanks, Houston, 1992.
Ramachandran, S. Reducing (controlling) vapour losses from storage tanks. 7th annual India Oil & Gas Review, Symposium & International Exhibition, Bombay, (IORS) 2000.
Wongwises, S.; Rattanaprayura, I.; Chanchaona, S. An Evaluation of Evaporative Emissions of Gasoline from Storage Sites and Service Stations. Thailand, Thammasat Int. J Sc Tech. Vol 2, No 2. 1997.
Zareie, S.; Mowla, D.; Fathi, J. Practical Study of VOCs Emission from External Floating Roof Tanks. 5th international congress of chemical engineering, Shiraz, Iran, 2007.
Zekai¸ Sen. Solar Energy Fundamentals and Modeling Techniques. Londen: Springer Veriag. 2008. p. 47-140.