effects of phenobarbital, 3=methylcholanthrene, and ... · kcl, 0.1 31 potassium phosphate buffer,...
TRANSCRIPT
THE JOURNAL OB BIOLOGICAL CHEMISTRY Vol. 247, No. 4, Issue of February 25, pp. 1257-1264, 1972
Printed in U.S.A.
Effects of Phenobarbital, 3=Methylcholanthrene, and Hematin
on the Synthesis of Protein Components of
Rat Liver Microsomal Membranes*
(Received for publication, July 16, 1971)
PETER J. DEHLINGER~ ,~ND ROBERT T. SCHIMKE
From the Department of Pharmacology, Stanford University School of drleclicine, Xtanford, California 9.4305
SUMMARY
Smooth endoplasmic reticulum was solubilized in sodium dodecyl sulfate and the protein components were fractionated by acrylamide gel electrophoresis. The relative rates of amino acid incorporation into the fractionated protein bands following various drug treatments were measured. The drugs used were phenobarbital and 3-methylcholanthrene, representative of two classes of drugs which induce a variety of microsomal drug-metabolizing activities, and hematin, which causes a decrease in the activities of enzymes associ- ated with drug metabolism.
Each of the three compounds produced distinctive changes in amino acid incorporation into the protein components of smooth endoplasmic reticulum. In each case the greatest change in amino acid incorporation was in a major protein band in the 50,000 molecular weight region of the gel. Cy- tochrome P-420, the solubilized form of cytochrome P-450, was purified and shown to migrate as a protein with a molecu- lar weight of 50,000, indicating that this protein is contained in the 50,000 molecular weight band. Amino acid incorpora- tion into isolated cytochrome P-420 showed that this protein is responsible for at least part of the drug-mediated changes in amino acid incorporation observed for the 50,000 molecu- lar weight protein band.
Liver endoplasmic reticulum has been the subject of various studies of membrane synthesis and degradation (l-5). This sys- tem offers some advantage in studying membrane biogenesis in that the amount of endoplasmic reticulum and the activities of enzymes involved in the metabolism of steroids and various drugs are responsive to changes in hormonal levels (6) and to many xenobiotics (6-8). The principle identified components of the mixed function oxidase system, an electron transport pathway leading to the oxidation of steroids and drugs, are NADPH cyto- chrome c reductase and cytochrome P-450 (6, 9). The levels of
* This work was supported by Grant GM14931 from the Na- tional Institutes of Health.
$ Supported by Training Grant GM0712 from the National Institutes of Health. Present address, Institute of Molecular Biology, University of Oregon, Eugene, Ore. 97403.
both of these enzymes are responsive to drug treatments (1, 10). Of these, NADPH cytochrome c reductase has been purified and its rate of synthesis shown to be selectively increased in response to administration of phenobarbital (1, 2, 11). However, cyto- chrome P-450, the terminal osidase (9) and substrate-binding site (12) of the mixed function oxidase system, has not been amenable to purification from liver microsomes. Consequently, changes in its rate of synthesis, or degradation in response to various drug treatments, or both, have not been studied. Such a study should aid in answering the following questions. (a) .Ire synthesis and degradation of the mixed function oxidase compo- nents coordinately controlled? (b) Is the synthesis of cytochrome P-450, and perhaps ot’her mixed function oxidase components, regulated independently with respect to other membrane pro- teins? (c) What is the mechanism (or mechanisms) by which membrane proteins are selectively inserted into or removed from previously existing membrane?
The question of whether the synthesis and degradation of cyto- chrome P-450 is regulated independently with respect to other membrane proteins was considered in an earlier study in which the relative turnover rates of microsomal proteins were measured in the steady state (3). As displayed on SDS’ acrylamide gels, larger proteins were found to have greater degradation rates. A conspicuous exception to this general correlation was a major protein band in the 50,000 molecular weight region. This band showed a high turnover rate, and several lines of evidence sug- gested that this band, or a component of it, was cytoehrome P-450.
In the present study we have characterized furt,her this prot’ein band under conditions in which cytochrome P-450 content and drug-metabolizing capacities of microsomes are altered by various drug treatments. These experiments were performed both to support the identification of this band as containing cytochrome P-450 and to investigate drug-mediated effects on the rate of its synthesis relative to other microsomal membrane proteins.
METHODS
Isolation of SER-All experiments were performed on livers from male, white Sprague-Dawley rats weighing between 110 to 140 g each. The animals were fasted 18 hours before killing. Livers were perfused through the spleen with 10 ml of cold 0.25 JI
1 The abbreviations used are: SDS, sodium dodecyl sulfate; SER, smooth endoplasmic reticulum; TX, Triton X-100.
1257
by guest on Novem
ber 19, 2018http://w
ww
.jbc.org/D
ownloaded from
sucrose before excision, and homogenized in 4 volumes of 0.25 RI concentration of about 5 mg per ml, sonicated for 20 set, and sucrose with a glass homogenizer and Teflon pestle. SER was centrifuged at 105,000 x g for 1 hour. The supernatant, desig- isolated by the method of Dallner (13), modified by use of the nated TX~soluble SER, contained approximately 50% of the SB-283 rotor of an International model JZ-60 ultracentrifuge. washed microsomal protein. This fraction was made 0.1% in The pelleted SER ~vns suspended by homogenization in 0.5 M SDS (w/v), sonicated for 20 set, and applied to the gels. The KCl, 0.1 31 potassium phosphate buffer, pH 7.5, at a concentra- membrane fraction insoluble in lc/c TX required 2 to 3 rnin of tion of about 10 nq per ml. Part of the fract,ion was used in sonication in 0.57, SDS for solubilization. It was not necessary measuring enzyme activities; the remainder was prepared for to reduce the SDS concentrat’ion of thi-: material before electro- gel electrophoreA as described below. phoresis (3).
Enzylne Assays-Cytochrome l-‘-450 was assayed by the Protein separation by acrylamide gel electrophoresis was car-
method of Lu et al. (14). Carbon moiroside difference spectra ried out on discontinuous gradient acrylamide gels in the pres- of reduc>ed microsomnl preparations n-ere measured with a Zeiss ence of 0.1 y0 SDS, as described previously (3:. The acrylamide spectrophotometer. The solubilized form of this protein, cyto- concentration gradients employed in fractionating the TX-soluble chrome P-420, \vas assayed by its CO difference spectrum at 420 and TX-insoluble SER proteins are shown alongtiide the gels in run. s,YDPH cytochrome c reductase was also assayed as de- Fig. 1. Gels, 5 x 75 mm, were used to display the protein pat- scribed by Lu et al. (14). terns (analytical gels); large (preparat’ive) gels, 19 X 75 mm,
Nicrosomal aminopyrine demrthylase activity was det’ermined were employed for radioactive samples, since such gels were capa- with x modification of the method of Conney et al. (7). Ap- ble of resolving an amount of protein (about 5 mg) required to proximately 2 mg of microsomes lvere added to an incubation obtain sufficient radioactivity for accurate counting. -1pprosi- mixture containing 0.5 ml of potassium phosphate buffer, pH mately 225 pg of protein in 50 to 100 ~1 lvere applied to the 7.5, 0.1 ml of 1 M hIgClz, 0.1 ml of 1 IRI KCl, 1 ml of 1 mM amino- analytical gels and about 5 rng to the preparative gels. Small pyrine, and 20 ~1 of 50 mM NADPH. Distilled water was added amounts of sucrose and tracking dye (brornphenol blue) were to give a final volume of 3 ml. The mixture was incubated at included in the sample. Electrophoresis was carried out at a 37” for 30 min, during which time 20 ~1 of 50 rnM NADPH were current which did not exceed 0.5 ma per small tube (7.5 ma per added every 5 min. The amount of formaldehyde formed was large tube). The small gels were stained with 1 To (m/v) Fast measured by the method of n-ash (15). The ability of micro- Green (Eastman) in 10 y0 acetic acid and destained in 10 y0 acetic somes to metabolize zosazolaminez iv-as assayed similarly, using acid. The large gels were frozen on Dry Ice and stored at 1 ml of 0.6 m&l zoxazolamine in the incubation mixture rather - 18” until sliced. than aminopyrine. The disappearance of zoxazolamine was de- The method for slicing the gel and preparing the slices for scin- termined spectrophotometrically (16). Both of these assays tillation counting has been described previously (3). The gels were found to be linear with time and enzyme concentration were sliced into 80 to 90 l-mm slices and the 3H and W counts within the ranges used in these studies. determined for each slice and plotted on a linear scale. The
Drug and Isofope ddminisfration--[U-14C]Leucirle (300 mCi small, stained gels were scanned at 600 nm in a Gilford model per mbl) and [4, 5-3H]leucine (2000 mCi per mM) were obtained 2000 spectrophotometer equipped with a gel-scanning at.tach- frorn Schvvarz RioResearch. The isotope was diluted to 1.5 ml ment. The radioactivity was matched to the optical density in in 10 rrm NaCl and injected intraperitoneally in two 0.75.ml two ways, both of which take account of the fact that both sets doses. Sodium phenobarbital (I\Ierck) was dissolved in water of data are plotted on a linear scale. By one technique RF and injected intraperitoneally, 100 mg per kg; S-methylcholan- values were calculated. Alternatively this was done by rnatch- threne (Calbiochem) was dissolved in corn oil and injected ing the point of maximum 3H counts to the midpoint of the intraperitoneally, 25 mg per kg; hematin (Calbiochem), dissolved 50,000 molecular weight band (see Fig. 3). Once the correspond- in 10 nlM KOH, was given intraperitoneally at a dose of 16 mg ence between the tvvo graphs was established, the abscissa of the per kg. In the experiments designed to measure the relative radioactivity graph was adjusted to match that of the optical rates of protein synthesis following drug administration, an ex- density scan, and t,he 3H :14C ratios were plotted on this scale perimental animal was given the drug several hours before killing (see Figs. 4 to 7). In all cases, both methods resulted in identical and at the same time a control animal received an equal volume matching of the two sets of data. of the drug vehicle (see figure legends for details). Four hours Pur$catiors of Cytochrome P-420-The purification of cyto- before killing, the experimental animal was given 250 &i of chrome P-420, the solubilized form of P-450, was performed by a [3H]leucine and the control, 75 PCi of [i%]leucine. The 4-hour modification of the methods of Omura and Snto (17). SER, period between isotope injection and killing allowed for the prepared as described above, was homogenized in 0.1 M potassium passage of the rapidly labeled serum proteins through the endo- phosphate buffer, pH 7.5, and centrifuged for 1 hour at 105,000 X plasmic reticulum before isolation of the SER fraction (2). g. This and subl;equent homogenizations were performed in a
SDS Gel Electrophoresis-Homogenates of W and ‘%-labeled glass homogenizer fitted with a Teflon pestle. The pelleted SER SER isolated from equal volumes of liver homogenate and pre- was washed once with distilled water and resuspended in 1% TX pared as described above, were combined, sonicated for 20 set with a Branson sonifier at a power setting of 1, and centrifuged
to a final protein concentration of about 5 mg per ml, then
at 105,000 X g for 1 hour to remove loosely bound proteins. centrifuged at 105,000 x g 1 hour. The resulting pellet was
The pellet was resuspended by sonication in distilled water and homogenized in 10 rntir Tris-acetate buffer, pH 9.0, at a protein
centrifuged at 105,000 x g for 1 hour. This washed SER was concentration of about 10 mg per ml. The snake venom of
then resuspended in 1% TX (v/v) in mater to a final protein Trimeresurus $avoviridis (Sigma), heat treated as described by Imai and Sato (18)) was added to a concentration ot 0.1 v0 and the
2 Zoxazolamine, 2.aInino-5.chlorohenzoxazole. mixture was incubat,ed at 4” under nitrogen atmosphere for 24
12% Vol. 247, No. 4
by guest on Novem
ber 19, 2018http://w
ww
.jbc.org/D
ownloaded from
Issue of February 25, 1972 P. J. Dehlinger and R. T. Xchimke 1239
hours, followed by overnight dialysis against 10 InM Tris-acetate, pH 10.0. The clear reddish supernatant resulting from cen- trifugation at 105,000 x g for 1 hour was fractionated further by gel electrophoresis, with preparative scale (19 x 45 nm) dis- continuous gradient gels. The gel buffer employed was 20 mM Tris-acetate, pH 10.0. The acrylamide stock solutions for final acrylamide concentrations of 10, 7.5, and 4% were prepared as described previously (3). The gel solutions consisted of 10 ml of gei buffer solution, 5 ml of acrylamide stock, 5 ml of freshly prepared O.ZS’% ammonium persulfate, and 20 ~1 of TEMED. The three gel solutions, 7 ml of lo%, and 3 ml each of 7.5 and 4% acrylamide, were layered in. a, 19.mm inside diameter glass tube, one over the other, before polymerization occurred. The sample, containing about 10 mg of protein and a small amount of sucrose and tracking dye (bromphenol blue) was applied to the gel and electrophoretically treated in 50 mM Tris-acetate buffer, pH 10.0. Electrophoresis was carried out at a current of 5 ma per large tube. The reddish orange band which entered the 10% acrylamide region migrated closely behind the tracking dye. When the tracking dye had run off the bottom of the tube, the cytochrome band was electrophoretically treated into a small buffer chamber which was separated from the lower buffer by a dialysis membrane. The sample was concentrated by lyophili- zation and stored at -18’. The yield from 25 mg of SER was about 1.5 mg of the cytochrome P-420 fraction.
The radioactivity of labeled SER and purified cytochrome P-420 was determined by precipitating an aliquot of the sample with a 10% solution of trichloroacetic acid. The precipitate was collected on a glass filter, dissolved in 0.5 ml of NCS (Nuclear
TABLE I
Effect of phenobarbital, 3-methylcholanthrene, and hematin on
relative specific activities of four microscmal drug metabolism capacities
The drug indicated was administered to three animals and an equal volume of the drug vehicle was given to three control ani- mals several hours before killing. The SER fraction from each animal was isolated and assayed for specific activities. The average specific activity of the three control animals was set at 100% and the average specific activity of the three experimental animals expressed relative to 100%. Phenobarbital, dissolved in water, was given at a dose of 100 mg per kg 16 hours prior to killing. 3-Methylcholanthrene was dissolved in corn oil and given at a dose 25 mg per kg 16 hours prior to killing. Hematin was dissolved in 10 mM NOH and 16 mg per kg were administered 18, 16, and 4 hours prior to killing. In the phenobarbital plus hematin treatment, the experimental animals received pheno- barbital (100 mg per kg) 16 hours, and hematin (16 mg per kg) 18, 16, and 4 hours prior t,o killing. The drug-induced changes
in drug metabolism activities shown here are representative of those observed in the double isotope experiments (Figs. 4 to 7).
-
Drug administered
Phenobarbital. 3-Methylcholanthrene. Hematin. . . Hematin + phenobar-
bital.
% % % % 185 146 190 185 117 118 96 432
85 92 87 78
98 125 129 103
Chicago), and counted in 10 ml of toluene-based scintillation fluid.
RESULTS
Effect of Phenobarbital, S-Xethylcholanthrene, and Nematin on
Microsomal Drug-metabolizing Enzymes-In each of the experi- ments designed to study the effect of drug administration on amino acid incorporation into microsomal proteins, the specific activities of four microsomal drug metabolism capacities were measured. Table I shows the specific activities relative to con- trol values 16 hours after phenobarbital and 3-methylcholan- threne administration. Hematin was administered three times (18, 16, and 4 hours prior to killing), similar to the schedule used by Marver et al. (19). The values in Table I are typical of several experiments and generally agree with numerous reports on the drug effects on microsomal metabolism activities (1, 6-8, 10, 19, 20). Cytochrome P-450 and NADPH cytochrome c reductase were stimulated 1.5- to 2-fold by phenobarbital, and slightly iii- creased by 3-methylcholanthrene. The CO-binding pigment with maximum difference spectrum at 448 nm, which is associ- ated with induction by 3-methylcholanthrene (21-23), was not differentiated from cytochrome P-450 in this study. The induc- tion by phenobarbital of cytochrome P-450 and NADPH cyto- chrome c reductase is paralleled by increase in a wide variety of drug metabolism activities, including aminopyrine demethylase and zoxazolamine hydroxylase (57), as is confirmed in Table I. 3-Methylcholanthrene, on the other hand, rapidly and selectively induces a small number of drug metabolism activities, including zoxazolamine hydroxylase, but not aminopyrine demethylase (5-.7). Hematin decreased the four drug metabolism activities uniformly. Table I shows also that hematin was effective in suppressing the phenobarbital-stimulated induction of micro- somal enzyme activities as has been reported (19, 20).
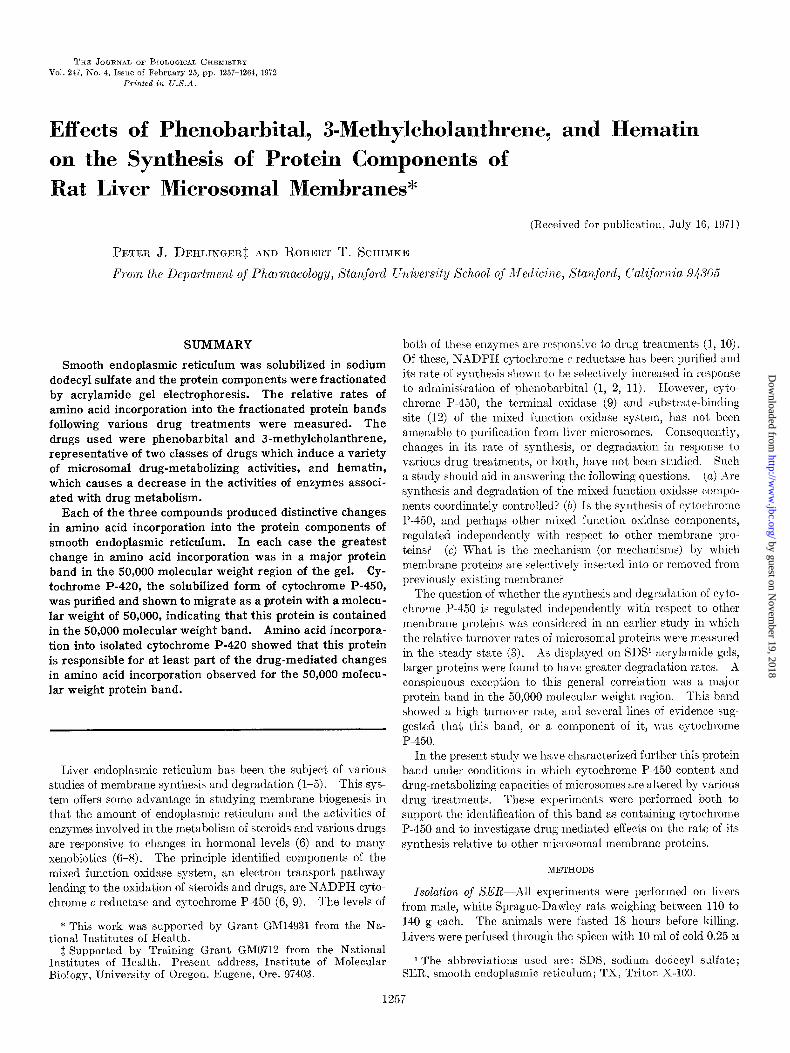
Localization of Cytochrome P-450 on SDS Gels-SER was frac- tionated on the basis of solubility in 1% TX as outlined under
FIG. 1. Gel electrophoresis patterns of total SER, TX-soluble, and TX-insoluble SER subfractions. Fractionation of SER on the basis of solubility in Triton X-100 is described under “Meth- ods.” The gels consist of discontinuous gradients of varying acrylamide concentrations, as indicated by the solid horizontal lines. The dashed lines correspond to the migration distance of two marker proteins. Approximately 225 pg of protein were ap- plied to each gel. Marker proteins were obtained from commer- cial sources, and about 20 pg of each were applied to a gel.
by guest on Novem
ber 19, 2018http://w
ww
.jbc.org/D
ownloaded from

1260 Synthesis of Microsomal Proteins Vol. 247, No. 4
“Methods.” The electrophoretic patt,erns of the TX-soluble and TX-insoluble fractions, each comprising about 50% of the tota,l SER protein, are shown in Fig. 1. These patterns are similar to those published previously (3), which showed that the two TX subfractions have some protein bands in common a.nd others which are limited to one fraction only. The percentage of NADPH cytochrome c reductase and cytochrome P-450 ac- tivity released into the TX-soluble fraction was determined for SER from untreated rats. SER which had been suspended by sonication in 1% TX was examined for enzyme activity before and after centrifugation to remove the TX-insoluble material. All of the cytochrome c reductase and about 43% of the cyto- chrome P-420 activity present in the sonicated SER were recov- ered in the TX-soluble fraction.
A major protein band, designated as Band C (Fig. l), is ap- parent inboth TX subfractions. With proteins of known molecu- lar weight as markers, the molecular weight of this band was esti- mated to be about 50,000. Several lines of evidence suggest that
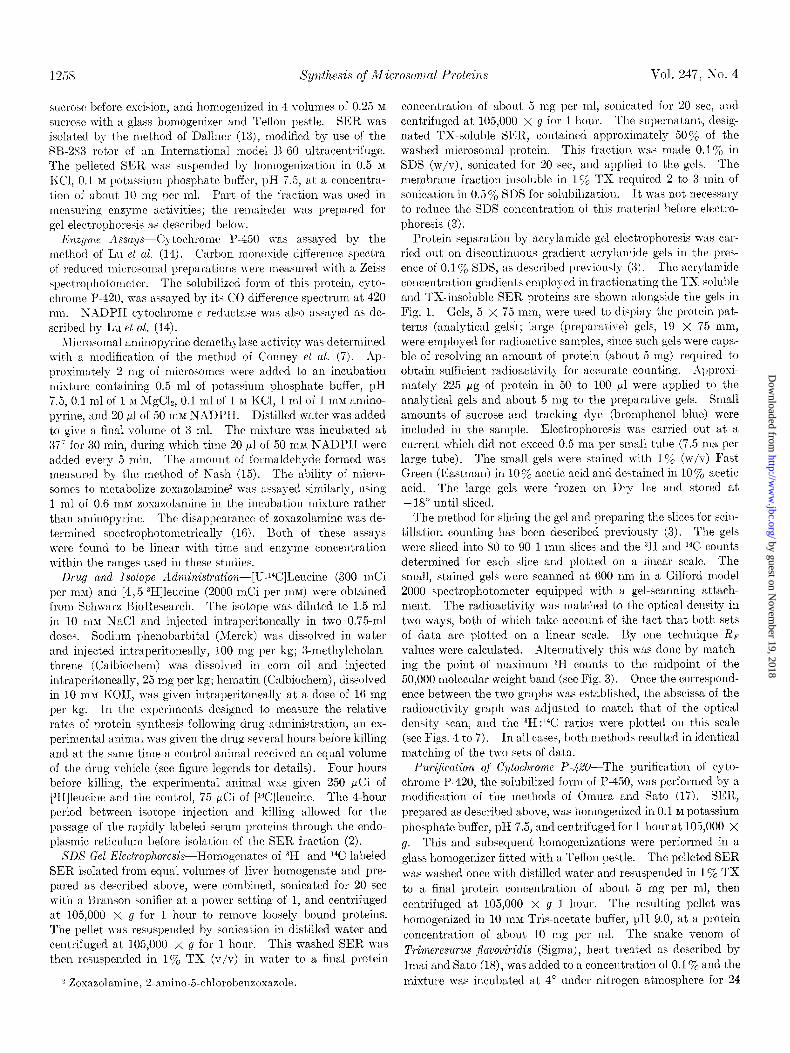
FIG. 2. Electrophoretic patterns of the fractions obtained during the partial purification of cytochrome P-420. The frac- tions are: TX-insoluble SER after 24 hours of incubation in 50 mM Tris-acetate, pH 9.0, in the absence (A) and presence (B) of heat- treated snake-venom; the supernatant obtained after digestion of TX-insoluble SER bv h&at-treated snake venom (C) : and the par- tially purified cytochrome P-420 fraction (D). Tde gel gradient employed was the predominantly 10% gradient shown at the left in Fig. 1. About 150 pg of protein were applied to each gel.
this band contains the CO-binding protein, cytochrome P-450: based on an estimated molecular weight of 50,000, this protein comprises 4 to 5% of the microsomal protein and up to 20% of phenobarbital-stimulated microsomes (1, 24). As noted above, about 430/, of the cytochrome P-450 activity measured in SER is released into the TX-soluble fraction, which agrees well with the distribution of radioactivity found in Band C of the two TX subfractions (Fig. 3).
To confirm further that Band C contains cytochrome P-450, we partially purified the solubilized form of this protein, cyto- chrome P-420. As indicated under “Methods,” this fraction contains a heme protein and migrates as a single band on nonde- tergent acrylamide gel at pH 10.0. This fraction showed CO- binding activity at 420 nm, although its specific CO-binding ac- tivity was only slightly greater than the specific CO-binding activity of fresh SER. The failure to obtain a significant en- richment of the specific CO-binding activity of the cytochrome P-420 fraction is thought to result from progressive loss of CO- binding activity of the protein once it is removed from the mem- brane, as has been reported earlier (17). The SDS-gel electro- phoretic pattern of the partially purified cytochrome P-420 frac- tion is shown in Fig. 2. The bulk of the protein in this fraction migrates in the 50,000 molecular weight range, although con- taminating protein bands are evident. The effect of snake venom digestion on the molecular weight distribution of TX- insoluble SER, also shown in Fig. 2, appears to be negligible, in- dicating that little if any proteolysis occurs during the 24-hour incubation with heat-treated snake venom. Thus we can rule out the possibility that the 50,000 molecular weight protein in the cytochrome P-420 fraction was derived from a larger poly- peptide in the TX-insoluble SER fraction.
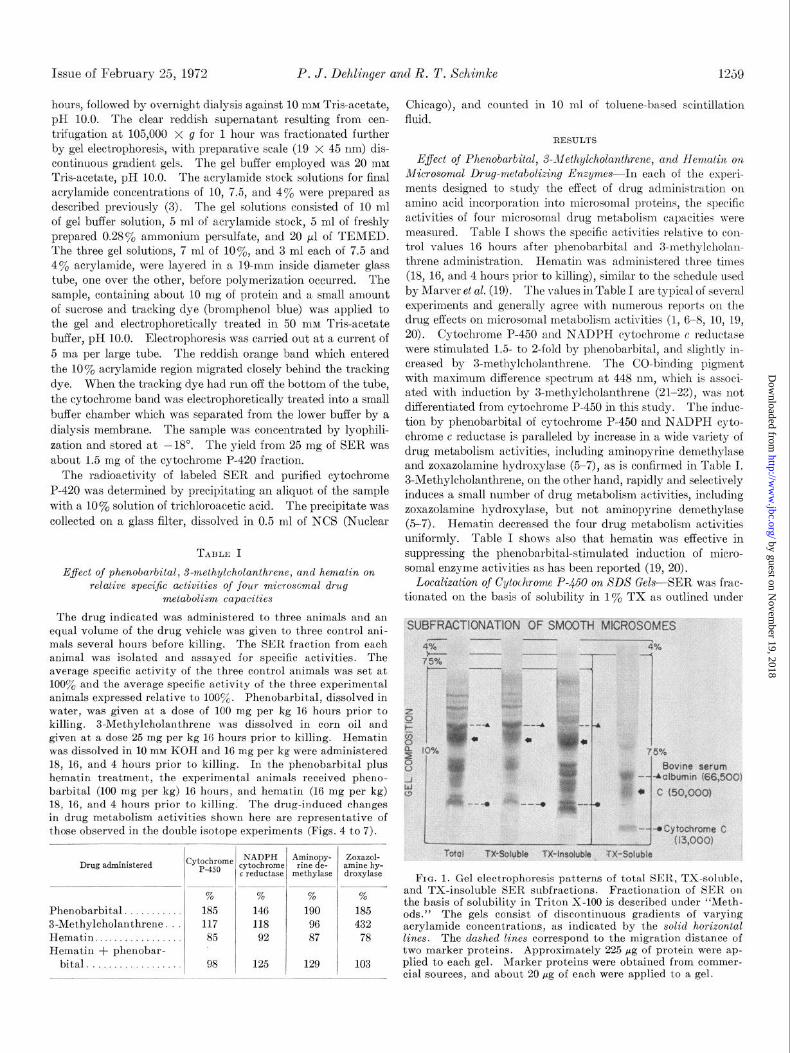
Amino Acid Incorporation into XER Proteins following Drug Administration-The effect of drug administration on the syn- thesis of microsomal proteins was studied by comparing incorpo- ration of [3H]leucine into drug-induced SER proteins with incorporation of [14C]leucine into uninduced SER proteins frac- tionated on SDS acrylamide gels. The variability inherent in an experiment of this type was determined by a control experiment in which neither the 3H- nor 14C-labeled animal received drug treatment. The data from this experiment is shown in Fig. 3. The major peak of radioactivity in both TX subfractions (middle frame) corresponds to Band C in Fig. 1.
The effect of phenobarbital on amino acid incorporation into SER proteins is shown in Fig. 4. Amino acid incorporation into Band C is stimulated relative to other protein bands in both TX subfractions, indicating that most of the compositional change in microsomal proteins in response to phenobarbital is associated with protein (or proteins) in Band C. In this and subsequent figures, the correspondence between Band C on the optical gel scan and the Band C on the 3H:i4C ratios plot is assured by the method of matching the two plots (see “Methods”). Thus the 3H :14C ratios reported for Band C correspond to the 3H : 14C ratios in the region of peak radioactivity. This may include cyto- chrome P-450 as well as other phenobarbital-induced proteins. Since all of the NADPH cytochrome c reductase is released into the TX-soluble fraction, this enzyme does not contribute to Band C in the TX-insoluble fraction. In order to verify that cytochrome P-450 contributes, either totally or partially, to the observed increase in amino acid incorporation into Band C, the physiological response of isolated cytochrome P-420 to pheno- barbital administration was assessed by a double label experiment
by guest on Novem
ber 19, 2018http://w
ww
.jbc.org/D
ownloaded from
Issue of February 23, 1972
I
P. J. Dehlinger and R. T. Schikdce
n 1 I7
~~1 FRACTION NUMBER
FIG. 3. Electrophoretic patterns of radioactivity and optical density of the TX-soluble (left) and TX-insoluble (right) SER subfractions. One animal was given 250 &i of [sH]leucine and another animal, 75 PCi of [Wlleucine 4 hours before killing. The SElL fractions from the two animals were combined and elec- trophoretically treated as described under “Methods.” Approxi- mately 225 rg of protein were applied to the small analytical gels and 5 mg of protein to the preparative size gels. The upper box shows the optical gel scan of the stained analytical gels; the two
similar to the one described above. Using the drug and isotope
doses and schedule described in Fig. 4, the relative rates of amino acid incorporation into the cytochrome P-420 fraction and total SER were determined. The 3H:14C ratio for the P-420 fraction WIS 2.4. This 3H:14C value was similar to those found for aver- age SER proteins and Band C, respectively, seen in Fig. 4. In view of the significant percentage of total SER protein which cytochrome P-420 comprises, a marked increase in the rate of synthesis of this prot.ein would be expected to result in a marked increase in amino acid incorporation into Band C relative to other phenobarbital-induced proteins. Results of the isolation of T\;-\DPH cytochrome c reductase described by Omura et al. (25) indicated that this enzyme constitutes about 0.6a/, of washed microsome protein, whereas the amount of cytochrome P-450 is several times greater. Estabrook and Cohen (24) have estimated t,he stoichiometry of the mixed function oxidase system to be several moles of cytochrome P-450 to 1 mole of reductase. A comparison of 3H:14C ratios in the two TX subfractions shows that, the increase in 3H:14C ratios in the 50,000 molecular weight band is greater in the TX-insoluble fraction. In all of the double label experiments performed, we found that the preferential increase (or decrease) in 3H:14C ratios in Band C was more pro- nounced in the TX-insoluble fraction (Figs. 4 to 7). This finding is presumably related to the difference in t.he relative amounts of cytochrome P-450 in Band C between the two TX subfrac- tions.
Fig. 4 also shows that proteins in the molecular weight range
1261
lower boxes show actual 3H and 1% levels and the 3H:14C ratios ob- tained. The brackets in the lower franze indicate two standard deviations. In this and subsequent experiments (Figs. 3 to 6), the TX-soluble proteins were fractionated on the gel gradient shown at the extreme right in Fig. 1, while the TX-insoluble proteins were fractionated on the gel gradients shown for the three gels on the left in Fig. 1. Thus the migration distance of any one molecular weight species will be different on the two gel gradients.
greater than 50,000 generally have higher 3H:14C ratios than protein bands in the molecular weight range less than 50,000. Since at least one other microsomal protein, NADPH cytochrome c reductase, and the activities of a wide variety of drug metabo- lism reactions are induced by phenobarbital, the general elevation in 3H :14C ratios among larger protein subunits may reflect pheno- barbital induction of these proteins. However, the true 3H:14C base-line value, i.e. the ratio of a protein whose synthesis is un- affected by drug administration, cannot be determined from
these results. The SER fractions from the two animals were combined on the basis of equivalent volumes of liver homogenate rather than equal protein basis. Thus, the absolute 3H:14C ratios are dependent on the relative amounts of SER per volume of liver homogenate, the relative specific activities of the amino
acid pools in the livers, and the relative rates of protein synthesis. The experiments described here measure only the relative rates
of protein synthesis. The results of a typical experiment in which 3-methylcholan-
threne was administered to the 3H-labeled animal are shown in Fig. 5. The 3H:14C patterns of the SER subfractions differ in several respects from the data in Fig. 4. Amino acid incorpora-
tion into the protein band identified with cytochrome P-450 is
only slightly increased, consistent with the increase in cytochrome
P-450 activity shown in Table I. The 3H :14C ratios of the large molecular weight proteins are similar to proteins of smaller molecular lveight. In the lower molecular weight region a few
by guest on Novem
ber 19, 2018http://w
ww
.jbc.org/D
ownloaded from

1262 Vol. 247, so. 4
FIG. 4. Relative amino acid incorporation into TX-soluble (lefl) and TX-insoluble (light) SE11. proteins in response to pheno- barbital administratioll. The experimental animal was injected intraperitoneally with 100 mg per kg of phenobarbital dissolved in water, and a control auimal received a corresponding volume of water 16 hours prior to killing. Four hours before killing the ex- perimental animal received 250 PCi of [“H]leucine and the control received 75 &i of [‘4C]leucine. The SB:K fractions from each ani- mal were combined and electrophoretically treated as described under “Methods.” Approximately 225,~g of protein were applied to the analytical gels and 5 mg of protein to the preparat,ive size gels. The “H:‘YZ ratios were matched to the optical scan as de- scribed in the text. The resldts are typical of two such experi- ments.
.---- __--__-
FIG. 5. Relative amino acid incorporation into TX-soluble (Zefl) and TX-insoluble (right) SER proteins following a-methyl- cholanthrene administration. The experiment animal was in- jected with 25 mg per kg of 3-methylcholanthrene dissolved in corn oil, and the control animal with a corresponding amount of corn oil 16 hours prior to killing. Four hours prior to killing, the exper- imental animal was given 250 PCi of [3H]leucine and the control, 75 &i of [‘%]leucine. The pl.ocedures used are identical with those described in Fig. 3. The results are typical of two such ex- periments.
bands in the TX-insoluble fractions show increased amino acid incorporation.
The effect of hematin on the short term labeling pattern of SER proteins is shown in Fig. 6. This data illustrates some inter- esting contrasts to the data on phenobarbital induction (Fig. 4). Whereas phenobarbital results in a uniform increase in the mi- crosomal enzymes assayed, hematin causes the same enzymes to decrease uniformly (Table I). Accordingly, the protein band identified with cytochrome P-450 shows a preferential decrease in amino acid incorporation, and those proteins with molecular
GEL SCAN
“& yo-- j & 6. ‘-3e~oa ooL -$?-~’ ?c -da & , i,. “I FRACTION NUMBER FRACTION NUMBER
FIG. 6. Relative amino acid incorporation into TS-soluble (left) end TX-insolltble (light) SER proteins following hematin administration. Hematin, dissolved in 10 ml~ KOH, was admiu- istercd to an experimental animal at a dose (16 mg per kg) 18, 16, and 4 hours prior t,o killing; the control animal received a c‘orre- sponding volume of 10 mM KOH at the same time iutervals. Four hours prior to killing, the hematin-treated animal was injected with the 250 &i of [3H]leucine and the control, with 75 ,&i of [I%] leucine. The procedures used are identical with those described in Fig. 4.
I GEL Scm
FIG. 7. lielative amiuo acid incorporation into TX-soluble (Zeft) and TX-insoluble (right) SER proteins in response to phe- nobarbital wwus phenobarbital plus hematin. One animal was in- jected with phenobarbital (100 mg per kg) 16 hours, and hematin (16 mg per kg) 18, 16, and 4 hours prior to killing; another animal received the same injections in which the appropriate volume of 10 mM KOH was given instead of hematin. The animal which re- ceived phenobarbital alone was given 250 &i of [3H]leucine 4 hours before killing, and the animal which received bot,h phenobarbital and hematin was injected with 75 FCi of [W]leucine at the same time. The procedures used in this experiment were identical with those described in Fig. 4.
weights greater than 50,000 have in general lower 3H:14C ratios than the smaller molecular weight protein subunits. These findings suggest that the group of enzymes, particularly cyto- chrome P-450, whose incorporation into microsomes is stimulated by phenobarbital, is coordinately decreased by hematin.
The results of the experiment in which the 3H-labeled animal was given phenobarbital and the 1Glabeled animal was given hematin and phenobarbital are shown in Fig. 7. I f hematin is effective in preventing microsomal enzyme induction by pheno- barbital, as indicated in Table I, the 3H:14C ratios obtained in
by guest on Novem
ber 19, 2018http://w
ww
.jbc.org/D
ownloaded from
Issue of February 25, 1972 P. J. Dehlinger and R. T. Xchbnke 1263
this experiment should resemble those in which phenobarbital stimulation was compared to no drug treatment (Fig. 4). This, in fact, was found. The 3H:14C ratio of Band C, which is some- what higher than the corresponding ratio in the experiment shown in Fig. 4, may be due to the additive effect of increased 3H incorporation in response to phenobarbital (Fig. 4) and decreased i4C incorporation due to hematin inhibition, as indicated in Fig. 6.
DISCUSSION
The experiments described in this paper were designed to in- vestigate the relative rates of synthesis of microsomal proteins in response to various pharmacological stimuli. Particular attention was focused on protein Band C, a 50,000 molecular weight protein band as displayed on SDS acrylamide gels. We have shown that this band contains cytochrome P-450 and that changes in the measurable activity of cytochrome P-450 in re- sponse to the three compounds administered are closely paralleled by changes in the amino acid incorporation into Band C. Al- though the data do not indicate the extent to which proteins other than cytochrome r-450 contribute to Band C, the double label experiment showing an increase in the amino acid incor- poration into cytochrome P-420 following phenobarbital admin- istration showed that cytochrome P-450 contributes, at least in part, to the increase in amino acid composition in Band C in re- +onse to phenobarbital.
Phenobarbital, 3-methylcholant,hrene, and hematin also have characteristic effects on the rate of synthesis of SER proteins other than those contained in Band C. Phenobarbital stimu- lates the synthesis of several large molecular weight (greater than 50,000) proteins in both of the TX subfractions of SER, whereas the observed effect of 3-methylcholanthrene is confined to a few smaller molecular weight (less than 50,000) proteins in the TX-insoluble SER fraction. Numerous studies have em- phasized differences between the induction of SER by pheno- barbital and 3-methylcholanthrene with respect to the mecha- nism of induction (26, 27), enzymes induced (5, 6), and changes in cell morphology (7, 28). The present study indicates that the set of microsomal proteins induced by phenobarbital overlaps very little with the set of proteins induced by 3-methylcholan- threne. In the case of induction by phenobarbital, it can be argued that some of the larger molecular weight proteins which aplrear to be induced may in fact be aggregates of cytochrome P-450 or undissociated membrane particles containing cytochrome P-450. We cannot rule out this possibility if cytochrome P-450 is covalently attached to other membrane proteins; how-ever, we have shown by a variety of methods that higher molecular weight bands seen 011 the gels are not protein aggregates (3).
The data on microsome induction by phenobarbital and 3- methylcholanthrene showing an increase in the ?EI:14C ratios of particular SER. proteins indicate that these drugs act by increas- ing the rate of synthesis of some membrane proteins. Although a decrease in the rate of protein degradation would result in an a,ccumulation of newly synthesized protein, it is unlikely that the corresponding 3H :i4C ratio would increase significantly 4 hours after isotope labeling. Therefore, if decreased protein degra- dation contributes to microsomal induction, the experiments described here would probably not detect it. That the rate of synthesis of some microsomal proteins is increased in response to phenobarbital and Y-methylcholanthrene has been shown in a variety of studies. Several workers, studying the effects of
drugs on protein synthesis in vivo (1, 2) and in vitro (29-31) have shown that the rate of amino acid incorporation into microsomal proteins increases in response to phenobarbital and Y-methyl- cholanthrene. Several laboratories have shown that pheno- barbital stimulates the synthesis of NADPH cytochrome c reductase (1, 2, 11). In the present study we show that another component of the mixed function oxidase system, cytochrome P-450, also has a significantly increased rate of synthesis in re- sponse to phenobarbital.
The decrease in 3H:i4C ratios of some SER proteins following hematin administration can likewise be ascribed to decreased synthesis rather than increased degradat,ion. Marrer has pro- posed that hematin acts to prevent the synthesis of hemeproteins through the inhibition of heme synthesis, specifically at the level of &aminolevulinic acid synthetase (19, 20). Support for this proposal comes from the study of Raisfeld et al. (32) showing that the inhibition of heme synthesis by 5-aminotriazole prevented induction of cytochrome l’-450 by phenobarbital. However this hypothesis does not explain why the exogenously supplied heme cannot be utilized in hemeprotein synthesis. An alterna- tive proposal is that hemutin inhibits the incorporation or as- sembly of newly synthesized cytochrome P-450 into endoplasmic reticulum, possibly as a result of enhanced lipid peroxidation. Studies by Tappel (33), Hatefi (34), and others (3537) have pointed out the lability of microsomes to lipid peroxidation damage in vitro. Among the most efficient catalysts of lipid peroxidation are iron and ironcoordinated compounds such as hematin. Cytochrome 1’.450 would appear to be particularly vulnerable to lipid perosidat’ion damage, since it is associated with phospholipid (la), as well as the oxygen-binding site of the mixed function oxidase system.
The question of how membrane proteins are incorporated into, and removed from, previously existing microsomes in response to drug-induced synthesis and degradation is related to the question of how membrane proteins are replaced in the steady state. ;A number of studies have shown that the protein compo- nents of endoplasmic reticulum have heterogeneous turnover rates (l-3), thus implying that proteins are continually being added to and removed from previously existing membranes. We have previously proposed a model in which membranes are assembled from and degraded as cytoplasmic components. This proposal was based in part on our finding that the protein com- ponents of SER and plasma membranes show the same correlation between subunit size and degradation rates as do the superna- tant proteins (3). An alternative explanation for the genesis of membranes would have membrane proteins synthesized by membrane-bound ribosomes, such that an intermediate (cyto- plasmic) pool of membrane proteins need not exist. Although such an explanation is supported by studies showing that pulse- labeled cytochrome c reductase of the endoplasmic reticulum first appears in rough endoplasmic reticulum, and then only later appears in the smooth endoplasmic reticulum (38), Omura and Kuriyama (39) have recently found that such a process does not occur with the bulk of membrane proteins.
We are currently involved in a study to differentiate between these two models. Using an antibody to the partially purified cytochrome P-420, immunological studies aimed at determining whether a cytoplasmic pool of cytochrome P-450 exists are in progress. If such a pool exists, the nature of this pool during increased and d.ecreased rates of membrane synthesis (assembly)
by guest on Novem
ber 19, 2018http://w
ww
.jbc.org/D
ownloaded from
1264 Xynthesis of Microsomal Proteins Vol. 247, Xo. 4
as effected by pharmacological agents should elucidate further 21. the mechanism of membrane biosynthesis and degradation.
22.
1.
2.
KURIYAMA, Y., OMURA, T., SIEBEVITZ, P., AND PALADE, G. E. (1969) J. Biol. Chem., 244, 2017.
ARIAS, I. M., DOYLE, D., AND SCHIMKE, R. T. (1969) J. Biol. Chem., 244, 3303.
3.
4.
DEHLINGER, P. J., AND SCHIMKE, R. T. (1971) J. Biol. Chem., 246, 2574.
LIas~<ss, A., SIEKEVITZ, P., AND PAL~DE, G. E. (1971) J. Cell Bio1.;49, 264, 288.
5. HOLTZMAN, J. L., AND GILLETTE, J. R. (1968) J. Biol. Chem., 243, 3020.
6. CONNEY, A. H. (1967) Pharmacol. Rev., 19, 317. 7. CONNEY. A. H.. DAVIDSON. C.. GASTEL. R.. AND BURNS. J. J.
8. (196O)‘J. Phckmacol. Exp. Tier.. 130,’ 1.
FOUTS, J. R.. AND ROGERS, L. A (1965) J. Phannacol. Exp. Ther., 147, 112.
9. GIGON, P. L., GRAM, T. E., AND GILLETTE, J. R. (1969) Mol. Pharmacol., 6, 109.
10. ORRENIUS, S., BND ERNSTER, L. (1964) Biochem. Biophys. Res. Commun., 16, 60.
11. 12.
JICIC, H., AND SHUSTER. L. (1966) J. BioZ. Chem., 241, 5366. CHAPLIN, M. D., AND MANNERING, G. J. (1970) Mol. Pharmacol.,
6, 631. 13. 14.
DALLNER, G. (1963) Acta Pathol. Microbial. &and. Suppl., 166. Lu, A. Y. H., JUNK, K. W., AND COON, M. J. (1969) J. BioZ.
Chem., 244, 3714. 15. 16.
NASH, T. (1953) Biochem. J., 66, 416. CONNEY, A. H., TROUSOF, N., AND BURNS, J. J. (1960) J. Phar-
macol. Exp. Ther., 128, 333. 17. 18. 19.
20.
OMURA, T., AND SATO, 12. (1964) J. Biol. Chem., 239, 2379. IM~I, Y., AND SATO, R. (1960) Biochim. Biophys. Acta, 42, 164. MARVER, H. S., SCHMID, R., AND SCHUTZEL, H. (1968) Biochem.
Biophys. Res. Commun., 33, 969. MIXYIXR, U. A., AND MARVER, H. S. (1971) Science, 171, 64.
REFERENCES 23.
24.
25.
26.
27.
28.
29.
30.
31. 32.
33. 34.
35. 36.
37.
38.
39.
ALVARES, A. P., SCHILLING, G., LEVIN, W., AND KUNTZM~N, K. (1967) Biochem. Biophys. Res. Commun., 29, 521.
BIDLIXMAN, K., AND MANN\‘ERING, G. J. (1970) Mol. Pharmacol., 6, 697.
HILDEBRANDT, A., REMMER, H., AND ESTABROOK, R. W. (1968) Biochem. Biophys. Res. Commun., 30, 607.
ESTABROOK, R. W., AND COHEN, B. (1969) in J. R. GILLETTE, A. H. CONNEY, C. J. COSMIDES, R. W. ESTABROOK, J. R. FOUTS, G. J. MANNERING (Editors), Microsomes and drug oxidations. a. 95. Academic Press. Kew York.
OMURA, T., ‘S;EKE&TZ, P., AND PALADE, G. E. (1967) J. Biol. Chem., 242, 2389.
JONDORF, W. F., SIMON, D. C., AND AVNIMELECII, M. (1966) Biochem. Biophys. Res. Commun., 22, 644.
NEBERT, D. W.; A&,-D GI”LBOIN, H. V. (1969) in J. R. GILLETTE, A. H. CONNEY. C. J. COSMIDES. R. W. ESTABROOK. J. R. FOUTS, G. J. M.4NNERING, (Editors), MicrosowLes and dru.q oxidations, p. 389, Academic.Press, New York.
ORRXNIUS. S.. ERICSSON. J. L. E.. AND ERNSTER, L. (19651 J. Cell Bioi., k5, 627. ’
j I
KATO. R., LOELI. L., .~ND GELBOIN, H. V. (1965) Suture, 206, 668.
VON DER DECICEN, A., AXD HULTIN, J. (1960) Arch. Biochena. Biophys., 90, 201.
GELBOIN, H. V. (1964) Biochim. Biophys. Acta, 91, 130. RAISFELD, I. H.. BACCHIN, P., HUTTERER, F., AND SCHAFFNEH.,
(1970) Mol. Pharmacol., 6, 231. TAPPEL, A. L., AND ZALKEN, H. (1960) Nature, 186, 35. HATEFI. Y., AND HANSTEIN, W. G. (1970) Arch. Biochcm.
Biophys., 138, 73. ROBINSON, J. D. (1965) Arch. Biochem. Biophys., 112, 170. GRAM, T. E., AND FOUTS, J. R. (1966) Arch. Biochem. Biophys.,
114; 331. _ .
HOCHSTEIN. P.. NORDENBRAND. K.. A~VD ERNSTXR. L. (1964) Biochem. ‘Biophys. Res. Com&un.,‘14, 323. ’
DALLNER, G., SIEICEVITZ, P., AND PALADE, G. E. (196G) J. Cell Biol., 30, 97.
OMURA, T., AND KURIY~MA, Y. (1971) J. Biochem. (Tokyo), 69, 651.
by guest on Novem
ber 19, 2018http://w
ww
.jbc.org/D
ownloaded from

Peter J. Dehlinger and Robert T. SchimkeProtein Components of Rat Liver Microsomal Membranes
Effects of Phenobarbital, 3-Methylcholanthrene, and Hematin on the Synthesis of
1972, 247:1257-1264.J. Biol. Chem.
http://www.jbc.org/content/247/4/1257Access the most updated version of this article at
Alerts:
When a correction for this article is posted•
When this article is cited•
to choose from all of JBC's e-mail alertsClick here
http://www.jbc.org/content/247/4/1257.full.html#ref-list-1
This article cites 0 references, 0 of which can be accessed free at
by guest on Novem
ber 19, 2018http://w
ww
.jbc.org/D
ownloaded from