effects of porosity on mechanical properties of aluminum welds
TRANSCRIPT
Effects of Porosity on Mechanical Properties of Aluminum Welds
increasing area fractions of porosify in a weld cross section
reduces strength, and fine porosity—when present in sufficient
quantity to contribute a total area comparable to that of large
pores—effects a loss in strength as much as do large pores
BY J. F. R U D Y A N D E. J. R U P E R T
ABSTRACT. This experimental program considered the effects of porosity in 2014 and 2219 aluminum alloy d-c gas tungsten-arc welds, the porosity was developed by moisture and/ or hydrogen contamination of helium shielding gas. Porosity with individual pores ranging from 0.005 to 0.20 in. in diameter was developed in a continuous pattern in 24 in. long welds. Welds were made in the flat, horizontal and vertical positions on x / 4 and 3 / 4 in. thick material. Pore sizes, shapes, and total amounts were measured on fracture surfaces, and X-ray films; these measurements were related to mechanical properties in the transverse and longitudinal weld axis, for bead-on and bead-shaved conditions.
Increasing the area fractions of porosity in a weld cross section reduces strength; fine porosity ( < yM th size), when present in sufficient numbers to contribute a total area comparable to large pores, appears to effect the loss in strength as much as do large pores. Longitudinal axis tests indicate a less significant effect of porosity when some heat-affected metal is permitted in the test cross section. Data are also given for the loss in fatigue strength-life with increasing porosity.
Mechanical property data from artificially defected (metal removal by drilling and slotting) welds in 2014-T6 are compared with the porous weld data. The simpler defect geometry of drilled welds allows derivation of simple area loss vs. strength loss relationships, giving quantitative support to porous weld data generalizations. In the final analysis, strength loss is shown to be directly proportional
J. F. RUDY, formerly with the Denver Division of Martin Marietta Corp.. is with General Electric Co.. Eveiidale, Ohio, and E. J. RUPERT is Unit Head, Advanced Manufacturing Technology. D-^nv^r D'vl-sion, Martin Marietta Corp., Denver, Colo.
Based on paper presented at the AWS 48th Annual Meeting held in Detroit, Mich., during April 24 to 28. 1967.
to loss in cross section area.' Comment is included on methods of
obtaining intentional porosity, since these techniques contribute to an understanding of practical causes of porosity as obtained in production welding.
Introduction
This study addresses the problem of defining satisfactory criteria for acceptance or rejection of defects in a luminum welds. The whole challenge of defining such criteria lies in the recognition that they cannot be considered independently of such factors as the cost or urgency of the items being inspected, the design requirement of the weld, and the impact of the repair and scrappage alternatives.
: ' * * • • • '
To clarify these considerations, it is evident that t ime-consuming and expensive inspection prodcedures are not warranted for low cost details that can be thrown away for a fraction of the cost of a very detailed inspection. Conversely, an appreciable effort can be economically directed toward the more accurate assessment and inspection of details having high economical value, as are characteristic of launch vehicle programs. Also, it is not enough to be able to state that a given defect in an expensive fabrication is undesirable. The pertinent question is, "Is that defect as it exists at the t ime of inspection more or less desirable than a repaired weld?" Complicating the logic a little more , "Are
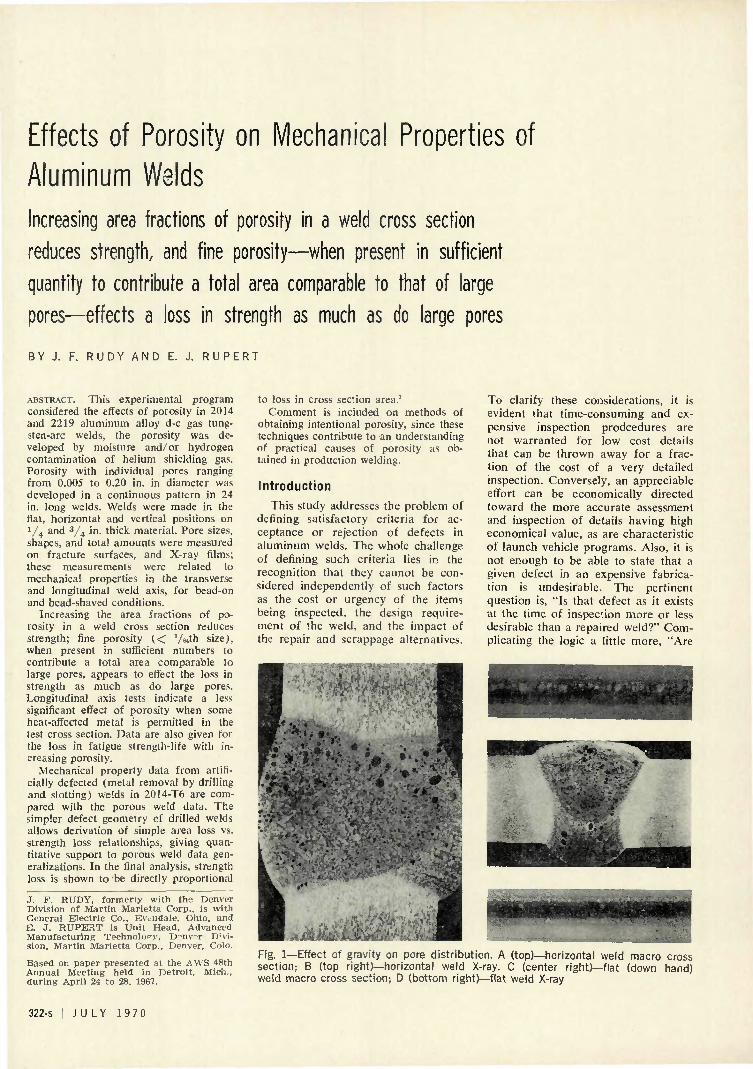
Fig. 1—Effect of gravity on pore distribution. A (top)—horizontal weld macro cross section; B (top right)—horizontal weld X-ray. C (center right)—flat (down hand) weld macro cross section; D (bottom right)—flat weld X-ray
322-s I J U L Y 1970
WATER BUBBLEK
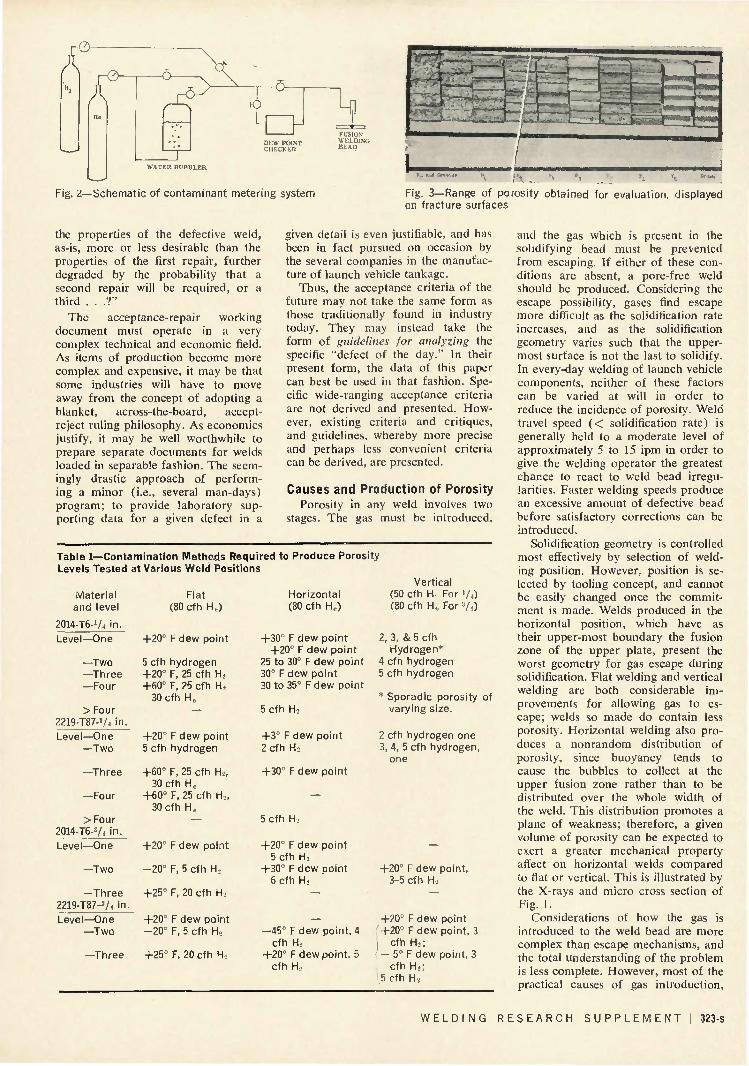
Fig. 2—Schematic of contaminant metering system Fig. 3—Range of porosity obtained for evaluation, displayed on fracture surfaces
the properties of the defective weld, as-is, more or less desirable than the properties of the first repair, further degraded by the probability that a second repair will be required, or a third . . .?"
The acceptance-repair working document must operate in a very complex technical and economic field. As items of production become more complex and expensive, it may be that some industries will have to move away from the concept of adopting a blanket, across-the-board, accept-reject ruling philosophy. As economics justify, it may be well worthwhile to prepare separate documents for welds loaded in separable fashion. The seemingly drastic approach of performing a minor (i.e., several man-days) program; to provide laboratory supporting data for a given defect in a
given detail is even justifiable, and has been in fact pursued on occasion by the several companies in the manufacture of launch vehicle tankage.
Thus, the acceptance criteria of the future may not take the same form as those traditionally found in industry today. They may instead take the form of guidelines for analyzing the specific "defect of the day." In their present form, the data of this paper can best be used in that fashion. Specific wide-ranging acceptance criteria are not derived and presented. However, existing criteria and critiques, and guidelines, whereby more precise and perhaps less convenient criteria can be derived, are presented.
Causes and Production of Porosity Porosity in any weld involves two
stages. The gas must be introduced.
Table 1—Conta mination Methods Required to Produce Porosity Levels Tested at Various Weld Position
Mater ia l and level
2014-T6-1/, in .
Level—One
—Two —Three —Four
> Four 2219-T87-V4 in .
Level—One —Two
—Three
—Four
> F o u r 2014-T6-3/4 i n .
Level—One
—Two
—Three 2219-T87-7* in . Level—One
—Two
—Three
Flat (80 cfh H.)
+20° F dew point
5 cfh hydrogen +20° F, 25 cfh H. +60° F, 25 cfh H,
30 c fh H c
—
+20° F dew point 5 cfh hydrogen
+60° F, 25 cfh H,, 30 cfh H c
+60° F, 25 cfh Hi, 30 cfh H e
—
+20° F dew point
- 2 0 ° F, 5 cfh Hj
+25° F, 20 cfh H,
+20° F dew point - 2 0 ° F, 5 cfh H,
+25° F, 20 cfh H,
s
Horizontal (80 cfh He)
+30° F dew point +20° F dew point
25 to 30° F d e w point 30° F dew point 30 to 35° F dew point
5 cfh Hs
+ 3 ° F dew point 2 cfh Hs
+30° F dew point
—
5 c f h H2
+20° F d e w point 5 cfh H,
+30° F dew point 6 cfh H,
—
— —45° F dew point, 4
cfh Hs +20° F d e w point. 5
cfh R.
Vert ical (50 cfh H For y 4 ) (80 cfh H« For : ' /4)
2 ,3 , & 5 c f h Hydrogen*
4 cfh hydrogen 5 cfh hydrogen
* Sporadic porosity of vary ing size.
?. cfh hydrogen one 3, 4, 5 cfh hydrogen,
one
—
+20° F dew point, 3-5 cfh Hs
—
+20° F dew point +20° F d e w point, 3
cfh Hs; — 5° F dew point, 3
cfh H ; ; 5 cfh Hs
and the gas which is present in the solidifying bead must be prevented from escaping. If either of these conditions are absent, a pore-free weld should be produced. Considering the escape possibility, gases find escape more difficult as the solidification rate increases, and as the solidification geometry varies such that the uppermost surface is not the last to solidify. In every-day welding of launch vehicle components, neither of these factors can be varied at will in order to reduce the incidence of porosity. Weld travel speed ( < solidification rate) is generally held to a moderate level of approximately 5 to 15 ipm in order to give the welding operator the greatest chance to react to weld bead irregularities. Faster welding speeds produce an excessive amount of defective bead before satisfactory corrections can be introduced.
Solidification geometry is controlled most effectively by selection of welding position. However, position is selected by tooling concept, and cannot be easily changed once the commitment is made. Welds produced in the horizontal position, which have as their upper-most boundary the fusion zone of the upper plate, present the worst geometry for gas escape during solidification. Flat welding and vertical welding are both considerable improvements for allowing gas to escape; welds so made do contain less porosity. Horizontal welding also produces a nonrandom distribution of porosity, since buoyancy tends to cause the bubbles to collect at the upper fusion zone rather than to be distributed over the whole width of the weld. This distribution promotes a plane of weakness; therefore, a given volume of porosity can be expected to exert a greater mechanical property affect on horizontal welds compared to flat or vertical. This is illustrated by the X-rays and micro cross section of Fig. I.
Considerations of how the gas is introduced to the weld bead are more complex than escape mechanisms, and the total understanding of the problem is less complete. However, most of the practical causes of gas introduction,
W E L D I N G R E S E A R C H S U P P L E M E N T | 323-S
I — • - I I I • ' ' I I I I L_
i • : $ -s
\ < • 1 E-f 2
O -U o a -
Q
O U t i
T—;—I—i—I—i—I—r""I T—i—r—i- - T — • ouv aamna 1 OHV aOHVT
-r o o o o o o o o o o o o o o o i ^ j ^ . j i . •—• •—> •—> '—• •—• O J C O t - L O l f i ^ C O N o o o o ^ t ' J t^J ,-— ' I 1—' * • ' t ' J ^ . u .
o o o o o o o o o
3= UJ
4 HOVilOA OHV •LNaHHiTD OHV AiDaWOHd
324-s ] J U L Y 1 9 7 0
as determined by empirical problem-cure experiences, appear to depend on moisture or hydrocarbons as the fundamental cause. Other contaminants such as silicone-containing lubricants and even lead smears have been shown to cause porosity. However, these are not normally present in the practical production problems encountered.
The most frequent carrier of moisture into the welding puddle appears to be surface contamination, either of the metals to be joined or of the filler metal. Contamination is usually in the form of a hydrated oxide or (in the case of chromate conversion coatings which are introduced for corrosion protection) a hydrated chromate. In recognition of this problem, most procedures for high quality aluminum welding involve extensive surface cleaning steps just prior to welding. The more reliable of these cleaning procedures are those which involve a non-smearing mechanical removal of the surfaces to be melted as the last preparation, and immediately prior to welding. An important characteristic of mechanical removal techniques is that no sharp corners or burrs can remain. Such burrs, for reasons which probably have to do with a high surface-to-volume ratio, have been noted to cause irregular inclusions, called dross or oxide, in the weld bead. The porosity caused by inadequate removal of hydrated surface contaminants is also irregular and drossy, as opposed to spherical shapes suggesting gas contamination.
The objective of this experiment was to measure the effects of porosity on mechanical properties of welds. In order to obtain sufficient repetition for statistical validity, means were required for consistent and predictable introduction of porosity into experimental welds. The means chosen for artificial introduction of porosity were centered on moisture and hydrogen contaminants. Weld contamination was first attempted via control of surface of filler metal. A contamination gradient was obtained by each of the following wire treatments applied to a given as-received wire:
1. Alkaline solution cleaned. 2. Baked in air convection furnace
at 600° F for 4 hr. 3. Electrolytically charged with hy
drogen. 4. Exposed in boiling water from 4
to 96 hr. 5. Humidity cabinet exposed at
160° F f o r 4 h r . 6. Anodized with a range of
parameters from 5 to 25 amp/sq in. current density, for exposure periods from 1 to 5 min with varying bath temperatures.
Those treatments, which would be expected to introduce moisture contamination to the surface (humidity exposure and anodizing) did provide porous welds. Furthermore, the porosity patterns obtained were of irregular shape, similar to those found in practical production welding of aluminum. However, these techniques had the disadvantage of inadequate predictability of porosity level.
In order to obtain a more predictable sampling of a given porosity level, other more reproducible methods were sought. The method finally selected, by virtue of its predictability and uniform distribution over the whole length of a weld panel, was to meter moisture or hydrogen additions to the inert gas shielding. This was accomplished with the apparatus shown in Fig. 2. This plumbing arrangement in the inert gas line allowed the metering of a portion of the helium through a water bubbler, and back into the main stream. The volume mixture of "bubbled" vs. "tank" helium provided an effective control of the dew point of the gas. Dew point was measured directly by sampling the gas at the port shown, immediately prior to entry into the torch. For some levels of porosity it was found necessary to meter some tank hydrogen in place of, or along with, the moisture carrying helium. These contamination means were successful in providing a wide range of porosity. This range is best illustrated in Fig. 3, showing a number of porous weld metal fracture surfaces, arranged with increasing porosity, from right to left.
Levels of contamination introduced to obtain porosity for the various alloy, thickness, and welding position combinations are shown in Table 1. The first level was generally obtained by metering moisture to a dew point
of +20° F . Further contamination was obtained by metering more moisture, or mixing hydrogen in with the moisture. Although not satisfactorily indicated in Table 1, horizontal welds generally gave more porosity for a given level of contamination than did flat welds. In the opposite sense, it was difficult or impossible to obtain a large amount of porosity at any practical level of contamination for the vertical position. Contamination with this welding position caused excessive arc instability before introducing appreciable porosity, suggesting that the gas escape from a vertical welding puddle is quite efficient.
This system of producing porosity by shielding gas contamination was apparently satisfactory. However, an important undesirable aspect of the porosity pattern became apparent during the analysis of mechanical property change. On attempting to classify porosity patterns, it was noted that shielding gas contamination tended to produce a very large number of very small pores, so frequent and so small that a precise characterization system was difficult.
Another complication of shielding gas contamination is the influence of gas composition on electrical characteristics of the arc. In general, the addition of moisture tends to make the arc resistance increase, calling for a higher arc voltage in order to maintain an approximately constant arc length. It was often necessary to reduce current in order to compensate for the more intense arc, holding an approximately consistent puddle and bead shape, for comparable contaminated and clean welds. Hydrogen contaminated arcs were somewhat less unstable. Combinations of contamination introduced complex changes on the arc which defy simple generaliza-
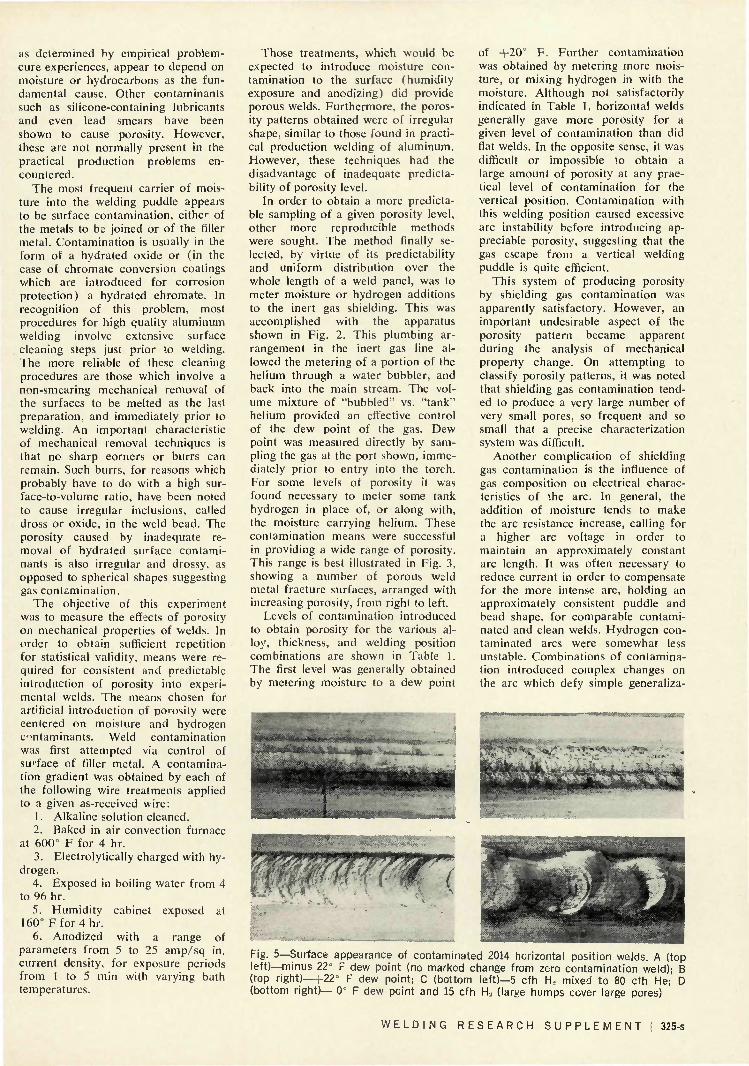
Fig. 5—Surface appearance of contaminated 2014 horizontal position welds. A (top left)—minus 22° F dew point (no marked change from zero contamination weld); B (top right)—h22° F dew point; C (bottom left)—5 cfh H, mixed to 80 cth He; D (bottom right)— 0" F dew point and 15 cfh H2 (large humps cover large pores)
W E L D I N G R E S E A R C H S U P P L E M E N T I 325-s
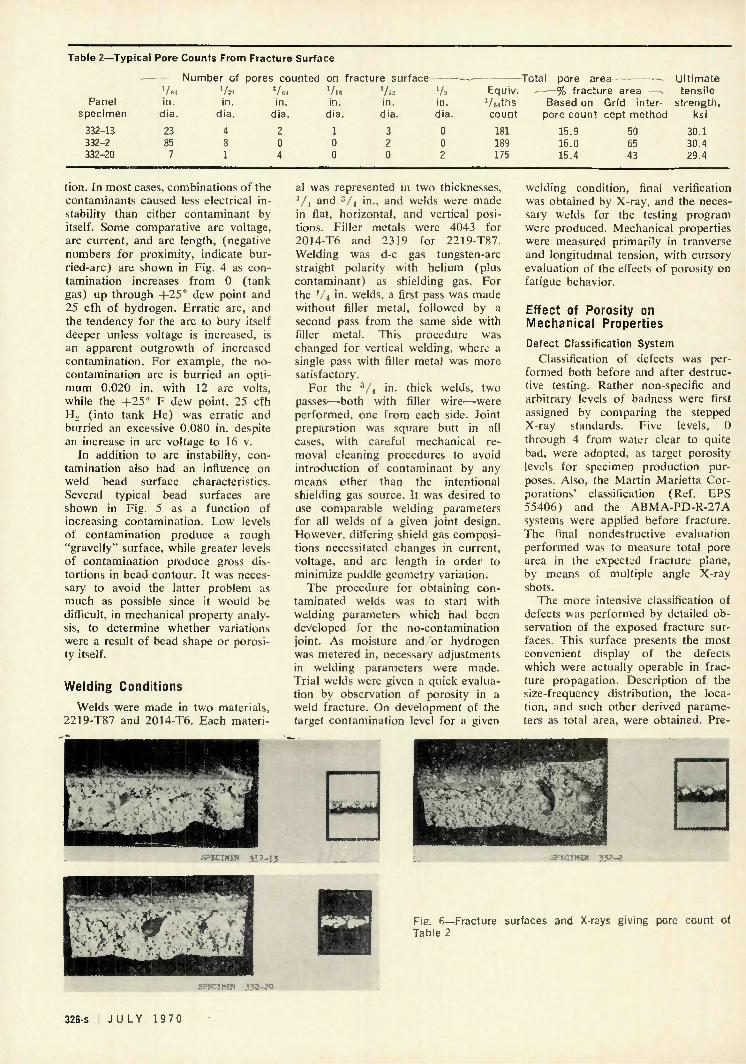
Table 2—Typical Pore Counts From Fracture Surface
Number of pores counted on fracture surface —.—
Panel specimen
332-13 332-2 332-20
v« in. dia.
23 85 7
Va in.
d ia.
4 8 1
VM in .
dia.
2 0 4
Vie in.
d ia.
1 0 0
Va in .
dia.
3 2 0
'A in . dia.
0 0 2
— Total pore area— —. Ultimate Equiv. . % fracture area . tensile '/siths Based on Grid inter- strength, count pore count cept method ksi
181 15.9 50 30.1 189 16.0 65 30.4 175 15.4 43 29.4
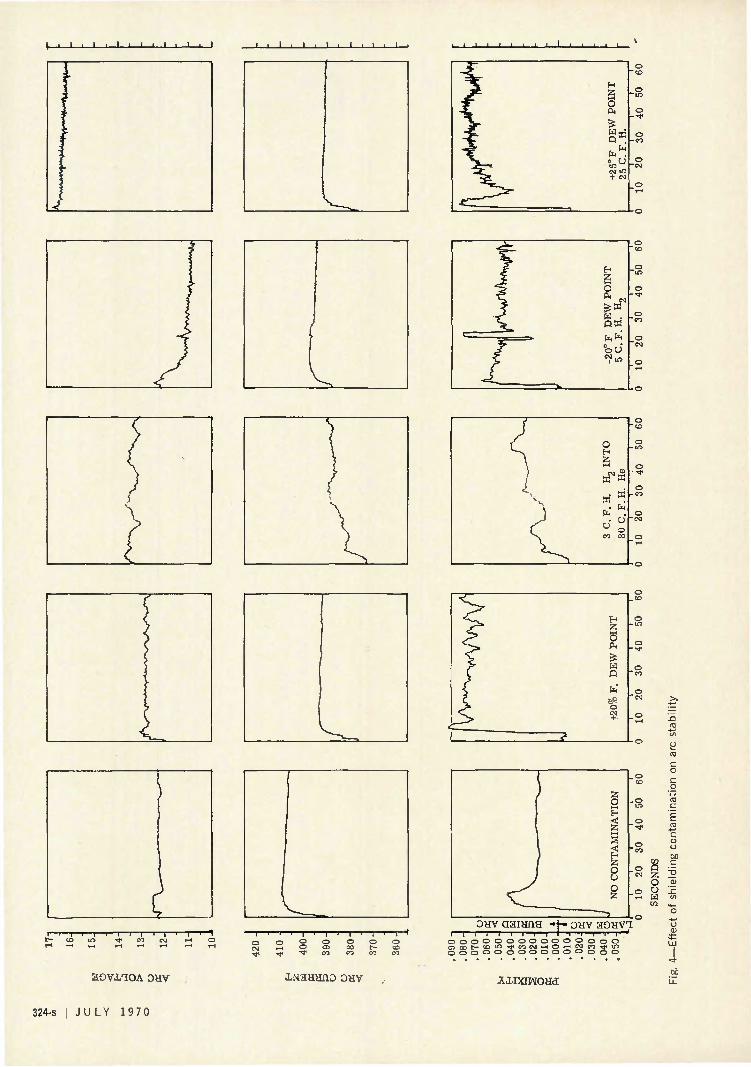
tion. In most cases, combinat ions of the contaminants caused less electrical instability than either contaminant by itself. Some comparat ive arc voltage, arc current , and arc length, (negative numbers for proximity, indicate bur-ried-arc) are shown in Fig. 4 as contamination increases from 0 ( tank gas) up through + 2 5 ° dew point and 25 cfh of hydrogen. Errat ic arc, and the tendency for the arc to bury itself deeper unless voltage is increased, is an apparent outgrowth of increased contaminat ion. For example, the no-contaminat ion arc is burried an optimum 0.020 in. with 12 arc volts, while the + 2 5 ° F dew point, 25 cfh H 2 ( into tank He) was erratic and burried an excessive 0.080 in. despite an increase in arc voltage to 16 v.
In addition to arc instability, contamination also had an influence on weld bead surface characteristics. Several typical bead surfaces are shown in Fig. 5 as a function of increasing contaminat ion. Low levels of contaminat ion produce a rough "gravelly" surface, while greater levels of contaminat ion produce gross distortions in bead contour. It was necessary to avoid the latter problem as much as possible since it would be difficult, in mechanical property analysis, to determine whether variations were a result of bead shape or porosity itself.
Welding Conditions
Welds were made in two materials, 2219-T87 and 2014-T6. Each materi
al was represented in two thicknesses, 1/4 and 3 / 4 in., and welds were made in flat, horizontal, and vertical positions. Filler metals were 4043 for 2014-T6 and 2319 for 2219-T87. Welding was d-c gas tungsten-arc straight polarity with helium (plus contaminant) as shielding gas. For the V4 in. welds, a first pass was made without filler metal, followed by a second pass from the same side with filler metal. This procedure was changed for vertical welding, where a single pass with filler metal was more satisfactory.
For the 3 / 4 in. thick welds, two passes—both with filler wire—were performed, one from each side. Joint preparation was square butt in all cases, with careful mechanical removal cleaning procedures to avoid introduction of contaminant by any means other than the intentional shielding gas source. It was desired to use comparable welding parameters for all welds of a given joint design. However, differing shield gas compositions necessitated changes in current, voltage, and arc length in order to minimize puddle geometry variation.
The procedure for obtaining contaminated welds was to start with welding parameters which had been developed for the no-contamination joint. As moisture and or hydrogen was metered in, necessary adjustments in welding parameters were made. Trial welds were given a quick evaluation by observation of porosity in a weld fracture. On development of the target contamination level for a given
welding condition, final verification was obtained by X-ray, and the necessary welds for the testing program were produced. Mechanical properties were measured primarily in tranverse and longitudinal tension, with cursory evaluation of the effects of porosity on fatigue behavior.
Effect of Porosity on Mechanical Properties Defect Classification System
Classification of defects was performed both before and after destructive testing. Rather non-specific and arbitrary levels of badness were first assigned by comparing the stepped X-ray standards. Five levels, 0 through 4 from water clear to quite bad, were adopted, as target porosity levels for specimen production purposes. Also, the Martin Marietta Corporations' classification (Ref. EPS 55406) and the ABMA-PD-R-27A systems were applied before fracture. The final nondestructive evaluation performed was to measure total pore area in the expected fracture plane, by means of multiple angle X-ray shots.
The more intensive classification of defects was performed by detailed observation of the exposed fracture surfaces. This surface presents the most convenient display of the defects which were actually operable in fracture propagation. Description of the size-frequency distribution, the location, and such other derived parameters as total area, were obtained. Pre-
Fia. fi—Fracture surfaces and X-rays giving pore count of Table 2
SPECIE '1Z-2Q
326-s J U L Y 1970
liminary analysis of these data indicate that mechanical properties did not depend primarily on such factors as size distribution and location, but appeared to depend on the'summation of the defect area reduction to the fracture surface area.
1A in. Transverse Tension Results
The most promising system for classifying defects, and one which gave a reasonably valid basis for plotting defect vs. mechanical properties, was to count the actual frequency and size of pores which appeared in the fracture surface of the failed specimen. This procedure may appear unreasonable since it is not, ol course, a nondestructive test. However, it does provide, by virtue of more precise defect description, a basis for obtaining an empirical relationship between defect and behavior.
Three examples of each welding condition-porosity level panel weld were taken representing the highest, lowest, and near-average values of the many tensiles given from the weld. Each fracture surface was examined exhaustively and data of the type illustrated in Table 2 were obtained. The particular samples used for Table 2 came from 2014-T6, l / 4 in. thick, horizontal position, tested with bead on and contaminated to porosity "level 4". The three fracture surfaces showed defects as tabulated, with failure surfaces and X-rays pictures in Fig. 6. Specimen number 332-13, for example, contained 23 pores of 1 / 6 4
in. diameter, 4 pores of V32 in., 2 pores of 3 /6 4 in., 1 pore of V10 in., and 3 pores of 3 / 3 2 in. The term "equivalent Vinths pores" converts the cross sectional area of all the pores listed to the number of 1/M in. pores which would, by themselves, contribute the same total area. For example, a single Vie '"• P o r e c o n " tributes the same area as sixteen 1 ,;4
in. pores, and thus the number of 1 /1 8
in. pores is multiplied by 16 to obtain its contribution to the " V M P o r e a r e a
equivalents."
Other systems for summing effects of various pore sizes were tried, but the one based on cross sectional area met with greatest success as a tool for predicting mechanical behavior. One shortcoming of this system, as will be evident in analyzing the plotted data (particularly Figs. 7-11), is that pores of size less than V i ;4 in. were not considered. This omission, not important in normal welds, apparently caused a sudden drop in mechanical properties in the low range of measured areas.
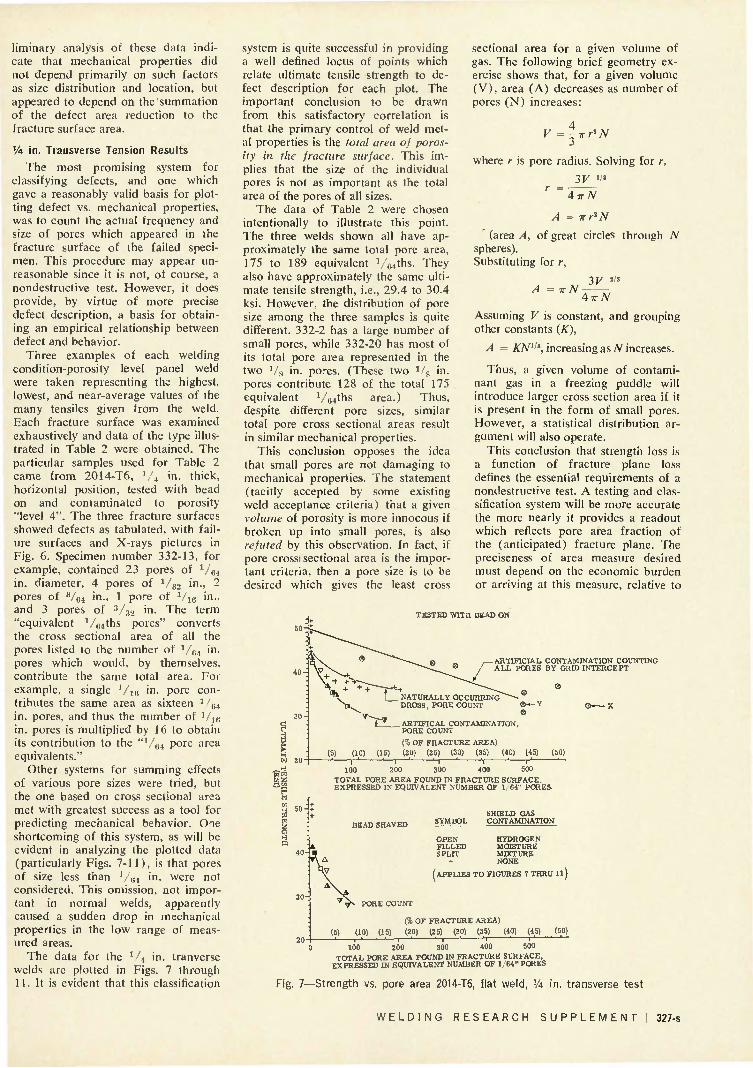
The data for the 1/i in. tranverse welds are plotted in Figs. 7 through 11. It is evident that this classification
system is quite successful in providing a well defined locus of points which relate ultimate tensile strength to defect description for each plot. The important conclusion to be drawn from this satisfactory correlation is that the primary control of weld metal properties is the tola! area of porosity in the fracture surface. This implies that the size of the individual pores is not as important as the total area of the pores of all sizes.
The data of Table 2 were chosen intentionally to illustrate this point. The three welds shown all have approximately the same total pore area, 175 to 189 equivalent l/«4ths- They also have approximately the same ultimate tensile strength, i.e., 29.4 to 30.4 ksi. However, the distribution of pore size among the three samples is quite different. 332-2 has a large number of small pores, while 332-20 has most of its total pore area represented in the two V s in. pores. (These two 1 / 8 in. pores contribute 128 of the total 175
sectional area for a given volume of gas. The following brief geometry exercise shows that, for a given volume (V) , area (A) decreases as number of pores (N) increases:
4 V = 5 T r3 TV
where r is pore radius. Solving for r,
3V »'»
equivalent 4ths area.) Thus. despite different pore sizes, similar total pore cross sectional areas result in similar mechanical properties.
This conclusion opposes the idea that small pores are not damaging to mechanical properties. The statement (tacitly accepted by some existing weld acceptance criteria) that a given volume of porosity is more innocous if broken up into small pores, is also refuted by this observation. In fact, if pore cross: sectional area is the important criteria, then a pore size is to be desired which gives the least cross
4TT/V
A = 7r r2 N
(area A, of great circles through N spheres). Substituting for r,
•xy 2/3
Air N
Assuming V is constant, and grouping other constants (K),
A = KN1,S, increasing as N increases.
Thus, a given volume of contaminant gas in a freezing puddle will introduce larger cross section area if it is present in the form of small pores. However, a statistical distribution argument will also operate.
This conclusion that strength loss is a function of fracture plane loss defines the essential requirements of a nondestructive test. A testing and classification system will be more accurate the more nearly it provides a readout which reflects pore area fraction of the (anticipated) fracture plane. The preciseness of area measure desired must depend on the economic burden or arriving at this measure, relative to
TESTED WITH BEAD OK
ARTIFICIAL CONTAMINATION COUNTING ALL PORES BY GRID INTERCEPT
(5) (10) —' 1 - 1 -
100
(15)
ART1FICAL CONTAMINATION. PORE COUNT
(% OF FRACTURE AREA) (20) (25) (30) (35) (40) (45) (50)
200 300 400 500
TOTAL PORE AREA FOUND IN FRACTURE SURFACE. EXPRESSED IN EQUIVALENT NUMBER OF 1 64" PORES
A*
BEAD SHAVED
OPEN FILLED SPLIT
SHIELD GAS CONTAMINATION'
HYDROGEN MOISTURE MIXTURE NONE
(APPLIES TO FIGURES 7 THRU l l )
PORE COUNT
(% OF FRACTURE AREA) (5) (10) (15) (20) (25) (30) (35) (40) (45) (50)
-r-0 100 200 300 400 500
TOTAL PORE AREA FOUND IN FRACTURE SURFACE, EXPRESSED IN EQUIVALENT NUMBER OF 1/64" PORES
Fig. 7—Strength vs. pore area 2014-T6, flat weld, VA in. transverse test
W E L D I N G R E S E A R C H S U P P L E M E N T 327-s
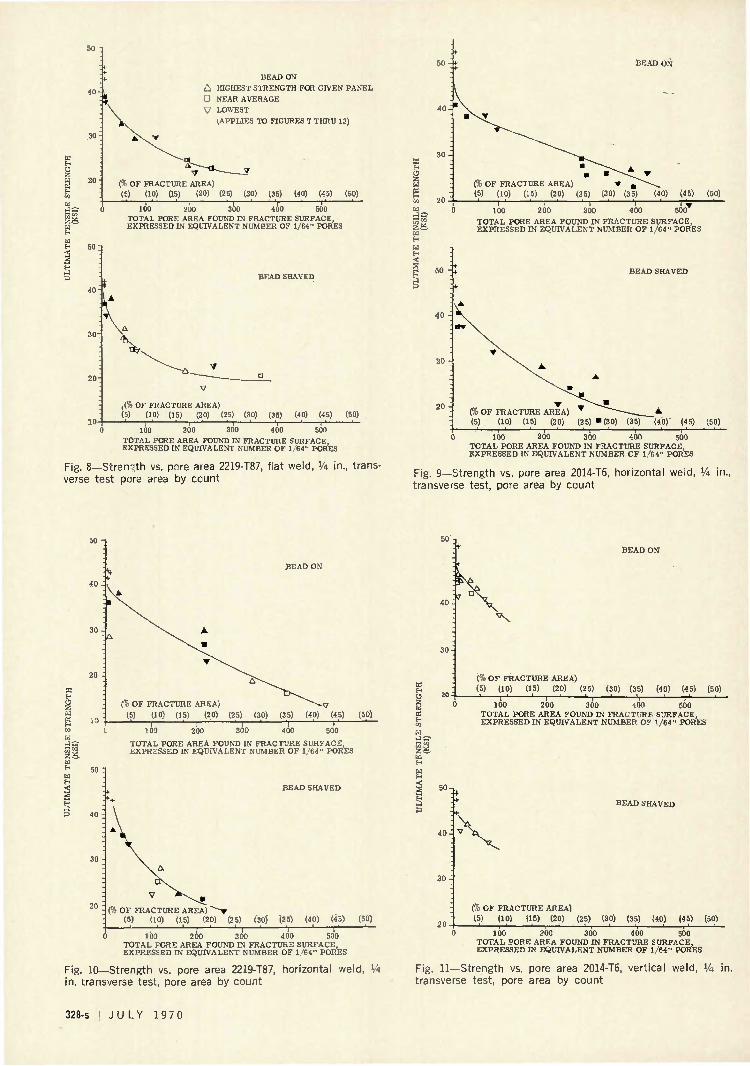
BEAD ON A HIGHEST STRENGTH FOR GIVEN PANEL D NEAR AVERAGE y LOWEST
(APPLIES TO FIGURES 7 THRU 13
50
g * TOTAL PORE AREA FOUND IN FRACTURE SURFACE, EXPRESSED IN EQUIVALENT NUMBER OF 1/64" PORES
BEAD SHAVED
I (% OF FRACTURE AREA) (5) (10) (15) (20) (25) (30) (35) (40) (45) (50)
TOTAL PORE AREA FOUND IN FRACTURE SURFACE EXPRESSED IN EQUIVALENT NUMBER OF 1, 64" PORES
Fig. 8—Strength vs. pore area 2219-T87, flat weld, % in., transverse test pore area by count
20
BEAD ON
(% OF FRACTURE AREA) T (5) (10) (15) (20) (25) (30) (35) (40) (45) (50)
a E -
a
40
3 0 -
w
TOTAL PORE AREA FOUND IN FRACTURE SURFACE, EXPRESSED IN EQUIVALENT NUMBER OF 1/64" PORES
BEAD SHAVED
(% OF FRACTURE AREA) (5) (10) (15) (20) (2 5) "(30) (35) (45) (50)
0 100 200 300 400 500 TOTAL PORE AREA FOUND IN FRACTURE SURFACE, EXPRESSED IN EQUIVALENT NUMBER OF 1/64" PORES
Fig. 9—Strength vs. pore area 2014-T6, horizontal weid, % in., transverse test, pore area by count
2* a
(% OF FRACTURE AREA) (5) (10) (15) (20) (25)
- ~ 1 — 400
1 —
500
(50)
20
TOTAL PORE AREA FOUND IN FRACTURE SURFACE. EXPRESSED IN EQUIVALENT NUMBER OF 1/64" PORES
BEAD SHAVED
•2* a
BEAD ON
! OF FRACTURE AREA) ^ ~ T (5) (10) (15) (20) (25) (30)' (35) (40) (45) (50)
40
30
20
OF FRACTURE AREA) (5) (10) (15) (20) (25) (30) (35) (40) (45) (50)
T T 100 200 300 400 500
TOTAL PORE AREA FOUND IN FRACTURE SURFACE, EXPRESSED IN EQUIVALENT NUMBER OF 1/64" PORES
BEAD SHAVED
(% OF FRACTURE AREA) (5) (10) (15) (20) (25) (30) (35) (40) (45) (50)
0 103 200 300 400 500 TOTAL FORE AREA FOUND IN FRACTURE SURFACE, EXPRESSED IN EQUIVALENT NUMBER OF 1/64" PORES
Fig. 10—Strength vs. pore area 2219-T87, horizontal weld, Vi in. transverse test, pore area by count
0 100 200 300 400 500 TOTAL PORE AREA FOUND IN FRACTURE SURFACE, EXPRESSED IN EQUIVALENT NUMBER OF 1/64" PORES
Fig. 11—Strength vs. pore area 2014-T6, vertical weld, VA transverse test, pore area by count
328-s J U L Y 1970
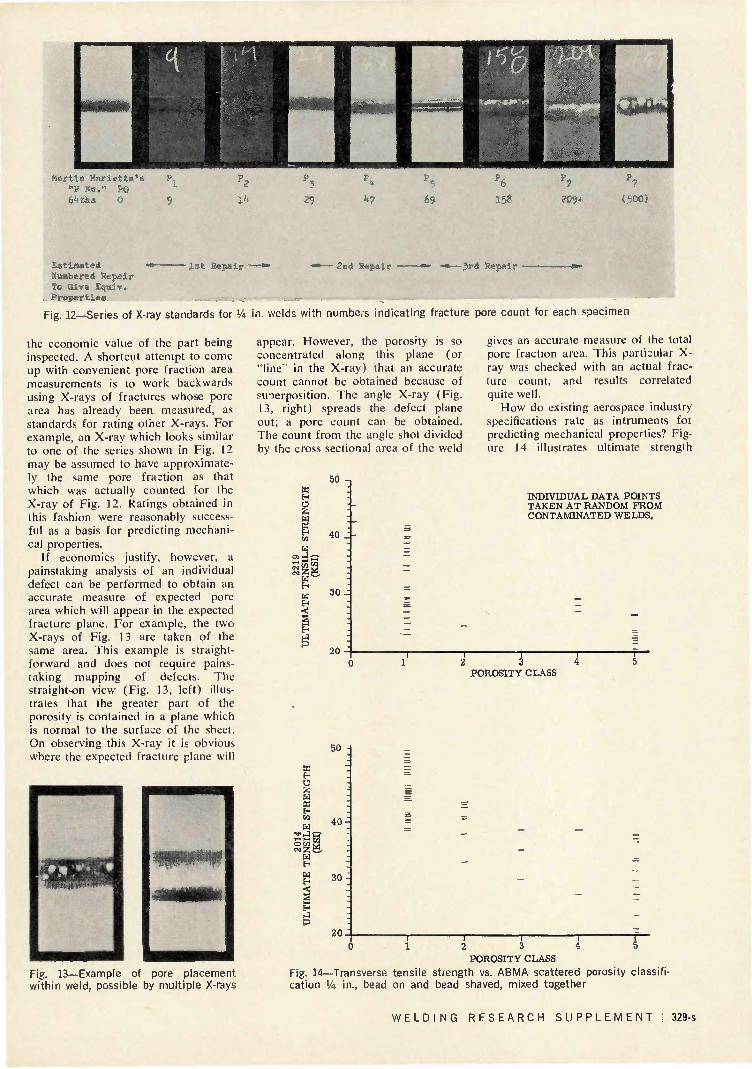
Estimated StarttMresl Repair To Give Eqniv,,
. Properties
Fig. 12—Series of X-ray standards for VA in. welds with numbers indicating fracture pore count for each specimen
the economic value of the part being inspected. A shortcut attempt to come up with convenient pore fraction area measurements is to work backwards using X-rays of fractures whose pore area has already been measured, as standards for rating other X-rays. For example, an X-ray which looks similar to one of the series shown in Fig. 12 may be assumed to have approximately the same pore fraction as that which was actually counted for the X-ray of Fig. 12. Ratings obtained in this fashion were reasonably successful as a basis for predicting mechanical properties.
If economics justify, however, a painstaking analysis of an individual defect can be performed to obtain an accurate measure of expected pore area which will appear in the expected fracture plane. For example, the two X-rays of Fig. 13 are taken of the same area. This example is straightforward and does not require painstaking mapping of defects. The straight-on view (Fig. 13, left) illustrates that the greater part of the porosity is contained in a plane which is normal to the surface of the sheet. On observing this X-ray it is obvious where the expected fracture plane will
appear. However, the porosity is so concentrated along this plane (or "line" in the X-ray) that an accurate count cannot be obtained because of superposition. The angle X-ray (Fig. 13, right) spreads the defect plane out; a pore count can be obtained. The count from the angle shot divided by the cross sectional area of the weld
K
g W
w u
HI* H H
50
40
30
P 20
gives an accurate measure of the total pore fraction area. This particular X-ray was checked with an actual fracture count, and results correlated quite well.
How do existing aerospace industry specifications rate as intruments foi predicting mechanical properties? Figure 14 illustrates ultimate strength
INDIVIDUAL DATA POINTS TAKEN AT RANDOM FROM CONTAMINATED WELDS.
T 1 2 3
POROSITY CLASS
50 H
W H O Z Ed
w w
w EH
W E->
• 4 P
40-
30
20
Fig. 13—Example of pore placement within weld, possible by multiple X-rays
1 2 3 4 5 POROSITY CLASS
Fig. 14—Transverse tensile strength vs. ABMA scattered porosity classification VA in., bead on and bead shaved, mixed together
W E L D I N G R E S E A R C H S U P P L E M E N T | 329-s
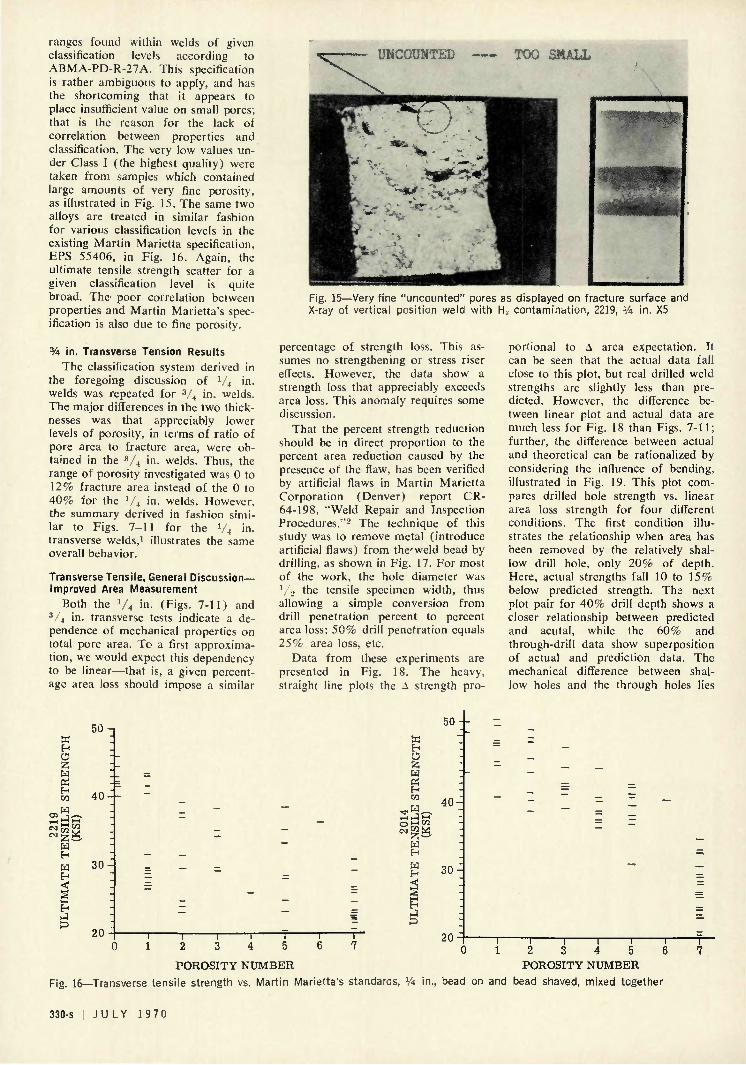
ranges found within welds of given classification levels according to ABMA-PD-R-27A. This specification is rather ambiguous to apply, and has the shortcoming that it appears to place insufficient value on small pores; that is the reason for the lack of correlation between properties and classification. The very low values under Class 1 (the highest quality) were taken from samples which contained large amounts of very fine porosity, as illustrated in Fig. 15. The same two alloys are treated in similar fashion for various classification levels in the existing Martin Marietta specification, EPS 55406, in Fig. 16. Again, the ultimate tensile strength scatter for a given classification level is quite broad. The poor correlation between properties and Martin Marietta's specification is also due to fine porosity.
% in. Transverse Tension Results The classification system derived in
the foregoing discussion of 1/i in. welds was repeated for 3 / 4 in. welds. The major differences in the two thicknesses was that appreciably lower levels of porosity, in terms of ratio of pore area to fracture area, were obtained in the 3 / 4 in. welds. Thus, the range of porosity investigated was 0 to 12% fracture area instead of the 0 to 40% for the V4 in. welds. However, the summary derived in fashion similar to Figs. 7-11 for the V4 in. transverse welds,1 illustrates the same overall behavior.
Transverse Tensile, General Discussion-Improved Area Measurement
Both the V4 in- (Figs. 7-11) and 3 / 4 in. transverse tests indicate a dependence of mechanical properties on total pore area. To a first approximation, we would expect this dependency to be linear—that is, a given percentage area loss should impose a similar
UNCOUNTED TOO SMALL
Fig. 15—Very fine "uncounted" pores as displayed on fracture surface and X-ray of vertical position weld with H : contamination, 2219, VA in. X5
percentage of strength loss. This assumes no strengthening or stress riser effects. However, the data show a strength loss that appreciably exceeds area loss. This anomaly requires some discussion.
That the percent strength reduction should be in direct proportion to the percent area reduction caused by the presence of the flaw, has been verified by artificial flaws in Martin Marietta Corporation (Denver) report CR-64-198, "Weld Repair and Inspection Procedures."-' The technique of this study was to remove metal (introduce artificial flaws) from thcweld bead by drilling, as shown in Fig. 17. For most of the work, the hole diameter was 1/i the tensile specimen width, thus allowing a simple conversion from drill penetration percent to percent area loss; 50% drill penetration equals 25% area loss, etc.
Data from these experiments are presented in Fig. 18. The heavy, straight line plots the A strength pro
portional to A area expectation. It can be seen that the actual data fall close to this plot, but real drilled weld strengths are slightly less than predicted. However, the difference between linear plot and actual data are much less for Fig. 18 than Figs. 7-11; further, the difference between actual and theoretical can be rationalized by considering the influence of bending, illustrated in Fig. 19. This plot compares drilled hole strength vs. linear area loss strength for four different conditions. The first condition illustrates the relationship when area has been removed by the relatively shallow drill hole, only 20% of depth. Here, actual strengths fall 10 to 15% below predicted strength. The next plot pair for 40% drill depth shows a closer relationship between predicted and acutal, while the 60% and through-drill data show superposition of actual and prediction data. The mechanical difference between shallow holes and the through holes lies
g « ra
,-t H >
EH
H
< EH • J
P
50
4 0 - -
3 0 -
20
POROSITY NUMBER
a g EH CO
_ . M ^
O H I O
H H W EH
< § 5
5 0 - -
40'
30
20 T r 2 3 4 5
POROSITY NUMBER Fig. 16 Transverse tensile strength vs. Martin Marietta's standards, VA in., bead on and bead shaved, mixed together
330-s J U L Y 1 9 7 0
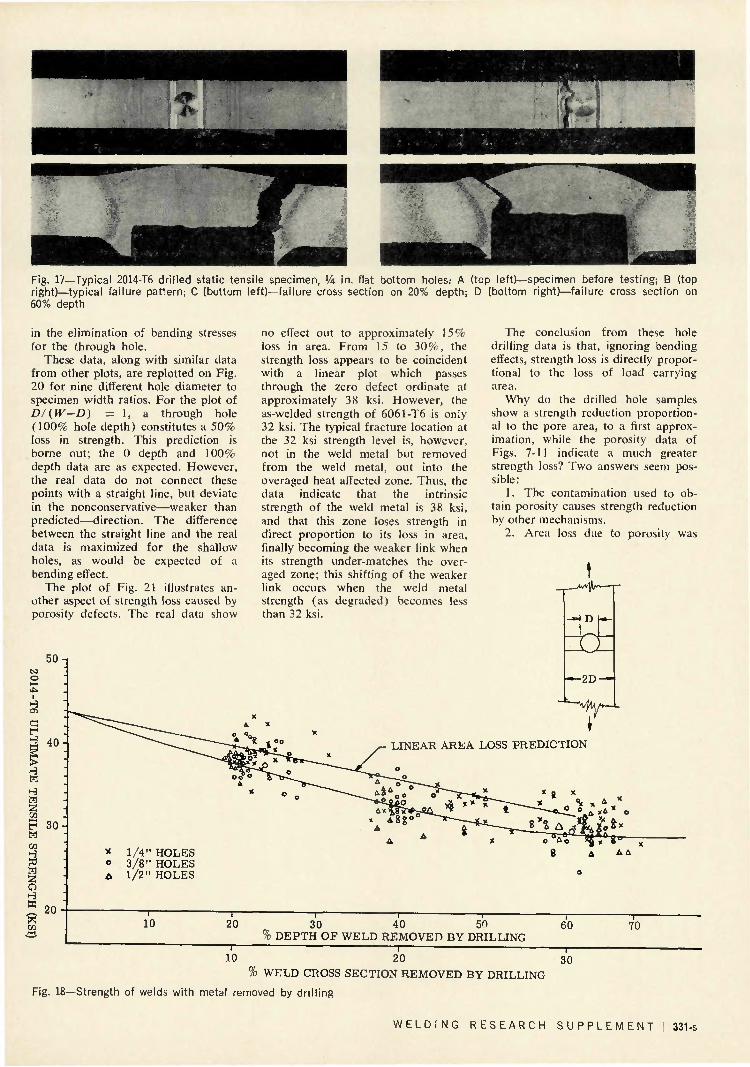
Fig. 17—Typical 2014-T6 drilled static tensile specimen, VA in. flat bottom holes: A (top left)—specimen before testing; B (top right)—typical failure pattern; C (bottom left)—failure cross section on 20% depth; D (bottom right)—failure cross section on 60% depth
in the elimination of bending stresses for the through hole.
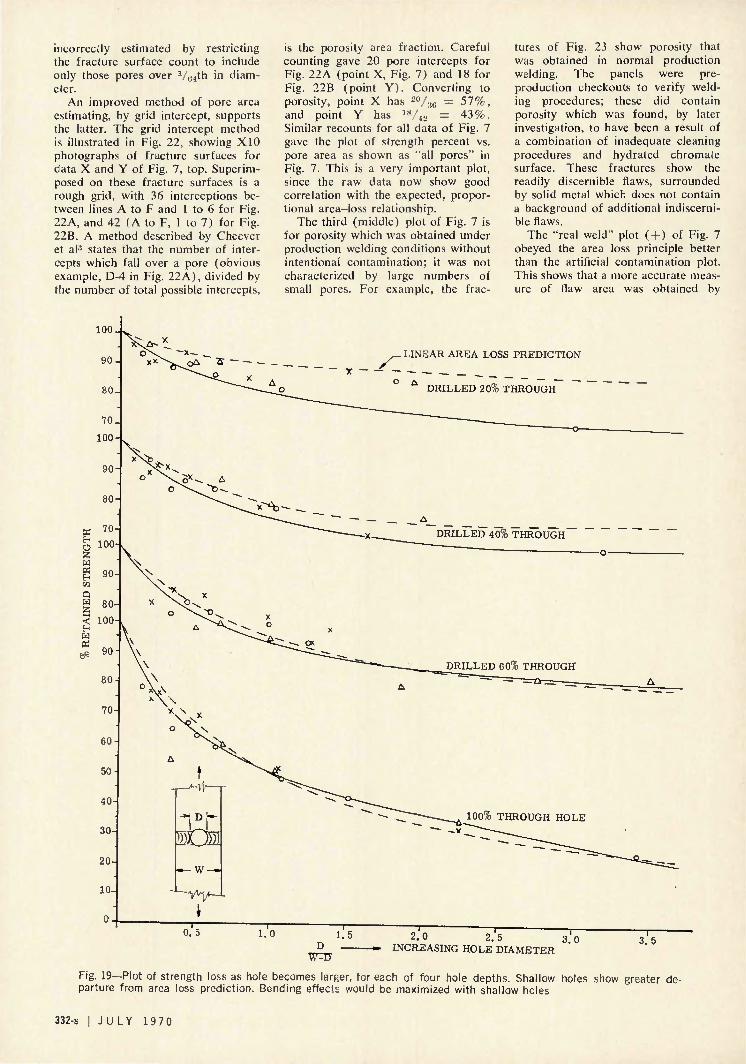
These data, along with similar data from other plots, are replotted on Fig. 20 for nine different hole diameter to specimen width ratios. For the plot of DI(W-D) = 1 , a through hole (100% hole depth) constitutes a 50% loss in strength. This prediction is borne out; the 0 depth and 100% depth data are as expected. However, the real data do not connect these points with a straight line, but deviate in the nonconservative—weaker than predicted—direction. The difference between the straight line and the real data is maximized for the shallow holes, as would be expected of a bending effect.
The plot of Fig. 21 illustrates another aspect of strength loss caused by porosity defects. The real data show
50- ,
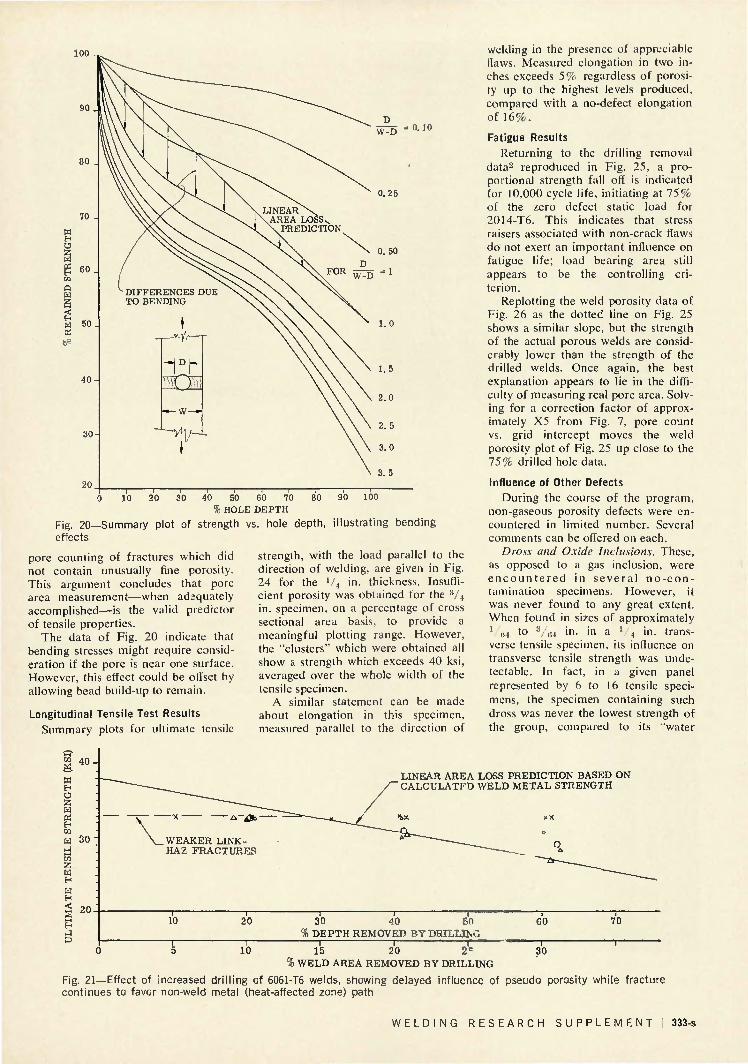
no effect out to approximately 15% loss in area. From 15 to 30%, the strength loss appears to be coincident with a linear plot which passes through the zero defect ordinate at approximately 38 ksi. However, the as-welded strength of 6061-T6 is only 32 ksi. The typical fracture location at the 32 ksi strength level is, however, not in the weld metal but removed from the weld metal, out into the overaged heat affected zone. Thus, the data indicate that the intrinsic strength of the weld metal is 38 ksi, and that this zone loses strength in direct proportion to its loss in area, finally becoming the weaker link when its strength under-matches the over-aged zone; this shifting of the weaker link occurs when the weld metal strength (as degraded) becomes less than 32 ksi.
The conclusion from these hole drilling data is that, ignoring bending effects, strength loss is directly proportional to the loss of load carrying area.
Why do the drilled hole samples show a strength reduction proportional to the pore area, to a first approximation, while the porosity data of Figs. 7-11 indicate a much greater strength loss? Two answers seem possible:
1. The contamination used to obtain porosity causes strength reduclion by other mechanisms.
2. Area loss due to porosity was
M/Y&r'—r~
>-3 W H
O H m 20 co
1"
LINEAR AREA LOSS PREDICTION
* 1/4" HOLES ° 3/8" HOLES A 1/2" HOLES
10 1 1 1 1 r -
20 30 40 50 60 % DEPTH OF WELD REMOVED BY DRILLING
1 1 P -
10 20 30
% WELD CROSS SECTION REMOVED BY DRILLING
Fig. 18—Strength of welds with metal removed by drilling
- 1 — 70
W E L D I N G R E S E A R C H S U P P L E M E N T 331-s
incorrectly estimated by restricting the fracture surface count to include only those pores over V^th in diameter.
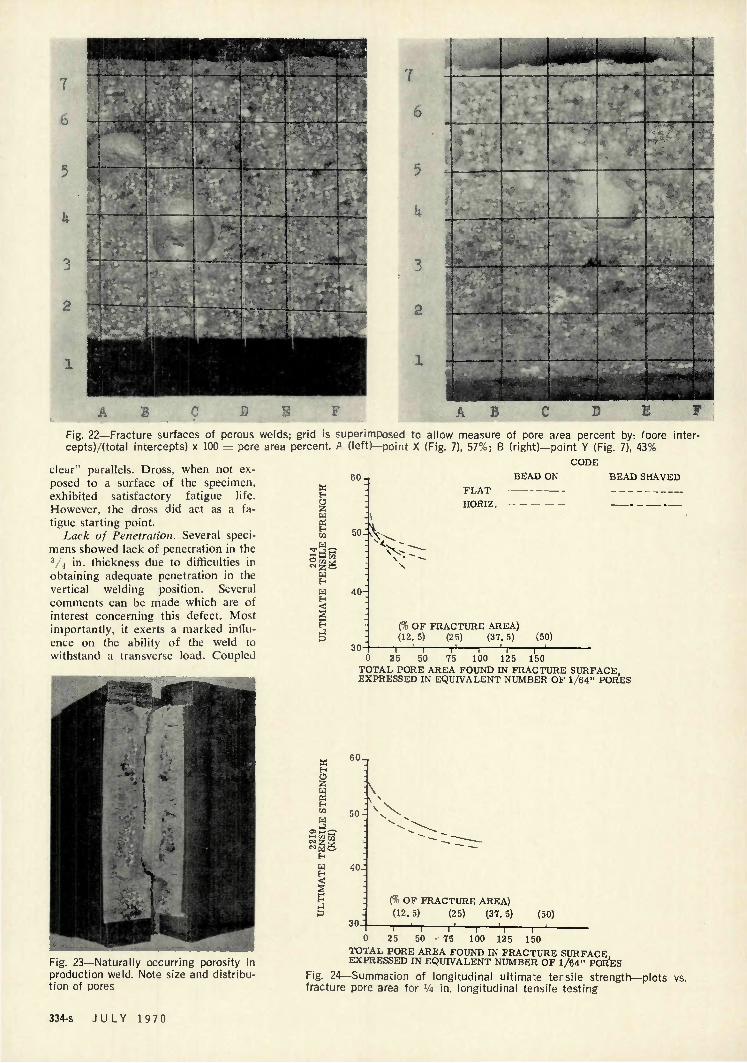
An improved method of pore area estimating, by grid intercept, supports the latter. The grid intercept method is illustrated in Fig. 22, showing X10 photographs of fracture surfaces for data X and Y of Fig. 7, top. Superimposed on these fracture surfaces is a rough grid, with 36 interceptions between lines A to F and 1 to 6 for Fig. 22A, and 42 (A to F, 1 to 7) for Fig. 22B. A method described by Cheever et al3 states that the number of intercepts which fall over a pore (obvious example, D-4 in Fig. 22A), divided by the number of total possible intercepts,
is the porosity area fraction. Careful counting gave 20 pore intercepts for Fig. 22A (point X, Fig. 7) and 18 for Fig. 22B (point Y) . Converting to porosity, point X has 2 0 / 8 6 = 57%, and point Y has 1«/42 = 4 3 % . Similar recounts for all data of Fig. 7 gave the plot of strength percent vs. pore area as shown as "all pores" in Fig. 7. This is a very important plot, since the raw data now show good correlation with the expected, proportional area-loss relationship.
The third (middle) plot of Fig. 7 is for porosity which was obtained under production welding conditions without intentional contamination; it was not characterized by large numbers of small pores. For example, the frac
tures of Fig. 23 show porosity that was obtained in normal production welding. The panels were pre-production checkouts to verify welding procedures; these did contain porosity which was found, by later investigation, to have been a result of a combination of inadequate cleaning procedures and hydrated chromate surface. These fractures show the readily discernible flaws, surrounded by solid metal which does not contain a background of additional indiscernible flaws.
The "real weld" plot ( + ) of Fig. 7 obeyed the area loss principle better than the artificial contamination plot. This shows that a more accurate measure of flaw area was obtained by
cA S - /~ LINEAR AREA LOSS PREDICTION
DRILLED 20% THROUGH
0.5 1.0 ! - 5 2 .0 2.5 3 0 » INCREASING HOLE DIAMETER
W^TJ
Fig. 19—Plot of strength loss as hole becomes larger, for each of four hole depths. Shallow holes show parture from area loss prediction. Bending effects would be maximized with shallow holes
3.5
greater de-
332-s J U L Y 1970
100
40 50 60 70 % HOLE DEPTH
Fig. 20—Summary plot of strength vs. hole depth, illustrating bending effects
pore counting of fractures which did not contain unusually fine porosity. This argument concludes that pore area measurement—when adequately accomplished—is the valid predictor of tensile properties.
The data of Fig. 20 indicate that bending stresses might require consideration if the pore is near one surface. However, this effect could be offset by allowing bead build-up to remain.
Longitudinal Tensile Test Results Summary plots for ultimate tensile
strength, with the load parallel to the direction of welding, are given in Fig. 24 for the V4 in. thickness. Insufficient porosity was obtained for the 3 / 4
in. specimen, on a percentage of cross sectional area basis, to provide a meaningful plotting range. However, the "clusters" which were obtained all show a strength which exceeds 40 ksi, averaged over the whole width of the tensile specimen.
A similar statement can be made about elongation in this specimen, measured parallel to the direction of
welding in the presence of appreciable Haws. Measured elongation in two inches exceeds 5% regardless of porosity up to the highest levels produced, compared with a no-defect elongation of 16%.
Fatigue Results Returning to the drilling removal
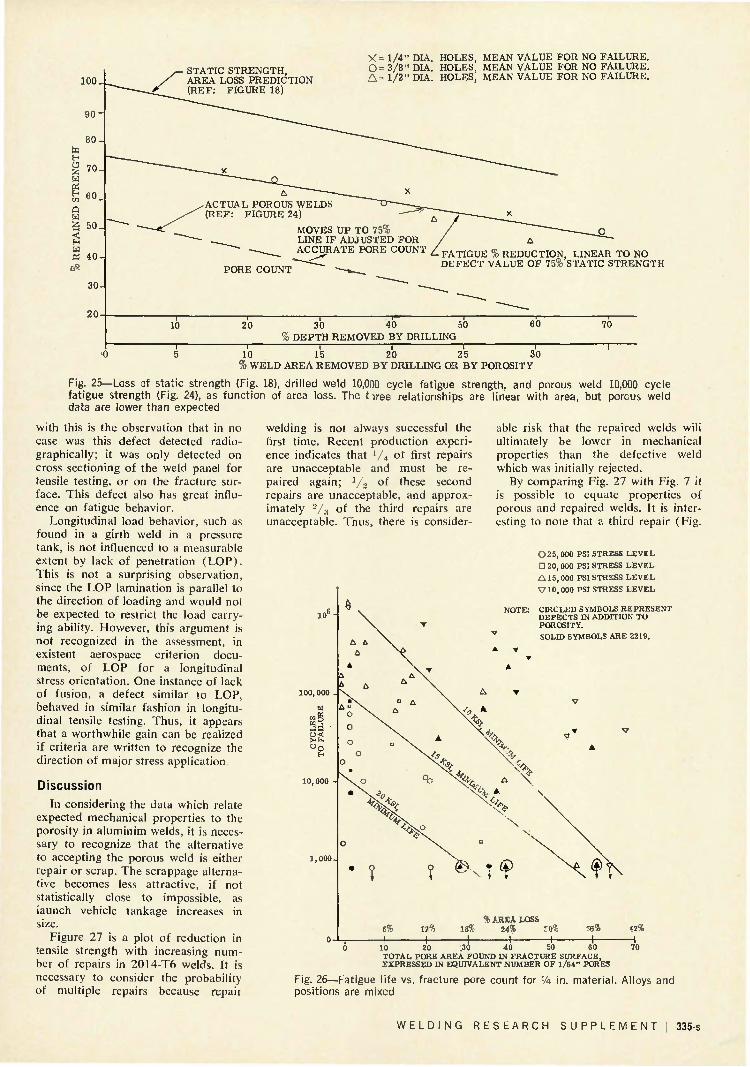
data2 reproduced in Fig. 25, a proportional strength fall off is indicated for 10,000 cycle life, initiating at 75% of the zero defect static load for 2014-T6. This indicates that stress raisers associated with non-crack flaws do not exert an important influence on fatigue life; load bearing area still appears to be the controlling criterion.
Replotting the weld porosity data of Fig. 26 as the dotted line on Fig. 25 shows a similar slope, but the strength of the actual porous welds are considerably lower than the strength of the drilled welds. Once again, the best explanation appears to lie in the difficulty of measuring real pore area. Solving for a correction factor of approximately X5 from Fig. 7, pore count vs. grid intercept moves the weld porosity plot of Fig. 25 up close to the 75% drilled hole data.
Influence of Other Defects During the course of the program,
non-gaseous porosity defects were encountered in limited number. Several comments can be offered on each.
Dross and Oxide Inclusions. These, as opposed to a gas inclusion, were e n c o u n t e r e d in severa l n o - c o n tamination specimens. However, it was never found to any great extent. When found in sizes of approximately 1 i;i to 3 ,,_, in. in a 1
4 in. transverse tensile specimen, its influence on transverse tensile strength was unde-tectable. In fact, in a given panel represented by 6 to 16 tensile specimens, the specimen containing such dross was never the lowest strength of the group, compared to its "water
LINEAR AREA LOSS PREDICTION BASED ON CALCULATFD WELD METAL STRENGTH
20 2* % WELD AREA REMOVED BY DRILLING
Fig. 21—Effect of increased drilling of 6061-T6 welds, showing delayed influence of pseudo porosity while fracture continues to favor non-weld metal (heat-affected zone) path
W E L D I N G R E S E A R C H S U P P L E M E N T 333-s
7
6
5
k
3
J 1
- i i ^ - l M
^
1
D i Fig. 22—Fracture surfaces of porous welds; grid is superimposed to allow measure of pore area percent by: (Dore inter-cepts)/(total intercepts) x 100 = pore area percent. P (left)—point X (Fig. 7), 57%; B (right)-
clear" parallels. Dross, when not exposed to a surface of the specimen, exhibited satisfactory fatigue life. However, the dross did act as a fatigue starting point.
Lack of Penetration. Several specimens showed lack of penetration in the 3 / 4 in. thickness due to difficulties in obtaining adequate penetration in the vertical welding position. Several comments can be made which are of interest concerning this defect. Most importantly, it exerts a marked influence on the ability of the weld to withstand a transverse load. Coupled
-point Y (Fig. CODE
7), 43%
60 W H
E CO
w
w
:| 50.
40-
^
30
BEAD ON BEAD SHAVED
FLAT
HORIZ.
V:-
(% OF FRACTURE AREA) (12.5) (25) (37.5)
"I L-| (50)
d^tWWXftr _ _ t Q l I ! _ .
^ ^ H j i ' 'spR j
I 1 | "}*:
&L .-:
H > *; • '' :4 s' 9 -
-1——i r 1 — i r 0 25 50 75 100 125 150
TOTAL PORE AREA FOUND DM FRACTURE SURFACE EXPRESSED IN EQUIVALENT NUMBER OF 1/64" PORES
W EH
g w K E H CO H
w H
§ EH • J P
6 0 _
A
50
40.
30
(% OF FRACTURE AREA) (12. 5) (25) (37. 5) (50)
Fig. 23—Naturally occurring porosity in production weld. Note size and distribution of pores
1 1—'-i 1" 1 h r— 0 25 50 75 100 125 150
TOTAL PORE AREA FOUND IN FRACTURE SURFACE EXPRESSED IN EQUIVALENT NUMBER OF 1/64" PORES
Fig. 24—Summation of longitudinal ultimate tersile strength—plots vs. fracture pore area for VA in. longitudinal tensile testing
334-s J U L Y 1970
30
20
STATIC STRENGTH, AREA LOSS PREDICTION (REF: FIGURE 18)
X = l / 4 " DIA. HOLES 0 = 3 / 8 " DIA. HOLES A= 1/2" DIA. HOLES,
MEAN VALUE FOR NO FAILURE. MEAN VALUE FOR NO FAILURE. MEAN VALUE FOR NO FAILURE.
PORE COUNT
MOVES UP TO 75% / LINE IF ADJUSTED FOR / ACCURATE PORE COUNT Z FATIGUE % REDUCTION, LINEAR TO NO ' DEFECT VALUE OF 75% STATIC STRENGTH
—r~ 10 20 30 40 50
% DEPTH REMOVED BY DRILLING 60 70
— I 1 1 1 1 -
10 15 20 25 30 % WELD AREA REMOVED BY DRILLING OR BY POROSITY
Fig. 25—Loss of static strength (Fig. 18), drilled weld 10,000 cycle fatigue strength, and porous weld 10,000 cycle fatigue strength (Fig. 24), as function of area loss. The t iree relationships are linear with area, but porcus weld data are lower than expected
with this is the observation that in no case was this defect detected radio-graphically; it was only detected on cross sectioning of the weld panel for tensile testing, or on the fracture surface. This defect also has great influence on fatigue behavior.
Longitudinal load behavior, such as found in a girth weld in a pressure tank, is not influenced to a measurable extent by lack of penetration (LOP). This is not a surprising observation, since the LOP lamination is parallel to the direction of loading and would not be expected to restrict the load carrying ability. However, this argument is not recognized in the assessment, in existent aerospace criterion documents, of LOP for a longitudinal stress orientation. One instance of lack of fusion, a defect similar to LOP, behaved in similar fashion in longitudinal tensile testing. Thus, it appears that a worthwhile gain can be realized if criteria are written to recognize the direction of major stress application
Discussion In considering the data which relate
expected mechanical properties to the porosity in aluminim welds, it is necessary to recognize that the alternative to accepting the porous weld is either repair or scrap. The scrappage alternative becomes less attractive, if not statistically close to impossible, as launch vehicle tankage increases in size.
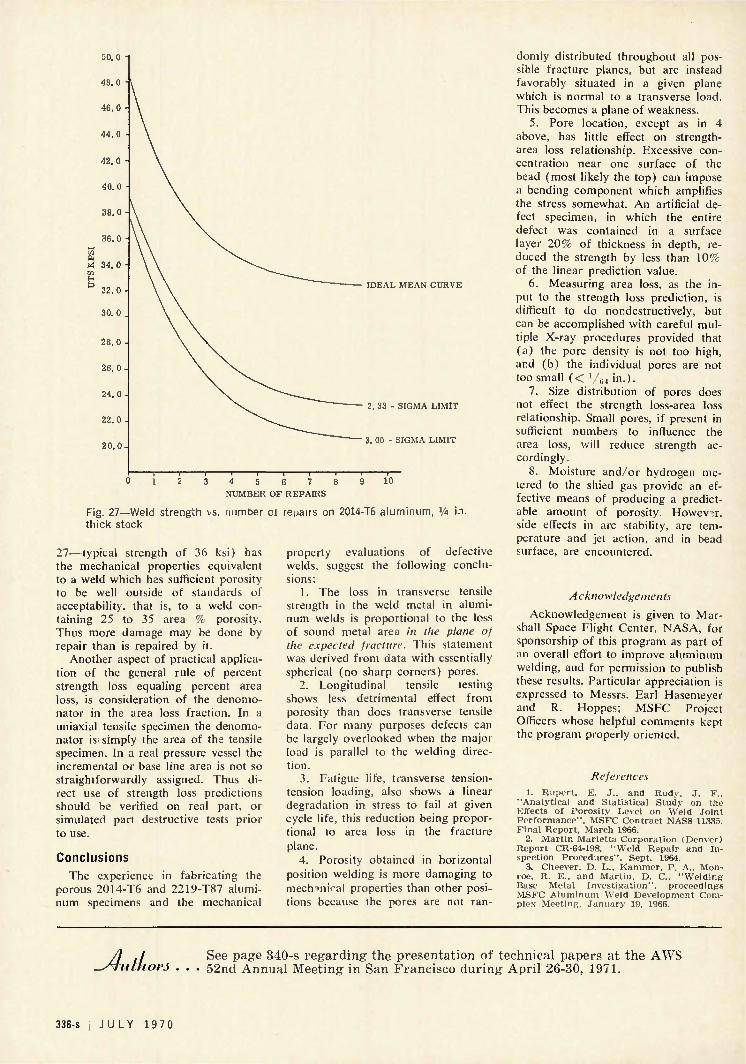
Figure 27 is a plot of reduction in tensile strength with increasing number of repairs in 2014-T6 welds. It is necessary to consider the probability of multiple repairs because repair
welding is not always successful the first time. Recent production experience indicates that V4 ol first repairs are unacceptable and must be repaired again; 1 / 2 of these second repairs are unacceptable, and approximately 2 / 3 of the third repairs are unacceptable. Thus, there is consider-
10' ,6-
100,000
J . u< °o
10,000
able risk that the repaired welds will ultimately be lower in mechanical properties than the defective weld which was initially rejected.
By comparing Fig. 27 with Fig. 7 it is possible to equate properties of porous and repaired welds. It is interesting to note that a third repair (Fig.
0 2 5 , 0 0 0 PSI STRESS LEVEL
D 20, 000 PSI STRESS LEVEL
A 15,000 PSI STRESS LEVEL
V 10,000 PSI STRESS LEVEL
NOTE: CIRCLED SYMBOLS REPRESENT DEFECTS IN ADDITION TO POROSITY. SOLID SYMBOLS ARE 2219.
1?% 18% % AREA LOSS
24% :o% •+-
56% 42% _1_ . 1 1 i—
0 10 20 :30 40 50 50 TOTAL PORE AREA FOUND IN FRACTURE SURFACE, EXPRESSED IN EQUIVALENT NUMBER OF 1/64" PORES
Fig. 26—Fatigue life vs. fracture pore count for VA in. material. Alloys and positions are mixed
W E L D I N G R E S E A R C H S U P P L E M E N T 335-s
IDEAL MEAN CURVE
2.33 - SIGMA LIMIT
3. 00 - SIGMA LIMIT
4 5 6 7 NUMBER OF REPAIRS
Fig. 27—Weld strength vs. number or repairs on 2014-T6 aluminum, VA in. thick stock
27—typical strength of 36 ksi) has the mechanical properties equivalent to a weld which has sufficient porosity to be well outside of standards of acceptability, that is, to a weld containing 25 to 35 area % porosity. Thus more damage may be done by repair than is repaired by it.
Another aspect of practical application of the general rule of percent strength loss equaling percent area loss, is consideration of the denomo-nator in the area loss fraction. In a uniaxial tensile specimen the denomo-nator is- simply the area of the tensile specimen. In a real pressure vessel the incremental or base line area is not so straightforwardly assigned. Thus direct use of strength loss predictions should be verified on real part, or simulated part destructive tests prior to use.
Conclusions The experience in fabricating the
porous 2014-T6 and 2219-T87 aluminum specimens and the mechanical
property evaluations of defective welds, suggest the following conclusions:
1. The loss in transverse tensile strength in the weld metal in aluminum welds is proportional to the loss of sound metal area in the plane of the expected fracture. This statement was derived from data with essentially spherical (no sharp corners) pores.
2. Longitudinal tensile testing shows less detrimental effect from porosity than does transverse tensile data. For many purposes defects can be largely overlooked when the major load is parallel to the welding direction.
3. Fatigue life, transverse tension-tension loading, also shows a linear degradation in stress to fail at given cycle life, this reduction being proportional to area loss in the fracture plane.
4. Porosity obtained in horizontal position welding is more damaging to mechanical properties than other positions because the pores are not ran
domly distributed throughout all possible fracture planes, but are instead favorably situated in a given plane which is normal to a transverse load. This becomes a plane of weakness.
5. Pore location, except as in 4 above, has little effect on strength-area loss relationship. Excessive concentration near one surface of the bead (most likely the top) can impose a bending component which amplifies the stress somewhat. An artificial defect specimen, in which the entire defect was contained in a surface layer 20% of thickness in depth, reduced the strength by less than 10% of the linear prediction value.
6. Measuring area loss, as the input to the strength loss prediction, is difficult to do nondestructively, but can be accomplished with careful multiple X-ray procedures provided that (a) the pore density is not too high, and (b) the individual pores are not too small ( < y 6 4 in.).
7. Size distribution of pores does not effect the strength loss-area loss relationship. Small pores, if present in sufficient numbers to influence the area loss, will reduce strength accordingly.
8. Moisture and/or hydrogen me-tered to the shied gas provide an effective means of producing a predictable amount of porosity. However, side effects in arc stability, are temperature and jet action, and in bead surface, are encountered.
Acknowledgements
Acknowledgement is given to Marshall Space Flight Center, NASA, for sponsorship of this program as part of an overall effort to improve aluminum welding, and for permission to publish these results. Particular appreciation is expressed to Messrs. Earl Hasemeyer and R. Hoppes: MSFC Project Officers whose helpful comments kept the program properly oriented.
References 1. Rupert , K. J . . and Rudy. J . F . .
"Analyt ical and Statist ical Study on the Effects of Porosi ty Level on Weld Joint Per formance" . MSFC Contract NAS8 11335. Final Repor t . March 1966.
2. Mart in Mariet ta Corporation (Denver) Repor t CR-64-198. "Weld Repair and Inspection P rocedures" . Sept. 1964.
3. Cheever, D. L.. Kammer . P. A.. Monroe, R. E.. and Mart in . D. C . "Weld ing Base Metal Invest igat ion" , proceedings MSFC Aluminum Weld Development Complex Meeting. J a n u a r y 19. 1966.
-Jutli See page 340-s regarding the presentation of technical papers at the AWS or& . . . 52nd Annual Meeting in San Francisco during April 26-30, 1971.
336-s J U L Y 1 9 7 0