effects of socio-economic status of trafficking in …iosrjournals.org/iosr-jhss/papers/vol. 22...
TRANSCRIPT
IOSR Journal Of Humanities And Social Science (IOSR-JHSS)
Volume 22, Issue 7, Ver. 9 (July. 2017) PP 71-80
e-ISSN: 2279-0837, p-ISSN: 2279-0845.
www.iosrjournals.org
DOI: 10.9790/0837-2207097180 www.iosrjournals.org 71 | Page
Effects of Socio-Economic Status of Trafficking in Person on
Incidence of Human Trafficking in Southern Nigeria
Ezinneka Eunice Okodudu and Osi Akpoghomeh
Department of Geography and Environmental Management
University of Port Harcourt, Port Harcourt, Nigeria
Corresponding Author: Ezinneka Eunice Okodudu
ABSTRACT: Trafficking in Persons (TIP) has become a detoriating issue in our society. The study
investigated the effects of socio-economic status of trafficking in person on incidence of human trafficking in
Southern Nigeria. TIP records were collected from National Agency for Prohibition of Traffic in Persons
(NAPTIP) between 2010 and 2014 while socio-economic characteristics were collected from National Bureau of
Statistics. Clusters analysis was carried out to segment the number of incidence at the LGA level into
statistically contiguous groups. After the classification of sources, an analysis was carried to examine the
difference in the socio-economic characteristics of the cluster while Kruskal Wallis independent sample test was
use to examine the significant difference in the socio-economic characteristics across the clusters. Spearman
rank’s correlation was use to examine the relationship between socioeconomic variables of sources and
incidence of TIP. Results shows that the clusters identified can be referred to as high, medium and low
incidence clusters, the high cluster has a cluster centre of 31 incidences with 2 LGAs while the medium cluster
has centre of 10 incidences with 15 LGAs. The medium cluster has the highest membership with 84 LGAs
across the study area. it is evident that the 3 clusters are not significantly different (P > 0.05) therefore based on
the socio-economic characteristics the cluster cannot be differentiated from one another. There is a weak and
negative relationship between all socio-economic characteristics and total number of trafficked persons execept
the accessibility of electricity to household which was similarly weak (r=0.198) but significant at (P > 0.05).The
study recommended that effective intervention of the government and non-governmental organization help to
improve the living quality across the country.
Keywords: Socio-economic Characteristics, Trafficking in person, Clusters, Southern Nigeria
----------------------------------------------------------------------------------------------------------------------------- ----------
Date of Submission: 29 -05-2017 Date of acceptance: 17-07-2017
----------------------------------------------------------------------------------------------------------------------- ----------------
I. INTRODUCTION Human trafficking has become a multitude of activities and diverse institutions with their systematic
operation connected together (Lutya and Lenier, 2012). The phenomenon of trafficking is complex and has a
socio-economic and political history linked to larger, global processes. It is not simply a social or moral problem
to be treated with casual initiatives, as they do not address poverty or related issues of vulnerability and
discrimination in strategic or sustainable ways (UNESCO, 2006). Human trafficking constitutes a mind
boggling process which has an uncivilized framework and structures and they are difficult to mornitor and
predict (Yukoshko, 2009). Anderson and O'Connell (2002) clarified that trafficking falls inside a continuum of
experience which ranges from individuals who are either transported at gunpoint, then constrained in the process
of childbirth using physical or sexual brutality or passing dangers, to individuals who are neither cheated nor
pressured in any case. Trafficking is an improvement concern, which requires an adjusted, layered and
incorporated methodology, based on an establishment of rights-based standards and norms. Human movement is
the third biggest unlawful exchange after medication activity and arms exchange (UNICEF, 2006). Trafficking
in persons (TIPs) as explained by (Essien, 2013) has become a recent and known phenomenon which requires
adequate attention because of its effects mostly on youth of both sexes in the developing nations. The yearly
trafficked in persons (TIPs) reported by USAID (2005) put the assessment of individuals trafficked all inclusive
at 4 million every year; 800,000 persons move crosswise over worldwide fringes yearly; 80% of trafficked
casualties are accepted to be females and half are youth and kids while larger part are trafficked for business
sex. A noteworthy result of TIPs is the deprivation of its casualties the benefit to practice their entitlement to
opportunity, instruction and even the wellbeing among others (ANPPCAN 2010; Omotola, 2011). These
youthful persons are presented to sexual misuse from their paramour's spouses and now and again the adult
children of their lords. Trafficking in persons, like money laundering, advanced fee fraud, cyber scams and

Effects of Socio-Economic Status of Trafficking in Person on Incidence of Human Trafficking in ..
DOI: 10.9790/0837-2207097180 www.iosrjournals.org 72 | Page
illicit trade in arms and narcotics has elicited a great concern as a contemporary social problem worldwide
(Poulin,2004). Trafficked persons who are victims are utilized in different vocations including sexual
exploitation, begging, under-paid and exploited forced labour in the agricultural, service, manufacturing and
construction industries, domestic service, and organ harvesting (Agbu, 2003). There are many factors that have
led to human trafficking and these include widespread and increasing level of poverty, unemployment and
underemployment (especially of women), greed, family and communal dislocation, economic transition,
globalization, rural impoverishment, accelerated commoditization of sex, economic decline and uncertainties,
opportunism, false and fake dream, and dramatically deteriorating living standards, low pay, discriminatory
labour practices, violence (particularly against women), lack of social and welfare support, lack of educational
opportunities, tourism, false or imaginary marriage, declining border controls, governance, constant and
increased demand for cheap labour, combined forces of organized crime and governmental corruption, and the
receding capacity of the state to provide basic social services (Abdulkadir,2010). (Asghar, 2005; Yea, 2010)
documented the ways boys from Bangladesh, India and Pakistan are recruited from five years of age to become
camel jockeys in United Arab Emirates (UAE), having been sold by their parents to agents. The traffickers tell
the parents that the children would earn large sum of money, some of which would be sent home to the families.
Thereafter, the children are subjected to several forms of abuse during their sojourn including lack of food. In
recent times there has been an increase in the internal trafficking of Nigerian women and children especially
from rural communities to cities such as Lagos, Abeokuta, Ibadan, Kano, Kaduna, Calabar and Port Harcourt
(UNESCO, 2006). A study recent revealed that disabled people, especially children in the developing countries
are often trafficked as beggars or deployed in brothels and factories (Yea, 2010). This is because in many
cultures, disabled people are seen as a shame or burden on their families and are therefore easily recruited by
traffickers from their families (Yea, 2010). Thus, in Thailand, many brothel owners deliberately target deaf girls
because they are less able to communicate their situations to clients, police or others who might be in a position
to help them. Trafficking to these regions is predominantly for exploitative domestic work, farm labour and
prostitution, with incidents of human trafficking and forced labour particularly prevalent in Lagos.
Olateru-Olagbegi and Ikpeme (2006) found that children from rural communities in Cross-Rivers,
Akwa Ibom, Benue, Ebonyi, Kwara, Bayelsa, Imo, Anambra, Oyo State and border villages in Ogun State are
trafficked for domestic service to the urban or city centre such as Lagos, Kano, Port-Harcourt, Ibadan and
Kaduna. The same report shows that the southern states of Nigeria are particularly implicated in this inhuman
trade. Trafficking to regions is overwhelmingly for exploitative residential work, ranch work and prostitution
(UNESCO, 2006). According to human trafficking report (2015) millions of young men, women and children
around the world are currently victims of trafficking in person, bought and sold as commodities into prostitution
and forced labour. Traffickers scout for girls and young boys wanting to travel, enticing them with promises of
work and education. The victims are offered false papers and also on how to repay the cost of their travel until
they reach their destination country. Once recruited, the girls are forced into ritual using their hair from their
head, armpit and public area thereby making them to be afraid “according to one of the victims who were
promised a new life in ltaly.
Victims of TIP are exposed to various health risks and abuse which may result in health problems such
as sexually transmitted infections (STIs), HIV/AIDS, pelvic inflammatory disease, hepatitis, tuberculosis, skin
infections and other communicable diseases: unwanted pregnancy, forced abortion, abortion-related
complications, mental and emotional health problems, including nightmares, insomnia, suicidal tendencies,
alcoholism, drug abuse and addiction (NAPTIP, 2008). UNICEF (2007) describes poor economic situation in
Nigeria as a factor that has led to unemployment and high rates of school drop-out. These circumstances have
created a large pool of inactive and unengaged children and adolescents who are much more vulnerable to
trafficking than their peers who go to school. The motivation, especially of teenagers, to find work away from
home is often driven by the increasing taste for material things. Unarguably, human trafficking has significant
negative impact on the trafficked persons, families, communities and the nation as a whole. Previous research
on human trafficking in Nigeria such as Olateru-Olagbegi and Ikpeme (2006); Kunze (2010); Akpan and
Oluwabamide (2010); Akor (2011); Omotola (2011); Onyeizugbo and Eukay (2011) focussed on the impact of
human trafficking especially in the area of prostitution and child labour which were restricted to small
geographic locations like a state or Local Government Areas (LGAs) in Nigeria. Investigating the effect of
socio-economic status of trafficking in person on incidence of human trafficking in Southern Nigeria is very rare
in the literature. However, the effect of socio-economic status of trafficking can be achieved through the use of
Kruskal Wallis independent sample test and spearman rank’s correlation which test the significant difference
and the relationship of the socio-economic variables. There are several studies on human trafficking in Nigeria
but none has reported the effect of socio-economic status of trafficking in person on incidence of human
trafficking in Southern Nigeria. Against this background, the present study examined the effect of socio-
economic status of trafficking in person on incidence of human trafficking in Southern Nigeria between 2010
and 2014.

Effects of Socio-Economic Status of Trafficking in Person on Incidence of Human Trafficking in ..
DOI: 10.9790/0837-2207097180 www.iosrjournals.org 73 | Page
II. MATERIALS AND METHODS The study area encompasses all states in Southern Nigeria; Abia, Akwa Ibom, Anambra, Bayelsa,
Cross River, Delta, Ebonyi, Edo, Ekiti, Enugu, Imo, Lagos, Ogun, Ondo, Osun, Oyo and Rivers (Figure 1). The
southern part of Nigeria consists of South-West, South-East and South-South regions. The study area is located
in the southern part of the country lying between the latitude 4o 32’N and 9
o 33’N and longitude 3
o 25’ E and 10
o
25’ E (Figure 1).
Figure 1: Southern States of Nigeria (Study Area)
The climate is the humid sub-equatorial type (Aweto, 1981) with high annual rainfall ranging between
1600 mm and 3000 mm (Ogolo and Adeyemi, 2009). Land in relation to the population, is relatively scarce
especially in the Niger Delta Region of the study area and as population increases, the pressure on land for all
purposes including agriculture increases accordingly. Majority of the population are Christians while English or
Pidgin English serves as the national language. The total population of the study area is 65,162,068 (National
Population Commission, 2006) in which Lagos, Oyo and Rivers States are the most populous while the
population in Bayelsa is the lowest. Farming, fishing and trading are common human activities in the study area.
The pattern of settlement in the southern part of Nigeria is largely determined by the availability of dry land.
According to (Okodudu, 2016) land is primarily low lying in most part resulting in a dendentric nature of its
drainage which to some degree governor habitability regions within the study area. There are pockets of
highlands recorded in the South-west and South-east while low relief (15-30m) above sea level dominates most
of the South-south part.
Secondary data were used for this study. Data on human trafficking between 2010 and 2014 in the
study area were collected from National Agency for Prohibition of Traffic in Persons (NAPTIP) both from the
Benin Zone, Akwa-Ibom and Abuja Zone (Figure 2). The socio-economic characteristics of traffic in persons
used in this study were proportion of people living in poverty, proportion of people living in extreme poverty,
accessibility of city of ≥50,000 people, proportion of people with access to improved water, proportion of
people with access to improved water, proportion of people with access to improved sanitation, population of
Effects of Socio-Economic Status of Trafficking in Person on Incidence of Human Trafficking in ..
DOI: 10.9790/0837-2207097180 www.iosrjournals.org 74 | Page
young people enrolled in primary school, population of young people enrolled in secondary school, proportion
of literate people-15 years and above, population of people with electricity in their household. Cluster analysis
was carried out to segment the number of incidence at the LGA level into statistically contiguous groups. After
this classification of sources, an analysis was carried out to examine the differences in the socio-economic
characteristics of the cluster. Using Kruskal-Wallis independent sample test, these clusters were examined to
test the significant difference in the socio-economic characteristics across the clusters while Spearman rank’s
correlation was use to test the relationship between socioeconomic variables of sources and incidence of TIP.
Descriptive statistics were used to analyze the socio-economic factors of the TIPs per state with the use of
simple percentages. Bar and line charts were used for data presentation. All analyses were done in Statistical
Package for Social Scientists (SPSS) Version 20.0.
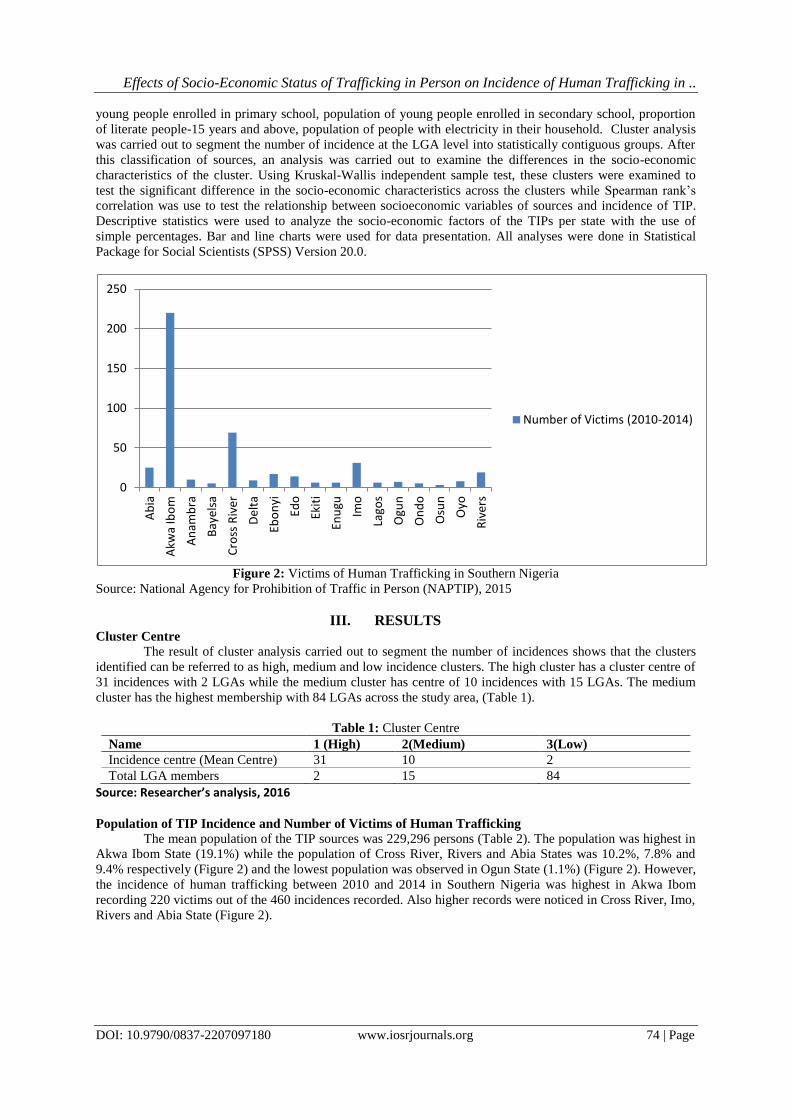
Figure 2: Victims of Human Trafficking in Southern Nigeria
Source: National Agency for Prohibition of Traffic in Person (NAPTIP), 2015
III. RESULTS Cluster Centre
The result of cluster analysis carried out to segment the number of incidences shows that the clusters
identified can be referred to as high, medium and low incidence clusters. The high cluster has a cluster centre of
31 incidences with 2 LGAs while the medium cluster has centre of 10 incidences with 15 LGAs. The medium
cluster has the highest membership with 84 LGAs across the study area, (Table 1).
Table 1: Cluster Centre
Name 1 (High) 2(Medium) 3(Low)
Incidence centre (Mean Centre) 31 10 2
Total LGA members 2 15 84
Source: Researcher’s analysis, 2016
Population of TIP Incidence and Number of Victims of Human Trafficking
The mean population of the TIP sources was 229,296 persons (Table 2). The population was highest in
Akwa Ibom State (19.1%) while the population of Cross River, Rivers and Abia States was 10.2%, 7.8% and
9.4% respectively (Figure 2) and the lowest population was observed in Ogun State (1.1%) (Figure 2). However,
the incidence of human trafficking between 2010 and 2014 in Southern Nigeria was highest in Akwa Ibom
recording 220 victims out of the 460 incidences recorded. Also higher records were noticed in Cross River, Imo,
Rivers and Abia State (Figure 2).
0
50
100
150
200
250
Ab
ia
Akw
a Ib
om
An
amb
ra
Bay
elsa
Cro
ss R
iver
Del
ta
Ebo
nyi
Edo
Ekit
i
Enu
gu
Imo
Lago
s
Ogu
n
On
do
Osu
n
Oyo
Riv
ers
Number of Victims (2010-2014)

Effects of Socio-Economic Status of Trafficking in Person on Incidence of Human Trafficking in ..
DOI: 10.9790/0837-2207097180 www.iosrjournals.org 75 | Page
Table 2: Socio-economic characteristics of TIP Incidence in Southern Nigeria
Socio-economic Characteristics of TIP Sources
in Southern Nigeria
Minimum Maximum Mean SD
Population 60482 1051300 229295.58 140313.58
Proportion of people living in poverty 9 2685 427.22 482.42
Proportion of people living in extreme Poverty 4 2561 339.69 418.76
Accessibility to city of less than or equal to
50,000 people
4 898 150.23 163.07
Proportion of people with access to improved
water
30787 905618 145521.07 113352.45
Proportion of people with access to improved
sanitation
21293 905873 134052.49 112487.24
Population of young people enrolled in primary
school
6143 82303 22142.39 12254.24
Population of young people enrolled in secondary
School
4349 78678 18398.05 10853.13
Proportion of literate people (15 years and above) 30951 651441 119904.65 81344.31
Population of people with electricity in their
household
35682 965280 139576.15 116174.28
N=101
Source: Researcher’s computation, 2016
The socio-economic characteristics of status of TIP are presented in Table 2. These included
population, proportion of people living in extreme poverty, proportion of people living in poverty, accessibility
to city of less than or equal to 50,000 people, proportion of people with access to improved water, proportion of
people with access to improved sanitation, population of young people enrolled in primary school, population of
young people enrolled in secondary school, proportion of literate people (15 years and above) and population of
people with electricity in their household. Using Kruskal-Wallis independent sample test, these clusters were
examined to test the significant difference in the socio-economic characteristics across the clusters. From Table
3, it is evident that the 3 clusters are not significantly different (P > 0.05) in any respect, therefore based on the
socio-economic characteristics the cluster cannot be differentiated from one another.
Table 3: Kruskal-Wallis test result of socioeconomic condition against incidence clusters
No. Null Hypothesis P value Significance
1 The distribution of extreme poverty is the same across categoriesof
cluster Number of case
0.464 Not Significant
2 The distribution of poverty is the same across categories of cluster
number of case
0.282 Not Significant
3 The distribution of primary school is the same across catergories of
cluster number of case
0.486 Not Significant
4 The distribution of secondary school is the same across categories
of cluster Number of case
0.353 Not Significant
5 The distribution of literate people (15years & above) is the same
across categories of cluster Number of case
0.255 Not Significant
6 The distribution of population density is the same across categories
of cluster Number of case
0.363 Not Significant
7 The distribution of Accessibility to a city 50,000 people is the same
across categories of cluster Number of case
0.302 Not Significant
8 The distribution of access improve water is the same across
categories of cluster Number of case
0.310 Not Significant
9 The distribution of Access to improve sanitation is the same across
categories of cluster Number of case
0.943 Not Significant
10 The distribution of Electricity in Household is the same across
categories of cluster Number of case
0.207 Not Significant
Asymptotic significances are displayed. The significance of 0.05 is used for making a decision.
Source: Research’s computation, 2016

Effects of Socio-Economic Status of Trafficking in Person on Incidence of Human Trafficking in ..
DOI: 10.9790/0837-2207097180 www.iosrjournals.org 76 | Page
Figure 3: Population of TIPs
Population of people living in poverty and extreme poverty in TIP Incidence
Results showed that the mean proportion of people living in poverty in the Southern Nigeria were 427
persons. The distribution among the state showed that the proportion of people living in poverty was highest in
Cross River with 23.2%. Bayelsa State had 12.3% while each of Oyo State and Akwa Ibom State had 10.9%.
The lower proportion of people living in poverty was observed in Ogun State, Anambra State and Osun State
with 2.8%, 1.9% and 0.7% respectively. Relating the people living in poverty in each state with their total
population, Oyo, Ogun and Bayelsa States had the highest population of 0.5% each of total population (Figure
3). However, the mean proportion of people living in extreme poverty in the study area was 340 persons. Cross
River State took the lead with 28.0% of the affected population (34310), Bayelsa State had 12.2% and Akwa
Ibom had 11.6%. The least was observed in Osun State with 0.6% of the affected population. Analysis also
showed that proportion of the people living in extreme poverty in relation to the entire population of a state was
highest in Cross River and Bayelsa States (0.4%), followed by Ebonyi, Ogun and Oyo States (0.3%) (Figure 4)
Figure 4: Proportion of people living in poverty and extreme poverty
Accessibility to city of less than or equal to 50,000 people in the TIP Incidence
Reporting the analysis of the accessibility to city of less than or equal to 50,000 people, it was found
that Bayelsa State had 19.9% of the total affected population (15171 persons), 16.1% in Akwa Ibom State,
12.2% in Cross River. Lower population of 1.1% and 0.8% was observed in Ogun and Osun States respectively.
0
500000
1000000
1500000
2000000
2500000
3000000
3500000
4000000
4500000
5000000
Population
0
2000
4000
6000
8000
10000
12000
Ab
ia
Akw
a Ib
om
An
amb
ra
Bay
elsa
Cro
ss R
iver
Del
ta
Ebo
nyi
Edo
Ekit
i
Enu
gu
Imo
Lago
s
Ogu
n
On
do
Osu
n
Oyo
Riv
ers
Proportion of People Living in Poverty
Proportion of people living in extreme poverty
Effects of Socio-Economic Status of Trafficking in Person on Incidence of Human Trafficking in ..
DOI: 10.9790/0837-2207097180 www.iosrjournals.org 77 | Page
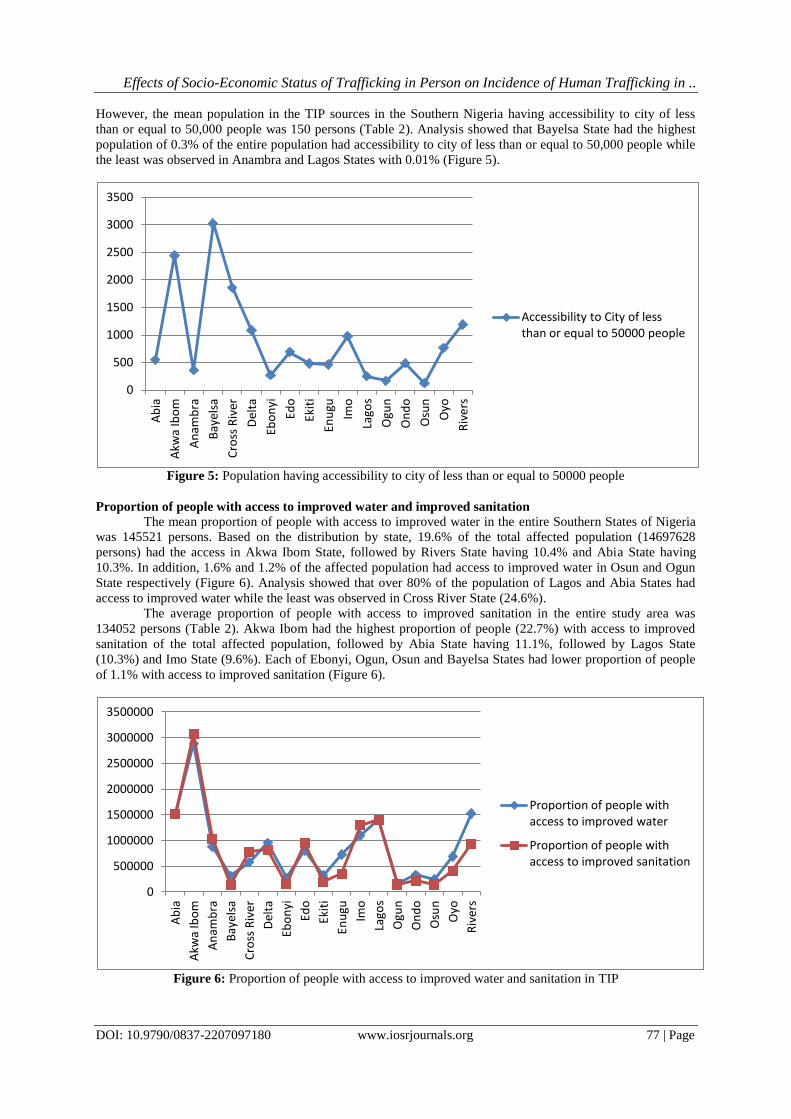
However, the mean population in the TIP sources in the Southern Nigeria having accessibility to city of less
than or equal to 50,000 people was 150 persons (Table 2). Analysis showed that Bayelsa State had the highest
population of 0.3% of the entire population had accessibility to city of less than or equal to 50,000 people while
the least was observed in Anambra and Lagos States with 0.01% (Figure 5).
Figure 5: Population having accessibility to city of less than or equal to 50000 people
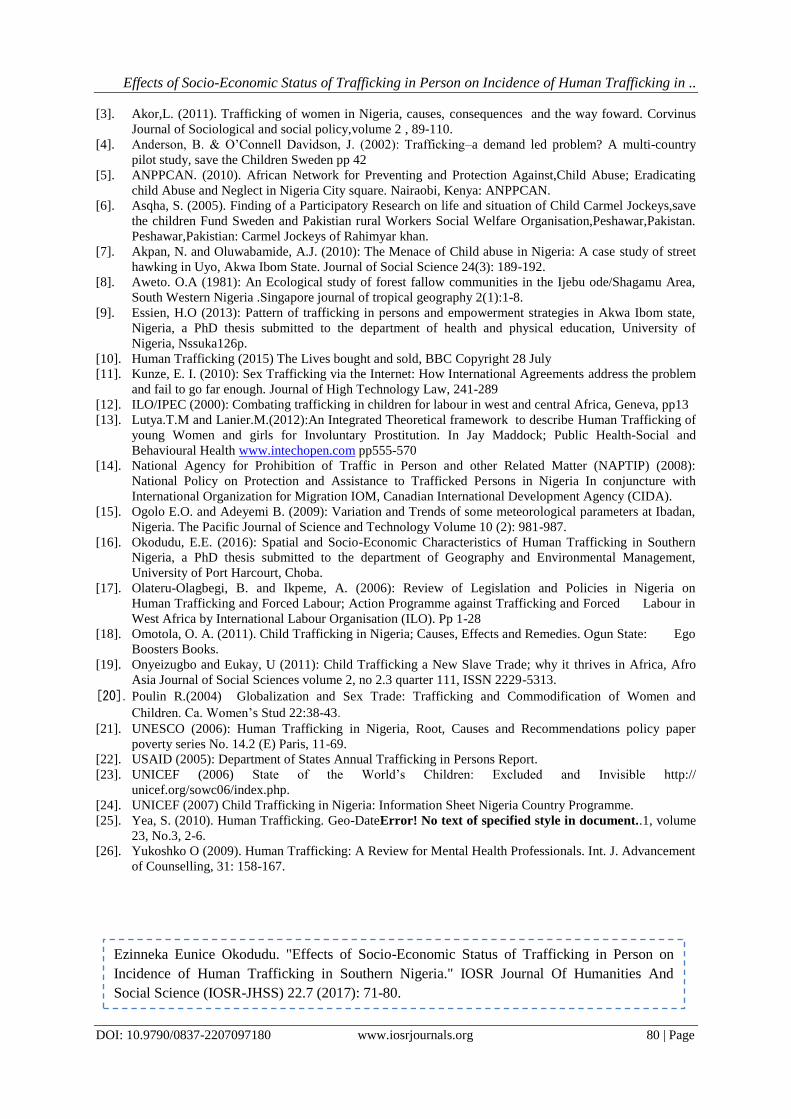
Proportion of people with access to improved water and improved sanitation
The mean proportion of people with access to improved water in the entire Southern States of Nigeria
was 145521 persons. Based on the distribution by state, 19.6% of the total affected population (14697628
persons) had the access in Akwa Ibom State, followed by Rivers State having 10.4% and Abia State having
10.3%. In addition, 1.6% and 1.2% of the affected population had access to improved water in Osun and Ogun
State respectively (Figure 6). Analysis showed that over 80% of the population of Lagos and Abia States had
access to improved water while the least was observed in Cross River State (24.6%).
The average proportion of people with access to improved sanitation in the entire study area was
134052 persons (Table 2). Akwa Ibom had the highest proportion of people (22.7%) with access to improved
sanitation of the total affected population, followed by Abia State having 11.1%, followed by Lagos State
(10.3%) and Imo State (9.6%). Each of Ebonyi, Ogun, Osun and Bayelsa States had lower proportion of people
of 1.1% with access to improved sanitation (Figure 6).
Figure 6: Proportion of people with access to improved water and sanitation in TIP
0
500
1000
1500
2000
2500
3000
3500
Ab
ia
Akw
a Ib
om
An
amb
ra
Bay
elsa
Cro
ss R
iver
Del
ta
Ebo
nyi
Edo
Ekit
i
Enu
gu
Imo
Lago
s
Ogu
n
On
do
Osu
n
Oyo
Riv
ers
Accessibility to City of less than or equal to 50000 people
0
500000
1000000
1500000
2000000
2500000
3000000
3500000
Ab
ia
Akw
a Ib
om
An
amb
ra
Bay
elsa
Cro
ss R
iver
Del
ta
Ebo
nyi
Edo
Ekit
i
Enu
gu
Imo
Lago
s
Ogu
n
On
do
Osu
n
Oyo
Riv
ers
Proportion of people with access to improved water
Proportion of people with access to improved sanitation

Effects of Socio-Economic Status of Trafficking in Person on Incidence of Human Trafficking in ..
DOI: 10.9790/0837-2207097180 www.iosrjournals.org 78 | Page
Population of young people enrolled in primary school and secondary school
The mean population of young people enrolled in primary school in the study area was 22142 persons
(Table 2). Akwa Ibom had the highest (20.1%) population of young people enrolled in primary school, followed
by Cross River with 10.9%, followed by Rivers State having 8.9% (Figure 9). Lower proportion was observed
in Osun and Ogun States having 1.3% and 1.1% respectively. However, 10.6% of the entire population in Ekiti
and Bayelsa States were young people enrolled in primary school while 7.8% of Lagos State enrolled young
people in primary school (Figure 7).
The mean population of young people enrolled in the secondary school in the TIP States was 18398
persons (Table 2). It was observed that of the total population of the young people enrolled in secondary school,
Akwa Ibom had 19.8%, followed by Cross River having 9.0%, Rivers had 8.9% and Abia State had 8.8%
(Figure 7). The lower proportion was found in Osun State with 1.4% of the population and 0.8% was found in
Ogun State. Of the entire population, Ekiti State had the highest (9.5%) population enrolled in the secondary
school, followed by Imo State (9.3%) while the least was observed in Ogun State (6.1%), (Figure 7).
Figure 7: Population of young people enrolled in primary school and secondary school in TIP incidence of
Southern Nigeria
Proportion of literate people (15 years and above) and population of people with electricity in their
household in Southern Nigeria
The proportion of literate people (15 years and above) was highest in Akwa Ibom (18.7%), (Figure 8).
It is followed by Rivers State having 10.0%, Cross River 8.7% and Abia State 8.5% (Figure 8). On the other
hand, Ebonyi, Osun and Ogun States had lower proportion of literate people with 1.4%, 1.3% and 0.9% of the
total affected population respectively (Figure 11). However, the mean proportion of literate people (15 years and
above) in the entire study area was 119905 persons (Table 2).
The mean population of people with electricity in their household in the entire study area was 139576
persons (Table 2). Akwa Ibom State had the highest population of 18.5% having electricity in their households,
followed by Lagos State (10.6%) and Abia State (9.04%) (Figsure 8). Also, Ogun State had the least population
of 1.2% of the total affected population, followed by Ebonyi State which had 1.3% and Osun State having 1.5%
(Figure 8). Of the entire population of Lagos State, 91.8% had access to electricity while more than 70% of the
population of Anambra, Edo and Abia States also had electricity in their household and the least was found in
Cross River State.
0
50000
100000
150000
200000
250000
300000
350000
400000
450000
500000
Ab
ia
Akw
a Ib
om
An
amb
ra
Bay
elsa
Cro
ss R
iver
Del
ta
Ebo
nyi
Edo
Ekit
i
Enu
gu
Imo
Lago
s
Ogu
n
On
do
Osu
n
Oyo
Riv
ers
Population of young people enrolled in primary school
Population of young people enrolled in secondary school

Effects of Socio-Economic Status of Trafficking in Person on Incidence of Human Trafficking in ..
DOI: 10.9790/0837-2207097180 www.iosrjournals.org 79 | Page
Figure 8: Proportion of literate people (15 years and above) and population with electricity in their household
Association between Socio-economic Status of TIP and Incidence of TIP Using Spearman rank’s correlation, the relationship between socioeconomic status and incidence of
TIP was examined and presented in Table 3. Results showed that there was weak and negative relationship
between all socio-economic status and total number of trafficked people except the accessibility of electricity to
household which was similarly weak (r=-0.198) but significant at p<0.05. Therefore, the indication that as the
values of these variables goes up the number of incidences of TIP goes down.
Table 3: Spearman rank correlation between socioeconomic status and volume of traffic in person
No. Variables Correlation
Coefficient
Significance
1 Proportion of people living in extreme poverty -0.074 0.459
2 Population -0.115 0.254
3 Proportion of people living in poverty -0.135 0.179
4 Accessibility to city of less than or equal to 50,000 people (mins) -0.143 0.152
5 Proportion of people with access to improved water -0.159 0.112
6 Proportion of people with access to improved sanitation -0.049 0.626
7 Population of people with electricity in their household -0.198 0.047
8 Population of young people enrolled in primary school -0.080 0.428
9 Population of young people enrolled in secondary school -0.177 0.077
10 Proportion of literate people (15 years and above)
-0.193 0.053
Source: Researcher’s computation, 2016
Discussion of Findings Examination of the relationship between socio-economic status and the incidences of TIP revealed the
complexity of the situation across many of the identified sources.
IV. CONCLUSION AND RECOMMENDATION The study has shown the effects of socioeconomic
The study therefore recommended that Government should ensure that the activities of NAPTIP
receives sufficient funding, especially in the area of prosecuting trafficking offenders and providing adequate
care and help for victims; continue to provide regular training to police and immigration officials to identify
trafficking victims among vulnerable populations especially in the rural areas.
REFERENCES [1]. Abdulkadir M.S.(2010) Economic Crises, Poverty, Unemployment, Slave and Human Trafficking in
Nigeria. International Colloquium on Slavery, Slave Trade and their Consequences 2010;
[2]. Agbu O. (2003): Corruption and Human Trafficking: The Nigeria Case West Africa Review ISSN: 1094-
2254 volume 4, number 1
0
500000
1000000
1500000
2000000
2500000
3000000
Ab
ia
Akw
a Ib
om
An
amb
ra
Bay
elsa
Cro
ss R
iver
Del
ta
Ebo
nyi
Edo
Ekit
i
Enu
gu
Imo
Lago
s
Ogu
n
On
do
Osu
n
Oyo
Riv
ers
Proportion of literate people -15 years and above
Population of people with electricity in their household
Effects of Socio-Economic Status of Trafficking in Person on Incidence of Human Trafficking in ..
DOI: 10.9790/0837-2207097180 www.iosrjournals.org 80 | Page
[3]. Akor,L. (2011). Trafficking of women in Nigeria, causes, consequences and the way foward. Corvinus
Journal of Sociological and social policy,volume 2 , 89-110.
[4]. Anderson, B. & O’Connell Davidson, J. (2002): Trafficking–a demand led problem? A multi-country
pilot study, save the Children Sweden pp 42
[5]. ANPPCAN. (2010). African Network for Preventing and Protection Against,Child Abuse; Eradicating
child Abuse and Neglect in Nigeria City square. Nairaobi, Kenya: ANPPCAN.
[6]. Asqha, S. (2005). Finding of a Participatory Research on life and situation of Child Carmel Jockeys,save
the children Fund Sweden and Pakistian rural Workers Social Welfare Organisation,Peshawar,Pakistan.
Peshawar,Pakistian: Carmel Jockeys of Rahimyar khan.
[7]. Akpan, N. and Oluwabamide, A.J. (2010): The Menace of Child abuse in Nigeria: A case study of street
hawking in Uyo, Akwa Ibom State. Journal of Social Science 24(3): 189-192.
[8]. Aweto. O.A (1981): An Ecological study of forest fallow communities in the Ijebu ode/Shagamu Area,
South Western Nigeria .Singapore journal of tropical geography 2(1):1-8.
[9]. Essien, H.O (2013): Pattern of trafficking in persons and empowerment strategies in Akwa Ibom state,
Nigeria, a PhD thesis submitted to the department of health and physical education, University of
Nigeria, Nssuka126p.
[10]. Human Trafficking (2015) The Lives bought and sold, BBC Copyright 28 July
[11]. Kunze, E. I. (2010): Sex Trafficking via the Internet: How International Agreements address the problem
and fail to go far enough. Journal of High Technology Law, 241-289
[12]. ILO/IPEC (2000): Combating trafficking in children for labour in west and central Africa, Geneva, pp13
[13]. Lutya.T.M and Lanier.M.(2012):An Integrated Theoretical framework to describe Human Trafficking of
young Women and girls for Involuntary Prostitution. In Jay Maddock; Public Health-Social and
Behavioural Health www.intechopen.com pp555-570
[14]. National Agency for Prohibition of Traffic in Person and other Related Matter (NAPTIP) (2008):
National Policy on Protection and Assistance to Trafficked Persons in Nigeria In conjuncture with
International Organization for Migration IOM, Canadian International Development Agency (CIDA).
[15]. Ogolo E.O. and Adeyemi B. (2009): Variation and Trends of some meteorological parameters at Ibadan,
Nigeria. The Pacific Journal of Science and Technology Volume 10 (2): 981-987.
[16]. Okodudu, E.E. (2016): Spatial and Socio-Economic Characteristics of Human Trafficking in Southern
Nigeria, a PhD thesis submitted to the department of Geography and Environmental Management,
University of Port Harcourt, Choba.
[17]. Olateru-Olagbegi, B. and Ikpeme, A. (2006): Review of Legislation and Policies in Nigeria on
Human Trafficking and Forced Labour; Action Programme against Trafficking and Forced Labour in
West Africa by International Labour Organisation (ILO). Pp 1-28
[18]. Omotola, O. A. (2011). Child Trafficking in Nigeria; Causes, Effects and Remedies. Ogun State: Ego
Boosters Books.
[19]. Onyeizugbo and Eukay, U (2011): Child Trafficking a New Slave Trade; why it thrives in Africa, Afro
Asia Journal of Social Sciences volume 2, no 2.3 quarter 111, ISSN 2229-5313.
[20]. Poulin R.(2004) Globalization and Sex Trade: Trafficking and Commodification of Women and
Children. Ca. Women’s Stud 22:38-43. [21]. UNESCO (2006): Human Trafficking in Nigeria, Root, Causes and Recommendations policy paper
poverty series No. 14.2 (E) Paris, 11-69.
[22]. USAID (2005): Department of States Annual Trafficking in Persons Report.
[23]. UNICEF (2006) State of the World’s Children: Excluded and Invisible http://
unicef.org/sowc06/index.php.
[24]. UNICEF (2007) Child Trafficking in Nigeria: Information Sheet Nigeria Country Programme.
[25]. Yea, S. (2010). Human Trafficking. Geo-DateError! No text of specified style in document..1, volume
23, No.3, 2-6.
[26]. Yukoshko O (2009). Human Trafficking: A Review for Mental Health Professionals. Int. J. Advancement
of Counselling, 31: 158-167.
Ezinneka Eunice Okodudu. "Effects of Socio-Economic Status of Trafficking in Person on
Incidence of Human Trafficking in Southern Nigeria." IOSR Journal Of Humanities And
Social Science (IOSR-JHSS) 22.7 (2017): 71-80.