effects of stratification by suspended sediments on turbulent shear
TRANSCRIPT

'•
JOURNAL OF GEOPHYSICAL RESEARCH, VOL. 96, NO. C6, PAGES 10,659-10,680, JUNE 15, 1991
Effects of Stratification by Suspended Sediments on Turbulent Shear Flows
CATHERINE VILLARET1 AND J. H. TROWBRIDGE
Woods Hole Oceanographic Institution, Woods Hole, Massachusetts
Sediments suspended in turbulent flows of water over plane beds are known to influence the structure of the flows by which they are carried. Past attempts to model this effect have been based almost exclusively on a theoretical framework in which the dense solid particles stratify the flow and have an influence analogous to that of a downward heat flux in the stably stratified atmospheric surface layer. We compare results from a model based on this theoretical framework with laboratory measurements of ensemble-averaged velocity and ensemble-averaged particle concentration, obtained by previous investigators, in order to test the applicability of the theoretical approach to dilute suspensions of sand in turbulent flows of water. We find that the stratification effect can be observed qualitatively in measured velocity profiles, except in one series of experiments in which systematic measurement errors may have obscured the effect. Estimates of model constants based on measured velocity profiles are, overall, roughly consistent with expectations based on measurements in thermally stratified flows, although there is substantial variability in individual profiles. Some of this variability is explainable as a consequence of a parameter range in which stratification effects are too weak to be detected accurately, other variability is explainable as a consequence of approximations in the model, and still other variability is possibly a consequence of weak dependence of model constants on sediment grain size, which was not expected from the theoretical development. The stratification effect is not observed in individual particle concentration profiles but must instead be observed in experiments in which the flow conditions and particle properties are held fixed while the particle load is increased.
1. INTRODUCTION
Sediments suspended in turbulent flows of water over plane beds are known to influence the structure of the flows by which they are carried. In particular, for a given distribution of Reynolds stress, a sediment-laden flow typically has a mean velocity profile with larger gradients than the corresponding profile in a flow of clear water (Figure 1). This effect has been documented many times in laboratory experiments [Vanoni, 1946; Brooks, 1954; Barton and Lin, 1955; Einstein and Chien, 1955; Vanoni and Nomicos, 1960; Coleman, 1981, 1986; Lyn, 1988]. Understanding the influence of suspended sediments on the structure of a turbulent flow is an intriguing but incompletely solved problem with potentially important applications in marine and riverine sediment transport [e.g., Smith and McLean, 1977; Taylor and Dyer, 1977; Wiberg and Smith, 1983; Glenn and Grant, 1987].
Past attempts to model the interaction between a turbulent flow of water and sediments in suspension have been based almost exclusively on an approach that we term, for brevity, the stratified flow analogy (see, for example, Monin and Yaglom [1971, pp. 412-416]). In this approach, the solid particles are modeled as a continuously distributed admixture, and the velocity of a solid particle is assumed to differ from the local velocity of the fluid by a vertical setting velocity, which is the same as the terminal settling velocity in an unbounded, stationary fluid. In most applications, the particle concentration is constrained to be small, and the
1 Now at Laboratoire National d'Hydrau1ique, Electricite de France, Chatou.
Copyright 1991 by the American Geophysical Union.
Paper number 91JC01025. 0148-0227 /91/91JC-O I 025$05.00
contribution of the solid particles to the density of the fluid-solid mixture is constrained to be small enough so that the Boussinesq approximation may be used. According to this theoretical framework, the solid particles influence the flow through the turbulent kinetic energy balance, in which a buoyancy term proportional to the turbulent particle flux appears as a sink that extracts energy at the expense of the turbulent velocity fluctuations. In effect, the suspended particles stratify the flow and have an influence similar to that of a downward heat flux in the stably stratified atmospheric surface layer.
Lyn [1988] recently proposed a novel theoretical approach, based on dimensional analysis and matching arguments, as an alternative to the stratified flow analogy. At present, Lyn's approach is limited in scope and requires a substantial amount of empirical input, so that the stratified flow analogy remains the only theoretical approach capable of providing quantitative predictions under fairly general conditions.
Application of the stratified flow analogy requires a turbulence closure, and previous researchers have adopted several different closures (for a variety of closures, see Barenblatt [1953, 1955], summarized by Monin and Yaglom [1971], pp. 412-416]; Smith and McLean [1977]; Taylor and Dyer [1977]; Adams and Weatherly [1981]; and Sheng and Villaret [1989]). All of these closures are very similar to preceding treatments of thermally stratified flows, and the required empirical constants are assumed to have the same values as in the thermally stratified case. The previous closures differ in detail, but they are very similar to each other. In particular, all of the closures reduce, in the limit of small but finite flux Richardson numbers, to the same form in the constant stress region adjacent to a solid boundary.
The stratified flow analogy is an idealization that is typically not strictly justified for suspensions of sediment in
10,659

10,660 VILLARET AND TROWBRIDGE: STRATIFICATION BY SUSPENDED SEDIMENTS
,.,, 0 ., " -;;; >
1.0 0.9 0.8 0.7
0.6
0.5
0.4
0.3
0.2
0.1 0.09 0.08 0.07
0.06
0.05
0.04
0.03 1.0
0.9
0.8
0.7
06
0.5
0.4
0.3
0.2
0.1
(a) d • 0.295 FT, S- 0.0025 "' tV , I If
L I'
_j_ /
I L 1/ rj k=0.4
Cm=O v IL'
1/ ll r--~ =021
II C.,= 15.8
/ II/
li u
Jl _J) lvj. 0
(b) d-0.295 FT, 5=0.0025 I j
f ~=0~- I Cm=O :-
~ k-0.21 n-
em= 15.8 f1 1 1/
I i/ I j_
I I /
~ v _/
k:::ot ~ H
1.0 1.5 2.0 2.5 3.0 3.5 4.0 Velocity, U, in feet per second
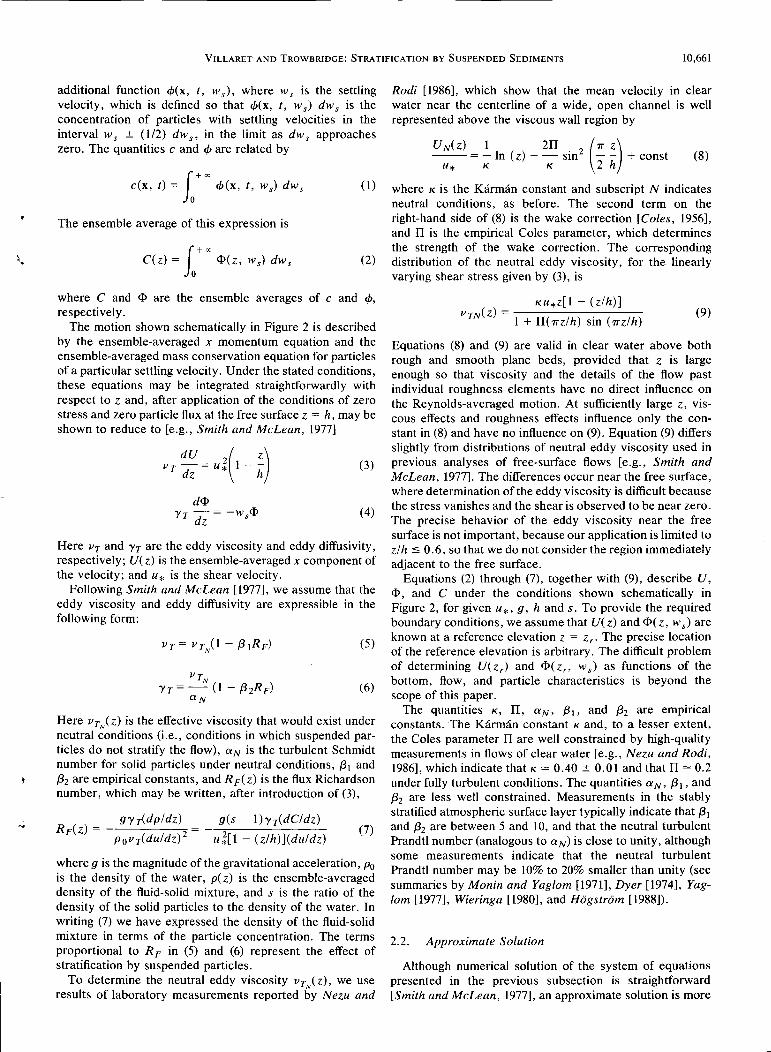
Fig. I. (a) Semilogarithmic and (b) linear velocity profiles in clear water and in a sediment-laden flow in a wide, open channel. In this figure only, y is the elevation above the bottom, d is the depth of the flow, k is the Karman constant, Sis the bottom slope, and Cm is the maximum concentration of sediment measured in the flow, in grams per liter. Both velocity profiles correspond to the same shear velocity and water depth. The velocity gradients are larger in the sediment-laden flow than in the clear-water flow. Reproduced from Vanoni [1977, p. 86].
turbulent flows of water, although it may be justifiable if one considers only the energy-containing scales of the turbulent motion, ignoring the details of the smallest scales [Lumley, 1976]. The validity of the theoretical framework for this application is therefore open to question and must be established experimentally. Although laboratory measurements in sand-laden flows of water have long been available, there has been no systematic test of the stratified flow analogy by means of comprehensive, quantitative comparisons with these measurements. Gelfenbaum and Smith [1986] reported a comparison of laboratory measurements and model computations, but their comparison does not isolate the effect of
stratification, which is small at laboratory scales. In addition, Gelfenbaum and Smith used measurements reported by Vanoni [1946] and by Einstein and Chien [1955], which form only a subset of the available measurements and are not necessarily the most appropriate for evaluating the stratified flow analogy (see sections 3 and 4). Lyn [1988] reported an incomplete, qualitative evaluation based only on his own measurements.
In this paper, we compare computations based on a simple model with existing measurements of mean velocity and mean particle concentration in laboratory channels, in order to evaluate the applicability of the stratified flow analogy to dilute suspensions of sand in turbulent flows of water. The specific objectives of the study are (1) to determine whether effects of stratification by suspended particles that are predicted by the model can be detected in the measured mean velocity and particle concentration profiles and (2) to determine whether estimates of model constants obtained from the measurements have values consistent with previous estimates for thermally stratified flows. The model is based on a turbulence closure very ~imilar to that.,proposed by Smith and McLean [1977]. We consider measurerrt't!nts reported by Vanoni [1946], Brooks [1954], Barton and Lin [1955], Einstein and Chien [1955], Vanoni af!d Nomicos [1960], Coleman [1~81,. 1986] and Lyn [1988]. · '
The remainder. of this paper is organized' as follows. Section 2 presents the mathematical model, and section 3 contains a comparison of model computations and laboratory measurements. In section 4 we discuss results, and in section 5 we present a summary and conclusions.
2. MATHEMATICAL MODEL
2.1. Formulation
The problem to be considered is shown schematically in Figure 2. A gravity-driven turbulent flow of water with a free surface carries a dilute suspension of _solid pilrticles over·. a plane, sloping bottom. The ensemble-averaged motion· is unidirectional and is independent of stream wise positio~ x, cross-stream position y, and time t, varying only with distance z from the bottom. The solid particles are hot necessarily spherical and do not necessarily have the same size, but all particles have the same density. In the present application, the bottom stress and depth are given, and the problem is to determine the ensemble-averaged velocity and particle concentration fields. The required analysis is based on the stratified flow analogy as described in the previous section.
The representation of the particle concentration requires special treatment, because the particles do not necessarily have uniform size or shape. The particle concentration c(x, t), where xis the position vector, is defined to be the ratio of the volume of the solid phase to the volume of the solidliquid mixture. Following Brooks [1954], we introduce the
Fig. 2. Definition sketch.
' ..
'!
VILLARET AND TROWBRIDGE: STRATIFICATION BY SUSPENDED SEDIMENTS 10,661
additional function cP(x, t, w s), where w s is the settling velocity, which is defined so that cP(x, t, w s) dw s is the concentration of particles with settling velocities in the interval w s ± (1/2) dw., in the limit as dw s approaches zero. The quantities c and cP are related by
{+oo c(x, t) = Jo cP(X, t, ws) dws (1)
The ensemble average of this expression is
{+oo C(z) = Jo <l>(z, ws) dws (2)
where C and <I> are the ensemble averages of c and q,, respectively.
The motion shown schematically in Figure 2 is described by the ensemble-averaged x momentum equation and the ensemble-averaged mass conservation equation for particles of a particular settling velocity. Under the stated conditions, these equations may be integrated straightforwardly with respect to z and, after application of the conditions of zero stress and zero particle flux at the free surface z = h, may be shown to reduce to [e.g., Smith and McLean, 1977]
d<l> YT- = -ws<l>
dz
(3)
(4)
Here 11T and YT are the eddy viscosity and eddy diffusivity, respectively; U( z) is the ensemble-averaged x component of the velocity; and u * is the shear velocity.
Following Smith and McLean [1977], we assume that the eddy viscosity and eddy diffusivity are expressible in the following form:
(5)
(6)
Here 11T N( z) is the effective viscosity that would exist under neutral conditions (i.e., conditions in which suspended particles do not stratify the flow), aN is the turbulent Schmidt number for solid particles under neutral conditions, {3 1 and {32 are empirical constants, and RF(z) is the flux Richardson number, which may be written, after introduction of (3),
gyT(dp/dz)
p 0 11T(du/dz) 2
g(s- 1)yT(dC!dz)
u;[l- (z!h)](duldz) (7)
where g is the magnitude of the gravitational acceleration, Po is the density of the water, p( z) is the ensemble-averaged density of the fluid-solid mixture, and s is the ratio of the density of the solid particles to the density of the water. In writing (7) we have expressed the density of the fluid-solid mixture in terms of the particle concentration. The terms proportional to RF in (5) and (6) represent the effect of stratification by suspended particles.
To determine the neutral eddy viscosity 11T N( z), we use results of laboratory measurements reported by Nezu and
Rodi [1986], which show that the mean velocity in clear water near the centerline of a wide, open channel is well represented above the viscous wall region by
--= - ln ( z) + - sin 2 - - + const UN(Z) 1 2II (7T Z)
U* K K 2 h (8)
where K is the Karman constant and subscript N indicates neutral conditions, as before. The second term on the right-hand side of (8) is the wake correction [Coles, 1956], and II is the empirical Coles parameter, which determines the strength of the wake correction. The corresponding distribution of the neutral eddy viscosity, for the linearly varying shear stress given by (3), is
Ku*z[1- (zlh)] IITN(z) = .
1 + II( 1rz/h) sm ( 7TZih) (9)
Equations (8) and (9) are valid in clear water above both rough and smooth plane beds, provided that z is large enough so that viscosity and the details of the flow past individual roughness elements have no direct influence on the Reynolds-averaged motion. At sufficiently large z, viscous effects and roughness effects influence only the constant in (8) and have no influence on (9). Equation (9) differs slightly from distributions of neutral eddy viscosity used in previous analyses of free-surface flows [e.g., Smith and McLean, 1977]. The differences occur near the free surface, where determination of the eddy viscosity is difficult because the stress vanishes and the shear is observed to be near zero. The precise behavior of the eddy viscosity near the free surface is not important, because our application is limited to zlh :s 0.6, so that we do not consider the region immediately adjacent to the free surface.
Equations (2) through (7), together with (9), describe U, <I>, and C under the conditions shown schematically in Figure 2, for given u *, g, h and s. To provide the required boundary conditions, we assume that U(z) and <l>(z, w s) are known at a reference elevation z = z,. The precise location of the reference elevation is arbitrary. The difficult problem of determining U(z,) and <l>(z, ws) as functions of the bottom, flow, and particle characteristics is beyond the scope of this paper.
The quantities K, II, aN, {3 1 , and {32 are empirical constants. The Karman constant K and, to a lesser extent, the Coles parameter II are well constrained by high-quality measurements in flows of clear water [e.g., Nezu and Rodi, 1986], which indicate that K = 0.40 ± 0.01 and that II= 0.2 under fully turbulent conditions. The quantities aN, {3 1 , and {32 are less well constrained. Measurements in the stably stratified atmospheric surface layer typically indicate that {3 1 and {32 are between 5 and 10, and that the neutral turbulent Prandtl number (analogous to aN) is close to unity, although some measurements indicate that the neutral turbulent Prandtl number may be 10% to 20% smaller than unity (see summaries by Monin and Yaglom [1971], Dyer [1974], Yaglom [1977], Wieringa [1980], and Hagstrom [1988]).
2.2. Approximate Solution
Although numerical solution of the system of equations presented in the previous subsection is straightforward [Smith and McLean, 1977], an approximate solution is more
10,662 VILLARET AND TROWBRIDGE: STRATIFICATION BY SUSPENDED SEDIMENTS
useful for the present purposes. We concentrate on obtaining a solution that is useful for comparing the mathematical model with laboratory measurements, instead of a solution that is useful for purely predictive purposes.
To obtain an approximate solution for the velocity, it is convenient and justifiable in most of our applications to assume that the stratification effect is a small correction to neutral conditions. We express this idea formally by treating R F as a small parameter, carrying the solution for the velocity to the first order in R F, and neglecting terms proportional to Rj,. Substitution of (5) and (9) into (3) yields
dU u* II TTU* (TTZ) dU - = - + - -- sin - + {3 1Rp -dz KZ K h h dz
(10)
After substitution of (6) into (7), the flux Richardson number may be written
g(s- I) vT (dC/dz) N O(R2)
aN u;[1- (zlh)](dU!dz) + F Rp= (11)
By combining (10) and (11) and integrating the resulting expression from z, to an arbitrary elevation z, one obtains
-- = -- + - ln - + - sm -- · ~sm - -U(z) U(z,) I ( z) 211 [ . 2(7T z) .. 2.(7T z,)] u* u* K z, K 2 h 2 h
{3 1 Kgh(s- 1) fz VTN h dC 2 -- 2 -----dz+O(Rp) aN u* z,Ku*hh-zdz
(12)
This is the desired expression for the velocity field. The third and fourth terms on the right-hand side are the wake and stratification effects, respectively.
To obtain an expression for the particle concentration field, we solve (4) subject to the stated boundary condition and substitute the result into (2), obtaining without approx-imation
{ + oo ( (z dz) C(z) = Jo <l>(zn Ws) exp -ws Jz, 'YT dws (13)
To obtain a useful result, it is necessary to introduce a simplifying assumption about <l>(z" w s), because measurements sufficient to determine this quantity are rarely obtained in laboratory experiments. Because most of the laboratory experiments considered in this paper were carried out with well-sorted sands, it is reasonable to assume that <l>(z" w s) is narrowly distributed about a mean settling velocity w s ( z,), defined by
ws(Z,) = -1- {+"' ws<I>Czn w,) dws
C(z,) Jo (14)
An approximation to the integral in (13) may be obtained by expressing the exponential in the integrand as a Taylor series about ws = ws(Z,) and retaining the first few terms. The result of this straightforward calculation is
[ {z dzl C(z) = C(z,) exp -ws(z,) Jz, 'YT
[ 1 a-
2
(z,) ( fz dz)2 l · 1 +-=z- ws(z,) - ···
2 ws (z,) 'YT z, (15)
where the variance a-2 ( z,) is defined by
2 - 1 {+oo - 2 CT (z,)- C(z,) Jo [ws- ws(z,)] <l>(z" ws) dws (16)
If<l>(z" ws) is narrowly distributed about ws(z,), and if the quantity w s( z,) f zz, 'Yi 1 dz is 0( 1) or less, as it is in most of our applications, then the second term in the series on the right side of (15) is a small correction to the first, and subsequent terms are even smaller. By retaining only the first two terms in the series in (15), we therefore obtain a simple approximation that includes the effect of nonuniform settling velocity.
To proceed further with the solution for the particle concentration, it is necessary to assume that the stratification effect is a small correction to neutral conditions, as in the case of the velocity field. By taking the logarithm of (15) and using the expansion ln (1 + x) = x + O(x 2
), we obtain
ln [C(z)] = ln [C(z,)]'- Ws(z,)
· -+-=z- ws(Z,)' - +··· f
z dz 1 a-2(z,) ( fz dz)
2 ' .
z, 'YT 2 Ws (z,) . z,''YT ,. (17)
' To evaluate the integral' in this expression, we ir;~troduce (6), obtaining
f
z dz fz 2 KU* dz ws(z,) - = Z [1 + f32RF + O(Rp)] ---
z, 'Y T z, VT N (18)
where Z is the Rouse parameter, defined here by
(19)
Substitution of (11) into (18) yields, after straightforward algebra and use of (3) and (5),
_ fz dz fz KU* dz {3 2 K2gh(s- I)
ws(z,) -=Z -----z 2 z, 'Y T z, V TN aN U *
f
z VTN h 2 dC 2
• -- 2 - dz + O(Rp) Ku*h (h- z) dz z,
(20)
The third term on the right-hand side of (17) represents the small effect of nonuniform settling velocity, and the second term on the right-hand side of (20) represents the small effect of stratification. When substituting (20) into (17), it is consistent to neglect the small stratification effect when evaluating the small effect of nonuniform settling velocity. With this approximation, substitution of (20) into (17) and use of (6) yields
fz KU* dz {3 2 In[C(z)]=In[C(z,)]-Z --+-Z
z, vrN aN
1 a-2(z,) 2(fz KU* dz)
2 +----z --- + ...
2 Ws 2(z,) , VT '' N
(21)

VILLARET AND TROWBRIDGE: STRATIFICATION BY SUSPENDED SEDIMENTS 10,663
This is the desired expression for the particle concentration field. The first two terms on the right-hand side represent the classical Rouse profile [Rouse, 1937], slightly modified by the wake effect. The third and fourth terms are the small effects of stratification and nonuniform settling velocity, respectively.
The solution (12) for the velocity field and the solution (21) for the concentration field, with v7N given by (9), are not useful for predictive purposes, because the dependent variable C appears on the right-hand side of both equations. These expressions are suitable, however, for testing the stratified flow analogy through comparisons with laboratory measurements. The expression (12) for the velocity field may be written
where
au V(z,) 131 -=--+-X (22)
X= Kgh(s - l) fz dC _!3_
u; dX1 h- z z,
(24)
and where X 1 is defined by
fz. KU* dz XI= ---
z,. VTN
(25)
The expression (21) for the concentration field may be written
In [C(z)] =In [C(z,)]- ZX1 - 1!..3:_ ZX2 aN
where
Xz=
1 u2(z,) 2 2 +-=z--Z X 1 2 ws (z,)
(26)
(27)
In (22) and (23) the quantity 1:1Uiu* is equal, to within an additive constant, to the departure of the dimensionless velocity in a sediment-laden flow from the dimensionless velocity that would occur in the corresponding flow of clear water (see (8)). The quantity X in (22) and (24) represents the effect of stratification by suspended sediments on the dimensionless velocity profile. In (26) the term proportional to X 1
represents the concentration profile that would occur if stratification had no effect and if the settling velocity were uniform. The terms proportional to X 2 and X? represent the effects of stratification and nonuniform settling velocity, respectively.
In (22) and (26) the dependent variables 1:1Uiu* and In (C) and the independent variables X, X 1 , X 2 , and X? can be estimated from laboratory experiments in which V( z), C( z), u*, h, arid s are measured, if we consider K and IT to be known. In principle, we can therefore test (22) and estimate the parameter {3 1 IaN by regressing 1:1 U I u * against X, and we can test (26) and obtain estimates of the parameters Z, f321aN, and u 2
( z,)lw s 2 ( z,) by regressing In (C) against X I'
X 2 , and Xf_ In this procedure, the quantities V(z,)lu* and In [C(z,)] in (22) and (26) are treated only as fitting parameters, and we do not attempt interpretation of these quantities.
Ideally, we would like to estimate aN, {3 1 , and {32 • If ws(z,) is known, then we can determine aN from the estimate of z (see (19)), and 131 and 132 can then be determined straightforwardly fro in the estimates of {3 1 IaN and {3 21 aN. Previous measurements in thermally stratified flows suggest that aN is within 10% or 20% of its nominal value of unity [e.g., Dyer, 1974; Yaglom, 1977; Wieringa, 1980; Hagstrom, 1988], and fairly precise estimates of Z and ws(z,) are therefore required to distinguish aN from unity. Unfortunately, information sufficient to obtain accurate estimates ofw s<z,) for any value of z, was not obtained in any of the experiments considered in this paper. We are therefore unable to obtain precise estimates of aN.
The regression procedure presented above is more accurate for the velocity field than it is for the concentration field, because the solution for the velocity is approximated only by assuming that the stratification effect is a small correction to neutral conditions, while the solution for the concentration is based on the additional assumption that <I>( z, w s) is a narrowly distributed function of w s. In addition, the expression (22) for the velocity field has only one independent variable, while the expression (26) for the.coricentration field has three independent variables.
2.3. Qualitative Features of the Solution
The solution presented in the preceding subsection is useful for comparing model computations with laboratory measurements, but it does not provide insight into the effect of stratification by suspended sediments on the structure of turbulent channel flow. To provide this insight, it is useful, for the moment, to introduce further approximations in order to obtain explicit expressions for U and C.
The first two terms on the right-hand side of (21) are the largest contribution to the particle concentration field. The remaining terms are small corrections due to stratification and nonuniform settling velocity. For the present purposes it is therefore reasonable to use the following approximation to evaluate the stratification terms in (21) and (12):
In [C(z)] =In [C(z,)]-ZX1 (28)
Substitution of (28) into the stratification corrections in (12) and (21) yields
V( z) - V( z,) 1 ( z) 2ll -In - +-
u* K Z, K
. [sin 2 (~ ~)-sin 2(~ ~)] + =~ zr f e-zx, h~z (29)
I ---
10,664 VILLARET AND TROWBRIDGE: STRATIFICATION BY SUSPENDED SEDIMENTS
100
~ 1Q-l N
.... !:~~:::!!::::../
....... ~ ~e~
- f1 -:::.\· ---'}.. -- /.)_.- -·-
1- ~ ----. /::-z-1/'2
10-2~--------~--------~--------~--------~--------~------~ 0 2 4 6 8 10 12
[U(z)- U(zr)]/u.
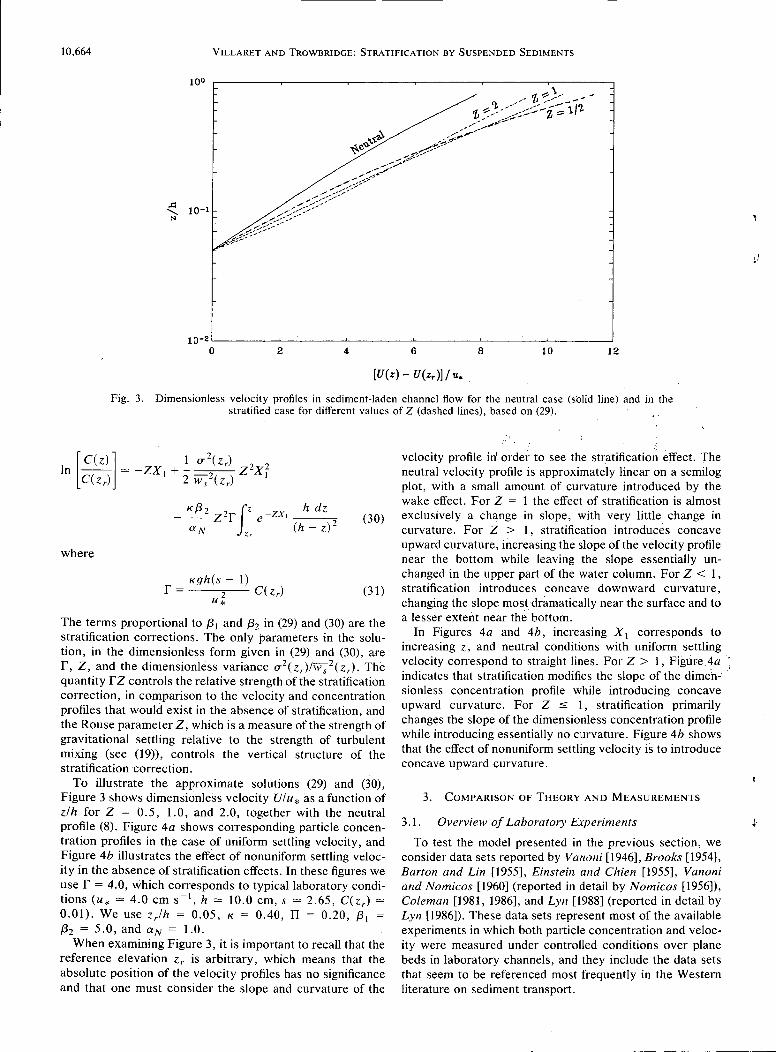
Fig. 3. Dimensionless velocity profiles in sediment-laden channel flow for the neutral case (solid line) and in the stratified case for different values of Z (dashed lines), based on (29).
K/3 2 2 Jz -zx h dz - -- Z r e I -----;;
aN (h- z) 2 z,
(30)
where
Kgh(s - 1) r= 2 C(zr)
u* (31)
The terms proportional to {3 1 and {32 in (29) and (30) are the stratification corrections. The only parameters in the solution, in the dimensionless form given in (29) and (30), are r, Z, and the dimensionless variance a 2(zr)lws 2(zr)· The quantity rz controls the relative strength of the stratification correction, in comparison to the velocity and concentration profiles that would exist in the absence of stratification, and the Rouse parameter Z, which is a measure of the strength of gravitational settling relative to the strength of turbulent mixing (see (19)), controls the vertical structure of the stratification correction.
To illustrate the approximate solutions (29) and (30), Figure 3 shows dimensionless velocity U/u* as a function of zl h for Z = 0. 5, 1. 0, and 2.0, together with the neutral profile (8). Figure 4a shows corresponding particle concentration profiles in the case of uniform settling velocity, and Figure 4b illustrates the effect of nonuniform settling velocity in the absence of stratification effects. In these figures we use r = 4.0, which corresponds to typical laboratory conditions (u* = 4.0 em s- 1
, h = 10.0 em, s = 2.65, C(zr) = 0.01). We use Zrlh = 0.05, K = 0.40, l1 = 0.20, {3 1 = {32 = 5.0, and aN = 1.0.
When examining Figure 3, it is important to recall that the reference elevation Zr is arbitrary, which means that the absolute position of the velocity profiles has no significance and that one must consider the slope and curvature of the
velocity profile in' order to see the stratification effect. The neutral velocity profile is approximately linear on a semilog plot, with a small amount of curvature introduced by the wake effect. For Z = 1 the effect of stratification is almost exclusively a change in slope, with very little change in curvature. For Z > I, stratification introduces concave upward curvature, increasing the slope of the velocity profile near the bottom while leaving the slope essentially unchanged in the upper part of the water column. For Z < 1, stratification introduces concave downward curvature, changing the slope most dramatically near the surface and to a lesser extent near the bottom.
In Figures 4a and 4b, increasing X 1 corresponds to increasing z, and neutral conditions with uniform settling velocity correspond to straight lines. For Z > 1, Figrire4a , indicates that stratification modifies the slope of the dimehsionless concentration profile while introducing concave upward curvature. For Z :S 1, stratification primarily changes the slope of the dimensionless concentration profile while introducing essentially no curvature. Figure 4b shows that the effect of nonuniform settling velocity is to introduce concave upward curvature.
3. COMPARISON OF THEORY AND MEASUREMENTS
3.1. Overview of Laboratory Experiments
To test the model presented in the previous section, we consider data sets reported by Vanoni [1946], Brooks [1954], Barton and Lin [1955], Einstein and Chien [1955], Vanoni and Nomicos [1960] (reported in detail by Nomicos [1956]), Coleman [1981, 1986], and Lyn [1988] (reported in detail by Lyn [1986]). These data sets represent most of the available experiments in which both particle concentration and velocity were measured under controlled conditions over plane beds in laboratory channels, and they include the data sets that seem to be referenced most frequently in the Western literature on sediment transport.

VILLARET AND TROWBRIDGE: STRATIFICATION BY SUSPENDED SEDIMENTS 10,665
4.---~----~-----.----.-----~----.---~----~-----.----,
3.5 '·......... ',
'·· ... ,_ z = 2 ••
'· '·,
3
2.5
1.5
·.
0.5
-9 -8 -7 -6 -5 -4 -3 -2 -1 0
ln[C(z)/C{zr )]
4.-------r------.,------,------~-------r-------.------~------.
3.5 ·--~ ~--, __ _
·. '· ..........
3
2.5
2
1.5
0.5
b
-6 -5 -4 -3 -2 -1 0
ln[C{z)/C(z. )]
Fig. 4. (a) Particle concentration profiles in sediment-laden channel flow illustrating the effect of stratification in the case of uniform particles, bas.ed on (30) with £T2(z,) = 0. For each value of Z, profile a is the neutral profile and profile b is the profile with stratification. (b) Particle concentration profiles in sediment-laden channel flow illustrating the effect of nonuniform settling velocity in the absence of stratification, based on (30) with {32 = 0. For each value of Z, profiles a and b are respectively without and with the effect of nonuniform settling velocity.
The measurements Were obtained in two different types of experiments, termed "equilibrium-bed" and "starved-bed" experiments. In an equilibrium-bed experiment, water flows over an erodible bed of sand, from which sediments can be entrained by the flow, so that the amount of sediment in suspension is in equilibrium with the flow and bed conditions. The sand bed is not necessarily plane in this type of experiment, and special conditions are necessary if an approximately plane bed is required. In a starved-bed experiment, water flows over a fixed bed from which sediment cannot be entrained by the flow, and sediments are introduced into the flow by the experimenter. From the point of view of testing the stratified flow analogy, equilibrium-bed
and starved-bed experiments are indistinguishable, provided that the bed is approximately plane.
All of the experimenters considered in this paper used quartz sand in fresh water at room temperature, and all measured ensemble-averaged particle concentration by means of a suction technique, in which water samples are withdrawn from the flowing water and then dried and weighed to determine concentration. All experimenters used Pitot tubes to measure the ensemble-averaged velocity, except for Lyn [1988], who used a two-axis laser-Doppler velocimeter (LDV). All experimenters except Lyn estimated the shear velocity u* from measurements of the depth hand bottom slope S by using the cross-sectionally integrated

10,666 VILLARET AND TROWBRIDGE: STRATIFICATION BY SUSPENDED SEDIMENTS
momentum balance; of these experimenters, all corrected for the effect of side walls except Vanoni [1946] and Barton and Lin [1955]. Lyn estimated u* by using LDV measurements of the Reynolds shear stress in all except one test (1565EQ; see Table 1).
We use all of the measurements reported by Einstein and Chien [1955], Coleman [1981, 1986], and Lyn [1988], but we exclude some of the measurements reported by the other investigators. In particular, we exclude the first of the two data sets reported by Vanoni [1946] because he considered the first set to be inferior in quality to the second, owing to disturbances introduced by the pump. Brooks [1954] and Barton and Lin [1955] carried out equilibrium-bed experiments, obtaining a variety of different bed configurations. Of the many experiments carried out by these researchers, we use those in which the bed was reported to remain plane. In addition, we use only the later runs reported by Barton and Lin (runs 26 and later), in which the measurement station was moved downstream to ensure fully developed flow. Vanoni and Nomicos [1960] carried out both equilibrium-bed and starved-bed experiments, reporting only two (runs 5 and 7) in which the bed remained plane and both concentration measurements and velocity measurements were obtained. Of these, Nomicos [1956] considered run 5 to be inferior in quality to run 7, and we therefore consider only run 7.
Listed in the Table 1 are the flow parameters (u* and h), sediment parameters (d and w s ) and concentration Cat z = 1 em (interpolated from measu~ements) for all of the experiments considered in this paper. Here, d is the mean grain diameter of the sand used in the particular experiment, and w s is an estimate of the settling velocity of quartz sand gr;ins of diameter d. As was noted previously, information sufficient to estimate the mean settling velocity w s at a reference elevation z, was not obtained in any of the experiments. In Table 1 the experiments reported by Vanoni [1946], Einstein and Chien [1955], and Coleman [1981, 1986] are starved-bed experiments, and the experiments reported by Brooks [1954] and by Barton and Lin [1955] are equilibrium-bed experiments. Lyn [1988] reported both equilibriumbed and starved-bed experiments, denoted respectively EQ and ST in the run numbers. In the starved-bed experiments reported by Einstein and Chien [1955], Coleman [1981, 1986], and Lyn [1988], the flow conditions remained approximately fixed, while the sediment concentration was systematically increased.
A potentially important parameter in laboratory flow channels is the aspect ratio bl h, where b is the channel breadth, which should ideally be large enough to ensure that the ensemble-averaged flow near the channel centerline is approximately independent of cross-stream position. The value of bl h at which sidewall effects become unimportant near the channel centerline is not known precisely, but Nakagawa et a!. [1983] suggested b/h > 4 as an approximate criterion. This criterion is satisfied in all of Vanoni's [1946], Barton and Lin's [1955] and Lyn's [1988] experiments. It is not quite satisfied in the experiments reported by Brooks [1954] and by Vanoni and Nomicos [1960], for which 3 < blh < 4 in all except one case. The criterion blh > 4 is clearly not satisfied in the experiments reported by Coleman [1981, 1986] and Einstein and Chien [1955], for which blh - 2, and there is evidence of sidewall effects in Coleman's measurements, including in particular a maximum well below the surface in the ensemble-averaged velocity. In order to reduce the
influence of side walls on our results, we limit our analysis in all cases to the region zl h < 0. 6, based on the idea that sidewall effects become more important near the free surface [e.g., Lyn, 1988].
Comparisons of different data sets are useful in order to obtain an appreciation of possible variability in data quality. If we consider the region zlh less than approximately 0.2, then it is reasonable to assume that h has a small effect on the ensemble-averaged motion, on the basis of classical ideas about wall-bounded turbulent shear flows [e.g., Monin and Yaglom, 1971]. If we assume in addition that the effect of nonuniform settling velocity is small, then it is reasonable to expect that experiments with approximately the same values of u *, w s , and C at a fixed arbitrary elevation will produce approxi~ately the same results for z/h < 0.2, provided that the ensemble-averaged velocity is shifted so that all velocity profiles coincide at one point. Only a few of the many experiments listed in Table 1 can be tested on the basis of these idea. A particularly encouraging result is obtained by comparing measurements reported by Brooks (run 3, 6 and 7), Vanoni and Nomicos (run 7), and Lyn (run 1565EQ), as shown in Figure 5. The good agreement in this comparison is noteworthy because it includes velocity measurements obtained with two different techniques (Pitot tube and LDV). In contrast, large systematic differences are apparent between measurements reported by Coleman (run 22) and Lyn (run 1957ST-2:A), as shown in Figure 6. It is not clear at present which of the two data sets shown in Figure 6 is more nearly consistent with the idealized problem shown in Figure 2. Figure 6 suggests that there may be significant, systematic errors in some of the runs listed in Table 1, most of which could not be compared with other runs.
3.2. Velocity Profiles in Clear Water
An examination of velocity profiles measured in clear water, for which a standard semiempirical result (equation (8)) exists, is useful. To compare (8) with velocity profiles measured in clear water, we use U N(z,)lu* as a fitting parameter, and we use K = 0.40, II= 0.20 and z,lh = 0.1. Measurements in clear water were reported by all experimenters listed in Table I except for Barton and Lin [1955]. It is convenient to consider measurements reported by Vanoni [1946] and by Einstein and Chien [1955] separately from the others.
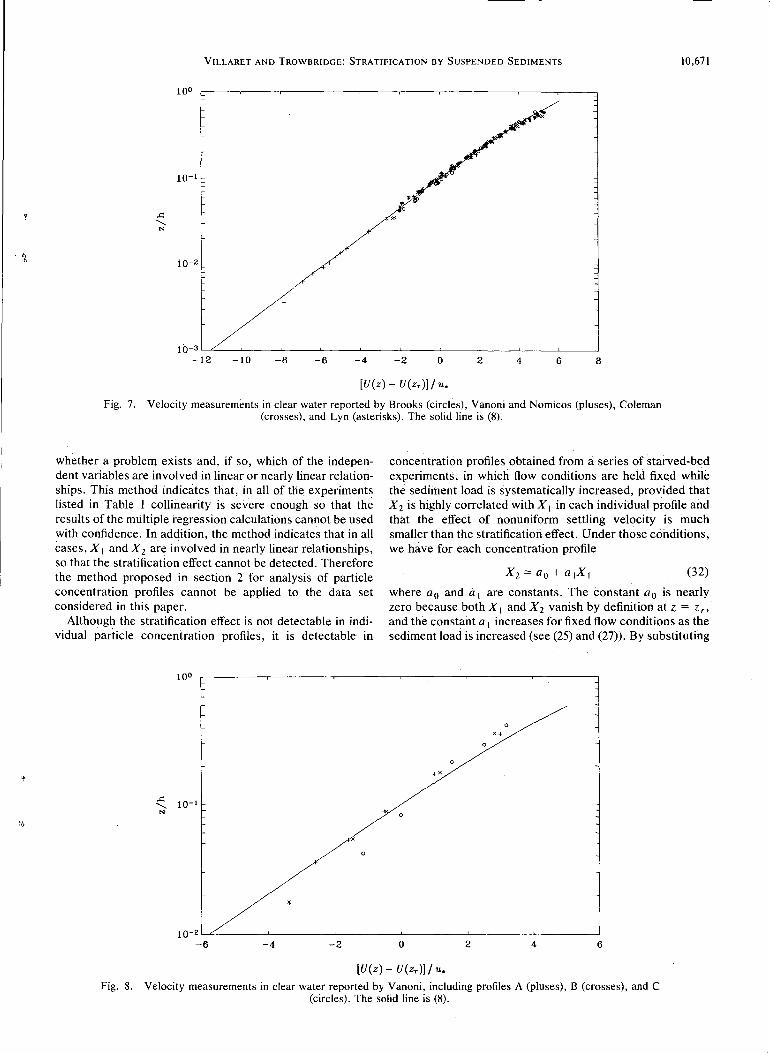
Good agreement between (8) and velocity measurements in clear water is apparent in Figure 7, which shows measurements reported by Brooks [1954], Vanoni and Nomicos [1960], Coleman [1981, 1986], and Lyn [1988]. There are in some cases slight systematic deviations at the largest values of zl h, which are possibly a result of finite channel breadth, but these are not important for our purposes.
Vanoni's [1946] clear-water measurements shown in Figure 8, are not as satisfactory, indicating small but systematic departures from (8), in which the measured dimensionless shear (zlu*)(dU/dz) is smaller than that indicated by the semiempirical expression. The deviations from (8) are improved slightly ifVanoni's estimates of u* are corrected for sidewall effects based on the empirical correlation proposed by Knight et a!. [1984], but this correction (typically about 10% and often much smaller) is not sufficient to bring Vanoni's clear-water measurements into coincidence with (8). If K is used as a fitting parameter, then the measurements in Figure 8 indicate that K is about 25% larger than its

l
VILLARET AND TROWBRIDGE: STRATIFICATION BY SUSPENDED SEDIMENTS 10,667
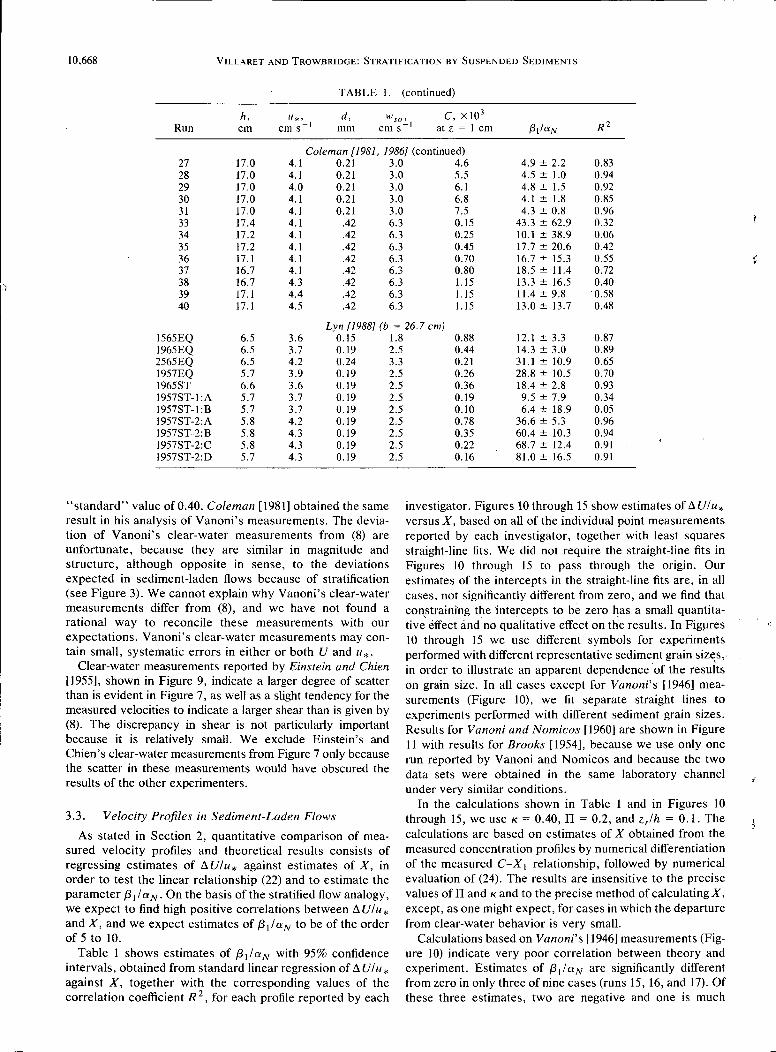
TABLE I. Flow and Sediment Parameters, Concentration, {3 1/aN, and Regression Coefficient For All Experiments Considered
h, u*, d, WSO' C, Xi0 3
Run em em s- 1 mm em s-1 at z = I em {3 1/aN R2
Vanoni [1946] (b = 84.5 em) 14 16.4 6.3 0.16 1.8 2.80 -1.6 ± 2.9 0.12 15 08.4 4.5 0.16 1.8 0.25 23.1 ± 4.5 0.94 16 16.4 4.5 0.16 1.8 0.93 -11.2±3.4 0.83 17 08.2 3.2 0.16 1.8 0.02 -1267 ± 557 0.91 18 14.1 4.1 0.10 0.8 0.70 0.9 ± 1.1 0.25 19 07.2 3.0 0.10 0.8 0.10 -5.5 ± 19.5 0.06 20 14.1 5.9 0.10 0.8 1.20 -4.5 ± 7.7 0.16
CJ 21 07.1 4.1 0.10 0.8 0.46 2.2 ± 7.8 0.07 22 09.0 4.7 0.13 1.2 0.79 -3.3 ± 4.6 0.30
Brooks [1954] (b = 26.7 em) 2 8.7 3.6 0.15 1.7 1.50 5.5 ± 1.7 0.96 3 7.4 4.1 0.15 1.7 0.95 11.4 ± 4.2 0.94 4 7.2 4.0 0.15 1.7 1.90 5.0 ± 3.2 0.90 6 6.0 3.8 0.15 1.7 1.10 8.2 ± 4.0 0.74 7 7.4 3.8 0.15 1.7 0.99 10.3 ± 4.8 0.90
21 7.2 3.8 .09 0.8 4.60 4.9 ± 1.0 0.96 29 8.5 3.5 .09 0.8 4.20 5.7 ± 0.9 0.98
Barton and Lin [ 1955] (b = 121.9 em) 26 21.0 4.9 0.18 2.0 9.9 3.0 ± 0:9 0.86 29 18.3 4.6 0.18 2.0 3.0 16.8 ± 6.2 0.83 31 12.8 3.8 0.18 2.0 2.2 11.0 ± 2.1 0.96 35 17.1 4.9 0.18 2.0 2.9 -4.2 ± 2.1 0.69 36 16.2 5.5 0.18 2.0 6.2 2.0 ± 1.2 0.67
Einstein and Chien [1955] (b = 30.7 em) I 13.8 11.5 1.30 15.7 8.5 10.8 ± 2.3 0.95 2 12.0 12.8 1.30 15.7 25.6 11.4 ± 1.0 0.99 3 11.6 13.3 1.30 15.7 34.0 9.9 ± 0.5 1.00 4 11.5 14.3 1.30 15.7 58.1 9.3 ± 0.6 0.99 5 11.0 14.5 1.30 15.7 87.2 8.5 ± 0.3 1.00 6 14.3 11.8 0.90 12.4 3.7 18.9 ± 5.4 0.91 7 14.2 11.8 0.90 12.4 9.4 9.5 ± 1.0 0.98 8 13.9 11.5 0.90 12.4 11.0 18.2 ± 4.6 0.87 9 13.5 11.8 0.90 12.4 18.4 11.0 ± 1.3 0.97
10 13.0 12.6 0.90 12.4 29.0 8.9 ± 0.9 0.98 11 13.3 10.6 0.27 3.9 5.4 -3.9 ± 3.4 0.57 12 13.2 10.1 0.27 3.9 28.6 5.0 ± 0.9 0.96 13 13.4 10.5 0.27 3.9 47.0 4.4 ± 0.5 0.98 14 12.4 12.1 0.27 3.9 65.8 5.1 ±0.4 0.98 15 12.4 11.0 0.27 3.9 118.4 3.5 ± 0.3 0.99 16 11.9 12.5 0.27 3.9 126.6 4.1 ± 0.5 0.96
Vanoni and Nomieos [1960] (b = 26.7 em) 7 7.8 4.1 0.16 1.9 0.77 12.4 ± 5.8 0.86
Coleman [1981, 1986] (b = 35.6 em) 2 17.1 4.1 0.11 1.1 0.7 8.4 ± 5.8 0.67 3 17.1 4.1 0.11 1.1 1.3 8.4 ± 4.5 0.77 4 17.1 4.1 0.11 1.1 2.1 5.8 ± 2.0 0.90 5 17.1 4.1 0.11 1.1 2.9 6.0 ± 2.1 0.88 6 17.1 4.1 0.11 1.1 3.6 5.2 ± 2.2 0.85 7 17.1 4.1 0.11 1.1 4.5 4.9 ± 1.5 0.92 8 17.1 4.1 0.11 1.1 5.5 3.9 ± 0.9 0.94 9 17.1 4.1 0.11 1.1 6.7 3.9 ± 1.2 0.90
II,~ 10 17.1 4.1 0.11 1.1 7.5 3.9 ± 0.7 0.96 11 17.1 4.1 0.11 1.1 8.7 4.1 ± 0.9 0.96 12 17.1 4.1 0.11 1.1 9.3 3.4 ± 1.1 0.90 13 17.1 4.1 0.11 1.1 10.1 3.7 ± 0.8 0.96 14 17.1 4.1 0.11 1.1 11.0 3.4 ± 0.7 0.96 15 17.1 4.1 0.11 1.1 11.5 3.6 ± 0.5 0.98 16 17.1 4.1 0.11 1.1 12.5 3.5 ± 0.7 0.96 17 17.1 4.1 0.11 1.1 12.7 3.2 ± 1.2 0.88 18 17.1 4.1 0.11 1.1 12.7 2.9 ± 0.6 0.96 19 17.1 4.1 0.11 1.1 13.9 2.3 ± 0.6 0.96 20 17 .I 4.1 0.11 1.1 14.2 3.2 ± 0.7 0.96 22 17.0 4.1 0.21 3.0 0.7 -8.2 ± 16.6 0.19 23 17.0 4.1 0.21 3.0 1.4 2.4 ± 5.8 0.16 24 17.0 4.1 0.21 3.0 2.1 4.6 ± 3.5 0.64 25 17.0 4.0 0.21 3.0 3.1 7.5 ± 1.7 0.96 26 17.0 4.1 0.21 3.0 3.7 4.7 ± 1.3 0.94
:)
10,668 VILLARET AND TROWBRIDGE: STRATIFICATION BY SUSPENDED SEDIMENTS
TABLE I. (continued)
h, U*, d, WSO' C, xJ0 3
em s- 1 em s- 1 R2 Run em mm at z =I em f3tfo:N
Coleman [1981, 1986] (continued) 27 17.0 4.1 0.21 3.0 4.6 4.9 ± 2.2 0.83 28 17.0 4.1 0.21 3.0 5.5 4.5 ± 1.0 0.94 29 17.0 4.0 0.21 3.0 6.1 4.8 ± 1.5 0.92 30 17.0 4.1 0.21 3.0 6.8 4.1 ± 1.8 0.85 31 17.0 4.1 0.21 3.0 7.5 4.3 ± 0.8 0.96 33 17.4 4.1 .42 6.3 0.15 43.3 ± 62.9 0.32 34 17.2 4.1 .42 6.3 0.25 10.1 ± 38.9 0.06 35 17.2 4.1 .42 6.3 0.45 17.7 ± 20.6 0.42 36 17.1 4.1 .42 6.3 0.70 16.7 ± 15.3 0.55 37 16.7 4.1 .42 6.3 0.80 18.5 ± 11.4 0.72 38 16.7 4.3 .42 6.3 1.15 13.3 ± 16.5 0.40 39 17.1 4.4 .42 6.3 1.15 11.4 ± 9.8 0.58 40 17.1 4.5 .42 6.3 1.15 13.0 ± 13.7 0.48
Lyn [1988] (b = 26.7 em) 1565EQ 6.5 3.6 0.15 1.8 1965EQ 6.5 3.7 0.19 2.5 2565EQ 6.5 4.2 0.24 3.3 1957EQ 5.7 3.9 0.19 2.5 1965ST 6.6 3.6 0.19 2.5 1957ST-l:A 5.7 3.7 0.19 2.5 1957ST-I:B 5.7 3.7 0.19 2.5 1957ST-2:A 5.8 4.2 0.19 2.5 1957ST-2:B 5.8 4.3 0.19 2.5 1957ST-2:C 5.8 4.3 0.19 2.5 1957ST-2:D 5.7 4.3 0.19 2.5
"standard" value of0.40. Coleman [1981] obtained the same result in his analysis of Vanoni's measurements. The deviation of Vanoni's clear-water measurements from (8) are unfortunate, because they are similar in magnitude and structure, although opposite in sense, to the deviations expected in sediment-laden flows because of stratification (see Figure 3). We cannot explain why Vanoni's clear-water measurements differ from (8), and we have not found a rational way to reconcile these measurements with our expectations. Vanoni's clear-water measurements may contain small, systematic errors in either or both U and u*.
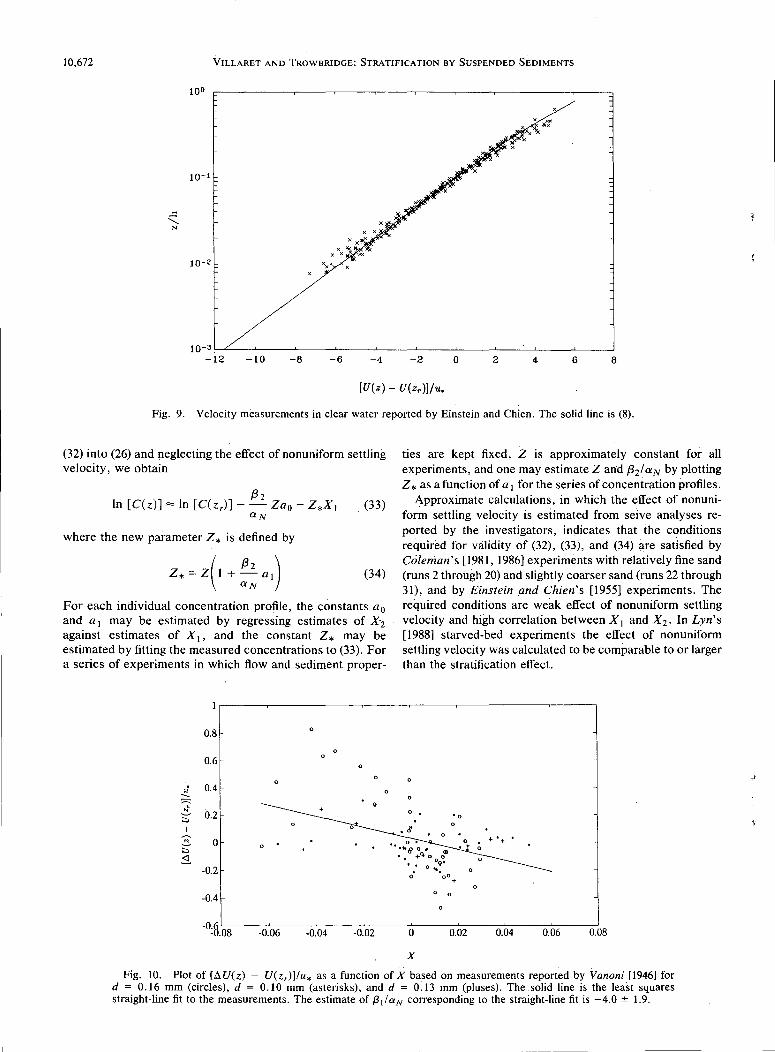
Clear-water measurements reported by Einstein and Chien [1955], shown in Figure 9, indicate a larger degree of scatter than is evident in Figure 7, as well as a slight tendency for the measured velocities to indicate a larger shear than is given by (8). The discrepancy in shear is not particularly important because it is relatively small. We exclude Einstein's and Chien's clear-water measurements from Figure 7 only because the scatter in these measurements would have obscured the results of the other experimenters.
0.88 12.1 ± 3.3 0.87 0.44 14.3 ± 3.0 0.89 0.21 31.1 ± 10.9 0.65 0.26 28.8 ± 10.5 0.70 0.36 18.4 ± 2.8 0.93 0.19 9.5 ± 7.9 0.34 0.10 6.4 ± 18.9 0.05 0.78 36.6 ± 5.3 0.96 0.35 60.4 ± 10.3 0.94 0.22 68.7 ± 12.4 0.91 0.16 81.0 ± 16.5 0.91
investigator. Figures 10 through 15 show estimates of !:J.Uiu* versus X, based on all of the individual point measurements reported by each investigator, together with least squares straight-line fits. We did not require the straight-line fits in Figures 10 through 15 to pass through the origin. Our estimates of the intercepts in the straight-line fits are, in all cases, not significantly different from zero, and we find that con,straining the intt:rcepts to be zero has a small quantitative effect and no quaiitative effect on the results. In FigJ.Ires 10 through 15 we use different symbols for experiments performed with different representative sediment grain sizes, in order to illustrate an apparent dependence of the resuits on grain size. In all cases except for Vanoni's [1946] measurements (Figure 10), we fit separate straight lines to experiments performed with different sediment grain sizes. Results for Vanoni and Nomicos [1960] are shown in Figure 11 with results for Brooks [1954], because we use only one run reported by Vanoni and Nomicos and because the two data sets were obtained in the same laboratory channel under very similar conditions.
In the calculations shown in Table 1 and in Figures I 0
(
3.3. Velocity Profiles in Sediment-Laden Flows through 15, we use K = 0.40, II = 0.2, and Zrlh = 0.1. The .~
calculations are based on estimates of X obtained from the measured concentration profiles by numerical differentiation
As stated in Section 2, quantitative comparison of measured velocity profiles and theoretical results consists of regressing estimates of !:J.Uiu* against estimates of X, in order to test the linear relationship (22) and to estimate the parameter {3 1 IaN. On the basis of the stratified flow analogy, we expect to find high positive correlations between !:J.Uiu* and X, and we expect estimates of {3 1 IaN to be of the order of 5 to 10.
Table I shows estimates of {3 11aN with 95% confidence intervals, obtained from standard linear regression of !:J. VI u* against X, together with the corresponding values of the correlation coefficient R 2 , for each profile reported by each
of the measured C-X 1 relationship, followed by numerical evaluation of (24). The results are insensitive to the precise values of II and K and to the precise method of calculating X, except, as one might expect, for cases in which the departure from clear-water behavior is very small.
Calculations based on Vanoni's [1946] measurements (Figure 10) indicate very poor correlation between theory and experiment. Estimates of {3 11aN are significantly different from zero in only three of nine cases (runs 15, 16, and 17). Of I
lh"'' threo '"imat"', two "'' nogalivo and ono i• moo~

t, .
, ..
VILLARET AND TROWBRIDGE: STRATIFICATION BY SUSPENDED SEDIMENTS 10,669
10'
l,:++
xob + Sl+ ..
+~ ox
10° O.p
"0 H>
s 0 <II-" -+dl
~ &,+ ...
+ + +
+ 1Q-1 +
+
+
+
a lQ-2
-60 -50 -40 -30 -20 -10 0 10 20 30
U(z)- U(zr) (cmfs)
101
+ 0
9 0 X
+ X 0
+ 0 X
0 + ox
+ X
C4- 00 X
X + xo s 10°
X +00
~ ... X 0
+"'x
00
0 00
(
b lQ-1
lQ-6 1Q-5 10-4 1Q-3 lQ-2
C(z)
Fig. 5. (a) Velocity measurements and (b) concentration measurements reported by Brooks (runs 3, 6, and 7; circles) Vanoni and Nomicos (run 7; pluses), and Lyn (run 1565EQ; crosses). In this figure, z, = 1 em.
larger than expected. Figure 10 indicates variability roughly comparable in magnitude to that expected from stratification, but the correlation is negative instead of positive. These results are not improved significantly if estimates of u* are corrected for sidewall effects by using the empirical correlation proposed by Knight et al. [1984].
The correlation between theoretical results and measurements reported by Brooks [1954], Barton and Lin [1955], Einstein and Chien [1955], Vanoni and Nomicos [1960], and Coleman [1981, 1986] (Figures 11 through 14) is much better. There is substantial variability in results obtained from individual profiles, but the results obtained for each investigator, when plotted on one graph, are in qualitative and quantitative agreement with expectations based on the strat-
ified flow analogy. Figures 11, 13, and 14 suggest a weak dependence on sediment grain size, in which estimates of {3 1 IaN are larger for coarser particles. In addition, the results given in Table 1 for the starved-bed experiments reported by Einstein and Chien and by Coleman indicate a slight decrease in estimates of {3 1 IaN with increasing sediment concentration, for fixed flow conditions.
Calculations for Lyn's [1988] measurements (Figure 15) produce estimates of {31 I aN that are significantly different from zero and positive in all cases but one, indicating qualitative consistency with the theory. Estimates of {3 11aN based on these measurements are, overall, larger than expected, and estimates obtained from the 1957ST-2 series of starved-bed experiments are an order of magnitude larger than expected. Lyn's experi-

10,670 VILLARET AND TROWBRIDGE: STRATIFICATION BY SUSPENDED SEDIMENTS
102
oo 'i,
to•
+ + + +
s +
+
-:::.. 0 + +
"' 0 + lQO +
+ +
a lQ-lL_ ____ ~----~-L------~------~----~-------L ______ J_ ____ ~
-10 -5 0 5 10 15 20 25 30
U(z)- U(zr) (cm/s)
10 1
+ + s +
-:::.. + 0
"' + 0
+ 0 +
+ lQO
+0 +
+ +
0 + +
b lQ-1
lQ-6 lQ-5 lQ-4 lQ-3 lQ-2
C(z)
Fig. 6. (a) Velocity measurements and (b) concentration measurements reported by Coleman (run 22, circles) and Lyn (run 1957ST-2:A, pluses). In this figure, z, = I em.
ments, excluding the 1957ST-2 series, indicate a consistent dependence on sediment grain diameter, in which larger values of {3 1/aN correspond to coarser sediments. Calculations based on the 1957ST-2 series of starved-bed experiments show a decrease in {3 1/aN with increasing concentration for fixed flow conditions and sediment properties, but calculations based on Lyn's other starved-bed experiments (1965ST and 1957ST-1) show the opposite trend.
3.4. Particle Concentration Profiles
As was stated in section 2, a quantitative comparison of observed particle concentration profiles and measurements consists of regressing measurements of In (C) against X 1 ,
X 2 , and X f in order to test the linear relationship (26) and
estimate the parameters Z, fhlaN, and u 2(z,)lws 2 (z,). These calculations are based on estimates of X 2 obtained from the measured concentration profiles by numerical differentiation of the measured C-X 1 relationship, followed by numerical evaluation of (27). As before, we use K = 0.40, II= 0.20, and z,lh = 0.1.
When attempting the required multiple regression calculations, we encountered linear or nearly linear relationships between the independent variables XI, x2, and x?, which can cause the regression problem to the ill-determined [e.g., Draper and Smith, 1966]. To detect and diagnose collinearity in a systematic manner, we used the singular-value decomposition method proposed by Belsley et a/. [1980, pp. 157-158] (with a threshold condition index of 15), which indicates
I
. ,, •
VILLARET AND TROWBRIDGE: STRATIFICATION BY SUSPENDED SEDIMENTS 10,671
t0°
to-1
.<:: "' '-N
iQ-2
+
ti:J-3 -t2 -to -8 -6 -4 -2 0 2 4 6 8
[U(z)- U(zr)] I u.
Fig. 7. Velocity measurements in clear water reported by Brooks (circles), Vanoni and Nomicos (pluses), Coleman (crosses), and Lyn (asterisks). The solid line is (8).
whether a problem exists and, if so, which of the independent variables are involved in liriear or nearly linear relationships. This method indicates that, in all of the experiments listed in Table I collinearity is severe enough so that the results of the multiple regression calculations cannot be used with confidence. In addition, the method indicates that in all cases, X 1 and X 2 are involved in nearly linear relationships, so that the stratification effect cannot be detected. Therefore the method proposed in section 2 for analysis of particle concentration profiles cannot be applied to the data set considered in this paper.
Although the stratification effect is not detectable in individual particle concentration profiles, it is detectable in
t0°
~ 1Q-l N
0
concentration profiles obtained from a series of starved-bed experiments, in which flow conditions are held fixed while the sediment load is systematically increased, provided that X 2 is highly correlated with X I in each individual profile and that the effect of nonuniform settling velocity Is much smaller than the stratification effect. Under those conditions, we have for each concentration profile
(32)
where a 0 and a I are constants. The constant a 0 is nearly zero because both X 1 and X 2 vanish by definition at z = z r,
and the constant a I increases for fixed flow conditions as the sediment load is increased (see (25) and (27)). By substituting
0
X+
0
10-2LL ________ L_ ________ L-------~~------~--------~--------~
-6 -4 -2 0 2 4 6
[U(z)- U(zr )] I u.
Fig. 8. Velocity measurements in clear water reported by Varioni, including profiles A (pluses), B (crosses), and C (circles). The solid line is (8).
l
10,672 VILLARET AND TROWBRIDGE: STRATIFICATION BY SUSPENDED SEDIMENTS
10°
lQ-1
lQ-2
to-3~~--L-----L-----L-----L-----L-----L-----~----~--~~--~. -12 -10 -8 -6 -4 -2 0 2 4 6 8
[U(z)- U(z.)]/u.
Fig. 9. Velocity measurements in clear water reported by Einstein and Chien. The solid line is (8).
(32) into (26) and neglecting the effect of nonuniform settling velocity, we obtain
f3z ln [C(z)] = ln [C(z,)]-- Za 0 - Z*X1
aN
where the new parameter Z * is defined by
Z*=Z(1 + :: a 1)
. (33)
(34)
For each individual concentration profile, the constants a 0 and a 1 may be estimated by regressing estimates of X2 against estimates of X 1 , and the constant Z* may be estimated by fitting the measured concentrations to (33). For a series of experiments in which flow and sediment proper-
0.8
0.6
.; 0.4 ;:::: ~
0.2 ::;-
.. 0 ::;-~
-0.2
-0.4
-o:8.o8 -0.06 -0.04 -0.02
ties ate kept fixed, Z is approximately constant for all experiments, and one may estimate Z and {3 2/aN by plotting Z * as a function of a 1 for the series of concentration profiles.
Approximate calculations, in which the effect of nonuniform settling velocity is estimated from seive analyses reported by the investigators, indicates that the conditions required for validity of (32), (33), and (34) are satisfied by Coleman's [1981, 1986] experiments with relatively fine sand (runs 2 through 20) and slightly coarser sand (runs 22 through 31), and by Einstein and Chien's [1955] experiments. The required conditions are weak effect of nonuniform settling velocity and high correlation between X 1 and X 2 • In Lyn' s [1988] starved-bed experiments the effect of nonuniform settling velocity was calculated to be comparable to or larger than the stratification effect.
0
0 0
0 0.02 0.04 0.06 0.08
X
Fig. 10. Plot of [AU(z) - U(z,)]!u* as a function of X based on measurements reported by Vanoni [1946] for d = 0.16 mm (circles), d = 0.10 mm (asterisks), and d = 0.13 mm (pluses). The .solid line is the least squares straight-line fit to the measurements. The estimate of {3 1/aN corresponding to the straight-line fit is -4.0 ± 1.9.
't
~
·''fi
VILLARET AND TROWBRIDGE: STRATIFICATION BY SUSPENDED SEDIMENTS 10,673
2.5 +
2
+
1.5 +
. .. -- + + ~
.r ~ 0.5
~ .. 0 ~
<1
-0.5 +
0
-1
-1.5 -0.2 -0.1 0 0.1 0.2 0.3 0.4 0.5
X
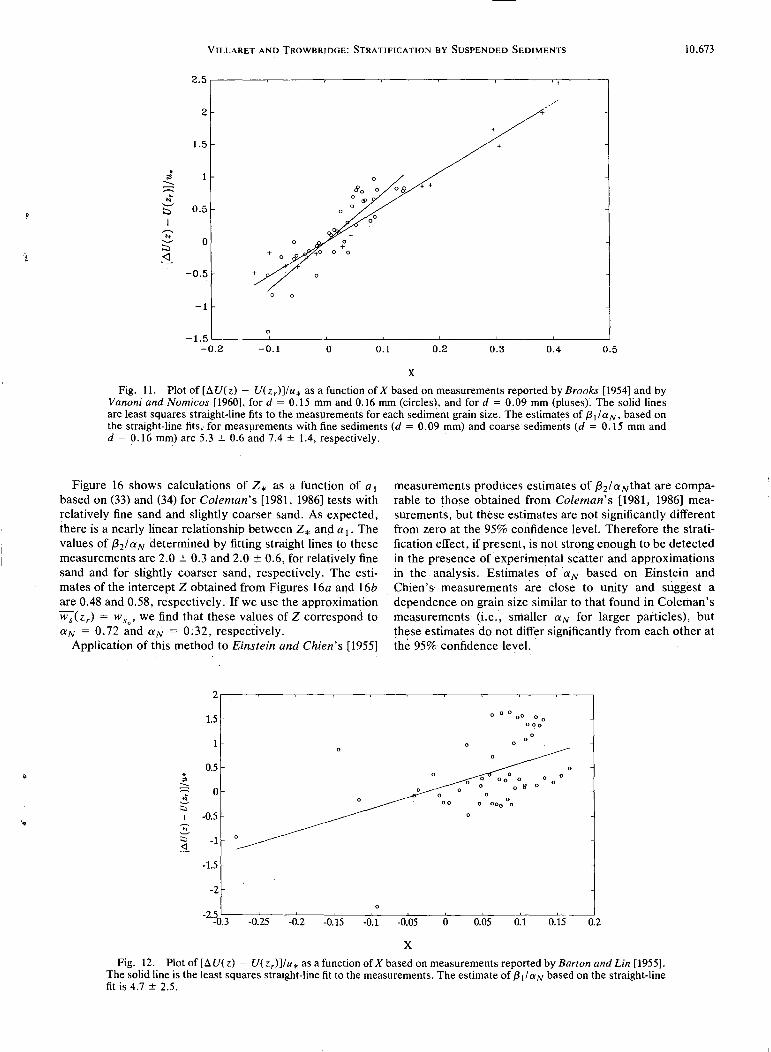
Fig. II. Plot of[~ U( z) - U( Zr)]!u* as a function of X based on measurements reported by Brooks [1954] and by Vanoni and Nomicos [1960], ford= 0.15 mm and 0.16 mm (circles), and ford= 0.09 mm (plusesr The solid lines are least squares straight-line fits to the measurements for each sediment grain size. The estimates of {3 1/aN, based on the straight-line fits, for measurements with fine sediments (d = 0.09 mm) and coarse sediments (d = 0.15 mm and d = 0.16 mm) are 5.3 ± 0.6 and 7.4 ± 1.4, respectively. .
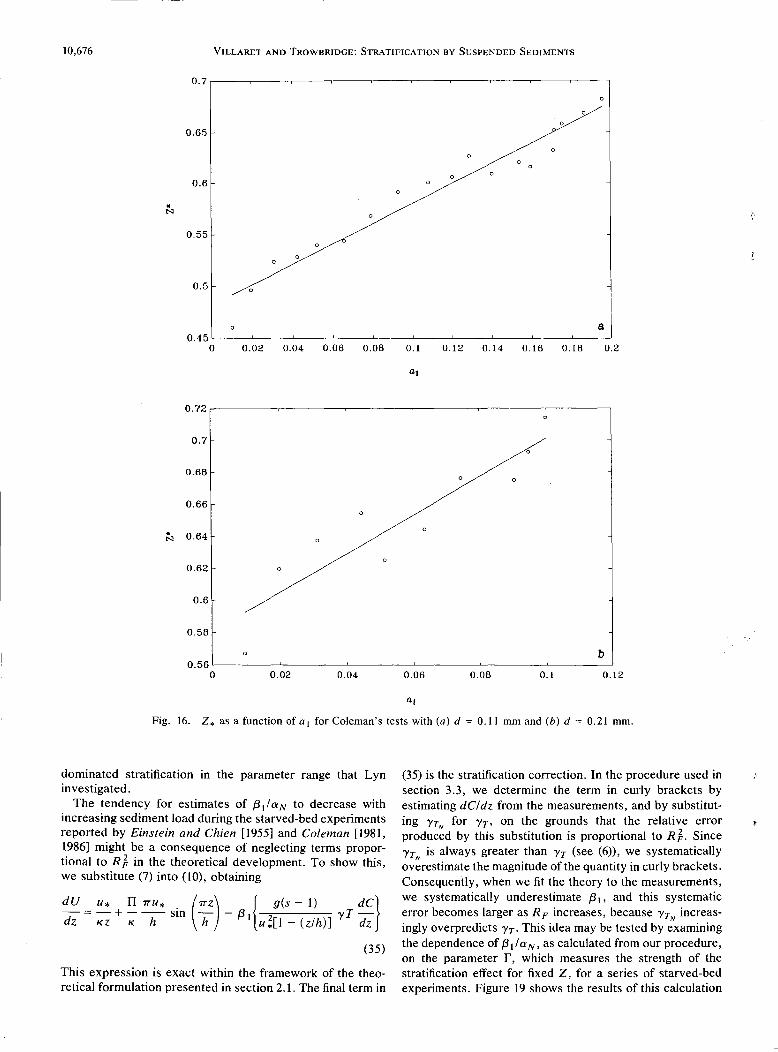
Figure 16 shows calculations of Z* as a function of a 1
based on (33) and (34) for Coleman's [1981, 1986] tests with relatively fine sand and slightly coarser sand. As expected, there is a nearly linear relationship between Z* and a 1 • The values of {3 21 aN determined by fitting straight lines to these measurements are 2.0 ± 0.3 and 2.0 ± 0.6, for relatively fine sand and for slightly coarser sand, respectively. The estimates of the intercept Z obtained from Figures 16a and 16b are 0.48 and 0.58, respectively. If we use the approximation w s ( z r) = w s , we find that these values of Z correspond to aN = 0.72 C:nd aN= 0:32, respectively.
Application of this method to Einstein and Chien's [1955]
2
1.5
0.5 +
" ;::: 0 .{ ::;-
-0.5 .. ::;- -1 ~
-1.5
-2
-2·?o.3 -0.25 -0.2 -0.15 -0.1
measurements produces estimates of {3 2 /aNthat are comparable to those obtained from Coleman's [1981, 1986] measurements, but these estimates are not significantly different from zero at the 95% confidence level. Therefore the stratification effect, if present, is not strong enough to be detected in the presence ofexperimental scatter and approximations in the analysis. Estimates of aN based on Einstein and Chien's measurements are close to unity and suggest a dependence on grain size similar to that found in Coleman's measurements (i.e., smaller aN for larger particles), but these estimates do not differ significantly from each other at the 95% confidence level. ·
0 00
-0.05 0
X
o o o oo 0 0
ooo
0 o oo0 o
0.05
0 0
0.1
o·
0.15 0.2
Fig. 12. Plot of [~U(z) - U(zr)]!u* as a function of X based on measurements reported by Barton and Lin [1955]. The solid line is the least squares straight-line fit to the measurements. The estimate of {3 1 I aN based on the straight-line fit is 4.7 ± 2.5.

----~---
10,674 VILLARET AND TROWBRIDGE: STRATIFICATION BY SUSPENDED SEDIMENTS
4 +
+ -··+ 3
+
2 ++ +
* + + " + ~ ++ + .:-
:::;-
-;:;-0 :::;-
~
-1 +++ /'
-2 ++ + ......-:{
+ ,/' .
-?0.6 -0.4 -0.2 0 0.2 0.4 0.6 0.8
X
Fig. 13. Plot of [t.U(z) - U(zr)]/u* as a function of X based on measurements reported by Einstein and Chien [1955], for d = 1.3 mm (circles), d = 0.90 mm (asterisks), and d = 0.27 mm (pluses). The lines are least squares straight-line fits to the measurements at each grain size. The estimates of {3 1 I aN, based on the straight-line fits, for measurements with fine sediments (d = 0.27 mm), medium sediments (d = 0.90 mm), and coarse sediments (d = 1.3 mm), are 4.0 ± 0.2, 9.9 ± 1.2,and 9.1 ± 0.4, respectively.
4. DISCUSSION
4.1. Velocity Profiles
Our analysis indicates that velocity measurements reported by Vanoni [1946] are not consistent with expectations based on the stratified flow analogy. Velocity profiles reported by Brooks [1954], Barton and Lin [1955], Einstein and Chien [1955], Vanoni and Nomicos [1960], and Coleman [1981, 1986] are, overall, qualitatively and quantitatively consistent with expectations, although there is substantial variability in results based on individual profiles. Velocity measurements reported by Lyn [1988] are qualitatively consistent with theoretical results, but the magnitude of the observed departure from clear-water behavior is, overall,
4
3
* " 2 ~ .:-
:::;-
.. :::;-~ 0
-1 0 QO
-~.6 -0.4 -0.2 0
larger than expected, and it is an order of magnitude larger than expected ·in one series of starved-bed experiments (1957ST~2). In starved-bed experiments reported by Einstein and Chien and by Coleman, estimates of {3 1/aN decrease slightly with increasing concentration for fixed flow conditions and sediment properties. Estimates of {3 1 IaN increase slightly with increasing particle diameter in experiments reported by Brooks, Einstein and Chien, Coleman, and Lyn.
The differences between Vanoni's [1946] measurements and expectations based on the stratified flow analogy may have been caused in part by small, systematic measurement errors in either or both of U and u *, as evidenced in the clear-water measurements shown in Figure 8 and discussed in section 3.2. If measurement errors occurred in the sedi-
00 0
00 d'
0.2 0.4 0.6 0.8
X
Fig. 14. Plot pf [6. U( z) - U( Zr)]/u * as a function of X based on measurements reported by Coleman [1981, 1986], ford= 0.42 mm (pluses), d = 0.21 mm (asterisks), and d = 0.11 mm (circles). The lines are least squares straight-line fits to the measurements at each grain size. The estimates of {3 1/aN, based on the straight-line fits, for measurements with fine sediments (d = 0.11 mm), medium sediments (d = 0.21 mm), and coarse sediments (d = 0.42 mm), are 3.4 ± 0.2, 4.7 ± 0.6, and 14.3 ± 4.1, respectively.
-.,;;
' ?

'.,~
VILLARET AND TROWBRIDGE: STRATIFICATION BY SUSPENDED SEDIMENTS 10,675
2.5
2
1.5
!_
"' 0.5
::;-0
~ ;:;, -0.5 + .:::1.
-1
-1.5
:b.06 -0.04
+
+
+
-0.02 0 0.02
X
...... . , .. 0
0.04 0.06 0.08 0.1
Fig. 15. Plot of [~U(z) - U(zr)]/u* as a function of X based on measurements reported by Lyn [1988], for tests with d = 0. 24 mm (pluses), for tests with d = 0. 19 mm in series 1957ST -2 (crosses), for tests with d = 0. 19 mm other than series 1957ST-2 (asterisks), and for tests with d = 0.15 mm (circles). The lines are least squares straight-line fits to the measurements with d = 0.19 mm, with separate lines for series 1957ST-2 and for series other than 1957ST-2. The estimate of {3 1/aN based on the straight-line fit for series 1957ST-2 is 40.6 ± 5.4. The estimates of {3 1/aN, based on straight-line fits, for measurements with fine sand (d = 0.15 mm), medium sand other than 1957ST-2 (d = 0.19 mm), and coarse sand (d = 0.24 mm), are 12.1 ± 3.3, 18.3 ± 2.9, and 31.1 ± 10.9, respectively.
ment-laden cases in the same manner as they seem to have occurred in the clear-water cases, then the dimensionless shear (z/u*)(d Uldz) is systematically underestimated by the measurements. An underestimate of the shear, if stronger than the competing effect of stratification, produces a negative estimate of f3 1laN, as is found in Figure 10 when calculations based on all of Vanoni's measurements are plotted together. A plausible explanation for the discrepancies between Vanoni's clear-water measurements and (8) is that Vanoni overestimated u* by a factor of about 1.25 [Coleman, 1981]. If we assume that this was in fact the case, and if we "correct" Vanoni's results in sediment-laden flows by reducing u* by a factor of 111.25 = 0.80, then we find that Vanoni's measurements of velocity in sediment-laden flows are in good qualitative and quantitative agreement with theoretical results (see Figure 17), although showing a substantial degree of scatter. This result, while not conclusive, indicates that some of the discrepancies between Vanoni's measurements and theoretical results may have been caused by systematic measurement errors.
The variability of results based on individual profiles reported by Brooks [1954], Barton and Lin [1955], Einstein and Chien [1955], Vanoni and Nomicos [1960], and Coleman [1981, 1986], as well as the departure from expectations in Lyn's [1988] experiments, can be understood if we examine the influence of r Z, which is a measure of the strength of the stratification effect (see (29)). Figure 18 shows estimates of {3 1 IaN and the regression coefficient R 2 as functions of fw s I KU *, for all individual profiles except those reported by Van~ni [1946]. We substitute ws IKu* for Z because Z cannot be estimated precisely, a"s discussed previously. Figure 18 shows that iffws IKu* is small (less than approximately 1), indicating weak a stratification effects, then R 2 is small and estimates of {3 1 IaN are highly variable, indicating poor agreement between theoretical results and experiments. In contrast, if fw s I KU * is large (greater than approximately 1), indicating stro~g stratification effects, then R 2 is
close to unity and estimates of {3 1 IaN are much closer to the values expected on the basis of previous measurements in thermally stratified flows. These results suggest that large discrepancies between theory and measurements occur only in experiments in which the stratification effect is too small to be detected in the presence of measurement errors and limitations in the analysis and that favorable agreement between theory and measurements occurs in experiments in which the stratification effect is large enough to be detected accurately. In Figure 18 the consistent difference between estimates of {3 1 IaN based on measurements reported by Einstein and Chien and by Coleman for large fw s I KU * may reflect a weak dependence on sediment grain o size (see below).
In Figure 18, it is noteworthy that all of Lyn's [1988] experiments, which show the largest deviations from theoretical results, occur in the parameter range in which detection of stratification effects appears to be difficult. The fact that detection of stratification effects was difficult in these experiments can also be seen by examining Figure 11 through 15, which show that Lyn's tests correspond to the smallest range of the independent variable X, which represents the effect of stratification on the velocity profile (see (22)). The largest deviations from expectations in Lyn's experiments occur in the 1957ST-2 series, which is unusual even within the context of Lyn' s other experiments because results based on these measurements are very different from those obtained in Lyn's other starved-bed experiments (1965ST and 1957ST-1), even though the experimental conditions were not very different. Systematic overestimates of f3 1laN based on Lyn's measurements, relative to expectations based on measurements in thermally stratified flows, may reflect small systematic measurement errors (e.g., inaccurate estimation of u*), small uncertainties in the analysis (e.g., inaccurate representation of the neutral velocity profile), or competing physical processes that may have
10,676 VILLARET AND TROWBRIDGE: STRATIFICATION BY SUSPENDED SEDIMENTS
0.7,---~-----.----.-----~--~----~----~--~----------,
0.65
0.6 0
0
* N
0.55
0
0.5
a 0.45
0 0.02 0.04 0.06 0.08 0.1 0.12 0.14 0.16 0.18 0.2
at
0.72
0.7 0
0.68
0.66 0
* 0.64 N
0.62
0.6
0.58
b 0.56
0 0.02 0.04 0.06 0.08 0.1 0.12
aJ
Fig. 16. Z* as a function of a 1 for Coleman's tests with (a) d = 0.11 mm and (b) d = 0.21 mm.
dominated stratification in the parameter range that Lyn investigated.
The tendency for estimates of {3 1 IaN to decrease with increasing sediment load during the starved-bed experiments reported by Einstein and Chien [1955] and Coleman [1981, 1986] might be a consequence of neglecting terms proportional to R J in the theoretical development. To show this, we substitute (7) into (10), obtaining
dU u* II 7TU* (7TZ) { g(s - I) dC} --;;;= KZ +-;;hsin h -{3 1 u;[l-(zlh)] yT dz
(35)
This expression is exact within the framework of the theoretical formulation presented in section 2.1. The final term in
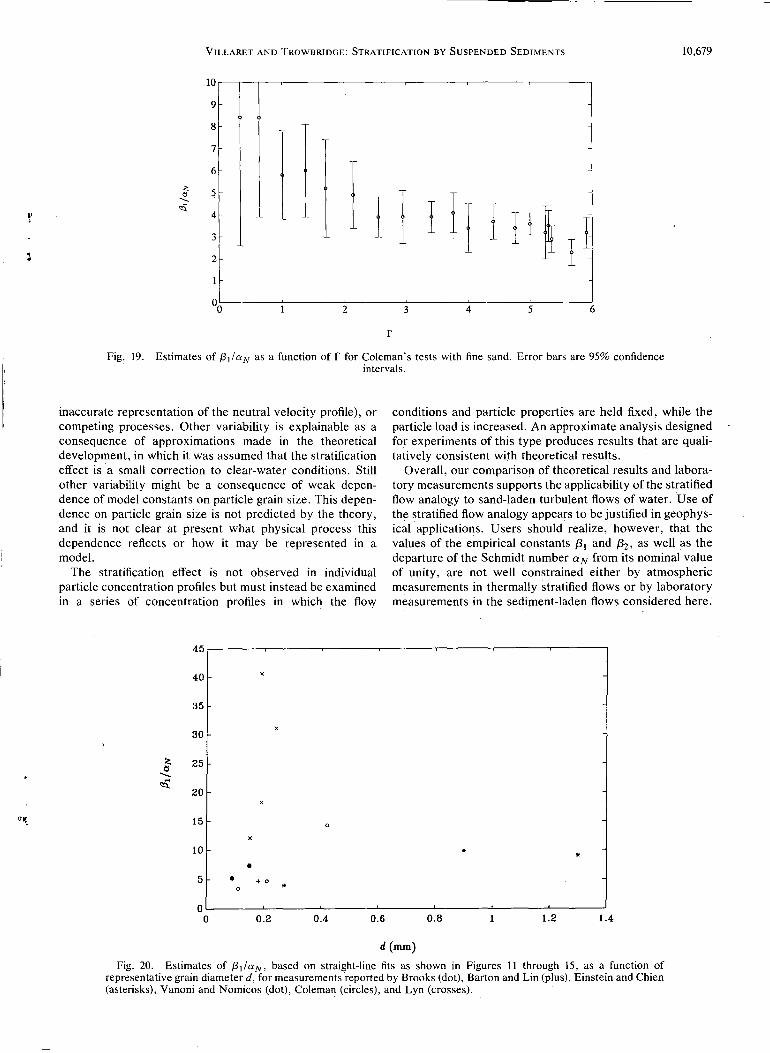
(35) is the stratification correction. In the procedure used in section 3.3, we determine the term in curly brackets by estimating dC!dz from the measurements, and by substituting 'YTN for 'Yr· on the grounds that the relative error produced by this substitution is proportional to R}. Since Yr N is always greater than Yr (see (6)), we systematically overestimate the magnitude of the quantity in curly brackets. Consequently, when we fit the theory to the measurements, we systematically underestimate {3 1 , and this systematic error becomes larger as RF increases, because YrN increasingly overpredicts 'Yr· This idea may be tested by examining the dependence of {3 1/aN, as calculated from our procedure, on the parameter r, which measures the strength of the stratification effect for fixed Z, for a series of starved-bed experiments. Figure 19 shows the results of this calculation
'
V!LLARET AND TROWBRIDGE: STRATIFICATION BY SUSPENDED SEDIMENTS 10,677
0.8
0.6 + 0 +
£ 0.4 0 +
.t 2;' 0.2 • 0
., 0 2;'
~ -0.2 +
• 0 •
•• +· 0 .a ".
0 + 0-P
cP 0
o' •
-0.4
-o:B.~8 -0.06 -0.04 -0.02 0 0.02 0.04 0.06 0.08
X
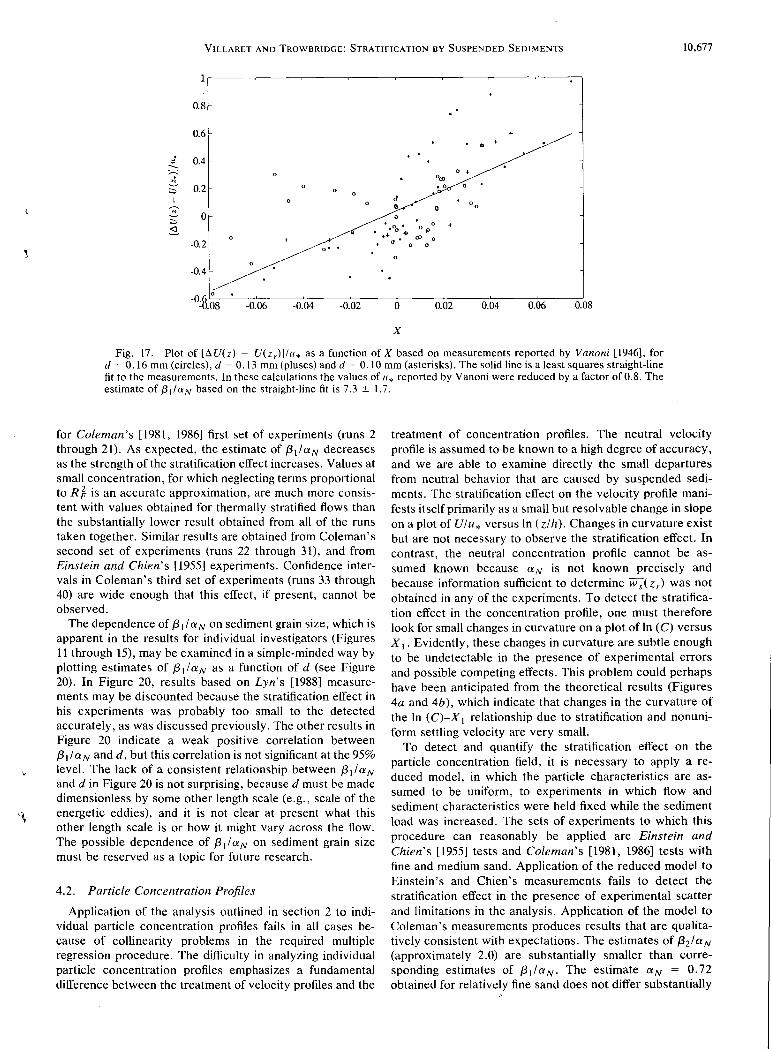
Fig. 17. Plot of [llU(z) - U(z,)]lu* as a function of X based on measurements reported by Vanoni [1946], for d = 0.16 mm (circles), d = 0.13 mm (pluses) and d = 0.10 mm (asterisks). The solid line is a least squares straight-line fit to the measurements. In these calculations the values of u* reported by Vanoni were reduced by a factor of0.8. The estimate of {3 1/aN based on the straight-line fit is 7.3 ± 1.7.
for Coleman's [1981, 1986] first set of experiments (runs 2 through 21). As expected, the estimate of {3 11aN decreases as the strength of the stratification effect increases. Values at small concentration, for which neglecting terms proportional to Rj.. is an accurate approximation, are much more consistent with values obtained for thermally stratified flows than the substantially lower result obtained from all of the runs taken together. Similar results are obtained from Coleman's second set of experiments (runs 22 through 31), and from Einstein and Chien's [1955] experiments. Confidence intervals in Coleman's third set of experiments (runs 33 through 40) are wide enough that this effect, if present, cannot be observed.
The dependence of {3 11aN on sediment grain size, which is apparent in the results for individual investigators (Figures 11 through 15), may be examined in a simple-minded way by plotting estimates of {3 11aN as a function of d (see Figure 20). In Figure 20, results based on Lyn's [1988] measurements may be discounted because the stratification effect in his experiments was probably too small to the detected accurately, as was discussed previously. The other results in Figure 20 indicate a weak positive correlation between {3 1 IaN and d, but this correlation is not significant at the 95% level. The lack of a consistent relationship between {3 1 IaN
and d in Figure 20 is not surprising, because d must be made dimensionless by some other length scale (e.g., scale of the energetic eddies), and it is not clear at present what this other length scale is or how it might vary across the flow. The possible dependence of {3 1 IaN on sediment grain size must be reserved as a topic for future research.
4.2. Particle Concentration Profiles
Application of the analysis outlined in section 2 to individual particle concentration profiles fails in all cases because of collinearity problems in the required multiple regression procedure. The difficulty in analyzing individual particle concentration profiles emphasizes a fundamental difference between the treatment of velocity profiles and the
treatment of concentration profiles. The neutral velocity profile is assumed to be known to a high degree of accuracy, and we are able to examine directly the small departures from neutral behavior that are caused by suspended sediments. The stratification effect on the velocity profile manifests itself primarily as a small but resolvable change in slope on a plot of Ulu* versus In (zlh). Changes in curvature exist but are not necessary to observe the stratification effect. In contrast, the neutral concentration profile cannot be assumed known because aN is not known precisely and because information sufficient to determine ws(z,) was not obtained in any of the experiments. To detect the stratification effect in the concentration profile, one must therefore look for small changes in curvature on a plot of In (C) versus X 1 • Evidently, these changes in curvature are subtle enough to be undetectable in the presence of experimental errors and possible competing effects. This problem could perhaps have been anticipated from the theoretical results (Figures 4a and 4b ), which indicate that changes in the curvature of the In (C)-X 1 relationship due to stratification and nonuniform settling velocity are very small.
To detect and quantify the stratification effect on the particle concentration field, it is necessary to apply a reduced model, in which the particle characteristics are assumed to be uniform, to experiments in which flow and sediment characteristics were held fixed while the sediment load was increased. The sets of experiments to which this procedure can reasonably be applied are Einstein and Chien's [1955] tests and Coleman's [1981, 1986] tests with fine and medium sand. Application of the reduced model to Einstein's and Chien's measurements fails to detect the stratification effect in the presence of experimental scatter and limitations in the analysis. Application of the model to Coleman's measurements produces results that are qualitatively consistent with expectations. The estimates of {3 21aN
(approximately 2.0) are substantially smaller than corresponding estimates of {3 1 IaN. The estimate aN = 0. 72 obtained for relatively fine sand does not differ substantially

10,678 VILLARET AND TROWBRIDGE: STRATIFICATION BY SUSPENDED SEDIMENTS
1 o' 0 ..
® .x 0 +. 0 • ++ + + + + + + + X 0 + +
++ + 0.9 f$;· + +
0 xd + + +
0+ + +
0.8 +
0.7 + X
+ 0 +
0.6 ,+ +
~ 0.5 +
0.4 +
0.3
0.2 +
0.1 ll" a
00 2 3 4 5 6 7
fw,jKU,
90
80
70
60
50
<: ~ ...._
OS:
II=
}j[ ~ ~:£E:E I OE oE£ ~ '"'"'
b
2 3 4 5 6 7
fw,0jKu,
Fig. 18. Values of (a) R 2 and (b) {3 1/aN as functions of fws IKu* for individual velocity profiles reported by Brooks (circles), Barton and Lin (circles), Einstein and Chien (asterisks), Vanoni and Nomicos (circles), Coleman (pluses), and Lyn (crosses). Lyn's measurements in series 1957ST-2 are circled. Error bars are 95% confidence intervals.
from estimates of the turbulent Prandtl number in thermally stratified flows (typically unity or slightly less; see, for example, Dyer [1974], Yaglom [1977], Wieringa [1980], or Hagstrom [1988]). The estimate aN = 0.32 obtained for slightly coarser sand is substantially smaller; the difference between this value and unity is probably too large to be explained by uncertainties in settling velocity. It is interesting that these results indicate that aN decreases with increasing grain size. We do not place much weight on our analysis of Coleman's particle concentration profiles because of the approximation required in the analysis and because of the small number of results that we could obtain.
5. SUMMARY AND CONCLUSIONS
We have presented a comparison of theoretical results and measurements in laboratory channel flows in order to test the applicability of the stratified flow analogy to sand-laden turbulent flows of water. Our analysis isolates the effect of
stratification by suspended sediments and allows us to determine whether this effect is observable in the measurements and whether estimates of model constants obtained from the measurements are consistent with previous estimates obtained from me~surements in thermally stratified flows.
According to our analysis, stratification effects are observable in measured velocity profiles, except in one series of experiments [Vanoni, 1946], in which systematic measurement errors may have obscured the effect. Estimates of model constants based on measured velocity profiles are, overall, roughly consistent with expectations based on previous measurements in thermally stratified flows. There is substantial variability in results based on individual velocity profiles, much of which is explainable as a consequence of existence of a parameter range in which stratification effects are weak and therefore difficult to detect in the presence of measurement errors, uncertainties in the analysis (e.g.,
f
!
l' . . •
q~'
VILLARET AND TROWBRIDGE: STRATIFICATION BY SUSPENDED SEDIMENTS 10,679
10
9
8
7
6
l1 I "" 5 0
II[IP! ---<:0: 4
II 3
2
00 2 3 4 5 6
r
Fig: 19. Estimates of {3 1/aN as a function of r for Coleman's tests with fine sand. Error bars are 95% confidence intervals.
inaccurate representation of the neutral velocity profile), or competing processes. Other variability is explainable as a consequence of approximations made in the theoretical development, in which it was assumed that the stratification effect is a small correction to clear-water conditions. Still other variability might be a consequence of weak dependence of model constants on particle grain size. This dependence on particle grain size is not predicted by the theory, and it is not clear at present what physical process this dependence reflects or how it may be represented in a model.
The stratification effect is not observed in individual particle concentration profiles but must instead be examined in a series of concentration profiles in which the flow
45
40
35
30
:<!:: 25 eJ ....... <!5:
20
15 0
X
10
• 5 • + 0
0 ..
0
conditions and particle properties are held fixed, while the particle load is increased. An approximate analysis designed for experiments of this type produces results that are qualitatively consistent with theoretical results.
Overall, our comparison of theoretical results and laboratory measurements supports the applicability of the stratified flow analogy to sand-laden turbulent flows of water. Use of the stratified flow analogy appears to be justified in geophysical applications. Users should realize, however, that the values of the empirical constants {3 1 and {32 , as well as the departure of the Schmidt number aN from its nominal value of unity, are not well constrained either by atmospheric measurements in thermally stratified flows or by laboratory measurements in the sediment-laden flows considered here.
• ..
0 0.2 0.4 0.6 0.8 1.2 1.4
d (mm)
Fig. 20. Estimates of {3 1/aN, based on straight-line fits as shown in Figures II through 15, as a function of representative grain diameter d, for measurements reported by Brooks (dot), Barton and Lin (plus), Einstein and Chien (asterisks), Vanoni and Nomicos (dot), Coleman (circles), and Lyn (crosses).

10,680 VILLARET AND TROWBRIDGE: STRATIFICATION BY SUSPENDED SEDIMENTS
In addition, in the sediment-laden case, these empirical constants may in fact depend weakly on sediment grain size in an unknown and unparameterized fashion.
Acknowledgments. This work is the result of research sponsored by the Geology and Geophysics Program, Office of Naval Research, under grant N00014-89-J-1067, and by NOAA National Sea Grant College Program Office, Department of Commerce, under grant NA86-AA-D-SG090, Woods Hole Oceanographic Institution Sea Grant project R/0-5. Woods Hole Oceanographic Institution contribution 7544.
REFERENCES
Adams, C. E., and G. L. Weatherly, Some effects of suspended sediment stratification on an oceanic bottom boundary layer, J. Geophys. Res., 86,4161-4172, 1981.
Barenblatt, G. 1., Motion of suspended particles in a turbulent flow (in Russian, Prikl. Mat. Mekh., 17, 261-274, 1953.
Barenblatt, G. I., Motion of suspended particles in a turbulent flow occupying a half-space or plane channel of finite depth (in Russian), Prikl. Mat. Mekh., 19, 61-68, 1955.
Barton, J. R., and P. N. Lin, A study of the sediment transport in alluvial streams, Dep. Civ. Eng., Color. A&M Coli., Fort Collins, 1955.
Belsley, D. A., E. Kuh, and R. E. Welsch, Regression Diagnostics, John Wiley, New York, 1980.
Brooks, N. H., Laboratory studies of the mechanics of motion of streams flowing over a movable bed of fine sand, Ph.D. thesis, Calif. Inst. of Techno!., Pasadena, 1954.
Businger, J. A., J. C. Wyngaard, Y. Izumi, and E. F. Bradley, Flux-profile relationships in the atmospheric surface layer, J. Atmos. Sci., 28, 190-201, 1971.
Coleman, N. L., Velocity profiles with suspended sediment, J. Hydraul. Res., 19, 211-229, 1981.
Coleman, N. L., Effects of suspended sediment on the open-channel velocity distribution, Water Resour. Res., 22, 1377-1384, 1986.
Coles, D., The law of the wake in the turbulent boundary layer, J. Fluid Mech., I, 191-226, 1956. ·
Draper, N. R., and H. Smith, Applied Regression Analysis, 407 pp., John Wiley, New York, 1966.
Dyer, A. J., A review of flux-profile relationships, Boundary Layer Meteorol., 7, 363-372, 1974.
Einstein, H. A., and N. Chien, Effects of heavy sediment concentration near the bed on velocity and sediment distribution, MRD ser. 8, Inst. of Eng. Res., Univ. of Calif., Berkeley, 1955.
Gelfenbaum, G., and J. D. Smith, Experimental evaluation of a generalized suspended-sediment transport theory, in Shelf Sands and Sandstones, Mem. Can. Soc. of Pet. Geol., 2, edited by R. J. Knight and J. R. McLean, pp. 133-144, 19S6.
Glenn, S.M., and W. D. Grant, A suspended sediment stratification correction for combined wave and current flows, J. Geophys. Res., 92, 8244-8264, 1987.
Hagstrom, U., Non-dimensional wind and temperature profiles in the atmospheric surface layer: A re-evaluation, Boundary Layer Meteorol., 42, 55-78, 1988.
Knight, D. W., J. D. Demetriou, and M. E. Hamde, Boundary shear in smooth rectangular channels, J. Hydrau/. Eng., IIO, 405-422, 1984. .
Lumley, J. L., Two-phase and non-Newtonian flows, in Turbulence, Topics in Appl. Phys., volume 12, edited by P. Bradshaw, pp. 290-324, Springer-Verlag, New York, 1976.
Lyn, D. A., Turbulence and turbulent transport in sediment-laden open-channel flows, Ph.D. thesis, Calif. Inst. of Techno!., Pasadena, 1986.
Lyn, D. A., A similarity approach to turbulent sediment-laden flows in open channels, J. Fluid Mech., 193, 1-26, 1988.
Mellor, G. L., and T. Yamada, A hierarchy ofturbulence closure models for planetary boundary layers, J. Atmos. Sci., 31, 1791-1806, 1974.
Monin, A. S., and A.M. Yaglom, Statistical Fluid Mechanics, MIT Press, Cambridge, Mass., 1971. 'l
Nakagawa, H., I. Nezu, and A. Tominga, Secondary currents in a straight channel flow and the relation to its aspect ratio, paper presented at Fourth Symposium on Turbulent Shear Flows, Univ. of Karlsruhe, Karlsruhe, Germany, 1983.
Nezu, I., and W. Rodi, Open channel flow measurements with a laser-Doppler anemometer, J. Hydraul. Eng., 112, 335-355, 1986.
Nomicos, G. N., Effects of sediment load on the velocity field and friction factor of turbulent flow in an open channel, Ph.D. thesis, Calif. Inst. of Techno!., Pasadena, 1956.
Rouse, H., Modern conceptions of the mechanics of turbulence, Trans. Am. Soc. Civ. Eng., 102, 536, 1937.
Sheng, Y. P., and C. Villaret, Modeling the effect of suspended sediment stratification on bottom exchange processes, J. Geophys. Res., 94, 14,429-14,444, 1989.
Smith, J. D., and S. R. McLean, Spatially averaged flow over a wavy surface, J. Geophys. Res., 82, 1735-1746, 1977.
Taylor, P. A., and K. R. Dyer, Theoretical models of flow near the bed and their implications for sediment transport, in The Sea, vol. 6, edited by E. D. Goldberg, I. N. McCave, J. J. O'Brien, and J. H. Steele, pp. 579-601, Interscience, New York, 1977.
Tennekes, H., and J. L. Lumley, A First Course in Turbulence, MIT Press, Cambridge, Mass., 1972.
Vanoni, V. A., Transportation of suspended sediment by water, Trans. Am. Soc. Civ. Eng., 111, 67-133, 1946.
Vanoni, V. A., (Ed.), Sedimentation Engineering, American Society of Civil Engineers, New York, 1977.
Vanoni, V. A., and G. N. Nomicos, Resistance properties of sediment-laden streams, Trans. Am. Soc. Civ. Eng., 125, 1140-1175, 1960.
Wieringa, J., A re-evaluation of the Kansas Mast influence on measurements of stress and cup anemometer overspeeding, Boundary Layer Meteorol., 18, 411-430, 1980.
Wiberg, P., and J. D. Smith, A comparison of field data and theoretical models for wave-current interactions at the bed on the continental shelf, Cont. Shelf Res., 2, 126--136, 1983.
Yaglom, A. M., Comments on wind and temperature flux-profile relationships, Boundary Layer Meteorol., II, 89-102, 1977.
J. H. Trowbridge, Woods Hole Oceanographic Institution, Woods Hole, MA 02543.
C. Villaret, Laboratoire National d'Hydraulique, Electricite de France, Chatou 78400, France.
(Received October 15, 1990; accepted February 22, 1991.)
'I