effects of sulfur impregnation temperature on the properties and mercury adsorption capacities of...
TRANSCRIPT
Effects of Sulfur ImpregnationTemperature on the Properties andMercury Adsorption Capacities ofActivated Carbon Fibers (ACFs)H S I N G - C H E N G H S I , † M A R K J . R O O D , * , †
M A S S O U D R O S T A M - A B A D I , * , † . ‡
S H I A O G U O C H E N , ‡ A N D R A M S A Y C H A N G §
Department of Civil and Environmental Engineering,205 North Mathews Avenue, University of Illinois atUrbana-Champaign, Urbana, Illinois 61801,Illinois State Geological Survey, 615 East Peabody Drive,Champaign, Illinois 61820, and EPRI;3412 Hillview Avenue, Palo Alto, California 20036
Laboratory studies were conducted to determine the roleof sulfur functional groups and micropore surface areaof carbon-based adsorbents on the adsorption of Hg0 fromsimulated coal combustion flue gases. In this study, rawactivated carbon fibers that are microporous (ACF-20) wereimpregnated with elemental sulfur between 250 and 650°C. The resulting samples were saturated with respect tosulfur content. Total sulfur content of the sulfur impregnatedACF samples decreased with increasing impregnationtemperatures from 250 and 500 °C and then remainedconstant to 650 °C. Results from sulfur K-edge X-ray absorptionnear-edge structure (S-XANES) spectroscopy showedthat sulfur impregnated on the ACF samples was in bothelemental and organic forms. As sulfur impregnationtemperature increased, however, the relative amounts ofelemental sulfur decreased with a concomitant increase inthe amount of organic sulfur. Thermal analyses andmass spectrometry revealed that sulfur functional groupsformed at higher impregnation temperatures were morethermally stable. In general, sulfur impregnation decreasedsurface area and increased equilibrium Hg0 adsorptioncapacity when compared to the raw ACF sample. The ACFsample treated with sulfur at 400 °C had a surface areaof only 94 m2/g compared to the raw ACF sample’s surfacearea of 1971 m2/g, but at least 86% of this sample’ssurface area existed as micropores and it had the largestequilibrium Hg0 adsorption capacities (2211-11343 µg/g). Such a result indicates that 400 °C is potentially an optimalsulfur impregnation temperature for this ACF. Sulfurimpregnated on the ACF that was treated at 400 °C wasin both elemental and organic forms. Thermal analyses andCS2 extraction tests suggested that elemental sulfur wasthe main form of sulfur affecting the Hg0 adsorption capacity.These findings indicate that both the presence of elementalsulfur on the adsorbent and a microporous structureare important properties for improving the performance ofcarbon-based adsorbents for the removal of Hg0 fromcoal combustion flue gases.
IntroductionCarbon-based adsorption processes (e.g., direct injection andfixed bed) have the potential to remove very low gas-phase
concentrations (e.g., ≈µg/m3 levels) of mercury species thatoccur in coal combustion flue gas streams (1). Recent studieshave shown that activated carbon adsorbents can bedeveloped with larger adsorption capacities for mercury byimpregnating the samples with elemental sulfur at temper-atures between 200 and 650 °C (2-7). In one study, the totalsurface area of these activated carbons decreased by ∼83%and the sulfur content increased to 36-39 wt % after sulfurimpregnation at 250 °C (5). In contrast, sulfur impregnationat 600-650 °C had reduced total surface area by <20% andincreased the sulfur content of activated carbons to only7-12 wt % (5-7). A major fraction of the elemental sulfurvapor is in the form of S6-S8 at temperatures <250 °C (8, 9).These sulfur molecules can enter only large pores and caneasily form clusters, which can block the entrance of smallerpores and reduce the surface area measurably by the N2-BET(Brunauer, Emmett, and Teller) method (5). At 600-650 °C,elemental sulfur vapor is primarily (75%) in the form ofsmaller S2-S6 molecules (8, 9). These molecules are able topenetrate into the activated carbon’s structure withoutsignificantly blocking or filling the activated carbon’s mi-cropores when compared to treatments at 250 °C (5-7). Sulfurmolecules are also expected to react with the carbon sites at600-650 °C and form thermally and chemically stable organicsulfur functional groups (10).
The temperature at which sulfur impregnation occurs tothe activated carbon can affect not only the sample’s physicalproperties (total surface area, micropore area, and porevolume) and the chemical properties (sulfur content andform) of the activated carbon but also the sample’s mercuryadsorption capacity. Samples impregnated with elementalsulfur at 250 and 600 °C typically have larger Hg0 adsorptioncapacities than the raw activated carbon samples (5, 7).However, the Hg0 adsorption capacities of activated carbonsamples treated at 600 °C have been shown to be ∼4 timesgreater than those of the samples treated at 250 °C (5). Theseresults indicate that the total mass fraction of sulfur in theactivated carbons does not necessarily determine the samples’mercury adsorption capacities. These results also suggestthat the form of sulfur (active sulfur groups) and the physicalproperties of activated carbons could play important rolesin determining the mercury adsorption capacities of thesulfur-impregnated samples.
In a previous study, we reported that activated carbonsderived from high organic sulfur coals have been shown tohave larger equilibrium mercury adsorption capacities thanthose derived from low organic sulfur coals (6). Sulfur K-edgeX-ray absorption near-edge structure (S-XANES) spectros-copy showed that organic sulfur compounds contributedbetween 81 and 94% of the sulfur in those samples. Such aresult indicates that organic sulfur functional groups are ableto increase the mercury adsorption capacity of activatedcarbons (6, 7). However, limited information is available aboutthe properties of sulfur functional groups in sulfur-impreg-nated activated carbons and their roles in the capture of Hg0
from coal combustion flue gases. One study has shown that∼75% of the 48 wt % impregnated sulfur was easily removedfrom a sulfur-impregnated activated carbon (475 °C) by CS2
washing (11). We expect that sulfur removed from the sample
* Author to whom correspondence should be addressed: (M.J.R.)phone: (217) 333-6963; fax: (217) 333-6968; e-mail: [email protected];(M.R.-A.) phone: (217) 244-4977; fax: (217) 333-2830; e-mail:[email protected].
† University of Illinois at Urbana-Champaign.‡ Illinois State Geological Survey.§ EPRI.
Environ. Sci. Technol. 2001, 35, 2785-2791
10.1021/es001794k CCC: $20.00 2001 American Chemical Society VOL. 35, NO. 13, 2001 / ENVIRONMENTAL SCIENCE & TECHNOLOGY 9 2785Published on Web 05/18/2001
with CS2 is mainly elemental because elemental sulfur isvery soluble in CS2 (0.5 g/mL) (12). These results about theexistence of elemental sulfur on activated carbons treated atmoderate temperatures are of interest because these sulfursites may be reactive with mercury vapor. Recent researchpertaining to the development of improved sulfur-impreg-nated activated carbons does not clearly describe which sulfurfunctional groups are more reactive to capture Hg0 from coalcombustion flue gases. In addition, it is unclear what optimaltemperature should be used to impregnate activated carbonswith elemental sulfur to maximize the active sulfur sites.
In this study, pure and homogeneous activated carbonfibers (ACFs), which are microporous, were treated withelemental sulfur between 250 and 650 °C. The raw ACF (ACF-20) was produced from a phenolic precursor and consistedof 95.4 wt % carbon, 3.92 wt % oxygen, and 0.68 wt % hydrogen(13). The ACF sample contained carbon graphite (50.9% bymass of total carbon), hydroxyl/phenolic groups (27.9%),carbonyl/quinone groups (9.3%), and carboxylic groups(5.6%) (13). No ash or metal compounds were detected inthe raw ACF by X-ray photoelectron spectroscopy (XPS) (7).Therefore, any potential effects of ash and metals on mercuryadsorption were minimized. The raw and sulfur-impregnatedACF samples were characterized for their physical andchemical properties. The equilibrium Hg0 adsorption ca-pacities of the ACF samples were then measured in a bench-scale fixed-bed reactor using simulated coal combustion fluegases. These results were used to determine the optimaltemperature for sulfur impregnation and to understand theeffects of the samples’ chemical and physical properties onmercury adsorption. This information was obtained todevelop a better understanding of how to prepare moreefficient carbon-based adsorbents to capture Hg0 from coalcombustion flue gas streams.
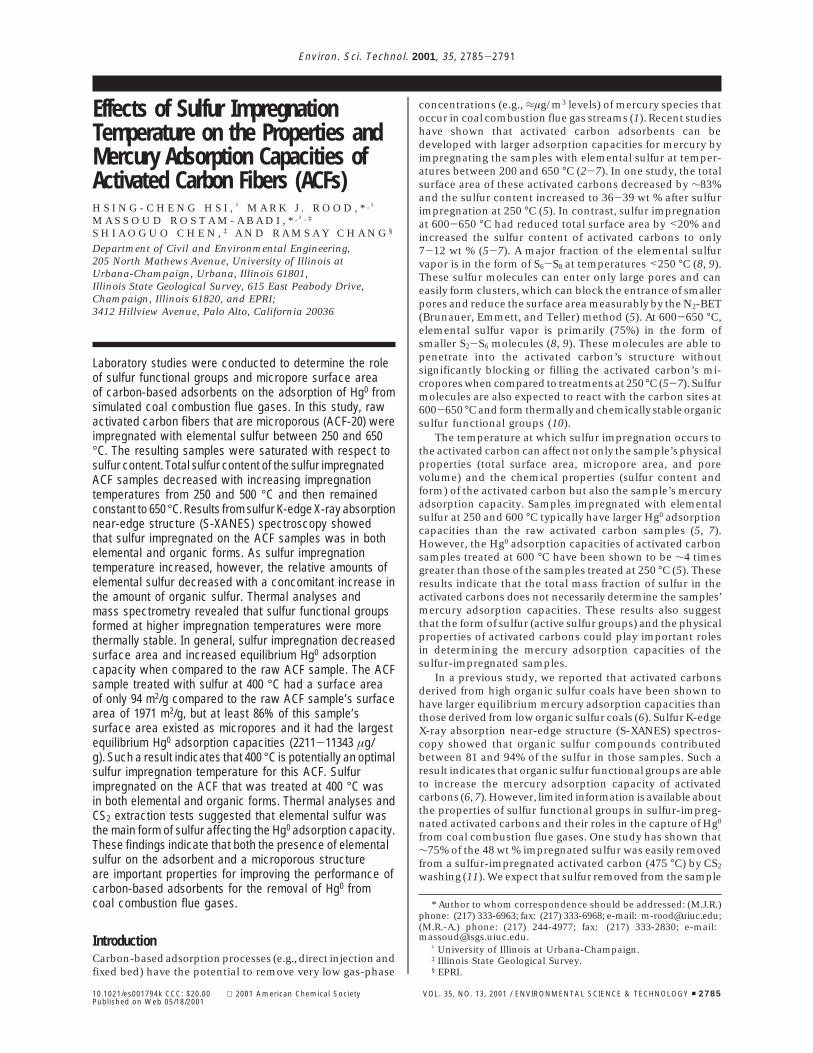
Instrumentation and Research MethodologySample Preparation. An ACF cloth sample of 2 g (AmericanKynol Inc., Pleasantville, NY) was physically mixed with 6 gof elemental sulfur (reagent grade, Fisher Scientific) in aquartz tube (4.5-cm i.d.) and heated in a tubular furnace(Lindberg 59344) at 250-650 °C for 6 h (Figure 1). Ultrahigh-purity (UHP) N2 continuously flowed (50 mL/min) throughthe reactor tube to maintain an oxygen-free environment.After thermal treatment, the samples were cooled for 24 hto room temperature with UHP N2 passing through thereactor. The cooled samples were then ground (Spec Agatelaboratory mill/grinder) in a CO2 environment for 10 min inpreparation for mercury adsorption tests. The resultingsamples were designated ACF-20-SX, with X representingthe sulfur impregnation temperature (i.e., sample ACF-20-
S400 refers to an ACF-20 sample that was impregnated withelemental sulfur at 400 °C).
Selected sulfur-impregnated ACF samples (ACF-20-S400and ACF-20-S650) were treated with CS2(l) (1 g of adsorbent/100 mL of CS2 ratio) at room temperature for 24 h to extractelemental sulfur from the carbon samples. The changes inthe mass of raw ACF samples due to the CS2 treatment were<1%. The resulting samples were designated ACF-20-SX-CS2 (e.g., sample ACF-20-S400-CS2) (Figure 1).
Sample Characterization. The particle size of the groundsamples was determined with a scanning electron microscope(SEM) (Hitachi S4700). Individual fibers of the ACF sampleswere generally between 3 and 8 µm in width. The total surfacearea, micropore area, and micropore size distribution of rawand sulfur-impregnated ACFs were determined with aMicromeritics ASAP2400 analyzer using N2 adsorption at 77K. All ACF samples except ACF-20-S250 were degassed at10-20 µTorr vacuum at 110 °C for 24 h before the N2
adsorption measurements occurred between 10-3 and 1 atm.Some of the impregnated sulfur on the ACF-20-S250 samplewas released and visually observed to condense on thevacuum tube at 110 °C degassing temperature. This particularsample was degassed at 50 °C for 24 h before the N2 adsorptionmeasurement to minimize the release of sulfur in the vacuumchamber. Total surface areas were calculated by using theBET equation based on ASTM D4820-96a (14). Microporesurface areas and volumes were calculated from t-plotanalyses using the Jura-Harkins equation (15). The range ofrelative pressures used to determine micropore surface areasand volumes were based on thickness t values between 4.5and 8.0 Å. Micropore size distributions were determined witha 3D model (16). Sulfur analyses are based on ASTM D4239-94 (17) using a LECO SC-32 system with a detection rangeof 0.005-99.99% sulfur. Sulfur functional groups on the ACFwere examined by S-XANES (Figure 2) (18) and XPS (7).Selected samples were also examined by X-ray diffraction(XRD) to identify the presence of any crystalline elementalsulfur in the sulfur-impregnated samples. Thermal-pro-grammed desorption/thermogravimetry/mass spectrometry(TPD/TG/MS, Netzsch system 409/429-403) was used toexamine the thermal evolution of various surface functionalgroups. Samples (25-50 mg) stored in a UHP N2 environmentwere analyzed in an He environment between 20 and 1000°C with a constant heating rate of 20 °C/min. Evolved gasspecies were detected by the online quadruple MS thatscanned up to 257 atomic mass units (amu).
Mercury Adsorption Tests. Raw and sulfur-impregnatedACF samples were stored in air and shipped to URS RadianLLC (Austin, TX) for bench-scale, fixed-bed mercury adsorp-tion tests. A brief description of the test is provided here for
FIGURE 1. Preparation of sulfur-impregnated and CS2-extracted ACF samples.
2786 9 ENVIRONMENTAL SCIENCE & TECHNOLOGY / VOL. 35, NO. 13, 2001
clarity (19). Tests were carried out using three simulated coalcombustion flue gases with an inlet Hg0 concentration of 50( 10 µg/Nm3 (Table 1). The baseline flue gas condition wassimulated at 135 °C and contained SO2 but no NOx. The othertwo flue gas conditions were simulated at 163 °C andcontained NOx. These two conditions were used to simulategas streams generated by burning eastern bituminous andlow-sulfur eastern bituminous coals at selected concentra-tions of SO2. Other flue gas components included HCl, O2,CO2, H2O, and balance N2. The simulated flue gas streamthen passed through a temperature-controlled fixed-bedcolumn (1.3-cm i.d.) containing 20 mg of ACF mixed with 10g of sand. The volumetric flow rate through the column was1 L/min (24 °C). The effluent gas from the fixed-bed columnflowed through heated lines to an impinger containingSnCl2(aq) that reduced any oxidized mercury compounds toHg0. The gas then flowed through a buffer solution (Na2-CO3(aq)) to remove the SO2 and HCl from the gas stream. Gasexiting the solutions then flowed through a gold amalgam-ation column housed in a tubular furnace, where the Hg0
was adsorbed (<100 °C). The Hg0 on the gold was thenthermally desorbed (>750 °C) and sent as a concentratedHg0 stream to a cold-vapor atomic absorption (CVAA)spectrophotometer for analysis.
Equilibrium Hg0 adsorption capacities (micrograms of Hg0
per gram of adsorbent) were determined by summing themass of Hg0 removed from the gas stream based on themeasured breakthrough curves and then dividing by the massof the adsorbent in the adsorption bed:
Here mi is the mass of adsorbed Hg0, madsorbent is the totalmass of adsorbent, t′ is the equilibrium breakthrough time,
Ci,in is the inlet Hg0 concentration, Ci,out is the outlet Hg0
concentration at time t, Qg is the gas flow rate, and ∆t is thetime interval during the breakthrough test. The measuredadsorption capacities were then normalized to an inlet Hg0
concentration of 50 µg/Nm3 by
where Cref. is 50 µg/Nm3 and Cact. is the actual inlet Hg0
concentration.Quality control measurements were performed at URS
Radian LLC to verify proper operation of the benchscalemercury adsorption tests (19). Blanks and quality controlsamples consisting of gas-phase injections of known mercury“spikes” were within 10% to pass an initial accuracy check.Blank tests conducted with no carbon sample in the sandbed consistently indicated no Hg0 adsorption. During opera-tion of the test unit, all efforts were made to ensure consistentoperation of all test parameters. However, some inconsis-tencies periodically occurred because the inlet concentrationof mercury was very low and difficult to control (e.g., 50 (10 µg/Nm3). Quantification of error for the system wascompleted by measuring Hg0 adsorption capacities for NoritDarco FGD activated carbon in the baseline simulated fluegas. A linear correlation between equilibrium Hg0 adsorptioncapacities and inlet Hg0 concentrations was obtained with83 data points. Differences in equilibrium Hg0 adsorptioncapacities, at 50 µg/Nm3 inlet Hg0 concentration, are statisti-cally significant if those capacities are at least (49% differentfrom one another. The analysis was performed at a 95%confidence level.
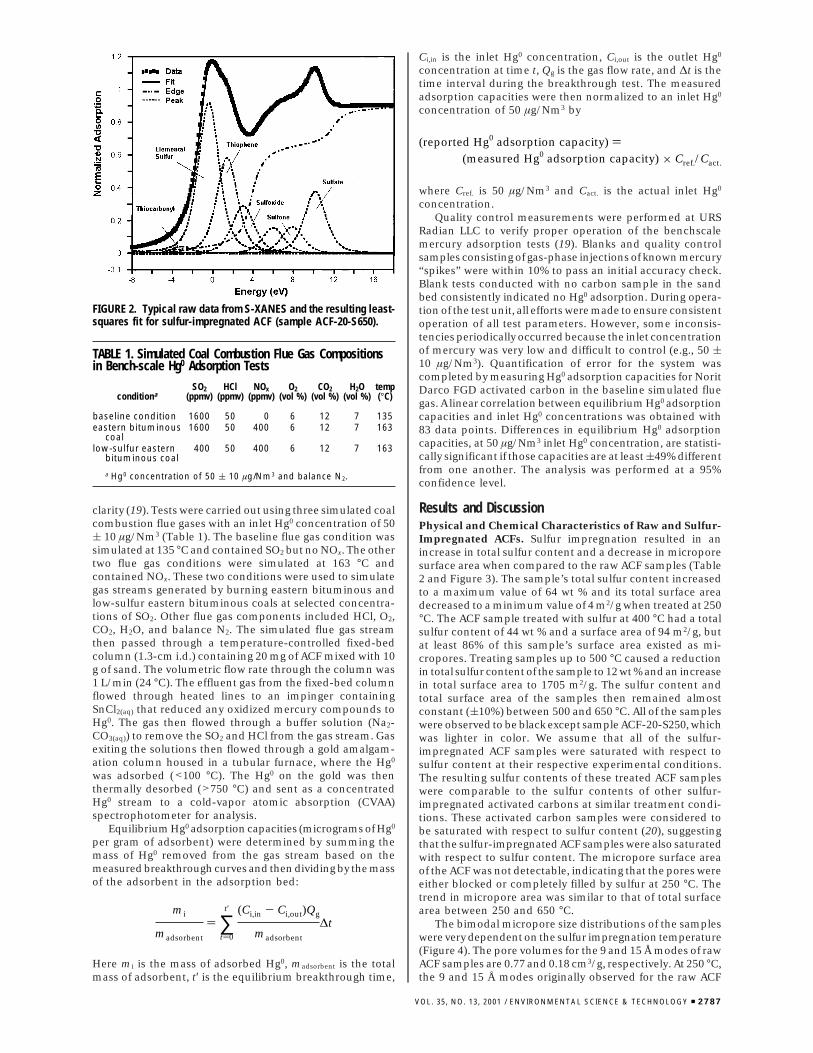
Results and DiscussionPhysical and Chemical Characteristics of Raw and Sulfur-Impregnated ACFs. Sulfur impregnation resulted in anincrease in total sulfur content and a decrease in microporesurface area when compared to the raw ACF samples (Table2 and Figure 3). The sample’s total sulfur content increasedto a maximum value of 64 wt % and its total surface areadecreased to a minimum value of 4 m2/g when treated at 250°C. The ACF sample treated with sulfur at 400 °C had a totalsulfur content of 44 wt % and a surface area of 94 m2/g, butat least 86% of this sample’s surface area existed as mi-cropores. Treating samples up to 500 °C caused a reductionin total sulfur content of the sample to 12 wt % and an increasein total surface area to 1705 m2/g. The sulfur content andtotal surface area of the samples then remained almostconstant ((10%) between 500 and 650 °C. All of the sampleswere observed to be black except sample ACF-20-S250, whichwas lighter in color. We assume that all of the sulfur-impregnated ACF samples were saturated with respect tosulfur content at their respective experimental conditions.The resulting sulfur contents of these treated ACF sampleswere comparable to the sulfur contents of other sulfur-impregnated activated carbons at similar treatment condi-tions. These activated carbon samples were considered tobe saturated with respect to sulfur content (20), suggestingthat the sulfur-impregnated ACF samples were also saturatedwith respect to sulfur content. The micropore surface areaof the ACF was not detectable, indicating that the pores wereeither blocked or completely filled by sulfur at 250 °C. Thetrend in micropore area was similar to that of total surfacearea between 250 and 650 °C.
The bimodal micropore size distributions of the sampleswere very dependent on the sulfur impregnation temperature(Figure 4). The pore volumes for the 9 and 15 Å modes of rawACF samples are 0.77 and 0.18 cm3/g, respectively. At 250 °C,the 9 and 15 Å modes originally observed for the raw ACF
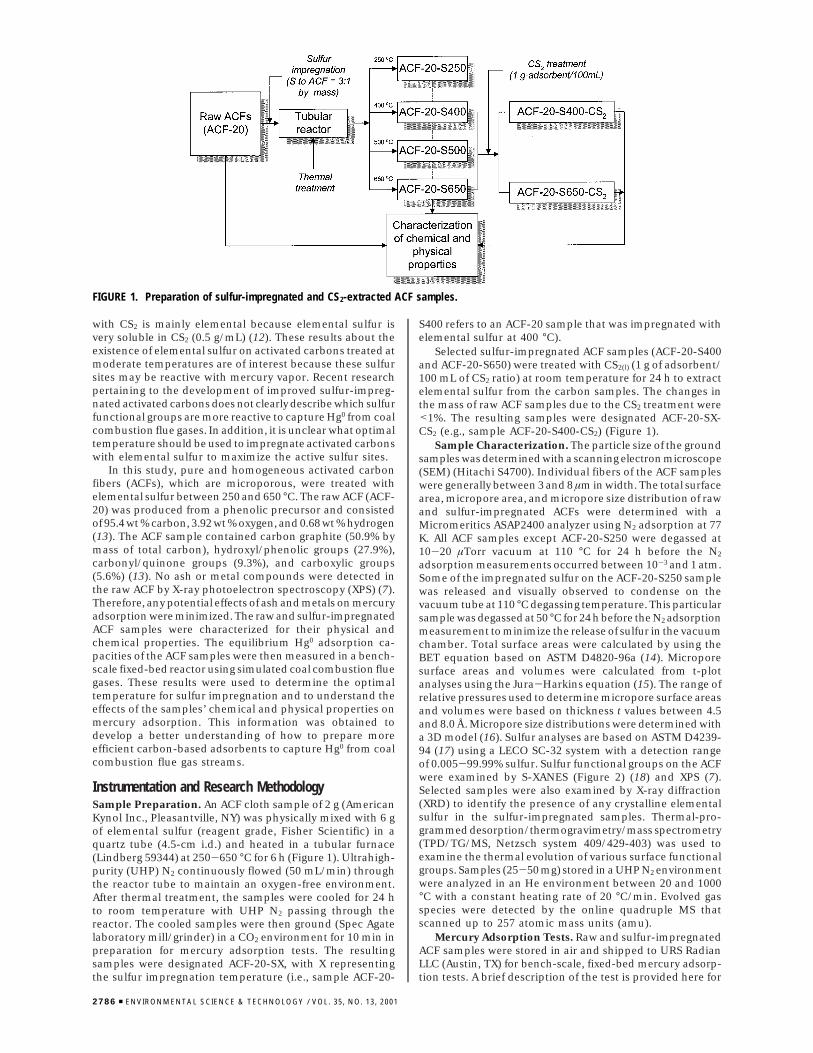
FIGURE 2. Typical raw data from S-XANES and the resulting least-squares fit for sulfur-impregnated ACF (sample ACF-20-S650).
TABLE 1. Simulated Coal Combustion Flue Gas Compositionsin Bench-scale Hg0 Adsorption Tests
conditionaSO2
(ppmv)HCl
(ppmv)NOx
(ppmv)O2
(vol %)CO2
(vol %)H2O
(vol %)temp(°C)
baseline condition 1600 50 0 6 12 7 135eastern bituminous
coal1600 50 400 6 12 7 163
low-sulfur easternbituminous coal
400 50 400 6 12 7 163
a Hg0 concentration of 50 ( 10 µg/Nm3 and balance N2.
mi
madsorbent
) ∑t)0
t′ (Ci,in - Ci,out)Qg
madsorbent
∆t
(reported Hg0 adsorption capacity) )(measured Hg0 adsorption capacity) × Cref./Cact.
VOL. 35, NO. 13, 2001 / ENVIRONMENTAL SCIENCE & TECHNOLOGY 9 2787
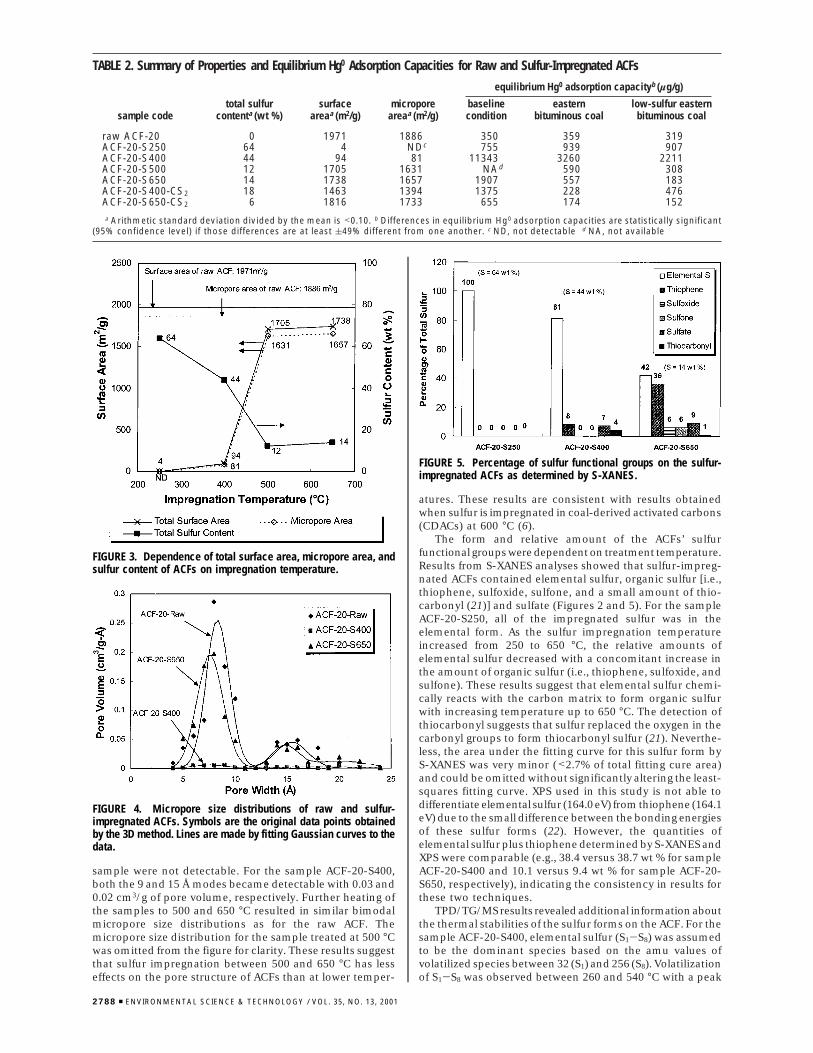
sample were not detectable. For the sample ACF-20-S400,both the 9 and 15 Å modes became detectable with 0.03 and0.02 cm3/g of pore volume, respectively. Further heating ofthe samples to 500 and 650 °C resulted in similar bimodalmicropore size distributions as for the raw ACF. Themicropore size distribution for the sample treated at 500 °Cwas omitted from the figure for clarity. These results suggestthat sulfur impregnation between 500 and 650 °C has lesseffects on the pore structure of ACFs than at lower temper-
atures. These results are consistent with results obtainedwhen sulfur is impregnated in coal-derived activated carbons(CDACs) at 600 °C (6).
The form and relative amount of the ACFs’ sulfurfunctional groups were dependent on treatment temperature.Results from S-XANES analyses showed that sulfur-impreg-nated ACFs contained elemental sulfur, organic sulfur [i.e.,thiophene, sulfoxide, sulfone, and a small amount of thio-carbonyl (21)] and sulfate (Figures 2 and 5). For the sampleACF-20-S250, all of the impregnated sulfur was in theelemental form. As the sulfur impregnation temperatureincreased from 250 to 650 °C, the relative amounts ofelemental sulfur decreased with a concomitant increase inthe amount of organic sulfur (i.e., thiophene, sulfoxide, andsulfone). These results suggest that elemental sulfur chemi-cally reacts with the carbon matrix to form organic sulfurwith increasing temperature up to 650 °C. The detection ofthiocarbonyl suggests that sulfur replaced the oxygen in thecarbonyl groups to form thiocarbonyl sulfur (21). Neverthe-less, the area under the fitting curve for this sulfur form byS-XANES was very minor (<2.7% of total fitting cure area)and could be omitted without significantly altering the least-squares fitting curve. XPS used in this study is not able todifferentiate elemental sulfur (164.0 eV) from thiophene (164.1eV) due to the small difference between the bonding energiesof these sulfur forms (22). However, the quantities ofelemental sulfur plus thiophene determined by S-XANES andXPS were comparable (e.g., 38.4 versus 38.7 wt % for sampleACF-20-S400 and 10.1 versus 9.4 wt % for sample ACF-20-S650, respectively), indicating the consistency in results forthese two techniques.
TPD/TG/MS results revealed additional information aboutthe thermal stabilities of the sulfur forms on the ACF. For thesample ACF-20-S400, elemental sulfur (S1-S8) was assumedto be the dominant species based on the amu values ofvolatilized species between 32 (S1) and 256 (S8). Volatilizationof S1-S8 was observed between 260 and 540 °C with a peak
TABLE 2. Summary of Properties and Equilibrium Hg0 Adsorption Capacities for Raw and Sulfur-Impregnated ACFs
equilibrium Hg0 adsorption capacityb (µg/g)
sample codetotal sulfur
contenta (wt %)surface
areaa (m2/g)micropore
areaa (m2/g)baselinecondition
easternbituminous coal
low-sulfur easternbituminous coal
raw ACF-20 0 1971 1886 350 359 319ACF-20-S250 64 4 NDc 755 939 907ACF-20-S400 44 94 81 11343 3260 2211ACF-20-S500 12 1705 1631 NAd 590 308ACF-20-S650 14 1738 1657 1907 557 183ACF-20-S400-CS2 18 1463 1394 1375 228 476ACF-20-S650-CS2 6 1816 1733 655 174 152a Arithmetic standard deviation divided by the mean is <0.10. b Differences in equilibrium Hg0 adsorption capacities are statistically significant
(95% confidence level) if those differences are at least (49% different from one another. c ND, not detectable d NA, not available
FIGURE 3. Dependence of total surface area, micropore area, andsulfur content of ACFs on impregnation temperature.
FIGURE 4. Micropore size distributions of raw and sulfur-impregnated ACFs. Symbols are the original data points obtainedby the 3D method. Lines are made by fitting Gaussian curves to thedata.
FIGURE 5. Percentage of sulfur functional groups on the sulfur-impregnated ACFs as determined by S-XANES.
2788 9 ENVIRONMENTAL SCIENCE & TECHNOLOGY / VOL. 35, NO. 13, 2001
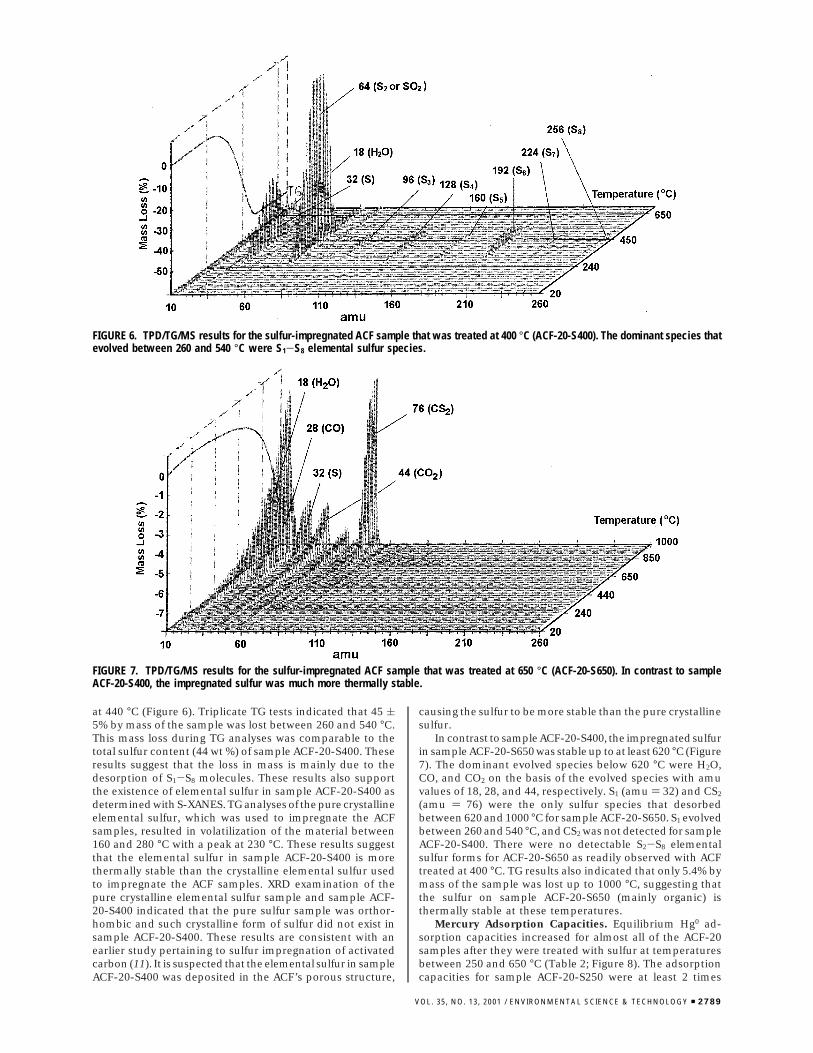
at 440 °C (Figure 6). Triplicate TG tests indicated that 45 (5% by mass of the sample was lost between 260 and 540 °C.This mass loss during TG analyses was comparable to thetotal sulfur content (44 wt %) of sample ACF-20-S400. Theseresults suggest that the loss in mass is mainly due to thedesorption of S1-S8 molecules. These results also supportthe existence of elemental sulfur in sample ACF-20-S400 asdetermined with S-XANES. TG analyses of the pure crystallineelemental sulfur, which was used to impregnate the ACFsamples, resulted in volatilization of the material between160 and 280 °C with a peak at 230 °C. These results suggestthat the elemental sulfur in sample ACF-20-S400 is morethermally stable than the crystalline elemental sulfur usedto impregnate the ACF samples. XRD examination of thepure crystalline elemental sulfur sample and sample ACF-20-S400 indicated that the pure sulfur sample was orthor-hombic and such crystalline form of sulfur did not exist insample ACF-20-S400. These results are consistent with anearlier study pertaining to sulfur impregnation of activatedcarbon (11). It is suspected that the elemental sulfur in sampleACF-20-S400 was deposited in the ACF’s porous structure,
causing the sulfur to be more stable than the pure crystallinesulfur.
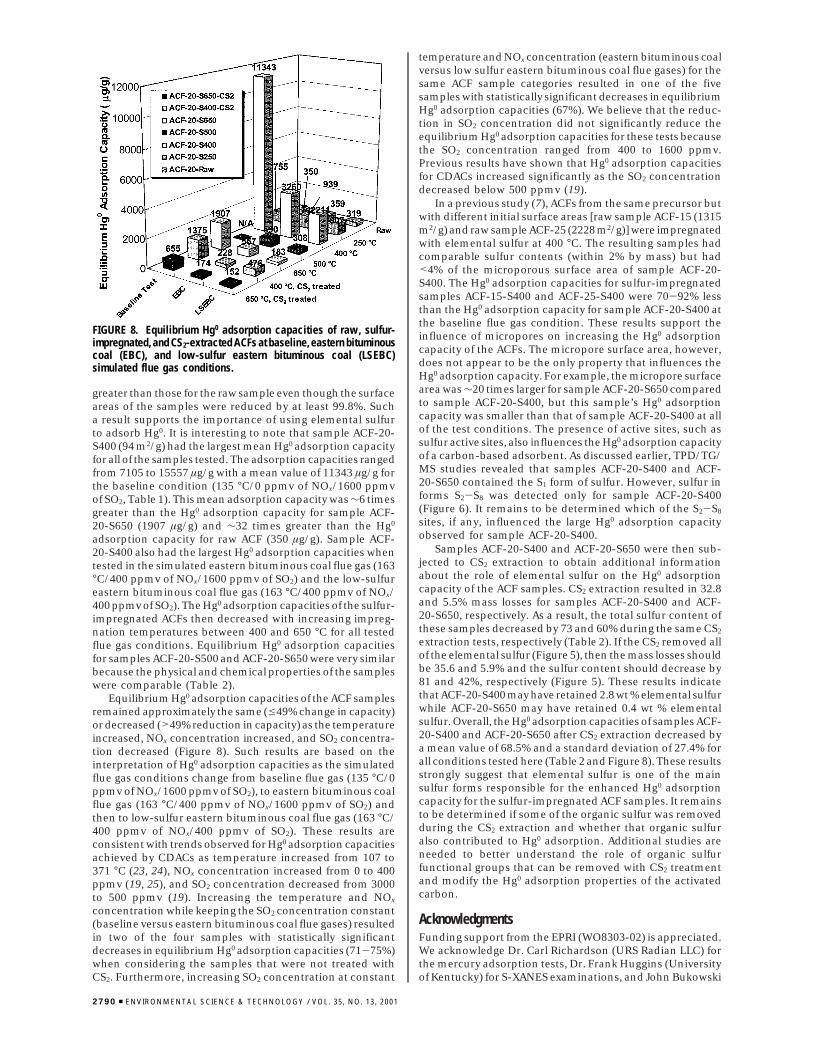
In contrast to sample ACF-20-S400, the impregnated sulfurin sample ACF-20-S650 was stable up to at least 620 °C (Figure7). The dominant evolved species below 620 °C were H2O,CO, and CO2 on the basis of the evolved species with amuvalues of 18, 28, and 44, respectively. S1 (amu ) 32) and CS2
(amu ) 76) were the only sulfur species that desorbedbetween 620 and 1000 °C for sample ACF-20-S650. S1 evolvedbetween 260 and 540 °C, and CS2 was not detected for sampleACF-20-S400. There were no detectable S2-S8 elementalsulfur forms for ACF-20-S650 as readily observed with ACFtreated at 400 °C. TG results also indicated that only 5.4% bymass of the sample was lost up to 1000 °C, suggesting thatthe sulfur on sample ACF-20-S650 (mainly organic) isthermally stable at these temperatures.
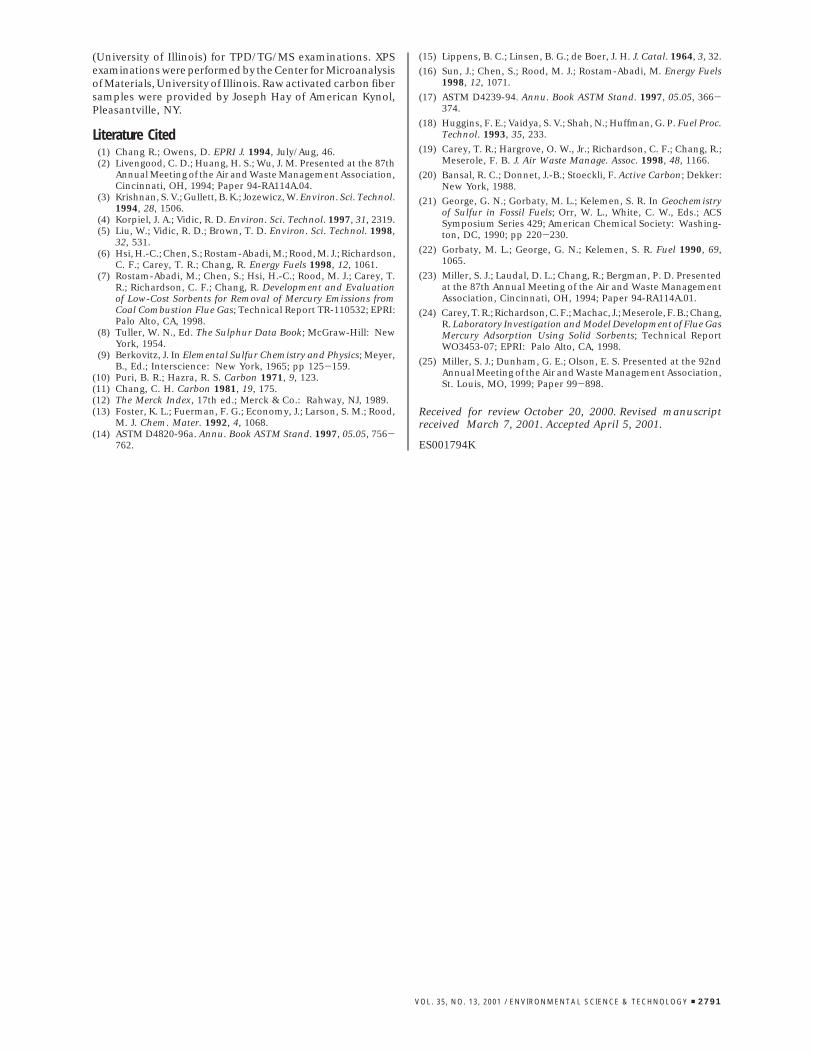
Mercury Adsorption Capacities. Equilibrium Hg0 ad-sorption capacities increased for almost all of the ACF-20samples after they were treated with sulfur at temperaturesbetween 250 and 650 °C (Table 2; Figure 8). The adsorptioncapacities for sample ACF-20-S250 were at least 2 times
FIGURE 6. TPD/TG/MS results for the sulfur-impregnated ACF sample that was treated at 400 °C (ACF-20-S400). The dominant species thatevolved between 260 and 540 °C were S1-S8 elemental sulfur species.
FIGURE 7. TPD/TG/MS results for the sulfur-impregnated ACF sample that was treated at 650 °C (ACF-20-S650). In contrast to sampleACF-20-S400, the impregnated sulfur was much more thermally stable.
VOL. 35, NO. 13, 2001 / ENVIRONMENTAL SCIENCE & TECHNOLOGY 9 2789
greater than those for the raw sample even though the surfaceareas of the samples were reduced by at least 99.8%. Sucha result supports the importance of using elemental sulfurto adsorb Hg0. It is interesting to note that sample ACF-20-S400 (94 m2/g) had the largest mean Hg0 adsorption capacityfor all of the samples tested. The adsorption capacities rangedfrom 7105 to 15557 µg/g with a mean value of 11343 µg/g forthe baseline condition (135 °C/0 ppmv of NOx/1600 ppmvof SO2, Table 1). This mean adsorption capacity was ∼6 timesgreater than the Hg0 adsorption capacity for sample ACF-20-S650 (1907 µg/g) and ∼32 times greater than the Hg0
adsorption capacity for raw ACF (350 µg/g). Sample ACF-20-S400 also had the largest Hg0 adsorption capacities whentested in the simulated eastern bituminous coal flue gas (163°C/400 ppmv of NOx/1600 ppmv of SO2) and the low-sulfureastern bituminous coal flue gas (163 °C/400 ppmv of NOx/400 ppmv of SO2). The Hg0 adsorption capacities of the sulfur-impregnated ACFs then decreased with increasing impreg-nation temperatures between 400 and 650 °C for all testedflue gas conditions. Equilibrium Hg0 adsorption capacitiesfor samples ACF-20-S500 and ACF-20-S650 were very similarbecause the physical and chemical properties of the sampleswere comparable (Table 2).
Equilibrium Hg0 adsorption capacities of the ACF samplesremained approximately the same (e49% change in capacity)or decreased (>49% reduction in capacity) as the temperatureincreased, NOx concentration increased, and SO2 concentra-tion decreased (Figure 8). Such results are based on theinterpretation of Hg0 adsorption capacities as the simulatedflue gas conditions change from baseline flue gas (135 °C/0ppmv of NOx/1600 ppmv of SO2), to eastern bituminous coalflue gas (163 °C/400 ppmv of NOx/1600 ppmv of SO2) andthen to low-sulfur eastern bituminous coal flue gas (163 °C/400 ppmv of NOx/400 ppmv of SO2). These results areconsistent with trends observed for Hg0 adsorption capacitiesachieved by CDACs as temperature increased from 107 to371 °C (23, 24), NOx concentration increased from 0 to 400ppmv (19, 25), and SO2 concentration decreased from 3000to 500 ppmv (19). Increasing the temperature and NOx
concentration while keeping the SO2 concentration constant(baseline versus eastern bituminous coal flue gases) resultedin two of the four samples with statistically significantdecreases in equilibrium Hg0 adsorption capacities (71-75%)when considering the samples that were not treated withCS2. Furthermore, increasing SO2 concentration at constant
temperature and NOx concentration (eastern bituminous coalversus low sulfur eastern bituminous coal flue gases) for thesame ACF sample categories resulted in one of the fivesamples with statistically significant decreases in equilibriumHg0 adsorption capacities (67%). We believe that the reduc-tion in SO2 concentration did not significantly reduce theequilibrium Hg0 adsorption capacities for these tests becausethe SO2 concentration ranged from 400 to 1600 ppmv.Previous results have shown that Hg0 adsorption capacitiesfor CDACs increased significantly as the SO2 concentrationdecreased below 500 ppmv (19).
In a previous study (7), ACFs from the same precursor butwith different initial surface areas [raw sample ACF-15 (1315m2/g) and raw sample ACF-25 (2228 m2/g)] were impregnatedwith elemental sulfur at 400 °C. The resulting samples hadcomparable sulfur contents (within 2% by mass) but had<4% of the microporous surface area of sample ACF-20-S400. The Hg0 adsorption capacities for sulfur-impregnatedsamples ACF-15-S400 and ACF-25-S400 were 70-92% lessthan the Hg0 adsorption capacity for sample ACF-20-S400 atthe baseline flue gas condition. These results support theinfluence of micropores on increasing the Hg0 adsorptioncapacity of the ACFs. The micropore surface area, however,does not appear to be the only property that influences theHg0 adsorption capacity. For example, the micropore surfacearea was ∼20 times larger for sample ACF-20-S650 comparedto sample ACF-20-S400, but this sample’s Hg0 adsorptioncapacity was smaller than that of sample ACF-20-S400 at allof the test conditions. The presence of active sites, such assulfur active sites, also influences the Hg0 adsorption capacityof a carbon-based adsorbent. As discussed earlier, TPD/TG/MS studies revealed that samples ACF-20-S400 and ACF-20-S650 contained the S1 form of sulfur. However, sulfur informs S2-S8 was detected only for sample ACF-20-S400(Figure 6). It remains to be determined which of the S2-S8
sites, if any, influenced the large Hg0 adsorption capacityobserved for sample ACF-20-S400.
Samples ACF-20-S400 and ACF-20-S650 were then sub-jected to CS2 extraction to obtain additional informationabout the role of elemental sulfur on the Hg0 adsorptioncapacity of the ACF samples. CS2 extraction resulted in 32.8and 5.5% mass losses for samples ACF-20-S400 and ACF-20-S650, respectively. As a result, the total sulfur content ofthese samples decreased by 73 and 60% during the same CS2
extraction tests, respectively (Table 2). If the CS2 removed allof the elemental sulfur (Figure 5), then the mass losses shouldbe 35.6 and 5.9% and the sulfur content should decrease by81 and 42%, respectively (Figure 5). These results indicatethat ACF-20-S400 may have retained 2.8 wt % elemental sulfurwhile ACF-20-S650 may have retained 0.4 wt % elementalsulfur. Overall, the Hg0 adsorption capacities of samples ACF-20-S400 and ACF-20-S650 after CS2 extraction decreased bya mean value of 68.5% and a standard deviation of 27.4% forall conditions tested here (Table 2 and Figure 8). These resultsstrongly suggest that elemental sulfur is one of the mainsulfur forms responsible for the enhanced Hg0 adsorptioncapacity for the sulfur-impregnated ACF samples. It remainsto be determined if some of the organic sulfur was removedduring the CS2 extraction and whether that organic sulfuralso contributed to Hg0 adsorption. Additional studies areneeded to better understand the role of organic sulfurfunctional groups that can be removed with CS2 treatmentand modify the Hg0 adsorption properties of the activatedcarbon.
AcknowledgmentsFunding support from the EPRI (WO8303-02) is appreciated.We acknowledge Dr. Carl Richardson (URS Radian LLC) forthe mercury adsorption tests, Dr. Frank Huggins (Universityof Kentucky) for S-XANES examinations, and John Bukowski
FIGURE 8. Equilibrium Hg0 adsorption capacities of raw, sulfur-impregnated, and CS2-extracted ACFs at baseline, eastern bituminouscoal (EBC), and low-sulfur eastern bituminous coal (LSEBC)simulated flue gas conditions.
2790 9 ENVIRONMENTAL SCIENCE & TECHNOLOGY / VOL. 35, NO. 13, 2001
(University of Illinois) for TPD/TG/MS examinations. XPSexaminations were performed by the Center for Microanalysisof Materials, University of Illinois. Raw activated carbon fibersamples were provided by Joseph Hay of American Kynol,Pleasantville, NY.
Literature Cited(1) Chang R.; Owens, D. EPRI J. 1994, July/Aug, 46.(2) Livengood, C. D.; Huang, H. S.; Wu, J. M. Presented at the 87th
Annual Meeting of the Air and Waste Management Association,Cincinnati, OH, 1994; Paper 94-RA114A.04.
(3) Krishnan, S. V.; Gullett, B. K.; Jozewicz, W. Environ. Sci. Technol.1994, 28, 1506.
(4) Korpiel, J. A.; Vidic, R. D. Environ. Sci. Technol. 1997, 31, 2319.(5) Liu, W.; Vidic, R. D.; Brown, T. D. Environ. Sci. Technol. 1998,
32, 531.(6) Hsi, H.-C.; Chen, S.; Rostam-Abadi, M.; Rood, M. J.; Richardson,
C. F.; Carey, T. R.; Chang, R. Energy Fuels 1998, 12, 1061.(7) Rostam-Abadi, M.; Chen, S.; Hsi, H.-C.; Rood, M. J.; Carey, T.
R.; Richardson, C. F.; Chang, R. Development and Evaluationof Low-Cost Sorbents for Removal of Mercury Emissions fromCoal Combustion Flue Gas; Technical Report TR-110532; EPRI:Palo Alto, CA, 1998.
(8) Tuller, W. N., Ed. The Sulphur Data Book; McGraw-Hill: NewYork, 1954.
(9) Berkovitz, J. In Elemental Sulfur Chemistry and Physics; Meyer,B., Ed.; Interscience: New York, 1965; pp 125-159.
(10) Puri, B. R.; Hazra, R. S. Carbon 1971, 9, 123.(11) Chang, C. H. Carbon 1981, 19, 175.(12) The Merck Index, 17th ed.; Merck & Co.: Rahway, NJ, 1989.(13) Foster, K. L.; Fuerman, F. G.; Economy, J.; Larson, S. M.; Rood,
M. J. Chem. Mater. 1992, 4, 1068.(14) ASTM D4820-96a. Annu. Book ASTM Stand. 1997, 05.05, 756-
762.
(15) Lippens, B. C.; Linsen, B. G.; de Boer, J. H. J. Catal. 1964, 3, 32.
(16) Sun, J.; Chen, S.; Rood, M. J.; Rostam-Abadi, M. Energy Fuels1998, 12, 1071.
(17) ASTM D4239-94. Annu. Book ASTM Stand. 1997, 05.05, 366-374.
(18) Huggins, F. E.; Vaidya, S. V.; Shah, N.; Huffman, G. P. Fuel Proc.Technol. 1993, 35, 233.
(19) Carey, T. R.; Hargrove, O. W., Jr.; Richardson, C. F.; Chang, R.;Meserole, F. B. J. Air Waste Manage. Assoc. 1998, 48, 1166.
(20) Bansal, R. C.; Donnet, J.-B.; Stoeckli, F. Active Carbon; Dekker:New York, 1988.
(21) George, G. N.; Gorbaty, M. L.; Kelemen, S. R. In Geochemistryof Sulfur in Fossil Fuels; Orr, W. L., White, C. W., Eds.; ACSSymposium Series 429; American Chemical Society: Washing-ton, DC, 1990; pp 220-230.
(22) Gorbaty, M. L.; George, G. N.; Kelemen, S. R. Fuel 1990, 69,1065.
(23) Miller, S. J.; Laudal, D. L.; Chang, R.; Bergman, P. D. Presentedat the 87th Annual Meeting of the Air and Waste ManagementAssociation, Cincinnati, OH, 1994; Paper 94-RA114A.01.
(24) Carey, T. R.; Richardson, C. F.; Machac, J.; Meserole, F. B.; Chang,R. Laboratory Investigation and Model Development of Flue GasMercury Adsorption Using Solid Sorbents; Technical ReportWO3453-07; EPRI: Palo Alto, CA, 1998.
(25) Miller, S. J.; Dunham, G. E.; Olson, E. S. Presented at the 92ndAnnual Meeting of the Air and Waste Management Association,St. Louis, MO, 1999; Paper 99-898.
Received for review October 20, 2000. Revised manuscriptreceived March 7, 2001. Accepted April 5, 2001.
ES001794K
VOL. 35, NO. 13, 2001 / ENVIRONMENTAL SCIENCE & TECHNOLOGY 9 2791