effects of surface wind speed decline on modeled
TRANSCRIPT

Hydrol. Earth Syst. Sci., 18, 2803–2813, 2014www.hydrol-earth-syst-sci.net/18/2803/2014/doi:10.5194/hess-18-2803-2014© Author(s) 2014. CC Attribution 3.0 License.
Effects of surface wind speed decline on modeled hydrologicalconditions in ChinaX. Liu 1, X.-J. Zhang1.2, Q. Tang1, and X.-Z. Zhang1
1Institute of Geographic Sciences and Natural Resources Research, Chinese Academy of Sciences,Beijing 100101, China2University of Chinese Academy of Sciences, Beijing 100049, China
Correspondence to:Q. Tang ([email protected])
Received: 23 July 2013 – Published in Hydrol. Earth Syst. Sci. Discuss.: 29 August 2013Revised: 29 May 2014 – Accepted: 17 June 2014 – Published: 1 August 2014
Abstract. Surface wind speed decline in China has beenwidely reported, but its effects on hydrology have not beenfully evaluated to date. In this study, the effects of windspeed change on modeled hydrological conditions are inves-tigated using the Variable Infiltration Capacity (VIC) hydro-logical model for China during the 1966–2011 period. Twomodel experiments, i.e., VIC simulations with the observed(EXP1) and detrended wind speed (EXP2), are performedover the major river basins in China. The differences be-tween the two experiments are analyzed to assess the effectsof wind speed decline. Results show that wind speed has de-creased by 29 % in China. The wind speed decline wouldhave resulted in a decrease in evapotranspiration of 1–3 %of mean annual evapotranspiration and an increase in runoffof 1–6 % of mean annual runoff at most basins in China.The sensitivities of evapotranspiration and runoff changes towind speed change are larger in humid areas than dry areas,while the sensitivity of soil moisture change to wind speedchange is situation dependent. The wind speed decline wouldhave offset the expansion of the drought area in China. Ithas contributed to reducing drought areas by 8.8 % of themean drought area (i.e., approximate 106× 103 km2 out of1.2× 106 km2) over China. The reductions of soil moisturedrought induced by wind speed decline are large (more than5 % of the mean drought area) in most basins, except in theSouthwest and Pearl River basins.
1 Introduction
Drying trends have been detected in several regions of Chinaduring the past decades (Dai et al., 2004; Zou et al., 2005;Sheffield et al., 2012b). Soil moisture simulations derivedfrom land surface models are widely used to assess hydro-logical drought conditions (Sheffield and Wood, 2008; Wu etal., 2011; Li and Ma, 2012). Soil moisture drought in Chinashows roughly the similar increasing trend in the last sev-eral decades as other drought indices (Wang et al., 2011).The reduction of precipitation and increase of temperaturemay have contributed to the drying trend in China (Ma etal., 2000; Ma and Fu, 2006; Xin et al., 2006; Tang et al.,2008b; Dai, 2011). However, few studies have addressedthe effects of surface wind speed decline (i.e., atmosphericstilling) which may alleviate the drying of soil moisture byreducing atmospheric evaporative demand (McVicar et al.,2012b). Wind speed decline has been observed in the lastseveral decades over many countries worldwide (Pryor et al.,2009; Vautard et al., 2010; Wan et al., 2010). The wind speedhas declined as well over most areas in China (Xu et al.,2006; Jiang et al., 2010; Guo et al., 2011), including remoteareas such as the Tibetan Plateau (Lin et al., 2013; Yang etal., 2014). The change in wind speed may have affected thesurface hydrological cycle.
Published by Copernicus Publications on behalf of the European Geosciences Union.

2804 X. Liu et al.: Effects of surface wind speed decline on hydrology
The hydrological consequence of wind speed decline hasattracted great interest in recent years. The previous studieshave tried to assess the effects of the wind speed decline onevaporation and suggested that the wind speed decline was amajor or even the primary factor contributing to the decreaseof evaporative demand (McVicar et al., 2012a). For exam-ple, Rayner (2007) and Roderick et al. (2007) suggested thatwind speed change was the dominant factor causing the de-creasing trends in pan evaporation in Australia. Wind speeddecline was identified as the main factor that caused the de-crease in pan evaporation in the Hai River basin (Zheng et al.,2009; Tang et al., 2011) and the dominant factor responsiblefor the decrease in pan evaporation from 1960 to the early1990s in the northern and central regions of China (Liu et al.,2011). McVicar et al. (2012b) suggested that the impact ofwind speed decline on actual evapotranspiration and stream-flow was situation dependent. Wind speed decline tends toresult in the decline of actual evapotranspiration and comple-mentary increase of streamflow in wet river basins but has lit-tle impacts in dry basins. In the studies assessing the impactsof changes in meteorological variables on runoff in China,wind speed declines are often identified as being important.For instance, wind speed decline was the second greatestcontributing factor, just after precipitation, to runoff changesat the Futuo River basin in northern China (Yang and Yang,2011). The climate elasticity analyses suggested that runoffwould increase 1–8 % when wind speed decreased 10 % atthe catchments of the Hai River and the Yellow River basinsof China (Yang and Yang, 2011). Increase in runoff inducedby wind speed decline may have favored the recent recov-ery of natural runoff in the Yellow River basin (Tang et al.,2013).
Although the hydrological responses to widespread de-cline in wind speed have been reported at some basins inChina, there are few studies in the literature assessing thehydrological impacts of wind speed decline across the ma-jor basins in China. While detecting the impacts of windspeed decline from observations is still difficult due to largevariability of the hydrological variables, a model’s approachcould furnish a preliminary quantitative assessment. In thispaper, a macroscale hydrological model is used to assessthe effects of wind speed decline on the modeled hydrologi-cal conditions. The objective of this study is to quantify thepotential contributions of wind speed change to changes inactual evapotranspiration, runoff, soil moisture and droughtover the major river basins in China.
2 Method
The Variable Infiltration Capacity (VIC) hydrological model(Liang et al. 1994) is used to simulate the hydrologic con-ditions in the major rivers of China. The VIC model canenclose both water and surface energy within each modelgrid cell and it can statistically capture subgrid variability
in land surface vegetation classes and soil moisture storagecapacity. The key characteristics of VIC are the representa-tion of vegetation heterogeneity, multiple soil layers (threesoil layers are used in this study) with variable infiltration,and nonlinear base flow (Gao et al., 2010). Actual evapotran-spiration in the VIC model consists of transpiration, canopyevaporation, and bare soil evaporation (Liang et al., 1994;Gao et al., 2010; Tang et al., 2012). Transpiration is esti-mated based on the potential evaporation calculated usingthe Penman–Monteith equation (Shuttleworth, 1993) and thearchitectural, aerodynamic and canopy resistances. Canopyevaporation is estimated from the intercepted water in canopystorage and potential evaporation. Bare soil evaporation isequal to potential evaporation at the saturated area and is be-low the potential rate at the unsaturated area. The evapotran-spiration estimation in the VIC model is detailed in Liang etal. (1994) and Gao et al. (2010). The VIC model has beenwidely used for hydrological simulations in China (e.g., Xieet al., 2007; Wang et al., 2012) and throughout the world(Tang and Lettenmaier, 2010; Gao et al., 2010; Sheffield etal., 2012a). The routinely observed daily meteorological data(maximum and minimum temperature, precipitation, and sur-face wind speed measured at 10 m above ground) during the1952–2011 period are obtained from the China Meteorolog-ical Administration (CMA). The meteorological data from741 gauging stations are used in this study (Fig. 1). Thereare only a few stations available in the Tibetan Plateau andNorthwest China. The analysis and results in these regionsshould be treated with considerable caution. The station dataare interpolated to 0.25◦ grids using the synergraphic map-ping system (SYMAP) (Shepard 1984) as implemented inthe VIC model applications (Maurer et al., 2002; Tang et al.,2009). The SYMAP method uses an inverse distance squaredweighting of observations at stations within a prescribed dis-tance from a grid point to estimate the value at the grid. Dur-ing the interpolation process, temperatures are lapsed by arate of 6.5◦C km−1 to account for elevation differences be-tween the target grid and the stations used in the interpola-tion (Maurer et al., 2002). No elevation adjustment is madefor precipitation and wind interpolation. The model is run ata daily time step forced by the gridded meteorological data,and is calibrated following Shi et al. (2008) against the ob-served monthly streamflow data at 15 hydrological stationsin the major basins of China (Fig. 1). The VIC model pa-rameters are calibrated using an optimization of the multi-objective complex evolution (MOCOM-UA) method (Yapoet al., 1998) as detailed in Zhang et al. (2013, 2014). Sur-face radiations in the VIC model are derived from precipita-tion, mean temperature and diurnal temperature range usingthe built-in MTCLIM (Mountain Climate Simulator) algo-rithm (Kimball et al., 1997; Thornton and Running, 1999),the performance of which has been globally evaluated (Bohnet al., 2013). The radiation estimates in the VIC model wereevaluated in Zhang et al. (2013, 2014) by comparing themwith a radiation data set incorporating the available ground
Hydrol. Earth Syst. Sci., 18, 2803–2813, 2014 www.hydrol-earth-syst-sci.net/18/2803/2014/

X. Liu et al.: Effects of surface wind speed decline on hydrology 2805
Figure 1. Relative change magnitude (%) of annual surface windspeed during the 1966–2011 period in China. The major riverbasins (NW: Northwest, YR: Yellow River, HAI: Hai River, LR:Liao River, SHJ: Songhuajiang, SW: Southwest, CJ: Yangtze River,HUAI: Huai River, PR: Pearl River, SE: Southeast) in China areshown.
radiation observations in China (Yang et al., 2010; Chen etal., 2011). The VIC model showed generally good perfor-mance in reproducing streamflow and surface radiations inChina.
The VIC model is run with a long model spin-up periodfrom 1952, producing an initial model state from which theexperiments start. Two VIC experiments are performed overChina for the period of 1966–2011. One experiment is forcedwith the observed wind speed (EXP1), and the other exper-iment is forced with the detrended wind speed (EXP2). Thelinear trends in annual wind speed over the study period areremoved at each grid cell, and the mean of the detrendedtime series of wind speed is fixed to the mean of the firstdecade (1966–1975) in EXP2 (Tang et al., 2008b). Using thedetrending method, the original time series of annual windspeed is adjusted to a time series without linear trend. Thedaily wind speed of each year is then adjusted using the pro-portion of the detrended annual value to the original annualvalue.
Three hydrological variables, evapotranspiration, runoffand total soil moisture of the three soil layers produced bythe VIC model are used for analyses. The time series of dif-ferences in the annual means of the three hydrological vari-ables between EXP1 and EXP2 are calculated to assess thewind speed decline effects. The change trends of the time se-ries are calculated using the linear least-squares regression.The statistical significance of trend is evaluated by Student’st test at the 95 % confidence level (Santer et al., 2000). Thechange magnitude during the study period is computed as theslope of the linear regression times the length of the study pe-riod. The relative change magnitude is then calculated as thepercentage of change magnitude relative to the mean value(Tang et al., 2008a).
Monthly soil moisture is transformed to percentiles byfitting it with an empirical cumulative probability distribu-tion (Weibull distribution) for each grid cell and each month(Andreadis et al., 2005). The transformed soil moisture in-dex is used in the soil moisture comparisons between EXP1and EXP2. Drought is identified if the monthly soil mois-ture index is less than 20 % in a grid cell. The area sum ofthe drought grid cells is calculated for each month. The an-nual mean drought area is computed in the major river basinsin China (Fig. 1). The Northwest, Yellow River, Hai River,Liao River and Songhuajiang River basins are referred asthe northern basins and the rest are referred as the southernbasins according to their geographic locations.
3 Results
The relative change magnitude of wind speed during the1966–2011 period in China is shown in Fig. 1. Annual windspeed decreased by more than 20 % during the study periodin most areas of China. Wind speed decreased up to 80 % insome regions in the Northwest, Songhuajiang, Yangtze Riverand Southeast River basins. Several previous studies haveproposed different mechanisms to explain the wind speeddecline, including upper-air wind change (Lin et al., 2013),temperature contrasts between land and ocean (Jiang et al.,2010), lower-troposphere pressure-gradient force and urbaneffects (Guo et al., 2011), air pollution (Xu et al., 2006),and surface roughness change (Vautard et al., 2010). Allthese studies have found widespread wind speed declinesfrom urban to remote areas and across different climate re-gions. Some stations (located in the middle Yangtze River,Pearl River and Northwest basins) show wind speed increase,which is the opposite change direction of all neighboring sta-tions. The wind speed change at these stations might be af-fected by local changes surrounding the stations. The oppo-site changes were also reported in the previous studies (e.g.,Xu et al., 2006 and Guo et al., 2011). We examined the al-titude differences between the station with opposite changeand its four nearest stations and did not find a systematicaltitude difference. Thus the opposite changes are unlikelycaused by the altitude difference between the stations (Luoet al., 2008). Although the causes of opposite change are un-clear, the opposite change likely has little influence on ourimpact assessment because the number of stations showingwind speed increase is quite small, accounting for less than3 % of the stations investigated.
Figure 2 shows the areal annual wind speed before andafter removing the tendencies of the major river basins inChina. The observed wind speed shows a significant decreas-ing trend for all the basins. The trend is generally linear inChina during the study period although the decreasing rateseems more rapid in the 1970s and 1980s than other peri-ods in some river basins such as the Northwest Basin. Thisis in line with the previous studies (Jiang et al., 2010; Guo
www.hydrol-earth-syst-sci.net/18/2803/2014/ Hydrol. Earth Syst. Sci., 18, 2803–2813, 2014

2806 X. Liu et al.: Effects of surface wind speed decline on hydrology
Figure 2.The observed and detrended time series of annual wind speed at the major river basins in China. The straight solid and dashed linesare trends for EXP1 and EXP2, respectively. Relative change magnitudes (1) of the observed annual wind speed during the study period areshown. The “∗” symbol indicates the observed trend is significant.
et al., 2011) which found that surface wind speed in Chinastayed at a relatively high level in the 1960s and significantlydeclined after the 1970s. There is a step change in surfacewind speed around the late 1960s. The step change mightbe spurious. While some previous studies suggested that thestep change was caused by changes to the observation instru-
ment (Xu et al., 2006; Fu et al., 2011; Chen et al., 2013),a recent study argued that step change was likely real (notinstrumental) because the observed ground–air temperaturegradient showed a similar step change during the same pe-riod (Lin et al., 2013). The cross-validation results in therecent study (Lin et al., 2013) suggested that the trends of
Hydrol. Earth Syst. Sci., 18, 2803–2813, 2014 www.hydrol-earth-syst-sci.net/18/2803/2014/

X. Liu et al.: Effects of surface wind speed decline on hydrology 2807
Table 1. Relative change magnitude (%) of annual evapotranspira-tion and runoff and change magnitude of soil moisture index forthe major river basins during the 1966–2011 period. E1 and E2 areevapotranspiration from EXP1 and EXP2, respectively; likewise,R1 and R2 are for runoff, and S1 and S2 are for soil moisture index.Bold number indicate the trend is statistically significant.
Basin E1 E2 R1 R2 S1 S2
NW 6.9 8.0 20.5 14.9 −14.6 −16.3YR −5.2 −4.4 −14.3 −16.4 −18.1 −19.4HAI −8.6 −8.0 −25.5 −27.6 −20.3 −22.0LR −10.4 −8.8 −4.0 −7.4 −6.1 −7.8SHJ −6.2 −3.6 7.8 1.5 −6.8 −9.9SW 0.4 1.7 −5.7 −6.9 −15.7 −15.8CJ −2.3 −1.2 −2.2 −3.4 −12.6 −13.3HUAI 0.4 1.7 13.5 11.8 10.9 8.2PR −3.7 −3.2 −3.8 −4.2 −7.3 −7.5SE 0.3 1.6 7.7 6.4 0.1 −1.3China −3.0 −1.8 0.0 −1.5 −9.1 −10.5
the CMA surface wind speed data were quantitatively reli-able although the changes to the instrument and station lo-cation might have contaminated the wind speed observationto some degree (Cao and Yan, 2012). The nonlinearity of thechange is not considered and the linear trend is adopted asa first step to assess the effect of surface wind speed declineon the hydrologic cycle. The largest and smallest decreas-ing magnitudes are found in the Southeast (−37%) and PearlRiver basins (−11%), respectively. In China, the wind speeddecreased by about 29 % during the study period.
Table 1 shows the relative change magnitudes in evapo-transpiration and runoff and change magnitude in soil mois-ture from EXP1 and EXP2 during the study period for themajor river basins. The hydrological variables from EXP1show a decreasing trend for most basins, but the trends inevapotranspiration and runoff are seldom significant. The rel-ative change magnitude in evapotranspiration from EXP1 issmaller than that from EXP2 at all the river basins, indicat-ing that wind speed decline would have caused a decrease inevapotranspiration. Consequently, the relative change mag-nitude in runoff from EXP1 is greater than that from EXP2,suggesting that more runoff would have been generated dueto the wind speed decline. Although the effect of wind speeddecline is relatively small compared to the runoff changecaused by other climatic factors, it may be important forthe northern dry river basins such as the Northwest, YellowRiver, and Hai River where small changes in hydrology andwater resources would have significant implications for wa-ter management. Soil moisture has decreased in most of theriver basins, with significant decreases in the Northwest, Yel-low River, Hai River, Southwest and Yangtze River basins.The decreasing soil moisture in the Northwest river basins isinteresting, especially in the context of increases in evapo-transpiration and runoff. It implies a general increase in soil
moisture drought in the arid and semiarid areas. The changemagnitude in soil moisture from EXP1 is greater than thatfrom EXP2 at all the river basins, suggesting that wind speeddecline would have alleviated the soil moisture drought al-though it could not reverse the general drying trend. Figure 3shows the EXP1 and EXP2 differences (EXP1 minus EXP2)of annual evapotranspiration, runoff, and soil moisture indexfrom 1966 to 2011. The differences are generally small in the1960s because the wind speed in EXP2 is set to the 1960s’conditions in EXP1. The differences become large at present(i.e., the end of the study period) when the wind speed dif-ference becomes large. The relative change magnitude of thedifference provides an assessment of the effect of wind speeddecline to the modeled hydrological conditions. Note that thetrends of the differences between EXP1 and EXP2 are sig-nificant because of the significant decline in wind speed, butthe trend of the individual hydrologic variable is seldom sig-nificant (Table 1) due to its large natural variability. At allthe river basins, wind speed decline would result in decreasein evapotranspiration and increase in runoff and soil mois-ture. The annual evapotranspiration in the 2000s would bemore than 5 mm higher in most basins in eastern and southernChina and about 2 mm higher in the northern dry basins if thewind speed stayed at a relatively high level in the 1966–1975period. The wind speed decline would have resulted in a de-crease in evapotranspiration of 1–3 % of mean annual evapo-transpiration and an increase in runoff of 1–6 % of mean an-nual runoff at most basins. The relative change magnitude ofrunoff associated with wind speed decline is generally large(3–6%) in the northern basins and small (1–2%) in the south-ern basins. The simulated soil moisture index in the 2000s ishigher than the soil moisture index simulations in which thewind speed was assumed to stay at a relatively high level inthe 1966–1975 period. The relative change magnitude of thesoil moisture index is about 3 % in China, and is generallylarge in the northern basins (3–6%) and small in the south-ern basins (mostly less than 3 %). It suggests that wind speeddecline may play a role in regulating soil moisture drought.The variability of the differences seems to increase with timein Fig. 3. There is little difference in wind speed betweenEXP1 and EXP2 during the 1966–1975 period when the an-nual means of wind speed are the same for the two experi-ments. The variability increases when wind speed differencesbecome large after the 1970s (see Fig. 2). The large variabil-ity is likely due to the nonlinear hydrological responses towind speed change.
Figure 4 shows the relative change magnitude of the dif-ferences (EXP1 minus EXP2) of annual evapotranspiration,runoff and soil moisture index from 1966 to 2011 at themodel grid cells. The relative change magnitude of evapo-transpiration difference (Fig. 4a) is negative in most areas ofChina with great changes (less than−4 %) in parts of thesouthern basins and the Songhuajiang and Northwest basins.The positive differences are scattered in the middle YangtzeRiver, Pearl River and Northwest basins, corresponding to
www.hydrol-earth-syst-sci.net/18/2803/2014/ Hydrol. Earth Syst. Sci., 18, 2803–2813, 2014

2808 X. Liu et al.: Effects of surface wind speed decline on hydrology
Figure 3.Differences of annual evapotranspiration (EDiff ), runoff (RDiff ) and soil moisture index (SDiff ) between EXP1 and EXP2 for majorriver basins and the whole of China.1 is the relative change magnitude. The “∗” symbol indicates the trend is significant.
the stations with increased wind speed (see Fig. 1). The es-timated runoff and soil moisture from EXP1 are generallymore positive than those from EXP2. The relative changemagnitude of runoff difference (Fig. 4b) is positive in mostareas of China and negative at some scattered locations, cor-responding to the stations with increased wind speed. Therelative change magnitude of the runoff difference is large(2–10 %) in northeastern and northwestern China, while it issmall (less than 2 %) in southern China. It should be notedthat the change magnitude in the southern China is compa-rable to that in the northern China because the mean annualrunoff is larger in southern China. The relative change mag-nitude of the soil moisture index difference (Fig. 4c) is largein the north of northwestern China and eastern China wherethe wind speed decline is large. This suggests that wind speeddecline may have alleviated the soil moisture drought overthese areas. Again, the relative changes of the soil mois-ture difference are negative at some scattered locations in theSouthwest, Pearl River and Northwest basins, correspondingto the stations with increased wind speed. It should be noted
that the results in the Southwest and Northwest basins maybe of high uncertainty because of the low density meteoro-logical stations.
The modeled sensitivities of changes in the hydrologicalvariables to wind speed change are shown in Fig. 5. The sen-sitivity of annual evapotranspiration change (Fig. 5a) is posi-tive across China, with large sensitivity in the humid regionsincluding the southern basins and parts of the Songhuajiangand Northwest basins. The sensitivity of evapotranspirationchange is small (less than 8 mm change in annual evapotran-spiration associated with 1 m s−1 decline in wind speed) inthe dry regions including large parts of the Northwest, Yel-low River, Hai River and Liao River basins. The sensitiv-ity of annual runoff (Fig. 5b) to wind speed change is neg-ative across China with small sensitivity in the dry regionsand high sensitivity in the humid regions. It is likely becauseactual evapotranspiration is more closely related to precip-itation so wind speed change has little impact on stream-flow in the arid environments (McVicar et al., 2012b). Thesensitivity of the soil moisture index (Fig. 5c) is generally
Hydrol. Earth Syst. Sci., 18, 2803–2813, 2014 www.hydrol-earth-syst-sci.net/18/2803/2014/

X. Liu et al.: Effects of surface wind speed decline on hydrology 2809
Figure 4. Relative change magnitude of the differences in evapotranspiration(a), runoff (b) and soil moisture index(c) between EXP1 andEXP2 in 1966–2011.
Figure 5. The modeled sensitivities of annual evapotranspiration(a), runoff (b) and soil moisture index(c) to wind speed change. Sensitivityis calculated as the change magnitude of the differences of the hydrological variables between EXP1 and EXP2 divided by the changemagnitude of wind speed in 1966–2011.
negative across China, suggesting that wind speed declinewould generally suppress evapotranspiration and leave moremoisture in the soil layer. However, in a small part of theTibetan Plateau, wind speed decline seems to result in the in-crease in ground temperature and might lead to the increase
in evapotranspiration and decrease in soil moisture (Yang etal., 2014).
Figure 6 shows the drought area and the effect ofwind speed decline on the drought area change during thestudy period. The estimated mean drought area is about
www.hydrol-earth-syst-sci.net/18/2803/2014/ Hydrol. Earth Syst. Sci., 18, 2803–2813, 2014
2810 X. Liu et al.: Effects of surface wind speed decline on hydrology
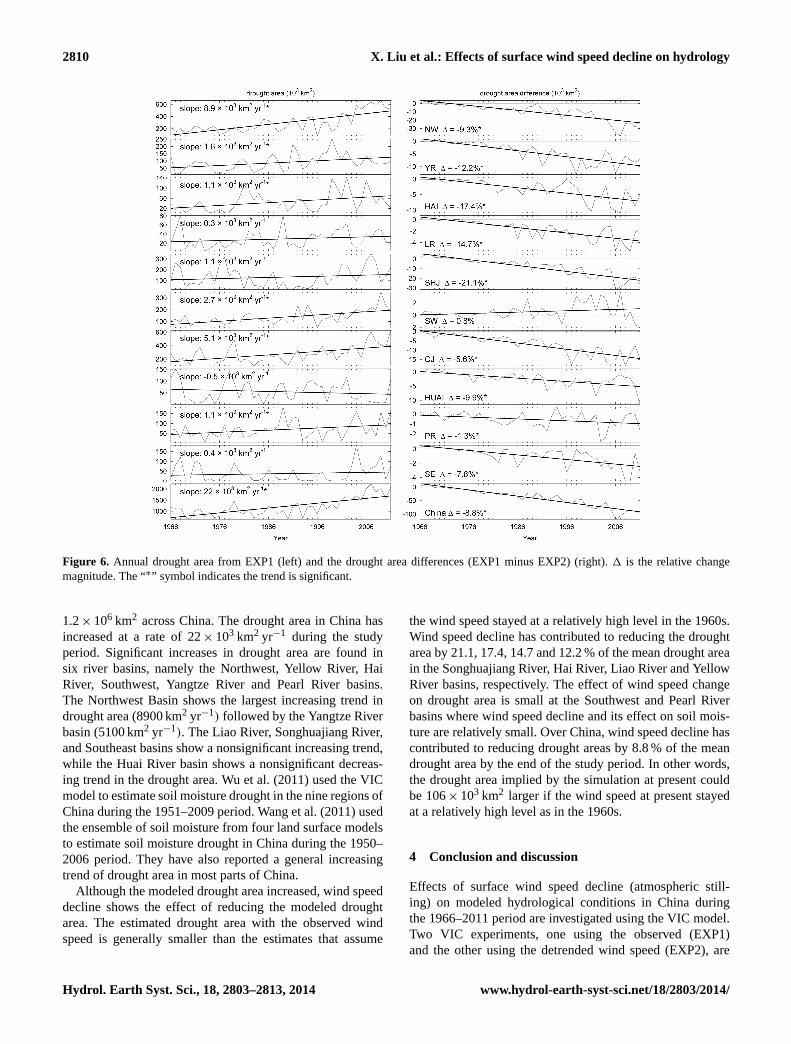
Figure 6. Annual drought area from EXP1 (left) and the drought area differences (EXP1 minus EXP2) (right).1 is the relative changemagnitude. The “∗” symbol indicates the trend is significant.
1.2× 10⁶ km2 across China. The drought area in China hasincreased at a rate of 22× 103 km2 yr−1 during the studyperiod. Significant increases in drought area are found insix river basins, namely the Northwest, Yellow River, HaiRiver, Southwest, Yangtze River and Pearl River basins.The Northwest Basin shows the largest increasing trend indrought area (8900 km2 yr−1) followed by the Yangtze Riverbasin (5100 km2 yr−1). The Liao River, Songhuajiang River,and Southeast basins show a nonsignificant increasing trend,while the Huai River basin shows a nonsignificant decreas-ing trend in the drought area. Wu et al. (2011) used the VICmodel to estimate soil moisture drought in the nine regions ofChina during the 1951–2009 period. Wang et al. (2011) usedthe ensemble of soil moisture from four land surface modelsto estimate soil moisture drought in China during the 1950–2006 period. They have also reported a general increasingtrend of drought area in most parts of China.
Although the modeled drought area increased, wind speeddecline shows the effect of reducing the modeled droughtarea. The estimated drought area with the observed windspeed is generally smaller than the estimates that assume
the wind speed stayed at a relatively high level in the 1960s.Wind speed decline has contributed to reducing the droughtarea by 21.1, 17.4, 14.7 and 12.2 % of the mean drought areain the Songhuajiang River, Hai River, Liao River and YellowRiver basins, respectively. The effect of wind speed changeon drought area is small at the Southwest and Pearl Riverbasins where wind speed decline and its effect on soil mois-ture are relatively small. Over China, wind speed decline hascontributed to reducing drought areas by 8.8 % of the meandrought area by the end of the study period. In other words,the drought area implied by the simulation at present couldbe 106× 103 km2 larger if the wind speed at present stayedat a relatively high level as in the 1960s.
4 Conclusion and discussion
Effects of surface wind speed decline (atmospheric still-ing) on modeled hydrological conditions in China duringthe 1966–2011 period are investigated using the VIC model.Two VIC experiments, one using the observed (EXP1)and the other using the detrended wind speed (EXP2), are
Hydrol. Earth Syst. Sci., 18, 2803–2813, 2014 www.hydrol-earth-syst-sci.net/18/2803/2014/

X. Liu et al.: Effects of surface wind speed decline on hydrology 2811
implemented. The differences in hydrological variables andsoil moisture drought between the two experiments are com-pared to assess the wind speed decline effects. Results showthat wind speed decline has somewhat offset the land surfacedrying trend in China.
Surface wind speed in China has decreased by 29 % ofits mean during the study period. The decline of wind speedhas resulted in a reduction in evapotranspiration and an in-crement in runoff and soil moisture in all the river basins.This suggests that wind speed decline would offset the dry-ing trend and favor a wet condition. The results show thatland surface would be even dryer without wind speed de-cline. The wind speed decline has resulted in an increase inrunoff of 1–6 % of mean annual runoff at most basins. The ef-fect of wind speed on runoff and soil moisture is large in thenorthern basins and relatively smaller in the southern basins.The sensitivity of evapotranspiration change to wind speedchange is positive across China with larger sensitivity in hu-mid areas than dry areas. The sensitivity of runoff change towind speed change is negative, with great sensitivity in hu-mid areas and little sensitivity in dry areas. The sensitivity ofsoil moisture change to wind speed change is situation de-pendent and is generally negative.
The area of soil moisture drought has significantly in-creased in most basins, and has increased at a rate of22× 103 km2 yr−1 in China during the study period. Al-though the drought area has increased rapidly, the increasingrate could be even larger without wind speed decline. Ourresults show that wind speed decline has contributed to re-ducing drought areas by 8.8 % of the mean drought area overChina. Wind speed decline has alleviated the soil moisturedrought over a 106× 103 km2 area comparing with the ex-periments in which wind speed is assumed to be at the highcondition in the 1960s. The effect of wind speed decline onsoil moisture drought is large in most basins in China exceptfor the Southwest and Pearl River basins.
The assessment presented here is based on the observa-tions at the meteorological stations and the simulations of theVIC model. The results in western China (e.g., the Southwestand Northwest basins) may have large uncertainty becauseof the sparse stations. The wind speed observations may beaffected by the local environments. There are a few suspi-cious stations showing opposite change direction of windspeed from all neighboring stations. The interpolated windspeed data are imperfect with these suspicious stations. Fur-thermore, the parameterization of land surface processes inthe model may affect the results and the assessment mightbe model dependent. Decline in surface wind speed may beaccompanied with changes in cloud, radiation, and other me-teorological parameters due to the complex interactions inthe climate system. The coupled changes and their effects onhydrological conditions are not considered in this paper. Inspite of these deficiencies, the model-based assessment canprovide useful information concerning the effects of windspeed decline on the hydrological conditions in China. The
signs of the modeled sensitivities of evapotranspiration andrunoff agree well with the observations reported in the pre-vious studies and are expected according to the evapotran-spiration theory (McVicar et al., 2012a). The modeled evap-otranspiration and runoff sensitivities are greater in humidareas than dry areas, which is also in line with the previousfindings (McVicar et al., 2012b).
Acknowledgements.This work was supported by the NationalBasic Research Program of China (Grant no. 2012CB955403), theNational Sciences Foundation of China Project (no. 41201201 and41171031), and Hundred Talents Program of the Chinese Academyof Sciences.
Edited by: S. Seneviratne
References
Andreadis, K. M., Clark, E. A., Wood, A. W., Hamlet, A. F., andLettenmaier, D. P.: Twentieth-century drought in the contermi-nous United States, J. Hydrometeorol., 6, 985–1001, 2005.
Bohn, T. J., Livneh, B., Oyler, J. W., Running, S. W., Ni-jssen, B., and Lettenmaier, D. P.: Global evaluation ofMTCLIM and related algorithms for forcing of ecologicaland hydrological models, Agric. For. Meteorol., 176, 38–49,doi:10.1016/j.agrformet.2013.03.003, 2013.
Cao, L., and Yan, Z.: Progress in research on homogeniza-tion of climate data, Adv. Climate Change Res., 3, 59–67,doi:10.3724/SP.J.1248.2012.00059, 2012.
Chen, L., Li, D., and Pryor, S. C.: Wind speed trends over China:quantifying the magnitude and assessing causality, Int. J. Clima-tol., 33, 2579–2590, doi:10.1002/joc.3613, 2013.
Chen, Y., Yang, K., He, J., Qin, J., Shi, J., Du, J., andHe, Q.: Improving land surface temperature modeling fordry land of China, J Geophys Res: Atmos, 116, D20104,doi:10.1029/2011JD015921, 2011.
Dai, A., Trenberth, K.E. and Qian, T.: A global dataset of PalmerDrought Severity Index for 1870–2002: Relationship with soilMoisture and effects of surface warming, J. Hydrometeor, 5,1117–1130, doi:10.1175/JHM-386.1, 2004.
Dai, A.: Drought under global warming: a review. Wi-ley Interdisciplinary Reviews: Climate Change, 2, 45–65,doi:10.1002/wcc.81, 2011.
Fu, G., Yu, J., Zhang, Y., Hu, S., Ouyang, R., and Liu, W.: Tem-poral variation of wind speed in China for 1961–2007, Theor.Appl. Climatol., 104, 313-3-24, doi:10.1007/s00704-010-0348-x, 2011.
Gao, H., Tang, Q., Shi, X., Zhu, C., Bohn, T. J., Su, F., Sheffield,J., Pan, M., Lettenmaier, D. P., and Wood, E. F.: Water budgetrecord from Variable Infiltration Capacity (VIC) model, in: Al-gorithm Theoretical Basis Document for Terrestrial Water CycleData Records (in review), 2010.
Guo, H., Xu, M. and Hu, Q.: Changes in near-surface windspeed in China: 1969–2005, Int. J. Climatol., 31, 349–358,doi:10.1002/joc.2091, 2011.
www.hydrol-earth-syst-sci.net/18/2803/2014/ Hydrol. Earth Syst. Sci., 18, 2803–2813, 2014

2812 X. Liu et al.: Effects of surface wind speed decline on hydrology
Jiang, Y., Luo, Y., Zhao, Z. and Tao, S.: Changes in wind speed overChina during 1956–2004, Theor. Appl. Climatol., 99, 421–430,doi:10.1007/s00704-009-0152-7, 2010.
Kimball, J. S., Running, S. W., and Nemani, R.: An im-proved method for estimating surface humidity from dailyminimum temperature, Agric. For. Meteorol., 85, 87–98,doi:10.1016/S0168-1923(96)02366-0, 1997.
Li, M. and Ma, Z.: Soil moisture-based study of the variability ofdry-wet climate and climate zones in China, Chin. Sci. Bull., 58,531–544, doi:10.1007/s11434-012-5428-0, 2012.
Liang, X., Lettenmaier, D. P., Wood, E. F., and Burges, S. J.: Asimple hydrologically based model of land surface water and en-ergy fluxes for general circulation models, J. Geophys. Res., 99,14415–14428, doi:10.1029/94jd00483, 1994.
Lin, C., Yang, K., Qin, J., and Fu, R.: Observed coherent trendsof surface and upper-air wind speed over China since 1960, J.Climate, 26, 2891–2903, doi:10.1175/jcli-d-12-00093.1, 2013.
Liu, X., Luo, Y., Zhang, D., Zhang, M. and Liu, C.: Recent changesin pan-evaporation dynamics in China, Geophys. Res. Lett., 38,L13404, doi:10.1029/2011GL047929, 2011.
Luo, W., Taylor, M. C., and Parker, S. R.: A comparison of spa-tial interpolation methods to estimate continuous wind speed sur-faces using irregularly distributed data from England and Wales,Int. J. Climatol., 28, 947–959, doi:10.1002/joc.1583, 2008.
Ma, Z. and Fu, C.: Some evidence of drying trend over north-ern China from 1951 to 2004, Chin. Sci. Bull., 51, 2913–2925,doi:10.1007/s11434-006-2159-0, 2006.
Ma, Z., Wei, H. and Fu, C.: Relationship between regional soilmoisture variation and climatic variability over East China, Acta.Meteorol. Sin., 58, 278–287, 2000. (Chinese)
Maurer, E. P., Wood, A. W., Adam, J. C., Lettenmaier, D. P.,and Nijssen, B.: A Long-Term Hydrologically Based Datasetof Land Surface Fluxes and States for the ConterminousUnited States, J. Climate, 15, 3237–3251, doi:10.1175/1520-0442(2002)015<3237:ALTHBD>2.0.CO;2, 2002.
McVicar, T. R., Roderick, M. L., Donohue, R. J., Li, L. T.,Van Niel, T. G., Thomas, A., Grieser, J., Jhajharia, D., Himri,Y., Mahowald, N. M., Mescherskaya, A. V., Kruger, A. C.,Rehman, S., and Dinpashoh, Y.: Global review and synthe-sis of trends in observed terrestrial near-surface wind speeds:Implications for evaporation, J. Hydrol., 416–417, 182–205,doi:10.1016/j.jhydrol.2011.10.024, 2012a.
McVicar, T. R., Roderick, M. L., Donohue, R. J., and Van Niel, T.G.: Less bluster ahead? Ecohydrological implications of globaltrends of terrestrial near-surface wind speeds. Ecohydrology, 5,381–388, doi:10.1002/eco.1298, 2012b.
Pryor, S. C., Barthelmie, R. J., Young, D. T., Takle, E. S., Arritt, R.W., Flory, D., Gutowski, W. J., Nunes, A., and Roads, J.: Windspeed trends over the contiguous United States, J. Geophys. Res.-Atmos., 114, D14105, doi:10.1029/2008JD011416, 2009.
Rayner, D. P.: Wind run changes: The dominant ractor affectingpan evaporation trends in Australia, J. Climate, 20, 3379–3394,doi:10.1175/JCLI4181.1, 2007.
Roderick, M. L., Rotstayn, L. D., Farquhar, G. D., and Hobbins,M. T.: On the attribution of changing pan evaporation, Geophys.Res. Lett., 34, L17403, doi:10.1029/2007GL031166, 2007.
Santer, B. D., Wigley, T. M. L., Boyle, J. S., Gaffen, D. J., Hnilo,J. J., Nychka, D., Parker, D. E. and Taylor, K. E.: Statistical sig-nificance of trends and trend differences in layer-average atmo-
spheric temperature time series, J. Geophys. Res.: Atmos., 105,7337–7356, doi:10.1029/1999JD901105, 2000.
Sheffield, J. and Wood, E. F.: Global trends and variability insoil moisture and drought characteristics, 1950-2000, fromobservation-driven simulations of the terrestrial hydrologic cy-cle, J. Climate, 21, 432–458, doi:10.1175/2007jcli1822.1, 2008.
Sheffield, J., Livneh, B., and Wood E. F.: Representation of terres-trial hydrology and large scale drought of the Continental U.S.from the North American Regional Reanalysis, J. Hydrometeor.,13, 856–876, doi:10.1175/JHM-D-11-065.1, 2012a.
Sheffield, J., Wood, E. F., and Roderick, M. L.: Little change inglobal drought over the past 60 years, Nature, 491, 435–438,doi:10.1038/nature11575, 2012b.
Shepard, D. S.: Computer mapping: the SYMAP interpolation al-gorithm, in: Spatial Statistics and Models, edited by: Gaile, G. L.and Willmott, C. J., Dordrecht, Netherlands: D. Reidel Publish-ing Company, 133–145, 1984.
Shi, X., Wood, A. W., and Lettenmaier, D. P.: How Es-sential is Hydrologic Model Calibration to SeasonalStreamflow Forecasting?, J. Hydrometeor., 9, 1350–1363,doi:10.1175/2008JHM1001.1, 2008.
Shuttleworth, W. J.: Evaporation. In Handbook of Hydrology, Maid-ment D. R. (ed.), McGraw-Hill: New York, USA, 1993.
Tang, B., Tong, L., Kang, S., and Zhang, L.: Impacts of climatevariability on reference evapotranspiration over 58 years in theHaihe river basin of north China, Agri. Wat. Manage., 98, 1660–1670, doi:10.1016/j.agwat.2011.06.006, 2011.
Tang, Q. and Lettenmaier, D. P.: Use of satellite snow-cover data for streamflow prediction in the Feather RiverBasin, California, Int. J. Remote Sens., 31, 3745–3762,doi:10.1080/01431161.2010.483493, 2010.
Tang, Q., Oki, T., Kanae, S., and Hu, H.: A spatial analysis of hydro-climatic and vegetation condition trends in the Yellow Riverbasin, Hydrol. Processes, 22, 451–458, doi:10.1002/Hyp.6624,2008a.
Tang, Q., Oki, T., Kanae, S., and Hu, H.: Hydrological cy-cles change in the Yellow River Basin during the lasthalf of the twentieth century, J. Climate, 21, 1790–1806,doi:10.1175/2007JCLI1854.1, 2008b.
Tang, Q., Wood, A.W., and Lettenmaier, D. P.: Real-time precipita-tion estimation based on index station percentiles, J. Hydrome-teor., 10, 266-277, doi:10.1175/2008jhm1017.1, 2009.
Tang, Q., Vivoni, E. R., Munoz-Arriola, F., and Lettenmaier, D.P.: Predictability of evapotranspiration patterns using remotely-sensed vegetation dynamics during the North American mon-soon, J. Hydrometeor., 13, 103–121, doi:10.1175/jhm-d-11-032.1, 2012.
Tang, Y., Tang, Q., Tian, F., Zhang, Z., and Liu, G.: Responsesof natural runoff to recent climatic variations in the YellowRiver basin, China, Hydrol. Earth Syst. Sci., 17, 4471–4480,doi:10.5194/hess-17-4471-2013, 2013.
Thornton, P. E., and Running, S. W.: An improved algorithm forestimating incident daily solar radiation from measurements oftemperature, humidity, and precipitation, Agric. For. Meteorol.,93, 211–228, doi:10.1016/S0168-1923(98)00126-9, 1999.
Vautard, R., Cattiaux, J., Yiou, P., Thepaut, J.-N., and Ciais, P.:Northern Hemisphere atmospheric stilling partly attributed toan increase in surface roughness, Nat. Geosci., 3, 756–761,doi:10.1038/Ngeo979, 2010.
Hydrol. Earth Syst. Sci., 18, 2803–2813, 2014 www.hydrol-earth-syst-sci.net/18/2803/2014/

X. Liu et al.: Effects of surface wind speed decline on hydrology 2813
Wan, H., Wang, X. L. and Swail, V. R.: Homogenization and trendanalysis of Canadian near-surface wind speeds, J. Climate, 23,1209–1225, doi:10.1175/2009JCLI3200.1, 2010.
Wang, A., Lettenmaier, D. P., and Sheffield, J.: Soil moisturedrought in China, 1950–2006, J. Climate, 24, 3257–3271,doi:10.1175/2011JCLI3733.1, 2011.
Wang, G., Zhang, J., Jin, J., Pagano, T., Calow, R., Bao, Z., Liu, C.,Liu, Y., and Yan, X.: Assessing water resources in China usingPRECIS projections and a VIC model, Hydrol. Earth Syst. Sci.,16, 231–240, doi:10.5194/hess-16-231-2012, 2012.
Wu, Z., Lu, G., Wen, L. and Lin, C.: Reconstructing and analyzingChina’s fifty-nine year (1951–2009) drought history using hy-drological model simulation, Hydrol. Earth Syst. Sci., 15, 2881–2894, doi:10.5194/hess-15-2881-2011, 2011.
Xie, Z., Yuan, F., Duan, Q., Zheng, J., Liang, M., and Chen, F.:Regional parameter estimation of the VIC land surface model:methodology and application to river basins in China, J. Hydrom-eteor., 8, 447–468, doi:10.1175/Jhm568.1, 2007.
Xin, X., Yu, R., Zhou, T., and Wang, B.: Drought in late springof South China in recent decades, J. Climate, 19, 3197–3206,doi:10.1175/Jcli3794.1, 2006.
Xu, M., Chang, C.-P., Fu, C., Qi, Y., Robock, A., Robinson,D., and Zhang, H.-m.: Steady decline of east Asian mon-soon winds, 1969–2000: Evidence from direct ground mea-surements of wind speed, J. Geophys. Res., 111, D24111,doi:10.1029/2006JD007337, 2006.
Yang, H. and Yang, D.: Derivation of climate elasticity of runoffto assess the effects of climate change on annual runoff, WaterResour. Res., 47, W07526, doi:10.1029/2010WR009287, 2011.
Yang, K., He, J., Tang, W., Qin, J., and Cheng, C. C.K.: On downward shortwave and longwave radiationsover high altitude regions: Observation and modeling inthe Tibetan Plateau, Agric. For. Meteorol., 150, 38–46,doi:10.1016/j.agrformet.2009.08.004, 2010.
Yang, K., Wu, H., Qin, J., Lin, C., Tang, W., and Chen, Y.: Recentclimate changes over the Tibetan Plateau and their impacts onenergy and water cycle: A review, Global Planet. Change, 112,79–91, doi:10.1016/j.gloplacha.2013.12.001, 2014.
Yapo, P. O., Gupta, H. V., and Sorooshian, S.: Multi-objectiveglobal optimization for hydrologic models, J. Hydrol., 204, 83–97, doi:10.1016/S0022-1694(97)00107-8, 1998.
Zhang, X. and Tang Q.: Development of a long term hydrologically-based dataset of land surface fluxes and states for China, AGUFall Meeting, GC11A-0974, 2013.
Zhang, X.-J., Tang, Q., Pan, M., and Tang, Y.: A long-term land sur-face hydrologic fluxes and states dataset for China. J. Hydrome-teor., in press, doi:10.1175/JHM-D-13-0170.1, 2014.
Zheng, H., Liu, X., Liu, C., Dai, X., and Zhu, R.: As-sessing contributions to panevaporation trends in HaiheRiver Basin, China, J. Geophys. Res.-Atmos., 114, D24105,doi:10.1029/2009JD012203, 2009.
Zou, X., Zhai, P., and Zhang, Q.: Variations in droughtsover China: 1951-2003, Geophys. Res. Lett., 32, L04707,doi:10.1029/2004gl021853, 2005.
www.hydrol-earth-syst-sci.net/18/2803/2014/ Hydrol. Earth Syst. Sci., 18, 2803–2813, 2014