effects of technology immersion on teaching and learning ... · evidence from observations of...
TRANSCRIPT
Effects of Technology Immersion on Teaching and Learning:
Evidence from Observations of Sixth-Grade Classrooms
Texas Center for Educational Research Austin, Texas www.tcer.org
Kelly S. Shapley, Ph.D. Daniel Sheehan, Ed.D. Keith Sturges, M.A.A.
Fanny Caranikas-Walker, Ph.D. Briana Huntsberger, M.P.Aff.
Catherine Maloney, Ph.D.
June 2006
©Texas Center for Educational Research

1
Effects of Technology Immersion on Teaching and Learning: Evidence from Observations of Sixth-Grade Classrooms
The Technology Immersion Pilot (TIP) sets forth a vision for technology immersion in Texas public schools that links ubiquitous access to technology with student achievement. The Texas Education Agency (TEA) directed nearly $14 million in federal Title II, Part D monies toward funding a wireless learning environment for high-need middle schools through a competitive grant process. Concurrently, a federally funded research project is scientifically evaluating the effectiveness of technology immersion in increasing middle school students’ achievement in core academic subjects as measured by the Texas Assessment of Knowledge and Skills (TAKS). Technology immersion encompasses multiple components, including a laptop computer for every middle school student and teacher, wireless access throughout the campus, online curricular and assessment resources, professional development and ongoing pedagogical support for curricular integration of technology resources, and technical support to maintain an immersed campus. The evaluation, with 22 experimental and 22 control sites, is also examining the relationships that exist among contextual conditions, technology immersion, intervening factors (school, teacher, and student), and student achievement. Of particular interest are the effects of technology immersion on teachers’ classroom practices and students’ learning opportunities. Accordingly, this report centers on classroom observations conducted in sixth-grade classrooms at immersed and control schools during fall 2004 (prior to immersion) and spring 2005 (during early implementation).
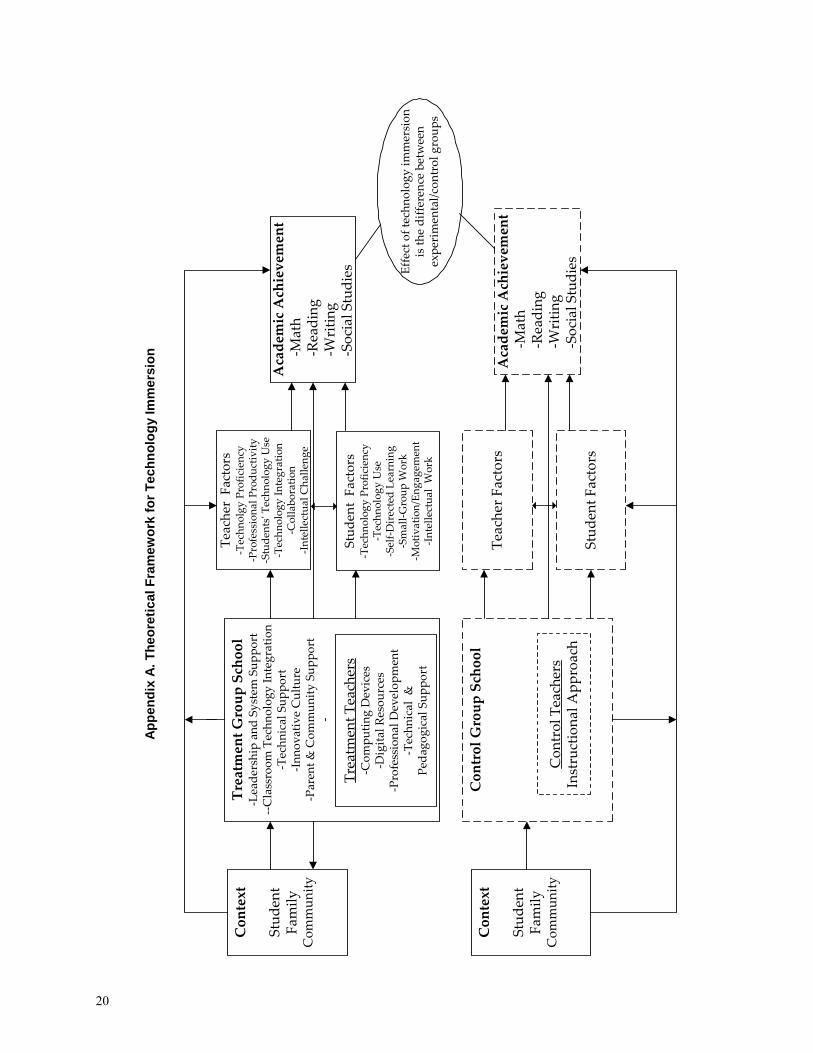
Background The conception of educational technology held by many educators, leaders, and policymakers has shifted in recent years from the use of particular technology applications to technology’s incorporation into every aspect of the educational environment. Changing views reflect our growing understanding of how students learn and how to create technology-infused environments that enhance teaching and learning. Cognitive science and other research reveal that children learn more when they are engaged in meaningful, relevant, and intellectually stimulating work. Moreover, learner- and knowledge-centered environments can help students make connections between their previous knowledge and current academic tasks, allowing students to grasp more complex concepts (Bransford, Brown, & Cocking, 2003; Newmann, Bryk, & Nagoaka, 2001). In the present view of learning, “the use of technology is not an add-on, but an integral part of the students’ quest for knowledge and a tool through which students research, organize, and share information” (Johnston & Cooley, 2001, p. 25). The Theoretical Model of Technology Immersion (see Appendix A) assumes that effective technology use in schools and classrooms requires robust access to technology, technical and pedagogical support for implementation, professional development for educators in using technology effectively, and readily available curricular and assessment resources that support the state’s curriculum in the core subjects (English language arts, mathematics, science, and social studies). An improved school environment for technology should lead to teachers who have students use technology more in their classrooms and in new ways, and use laptops and digital resources to create intellectually challenging lessons. In turn, improved school and classroom conditions should lead students to more opportunities for peer collaboration, greater personal self-direction, more intellectually challenging school work, and stronger engagement in school and learning. Improved learning experiences presumably will contribute to increased academic performance as measured by standardized test scores. As a way to guide our study of classroom effects, we have looked to the emerging research literature on how people learn and how the new science of learning relates to technology-infused classrooms and classrooms in general.
2
The Science of Learning Drawing upon accumulated evidence on human learning, researchers associated with the National Research Council have described three core learning principles: learning with understanding, pre-existing knowledge, and active learning (Bransford et al., 2003). Learning with understanding. Learning with understanding depends on the acquisition of knowledge that is connected and organized around important concepts rather than the memorization of disconnected facts. Although facts are undeniably important for thinking and problem solving, deep understanding of associations, relationships, and rationales transforms factual knowledge into “usable” knowledge that transfers, or can be applied, to other contexts. Thus, movement toward greater expertise requires “both a deepening of the information base and the development of a conceptual framework for the subject matter” (Bransford et al., 2003, p. 17). Teaching practices consistent with learning with understanding will help students to plan, to notice patterns, to generate arguments and explanations, to draw analogies, and to use other higher order thinking processes.
Implication: Teachers must teach some subject matter in depth, providing many examples in which the same concept is at work and providing a firm foundation of factual knowledge (Bransford et al., 2003, p. 20).
Preexisting knowledge. In the new science of learning, “Humans are regarded as goal-directed agents who actively seek information. They come to education with a range of prior knowledge, beliefs, and concepts that significantly influence what they notice about the environment and how they organize and interpret it” (Bransford et al., 2003, p. 10). Because people construct new knowledge based on what they already know, students’ preexisting knowledge provides the starting place for instruction. Teaching practices, thus, must build on or challenge students’ preexisting knowledge.
Implication: Teachers must draw out and work with the preexisting understandings their students bring with them (Bransford et al., 2003, p. 19).
Active learning. Active learning requires individuals to take control of their own learning. For students, this means that they must be helped to recognize when they do or do not understand—that is, they must develop “metacognitive” skills. Metacognition refers to the ability to self-monitor one’s own thinking and understanding (i.e., internal conversation) and to actively employ strategies for learning. Research has demonstrated that children can be taught metacognitive strategies, such as explaining one’s thinking, as a way to deepen understanding.
Implication: The teaching of metacognitive skills should be integrated into the curriculum in a variety of subject areas (Bransford et al., 2003, p. 21).
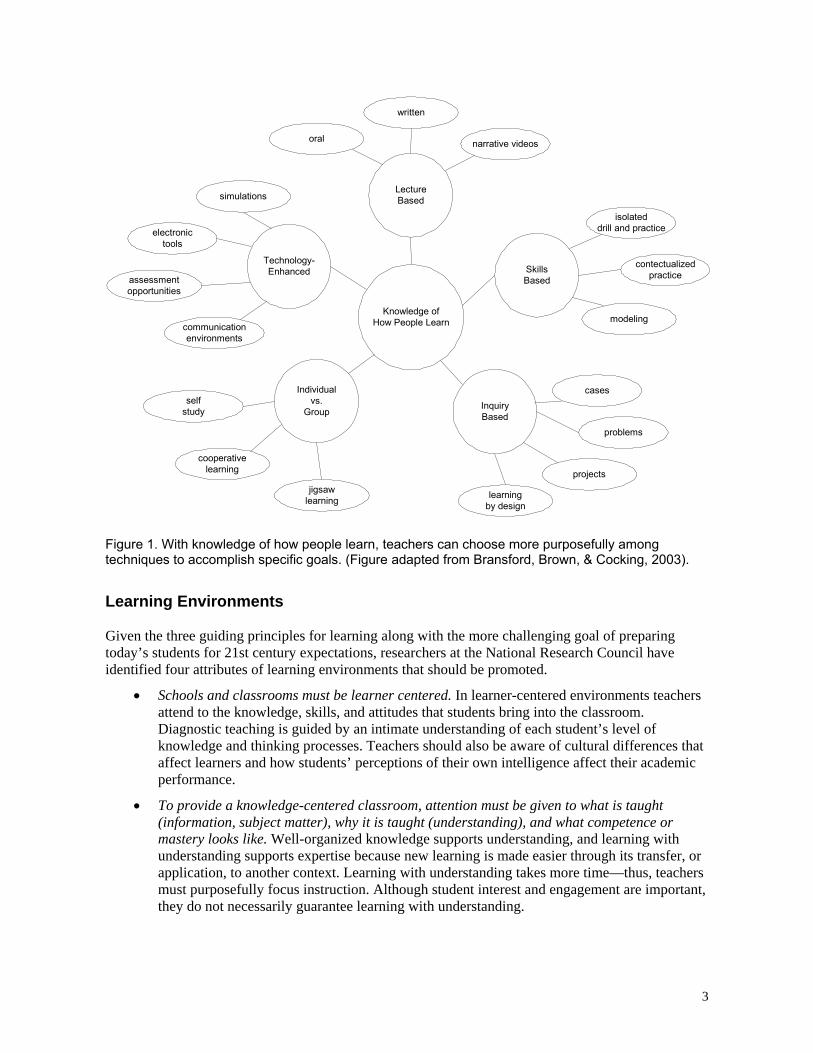
Teaching Strategies Understanding the core principles of learning—learning with understanding, preexisting knowledge, and active learning—helps educators to choose among the many possible teaching strategies. As illustrated in Figure 1, instruction may be technology enhanced, lecture based, skills based, inquiry based, or organized in individual or group arrangements. It is generally accepted that there is no one best teaching practice, but that instead, the selection of the teaching strategy should be purposeful and provide learning opportunities for students consistent with scientific principles of learning (Bransford et al., 2003). In an immersed school, technology provide a powerful way to enrich the “old” ways of learning as well as to provide new possibilities for deepening learning through the use of simulations, electronic tools, assessment opportunities, and communication environments.
3
Knowledge ofHow People Learn
LectureBased
Technology-Enhanced
Individualvs.
GroupInquiryBased
SkillsBased
written
contectualizedpractice
isolateddrill and practice
jigsawlearning
cooperativelearning
assessmentopportunities
electronictools
narrative videosoral
selfstudy
communicationenvironments
simulations
modeling
cases
problems
projects
learningby design
Figure 1. With knowledge of how people learn, teachers can choose more purposefully among techniques to accomplish specific goals. (Figure adapted from Bransford, Brown, & Cocking, 2003).
Learning Environments Given the three guiding principles for learning along with the more challenging goal of preparing today’s students for 21st century expectations, researchers at the National Research Council have identified four attributes of learning environments that should be promoted.
• Schools and classrooms must be learner centered. In learner-centered environments teachers attend to the knowledge, skills, and attitudes that students bring into the classroom. Diagnostic teaching is guided by an intimate understanding of each student’s level of knowledge and thinking processes. Teachers should also be aware of cultural differences that affect learners and how students’ perceptions of their own intelligence affect their academic performance.
• To provide a knowledge-centered classroom, attention must be given to what is taught (information, subject matter), why it is taught (understanding), and what competence or mastery looks like. Well-organized knowledge supports understanding, and learning with understanding supports expertise because new learning is made easier through its transfer, or application, to another context. Learning with understanding takes more time—thus, teachers must purposefully focus instruction. Although student interest and engagement are important, they do not necessarily guarantee learning with understanding.
4
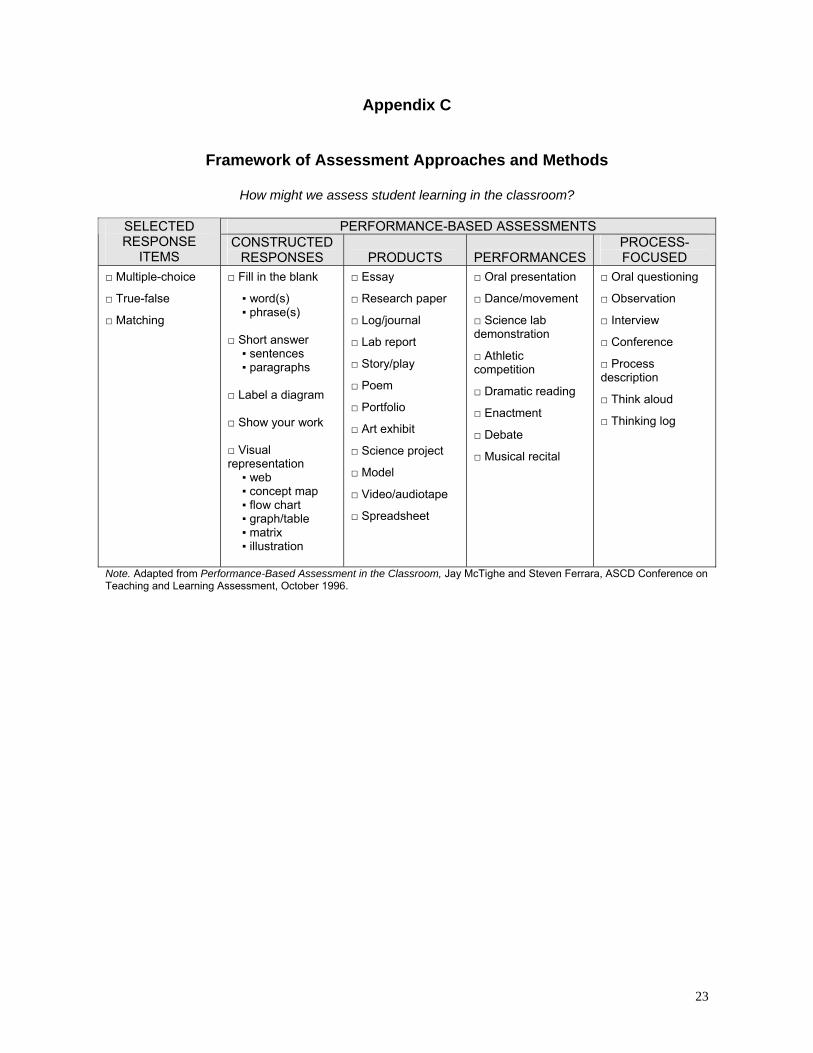
• Formative assessments—ongoing assessments designed to make students’ thinking visible to both teachers and students—are essential. Assessments should allow teachers to identify students’ preconceptions or misconceptions, monitor progress, and help students to revise and improve their thinking. Appendix C provides a Framework of Assessment Approaches and Methods for assessing student learning and contrasts the differences between selected response item assessments (e.g., multiple-choice) and other performance-based assessments that have greater potential for making student thinking visible (i.e., constructed response, products, performances, and process-focused) (McTighe & Ferrara, 1996).
• Learning is influenced in fundamental ways by the context in which it takes place. A community-centered approach requires the development of norms for the classroom and school, as well as connections to the outside world, that support core learning values. Classroom environments should organize students’ work in ways that promote intellectual camaraderie and positive attitudes toward learning. Students help each other by building upon each other’s knowledge, asking questions to clarify, and suggesting new avenues toward goals. Teachers should also establish a community of learners that generates new ideas and excitement for teaching and learning. Linking the classroom to other aspects of students’ lives is also important (Bransford et al., 2003).
Technology that Supports Learning What we know about learning also provides important guidance for the uses of technology to support student learning and academic achievement. While technology has extraordinary potential for creating rich learning environments, having ubiquitous access to laptops does not guarantee effective learning. In fact, inappropriate uses of technology may actually hinder learning. For example, if students spend their time aimlessly surfing the Internet rather than purposefully conducting a well-structured search with clear learning goals, or students spend their time selecting font sizes and colors rather than using their word processor for the expression of their ideas on an assigned topic, technology’s promise may not be realized. On the other hand, the interactivity of new technologies provides exceptional opportunities for students to learning by doing, visualize difficult-to-understand concepts, access a wide array of information, analyze data, develop authentic products, and so forth. Research gathered by members of the National Research Council has provided guidance for the kinds of technology uses that align with the principles of learning and have demonstrated potential for advancing student learning and achievement.
• Bring Real-World Problems into the Classroom. Laptops provide a way to bring video-based problems and computer simulations into the classroom. For example,
o Interactive problem solving (e.g., Jasper Woodbury Problem Solving Series, Gizmos—Explore Learning), and
o Connecting with practicing professionals (e.g., Project GLOBE environmental research).
• Scaffolds and Tools. Laptops offer a variety of productivity tools that can scaffold student thinking and support deeper conceptual understanding. For example,
o Calculators, spreadsheets, graphing programs; o Modeling programs for creating and testing models of complex phenomena; o Programs supporting the writing process or creative writing (e.g., My Access
Writing); o Programs modeling semantic relationships (e.g, Inspiration); o Probes for measuring and graphing variables; and
5
o Virtual experiments (e.g., ThinkerTools in Physics).
• Feedback, Reflection, and Revision. Laptops make it easier for students to receive feedback about their thinking. For example,
o Technology-supported conversation (e.g., teacher-to-student e-mail), o Articulation of thinking processes (e.g., Journals, Thinking Logs), o Cognitive tutors (e.g., Algebra, Geometry), and o Word processor (e.g., spelling and grammar checker, thesaurus).
• Connecting Classrooms to Community. Laptops can connect teachers and students to the broader community. For example,
o School and classroom websites with calendars, information, assignments, etc.; o Homework assignments; o Parent and student e-mail; and o School-to-school communication (e-mail, discussion boards, videoconferencing).
• Teacher Learning. Laptops offer new insights into the teacher’s role in promoting learning. For example, laptops in the classroom
o Soften the barrier between what teachers and students do, o Spontaneously transfer the teaching role from teacher to student during efforts to use
technology, o Redefine social authority and personal responsibility, and o Expand teacher opportunities for professional growth (Bransford et al., 2003).
Observations of Teaching and Learning
Considering the new science of learning, the main benefit of technology immersion may be found in the opportunities available for more complex modes of teaching and learning. Technology affords educators and students access to real-life problems or high-quality simulations of them. Technology also allows teachers to model learning strategies and allows individual learners to approach tasks in different ways using different strategies (Goldman, Cole, & Syer, 1999; Many, Fyfe, Lewis, & Mitchell, 1996; Sulla, 1999). At its best, technology can facilitate deep exploration and integration of information, high-level thinking, and profound engagement by allowing students to design, explore, experiment, access information, and model complex phenomena,” note Goldman, Cole, and Syer (1999). Additionally, technology enables students to have increased access to and use of a wide range of information, allowing for greater inquiry and investigation, exposure to places and resources beyond the classroom, and development of a stronger knowledge base (CEO Forum, 2001; Johnston & Cooley, 2001). These new circumstances and opportunities—not the technology on its own—can have a direct and meaningful impact on student achievement. Classroom observations in this study are a mechanism for investigating how laptops are used to support student learning and the consistency of observed practices with research-based learning principles. In developing the OTL form, we reviewed the research literature to identify instruments measuring the scientific principles of learning. Accordingly, our study builds on research conducted by Newmann and colleagues that links authentic instruction and assignments with student achievement (Newmann, 1996; Newmann, Bryk, & Nagoaka, 2001). Newmann, Secada, and Wehlage (1995) define authentic human achievement through three criteria: construction of knowledge, disciplined inquiry, and value beyond school. These criteria form the foundation for standards to assess the intellectual quality of teaching and learning. The four related standards for classroom instruction
6
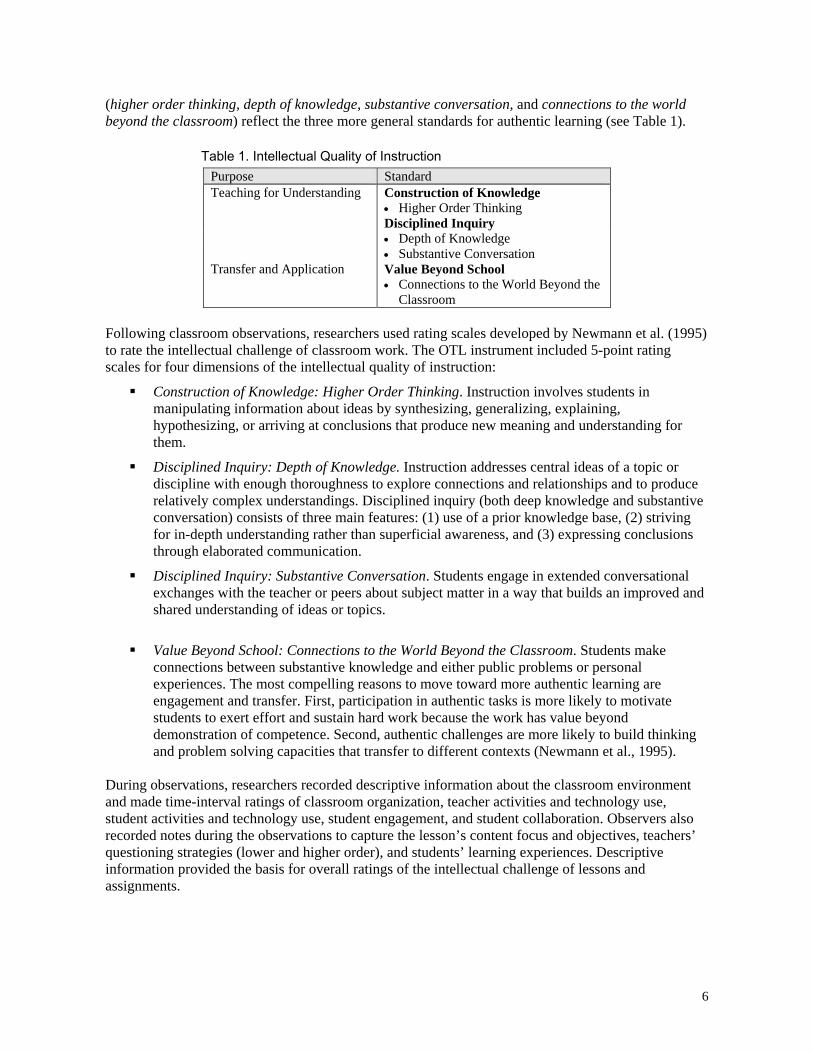
(higher order thinking, depth of knowledge, substantive conversation, and connections to the world beyond the classroom) reflect the three more general standards for authentic learning (see Table 1).
Table 1. Intellectual Quality of Instruction Purpose Standard Teaching for Understanding Construction of Knowledge • Higher Order Thinking Disciplined Inquiry • Depth of Knowledge • Substantive Conversation Transfer and Application Value Beyond School • Connections to the World Beyond the
Classroom Following classroom observations, researchers used rating scales developed by Newmann et al. (1995) to rate the intellectual challenge of classroom work. The OTL instrument included 5-point rating scales for four dimensions of the intellectual quality of instruction:
Construction of Knowledge: Higher Order Thinking. Instruction involves students in manipulating information about ideas by synthesizing, generalizing, explaining, hypothesizing, or arriving at conclusions that produce new meaning and understanding for them.
Disciplined Inquiry: Depth of Knowledge. Instruction addresses central ideas of a topic or discipline with enough thoroughness to explore connections and relationships and to produce relatively complex understandings. Disciplined inquiry (both deep knowledge and substantive conversation) consists of three main features: (1) use of a prior knowledge base, (2) striving for in-depth understanding rather than superficial awareness, and (3) expressing conclusions through elaborated communication.
Disciplined Inquiry: Substantive Conversation. Students engage in extended conversational exchanges with the teacher or peers about subject matter in a way that builds an improved and shared understanding of ideas or topics.
Value Beyond School: Connections to the World Beyond the Classroom. Students make connections between substantive knowledge and either public problems or personal experiences. The most compelling reasons to move toward more authentic learning are engagement and transfer. First, participation in authentic tasks is more likely to motivate students to exert effort and sustain hard work because the work has value beyond demonstration of competence. Second, authentic challenges are more likely to build thinking and problem solving capacities that transfer to different contexts (Newmann et al., 1995).
During observations, researchers recorded descriptive information about the classroom environment and made time-interval ratings of classroom organization, teacher activities and technology use, student activities and technology use, student engagement, and student collaboration. Observers also recorded notes during the observations to capture the lesson’s content focus and objectives, teachers’ questioning strategies (lower and higher order), and students’ learning experiences. Descriptive information provided the basis for overall ratings of the intellectual challenge of lessons and assignments.
7
Methodology
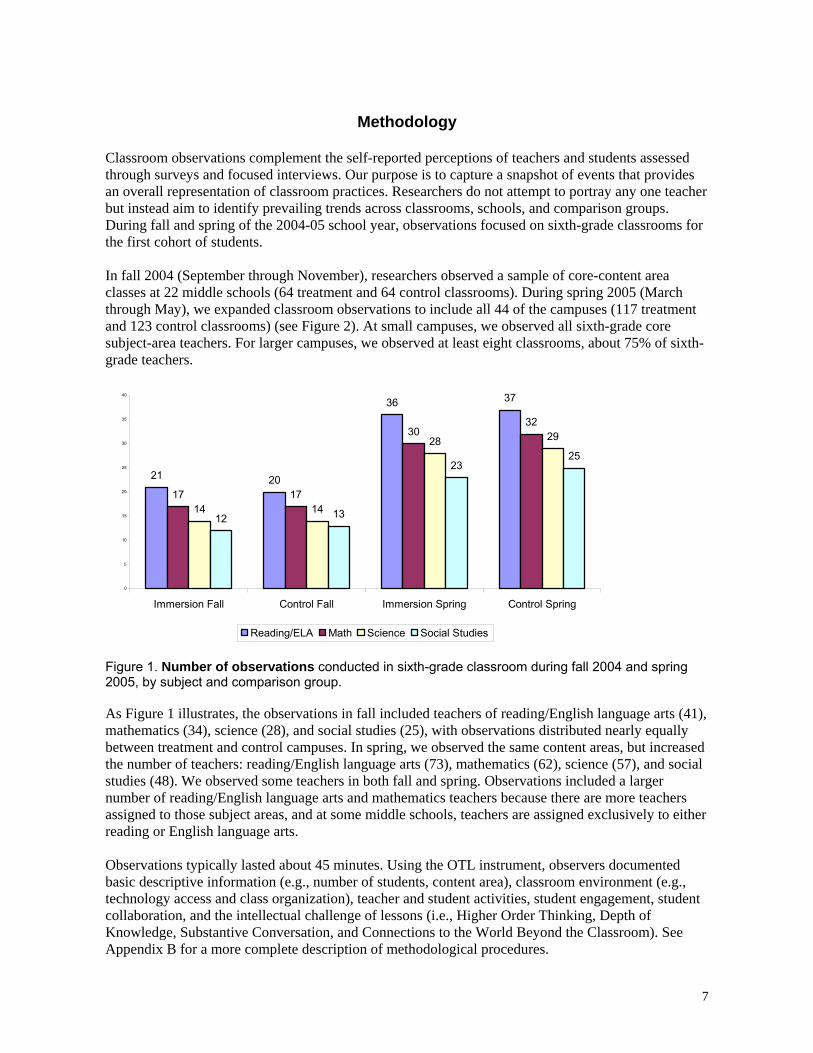
Classroom observations complement the self-reported perceptions of teachers and students assessed through surveys and focused interviews. Our purpose is to capture a snapshot of events that provides an overall representation of classroom practices. Researchers do not attempt to portray any one teacher but instead aim to identify prevailing trends across classrooms, schools, and comparison groups. During fall and spring of the 2004-05 school year, observations focused on sixth-grade classrooms for the first cohort of students. In fall 2004 (September through November), researchers observed a sample of core-content area classes at 22 middle schools (64 treatment and 64 control classrooms). During spring 2005 (March through May), we expanded classroom observations to include all 44 of the campuses (117 treatment and 123 control classrooms) (see Figure 2). At small campuses, we observed all sixth-grade core subject-area teachers. For larger campuses, we observed at least eight classrooms, about 75% of sixth-grade teachers.
21 20
36 37
17 17
3032
14 14
28 29
12 13
2325
0
5
10
15
20
25
30
35
40
Immersion Fall Control Fall Immersion Spring Control Spring
Reading/ELA Math Science Social Studies
Figure 1. Number of observations conducted in sixth-grade classroom during fall 2004 and spring 2005, by subject and comparison group. As Figure 1 illustrates, the observations in fall included teachers of reading/English language arts (41), mathematics (34), science (28), and social studies (25), with observations distributed nearly equally between treatment and control campuses. In spring, we observed the same content areas, but increased the number of teachers: reading/English language arts (73), mathematics (62), science (57), and social studies (48). We observed some teachers in both fall and spring. Observations included a larger number of reading/English language arts and mathematics teachers because there are more teachers assigned to those subject areas, and at some middle schools, teachers are assigned exclusively to either reading or English language arts. Observations typically lasted about 45 minutes. Using the OTL instrument, observers documented basic descriptive information (e.g., number of students, content area), classroom environment (e.g., technology access and class organization), teacher and student activities, student engagement, student collaboration, and the intellectual challenge of lessons (i.e., Higher Order Thinking, Depth of Knowledge, Substantive Conversation, and Connections to the World Beyond the Classroom). See Appendix B for a more complete description of methodological procedures.
8
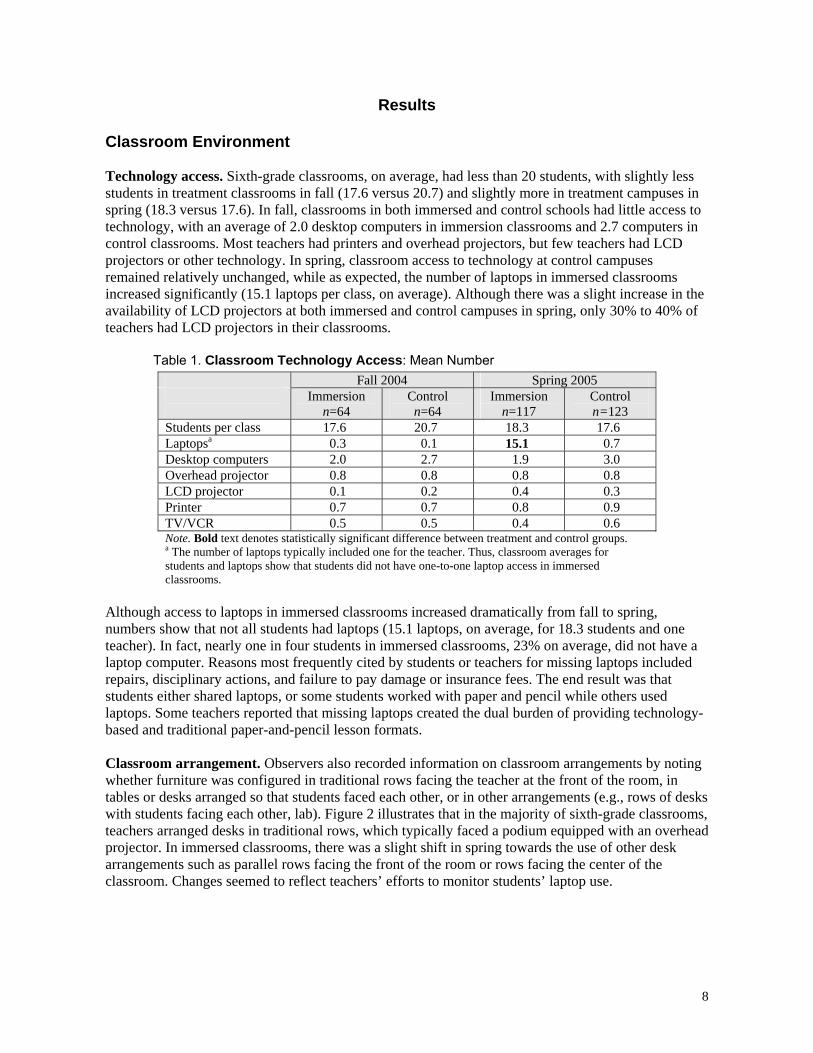
Results Classroom Environment Technology access. Sixth-grade classrooms, on average, had less than 20 students, with slightly less students in treatment classrooms in fall (17.6 versus 20.7) and slightly more in treatment campuses in spring (18.3 versus 17.6). In fall, classrooms in both immersed and control schools had little access to technology, with an average of 2.0 desktop computers in immersion classrooms and 2.7 computers in control classrooms. Most teachers had printers and overhead projectors, but few teachers had LCD projectors or other technology. In spring, classroom access to technology at control campuses remained relatively unchanged, while as expected, the number of laptops in immersed classrooms increased significantly (15.1 laptops per class, on average). Although there was a slight increase in the availability of LCD projectors at both immersed and control campuses in spring, only 30% to 40% of teachers had LCD projectors in their classrooms.
Table 1. Classroom Technology Access: Mean Number Fall 2004 Spring 2005
Immersion n=64
Control n=64
Immersion n=117
Control n=123
Students per class 17.6 20.7 18.3 17.6 Laptopsa 0.3 0.1 15.1 0.7 Desktop computers 2.0 2.7 1.9 3.0 Overhead projector 0.8 0.8 0.8 0.8 LCD projector 0.1 0.2 0.4 0.3 Printer 0.7 0.7 0.8 0.9 TV/VCR 0.5 0.5 0.4 0.6 Note. Bold text denotes statistically significant difference between treatment and control groups. a The number of laptops typically included one for the teacher. Thus, classroom averages for students and laptops show that students did not have one-to-one laptop access in immersed classrooms.
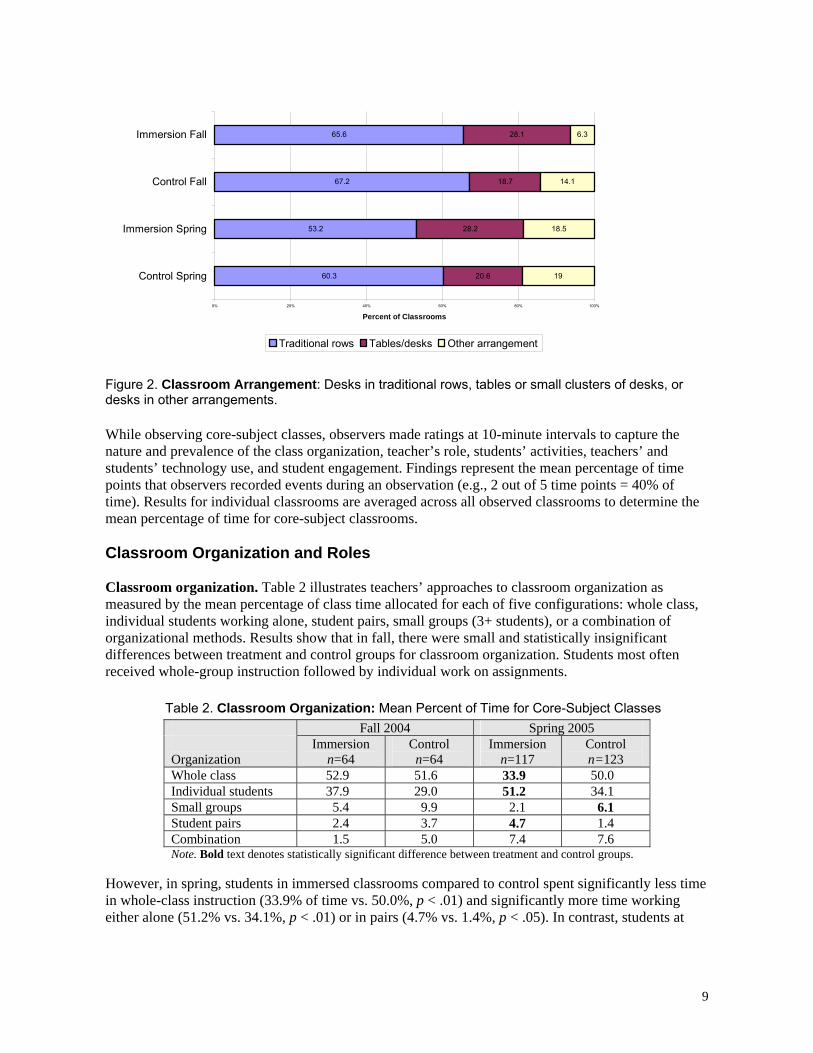
Although access to laptops in immersed classrooms increased dramatically from fall to spring, numbers show that not all students had laptops (15.1 laptops, on average, for 18.3 students and one teacher). In fact, nearly one in four students in immersed classrooms, 23% on average, did not have a laptop computer. Reasons most frequently cited by students or teachers for missing laptops included repairs, disciplinary actions, and failure to pay damage or insurance fees. The end result was that students either shared laptops, or some students worked with paper and pencil while others used laptops. Some teachers reported that missing laptops created the dual burden of providing technology-based and traditional paper-and-pencil lesson formats. Classroom arrangement. Observers also recorded information on classroom arrangements by noting whether furniture was configured in traditional rows facing the teacher at the front of the room, in tables or desks arranged so that students faced each other, or in other arrangements (e.g., rows of desks with students facing each other, lab). Figure 2 illustrates that in the majority of sixth-grade classrooms, teachers arranged desks in traditional rows, which typically faced a podium equipped with an overhead projector. In immersed classrooms, there was a slight shift in spring towards the use of other desk arrangements such as parallel rows facing the front of the room or rows facing the center of the classroom. Changes seemed to reflect teachers’ efforts to monitor students’ laptop use.
9
60.3
53.2
67.2
65.6
20.6
28.2
18.7
28.1
19
18.5
14.1
6.3
0% 20% 40% 60% 80% 100%
Control Spring
Immersion Spring
Control Fall
Immersion Fall
Percent of Classrooms
Traditional rows Tables/desks Other arrangement
Figure 2. Classroom Arrangement: Desks in traditional rows, tables or small clusters of desks, or desks in other arrangements. While observing core-subject classes, observers made ratings at 10-minute intervals to capture the nature and prevalence of the class organization, teacher’s role, students’ activities, teachers’ and students’ technology use, and student engagement. Findings represent the mean percentage of time points that observers recorded events during an observation (e.g., 2 out of 5 time points = 40% of time). Results for individual classrooms are averaged across all observed classrooms to determine the mean percentage of time for core-subject classrooms. Classroom Organization and Roles Classroom organization. Table 2 illustrates teachers’ approaches to classroom organization as measured by the mean percentage of class time allocated for each of five configurations: whole class, individual students working alone, student pairs, small groups (3+ students), or a combination of organizational methods. Results show that in fall, there were small and statistically insignificant differences between treatment and control groups for classroom organization. Students most often received whole-group instruction followed by individual work on assignments.
Table 2. Classroom Organization: Mean Percent of Time for Core-Subject Classes Fall 2004 Spring 2005 Organization
Immersion n=64
Control n=64
Immersion n=117
Control n=123
Whole class 52.9 51.6 33.9 50.0 Individual students 37.9 29.0 51.2 34.1 Small groups 5.4 9.9 2.1 6.1 Student pairs 2.4 3.7 4.7 1.4 Combination 1.5 5.0 7.4 7.6 Note. Bold text denotes statistically significant difference between treatment and control groups.
However, in spring, students in immersed classrooms compared to control spent significantly less time in whole-class instruction (33.9% of time vs. 50.0%, p < .01) and significantly more time working either alone (51.2% vs. 34.1%, p < .01) or in pairs (4.7% vs. 1.4%, p < .05). In contrast, students at
10
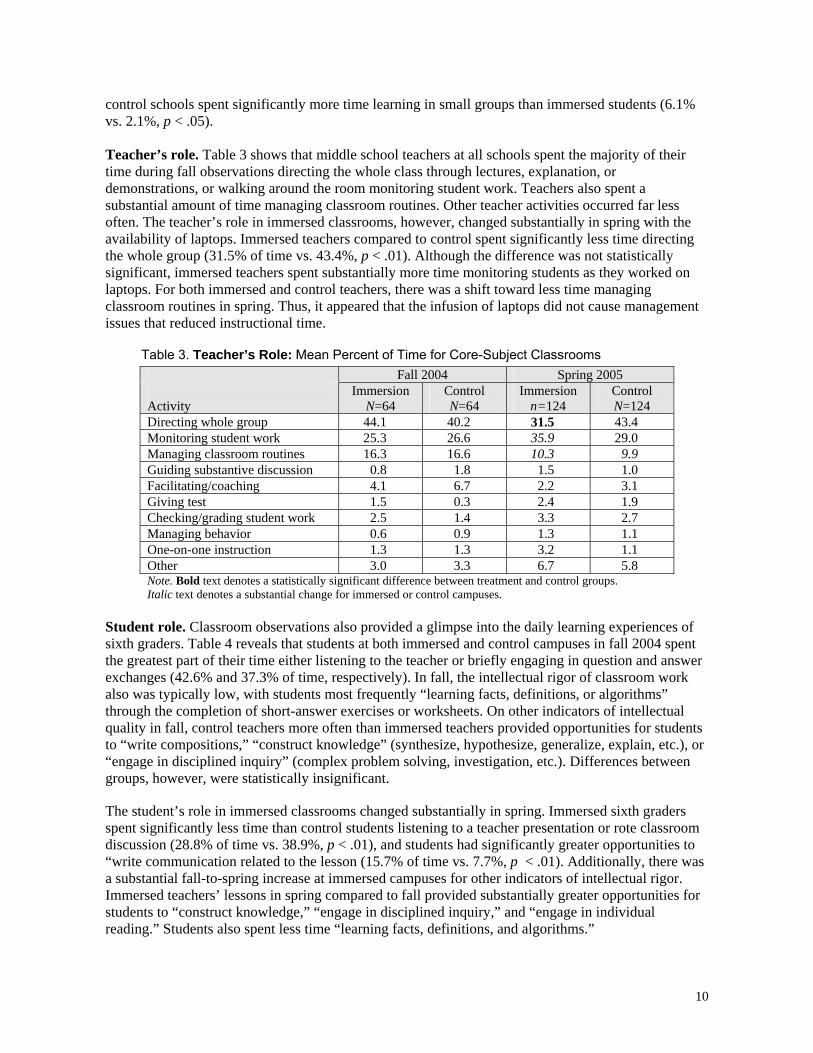
control schools spent significantly more time learning in small groups than immersed students (6.1% vs. 2.1%, p < .05). Teacher’s role. Table 3 shows that middle school teachers at all schools spent the majority of their time during fall observations directing the whole class through lectures, explanation, or demonstrations, or walking around the room monitoring student work. Teachers also spent a substantial amount of time managing classroom routines. Other teacher activities occurred far less often. The teacher’s role in immersed classrooms, however, changed substantially in spring with the availability of laptops. Immersed teachers compared to control spent significantly less time directing the whole group (31.5% of time vs. 43.4%, p < .01). Although the difference was not statistically significant, immersed teachers spent substantially more time monitoring students as they worked on laptops. For both immersed and control teachers, there was a shift toward less time managing classroom routines in spring. Thus, it appeared that the infusion of laptops did not cause management issues that reduced instructional time.
Table 3. Teacher’s Role: Mean Percent of Time for Core-Subject Classrooms Fall 2004 Spring 2005 Activity
Immersion N=64
Control N=64
Immersion n=124
Control N=124
Directing whole group 44.1 40.2 31.5 43.4 Monitoring student work 25.3 26.6 35.9 29.0 Managing classroom routines 16.3 16.6 10.3 9.9 Guiding substantive discussion 0.8 1.8 1.5 1.0 Facilitating/coaching 4.1 6.7 2.2 3.1 Giving test 1.5 0.3 2.4 1.9 Checking/grading student work 2.5 1.4 3.3 2.7 Managing behavior 0.6 0.9 1.3 1.1 One-on-one instruction 1.3 1.3 3.2 1.1 Other 3.0 3.3 6.7 5.8 Note. Bold text denotes a statistically significant difference between treatment and control groups. Italic text denotes a substantial change for immersed or control campuses.
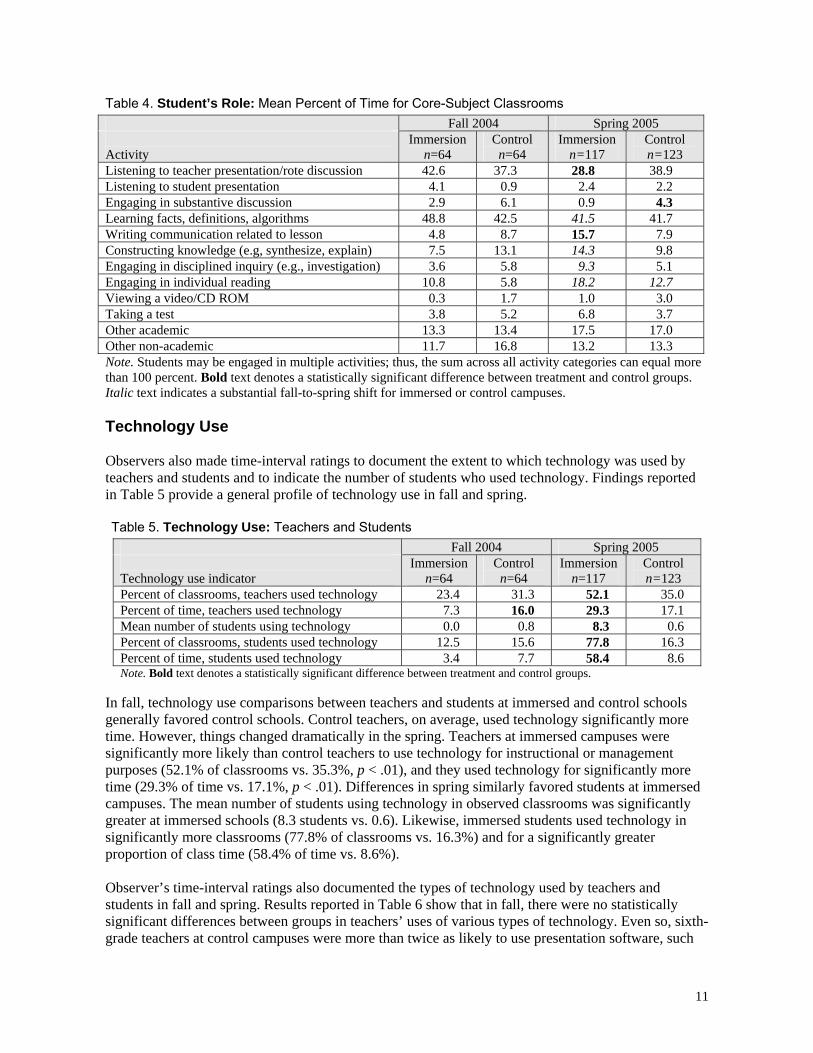
Student role. Classroom observations also provided a glimpse into the daily learning experiences of sixth graders. Table 4 reveals that students at both immersed and control campuses in fall 2004 spent the greatest part of their time either listening to the teacher or briefly engaging in question and answer exchanges (42.6% and 37.3% of time, respectively). In fall, the intellectual rigor of classroom work also was typically low, with students most frequently “learning facts, definitions, or algorithms” through the completion of short-answer exercises or worksheets. On other indicators of intellectual quality in fall, control teachers more often than immersed teachers provided opportunities for students to “write compositions,” “construct knowledge” (synthesize, hypothesize, generalize, explain, etc.), or “engage in disciplined inquiry” (complex problem solving, investigation, etc.). Differences between groups, however, were statistically insignificant.
The student’s role in immersed classrooms changed substantially in spring. Immersed sixth graders spent significantly less time than control students listening to a teacher presentation or rote classroom discussion (28.8% of time vs. 38.9%, p < .01), and students had significantly greater opportunities to “write communication related to the lesson (15.7% of time vs. 7.7%, p < .01). Additionally, there was a substantial fall-to-spring increase at immersed campuses for other indicators of intellectual rigor. Immersed teachers’ lessons in spring compared to fall provided substantially greater opportunities for students to “construct knowledge,” “engage in disciplined inquiry,” and “engage in individual reading.” Students also spent less time “learning facts, definitions, and algorithms.”
11
Table 4. Student’s Role: Mean Percent of Time for Core-Subject Classrooms Fall 2004 Spring 2005 Activity
Immersion n=64
Control n=64
Immersion n=117
Control n=123
Listening to teacher presentation/rote discussion 42.6 37.3 28.8 38.9 Listening to student presentation 4.1 0.9 2.4 2.2 Engaging in substantive discussion 2.9 6.1 0.9 4.3 Learning facts, definitions, algorithms 48.8 42.5 41.5 41.7 Writing communication related to lesson 4.8 8.7 15.7 7.9 Constructing knowledge (e.g, synthesize, explain) 7.5 13.1 14.3 9.8 Engaging in disciplined inquiry (e.g., investigation) 3.6 5.8 9.3 5.1 Engaging in individual reading 10.8 5.8 18.2 12.7 Viewing a video/CD ROM 0.3 1.7 1.0 3.0 Taking a test 3.8 5.2 6.8 3.7 Other academic 13.3 13.4 17.5 17.0 Other non-academic 11.7 16.8 13.2 13.3 Note. Students may be engaged in multiple activities; thus, the sum across all activity categories can equal more than 100 percent. Bold text denotes a statistically significant difference between treatment and control groups. Italic text indicates a substantial fall-to-spring shift for immersed or control campuses. Technology Use Observers also made time-interval ratings to document the extent to which technology was used by teachers and students and to indicate the number of students who used technology. Findings reported in Table 5 provide a general profile of technology use in fall and spring. Table 5. Technology Use: Teachers and Students
Fall 2004 Spring 2005 Technology use indicator
Immersion n=64
Control n=64
Immersion n=117
Control n=123
Percent of classrooms, teachers used technology 23.4 31.3 52.1 35.0 Percent of time, teachers used technology 7.3 16.0 29.3 17.1 Mean number of students using technology 0.0 0.8 8.3 0.6 Percent of classrooms, students used technology 12.5 15.6 77.8 16.3 Percent of time, students used technology 3.4 7.7 58.4 8.6 Note. Bold text denotes a statistically significant difference between treatment and control groups.
In fall, technology use comparisons between teachers and students at immersed and control schools generally favored control schools. Control teachers, on average, used technology significantly more time. However, things changed dramatically in the spring. Teachers at immersed campuses were significantly more likely than control teachers to use technology for instructional or management purposes (52.1% of classrooms vs. 35.3%, p < .01), and they used technology for significantly more time (29.3% of time vs. 17.1%, p < .01). Differences in spring similarly favored students at immersed campuses. The mean number of students using technology in observed classrooms was significantly greater at immersed schools (8.3 students vs. 0.6). Likewise, immersed students used technology in significantly more classrooms (77.8% of classrooms vs. 16.3%) and for a significantly greater proportion of class time (58.4% of time vs. 8.6%). Observer’s time-interval ratings also documented the types of technology used by teachers and students in fall and spring. Results reported in Table 6 show that in fall, there were no statistically significant differences between groups in teachers’ uses of various types of technology. Even so, sixth-grade teachers at control campuses were more than twice as likely to use presentation software, such
12
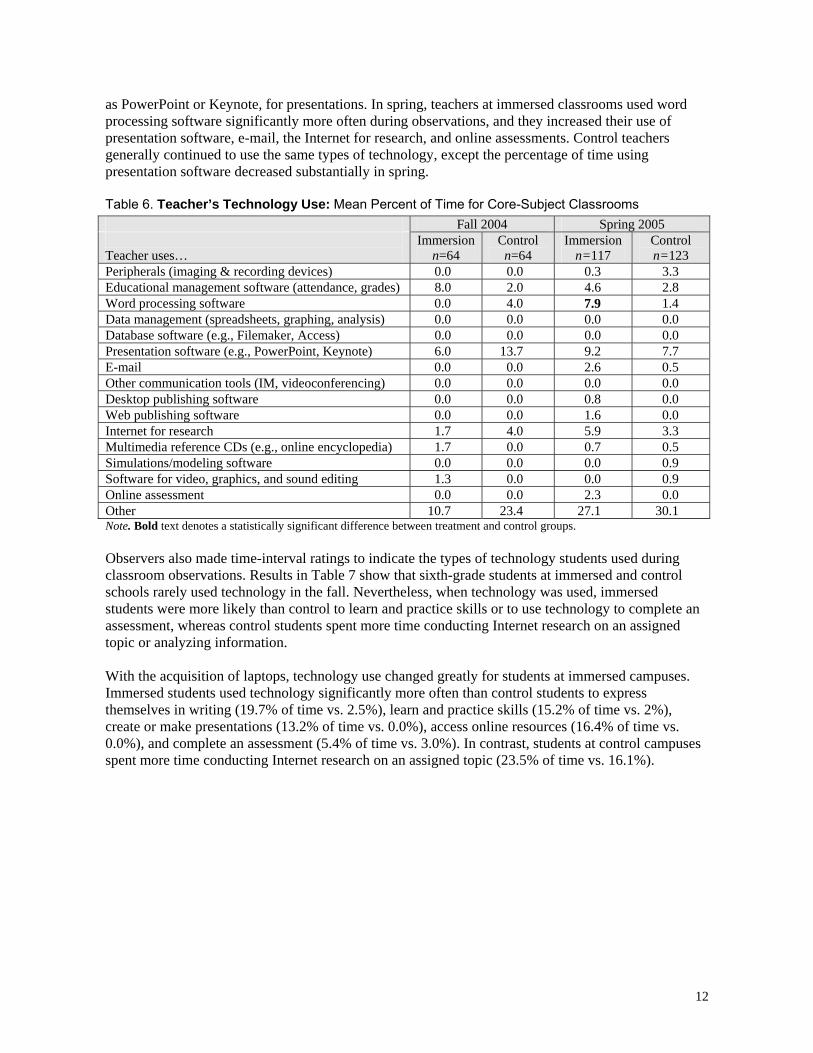
as PowerPoint or Keynote, for presentations. In spring, teachers at immersed classrooms used word processing software significantly more often during observations, and they increased their use of presentation software, e-mail, the Internet for research, and online assessments. Control teachers generally continued to use the same types of technology, except the percentage of time using presentation software decreased substantially in spring. Table 6. Teacher’s Technology Use: Mean Percent of Time for Core-Subject Classrooms Fall 2004 Spring 2005 Teacher uses…
Immersion n=64
Control n=64
Immersion n=117
Control n=123
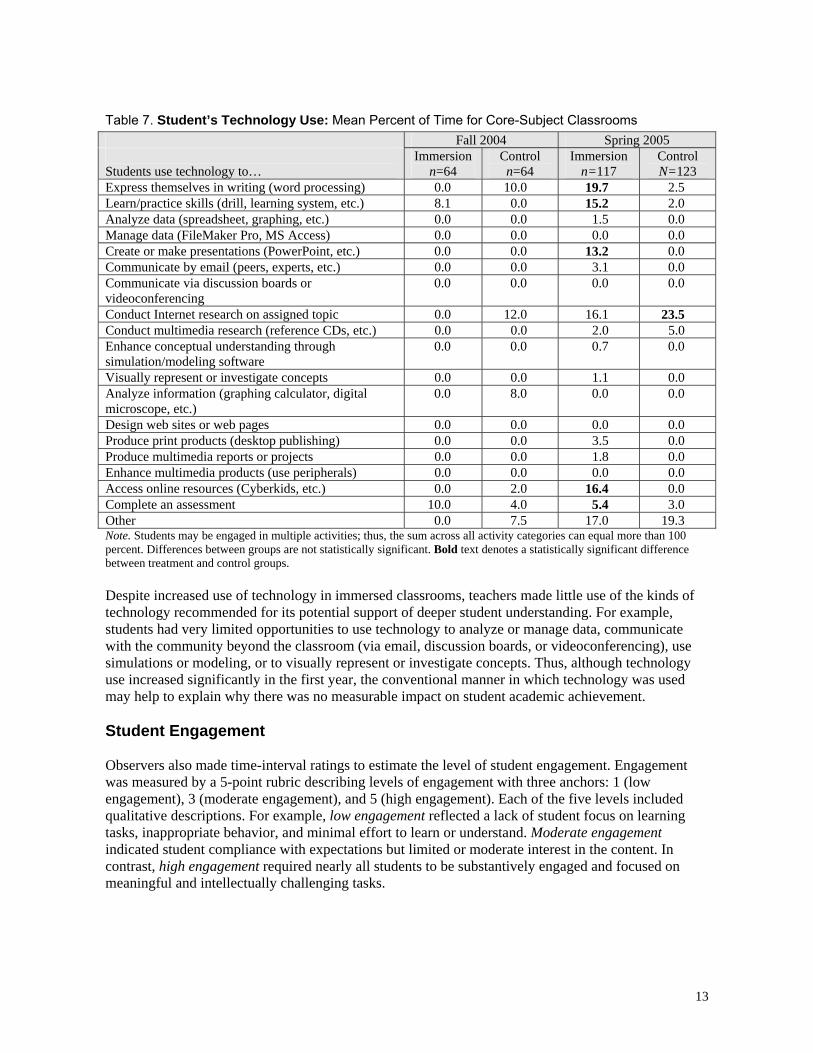
Peripherals (imaging & recording devices) 0.0 0.0 0.3 3.3 Educational management software (attendance, grades) 8.0 2.0 4.6 2.8 Word processing software 0.0 4.0 7.9 1.4 Data management (spreadsheets, graphing, analysis) 0.0 0.0 0.0 0.0 Database software (e.g., Filemaker, Access) 0.0 0.0 0.0 0.0 Presentation software (e.g., PowerPoint, Keynote) 6.0 13.7 9.2 7.7 E-mail 0.0 0.0 2.6 0.5 Other communication tools (IM, videoconferencing) 0.0 0.0 0.0 0.0 Desktop publishing software 0.0 0.0 0.8 0.0 Web publishing software 0.0 0.0 1.6 0.0 Internet for research 1.7 4.0 5.9 3.3 Multimedia reference CDs (e.g., online encyclopedia) 1.7 0.0 0.7 0.5 Simulations/modeling software 0.0 0.0 0.0 0.9 Software for video, graphics, and sound editing 1.3 0.0 0.0 0.9 Online assessment 0.0 0.0 2.3 0.0 Other 10.7 23.4 27.1 30.1 Note. Bold text denotes a statistically significant difference between treatment and control groups. Observers also made time-interval ratings to indicate the types of technology students used during classroom observations. Results in Table 7 show that sixth-grade students at immersed and control schools rarely used technology in the fall. Nevertheless, when technology was used, immersed students were more likely than control to learn and practice skills or to use technology to complete an assessment, whereas control students spent more time conducting Internet research on an assigned topic or analyzing information. With the acquisition of laptops, technology use changed greatly for students at immersed campuses. Immersed students used technology significantly more often than control students to express themselves in writing (19.7% of time vs. 2.5%), learn and practice skills (15.2% of time vs. 2%), create or make presentations (13.2% of time vs. 0.0%), access online resources (16.4% of time vs. 0.0%), and complete an assessment (5.4% of time vs. 3.0%). In contrast, students at control campuses spent more time conducting Internet research on an assigned topic (23.5% of time vs. 16.1%).
13
Table 7. Student’s Technology Use: Mean Percent of Time for Core-Subject Classrooms Fall 2004 Spring 2005 Students use technology to…
Immersion n=64
Control n=64
Immersion n=117
Control N=123
Express themselves in writing (word processing) 0.0 10.0 19.7 2.5 Learn/practice skills (drill, learning system, etc.) 8.1 0.0 15.2 2.0 Analyze data (spreadsheet, graphing, etc.) 0.0 0.0 1.5 0.0 Manage data (FileMaker Pro, MS Access) 0.0 0.0 0.0 0.0 Create or make presentations (PowerPoint, etc.) 0.0 0.0 13.2 0.0 Communicate by email (peers, experts, etc.) 0.0 0.0 3.1 0.0 Communicate via discussion boards or videoconferencing
0.0 0.0 0.0 0.0
Conduct Internet research on assigned topic 0.0 12.0 16.1 23.5 Conduct multimedia research (reference CDs, etc.) 0.0 0.0 2.0 5.0 Enhance conceptual understanding through simulation/modeling software
0.0 0.0 0.7 0.0
Visually represent or investigate concepts 0.0 0.0 1.1 0.0 Analyze information (graphing calculator, digital microscope, etc.)
0.0 8.0 0.0 0.0
Design web sites or web pages 0.0 0.0 0.0 0.0 Produce print products (desktop publishing) 0.0 0.0 3.5 0.0 Produce multimedia reports or projects 0.0 0.0 1.8 0.0 Enhance multimedia products (use peripherals) 0.0 0.0 0.0 0.0 Access online resources (Cyberkids, etc.) 0.0 2.0 16.4 0.0 Complete an assessment 10.0 4.0 5.4 3.0 Other 0.0 7.5 17.0 19.3 Note. Students may be engaged in multiple activities; thus, the sum across all activity categories can equal more than 100 percent. Differences between groups are not statistically significant. Bold text denotes a statistically significant difference between treatment and control groups. Despite increased use of technology in immersed classrooms, teachers made little use of the kinds of technology recommended for its potential support of deeper student understanding. For example, students had very limited opportunities to use technology to analyze or manage data, communicate with the community beyond the classroom (via email, discussion boards, or videoconferencing), use simulations or modeling, or to visually represent or investigate concepts. Thus, although technology use increased significantly in the first year, the conventional manner in which technology was used may help to explain why there was no measurable impact on student academic achievement. Student Engagement Observers also made time-interval ratings to estimate the level of student engagement. Engagement was measured by a 5-point rubric describing levels of engagement with three anchors: 1 (low engagement), 3 (moderate engagement), and 5 (high engagement). Each of the five levels included qualitative descriptions. For example, low engagement reflected a lack of student focus on learning tasks, inappropriate behavior, and minimal effort to learn or understand. Moderate engagement indicated student compliance with expectations but limited or moderate interest in the content. In contrast, high engagement required nearly all students to be substantively engaged and focused on meaningful and intellectually challenging tasks.
14
5.43.4 3
5.5
19.5 20.8
8.4
14.7
60.1
49.3
59.262.6
13.2
21.825.4
14
1.3
13.2
1.7 1.9
0
10
20
30
40
50
60
70
Immersed Fall Control Fall Immersed Spring Control Spring
Perc
ent o
f Cla
ssro
oms
1-Low Engagement 2 3-Moderate Engagement 4 5-High Engagement
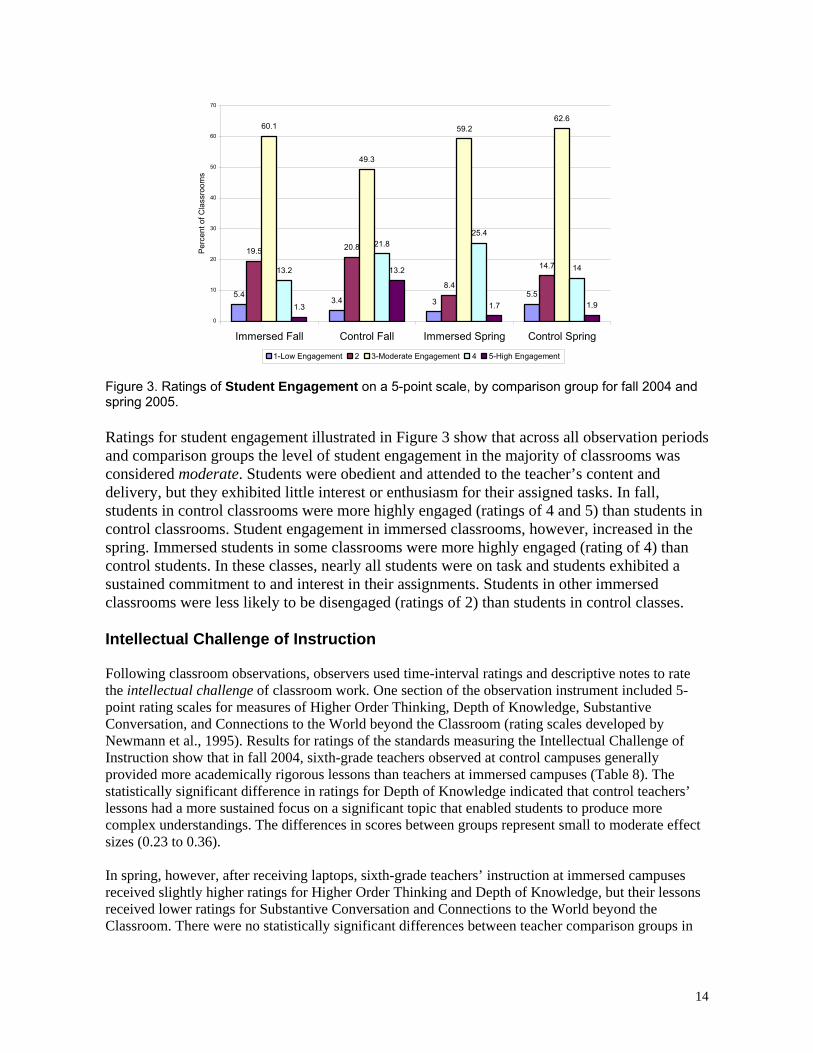
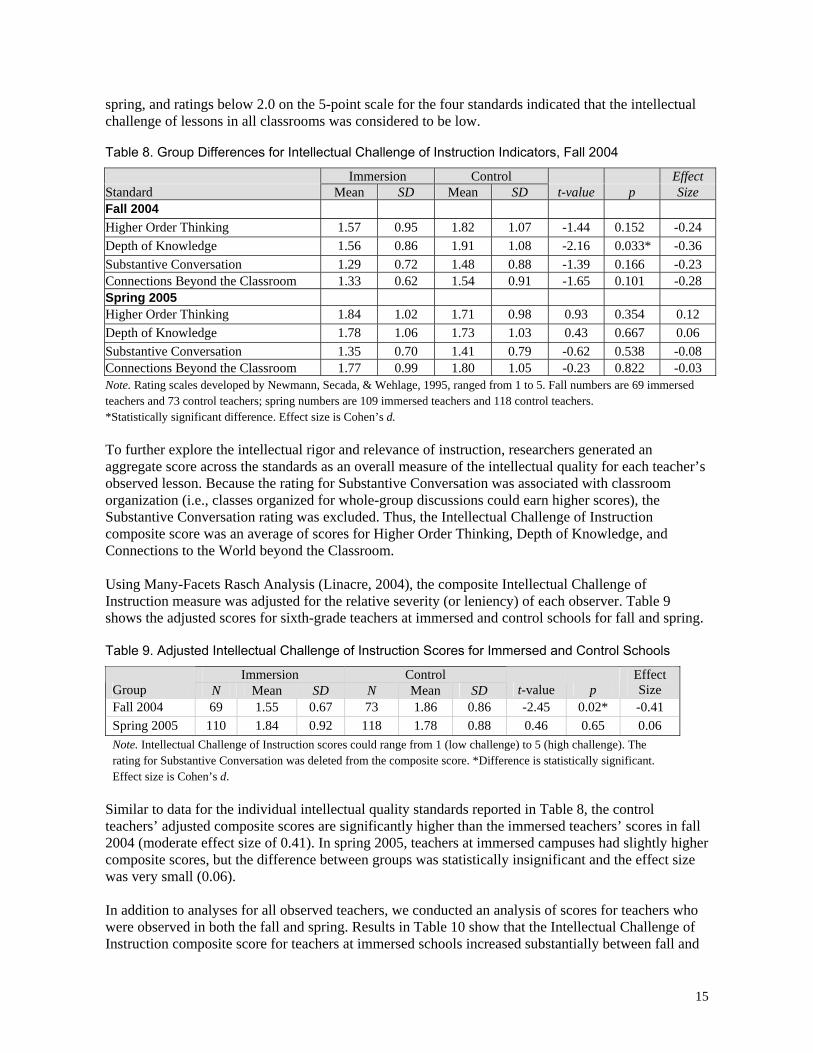
Figure 3. Ratings of Student Engagement on a 5-point scale, by comparison group for fall 2004 and spring 2005. Ratings for student engagement illustrated in Figure 3 show that across all observation periods and comparison groups the level of student engagement in the majority of classrooms was considered moderate. Students were obedient and attended to the teacher’s content and delivery, but they exhibited little interest or enthusiasm for their assigned tasks. In fall, students in control classrooms were more highly engaged (ratings of 4 and 5) than students in control classrooms. Student engagement in immersed classrooms, however, increased in the spring. Immersed students in some classrooms were more highly engaged (rating of 4) than control students. In these classes, nearly all students were on task and students exhibited a sustained commitment to and interest in their assignments. Students in other immersed classrooms were less likely to be disengaged (ratings of 2) than students in control classes. Intellectual Challenge of Instruction Following classroom observations, observers used time-interval ratings and descriptive notes to rate the intellectual challenge of classroom work. One section of the observation instrument included 5-point rating scales for measures of Higher Order Thinking, Depth of Knowledge, Substantive Conversation, and Connections to the World beyond the Classroom (rating scales developed by Newmann et al., 1995). Results for ratings of the standards measuring the Intellectual Challenge of Instruction show that in fall 2004, sixth-grade teachers observed at control campuses generally provided more academically rigorous lessons than teachers at immersed campuses (Table 8). The statistically significant difference in ratings for Depth of Knowledge indicated that control teachers’ lessons had a more sustained focus on a significant topic that enabled students to produce more complex understandings. The differences in scores between groups represent small to moderate effect sizes (0.23 to 0.36). In spring, however, after receiving laptops, sixth-grade teachers’ instruction at immersed campuses received slightly higher ratings for Higher Order Thinking and Depth of Knowledge, but their lessons received lower ratings for Substantive Conversation and Connections to the World beyond the Classroom. There were no statistically significant differences between teacher comparison groups in
15
spring, and ratings below 2.0 on the 5-point scale for the four standards indicated that the intellectual challenge of lessons in all classrooms was considered to be low. Table 8. Group Differences for Intellectual Challenge of Instruction Indicators, Fall 2004
Immersion Control Effect Standard Mean SD Mean SD t-value p Size Fall 2004 Higher Order Thinking 1.57 0.95 1.82 1.07 -1.44 0.152 -0.24 Depth of Knowledge 1.56 0.86 1.91 1.08 -2.16 0.033* -0.36 Substantive Conversation 1.29 0.72 1.48 0.88 -1.39 0.166 -0.23 Connections Beyond the Classroom 1.33 0.62 1.54 0.91 -1.65 0.101 -0.28 Spring 2005 Higher Order Thinking 1.84 1.02 1.71 0.98 0.93 0.354 0.12 Depth of Knowledge 1.78 1.06 1.73 1.03 0.43 0.667 0.06 Substantive Conversation 1.35 0.70 1.41 0.79 -0.62 0.538 -0.08 Connections Beyond the Classroom 1.77 0.99 1.80 1.05 -0.23 0.822 -0.03 Note. Rating scales developed by Newmann, Secada, & Wehlage, 1995, ranged from 1 to 5. Fall numbers are 69 immersed teachers and 73 control teachers; spring numbers are 109 immersed teachers and 118 control teachers. *Statistically significant difference. Effect size is Cohen’s d. To further explore the intellectual rigor and relevance of instruction, researchers generated an aggregate score across the standards as an overall measure of the intellectual quality for each teacher’s observed lesson. Because the rating for Substantive Conversation was associated with classroom organization (i.e., classes organized for whole-group discussions could earn higher scores), the Substantive Conversation rating was excluded. Thus, the Intellectual Challenge of Instruction composite score was an average of scores for Higher Order Thinking, Depth of Knowledge, and Connections to the World beyond the Classroom. Using Many-Facets Rasch Analysis (Linacre, 2004), the composite Intellectual Challenge of Instruction measure was adjusted for the relative severity (or leniency) of each observer. Table 9 shows the adjusted scores for sixth-grade teachers at immersed and control schools for fall and spring. Table 9. Adjusted Intellectual Challenge of Instruction Scores for Immersed and Control Schools
Immersion Control Group N Mean SD N Mean SD t-value p
Effect Size
Fall 2004 69 1.55 0.67 73 1.86 0.86 -2.45 0.02* -0.41 Spring 2005 110 1.84 0.92 118 1.78 0.88 0.46 0.65 0.06 Note. Intellectual Challenge of Instruction scores could range from 1 (low challenge) to 5 (high challenge). The rating for Substantive Conversation was deleted from the composite score. *Difference is statistically significant. Effect size is Cohen’s d.
Similar to data for the individual intellectual quality standards reported in Table 8, the control teachers’ adjusted composite scores are significantly higher than the immersed teachers’ scores in fall 2004 (moderate effect size of 0.41). In spring 2005, teachers at immersed campuses had slightly higher composite scores, but the difference between groups was statistically insignificant and the effect size was very small (0.06). In addition to analyses for all observed teachers, we conducted an analysis of scores for teachers who were observed in both the fall and spring. Results in Table 10 show that the Intellectual Challenge of Instruction composite score for teachers at immersed schools increased substantially between fall and
16
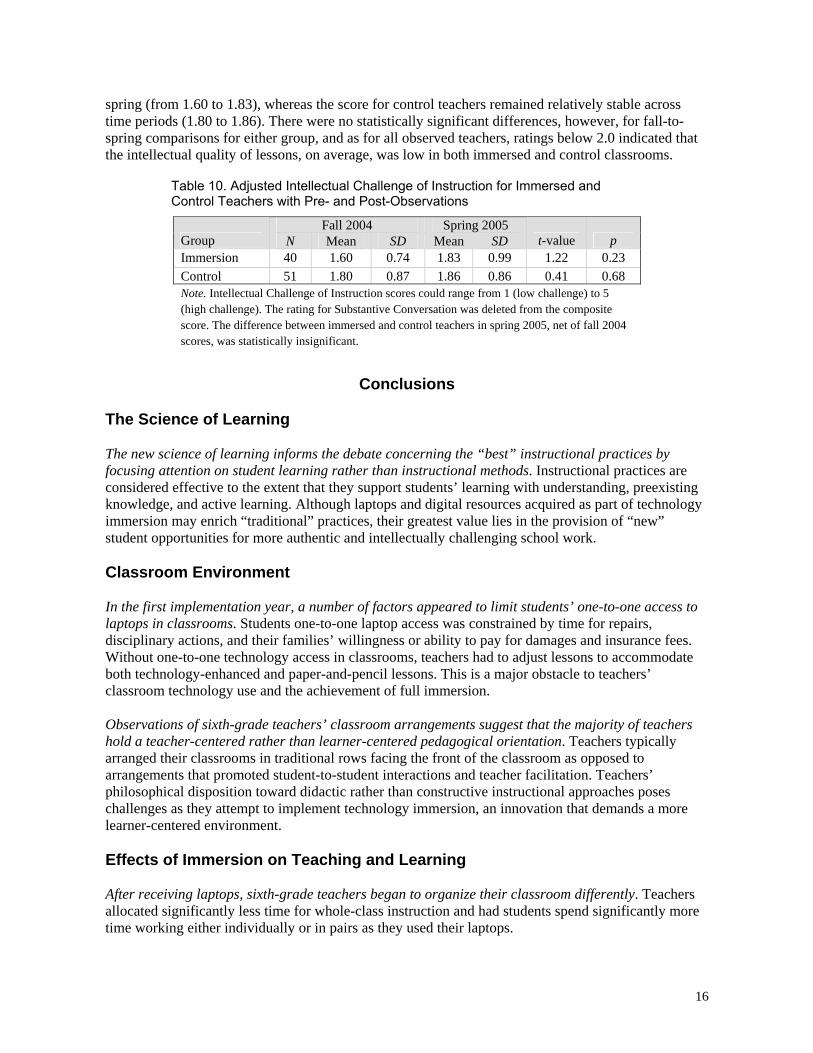
spring (from 1.60 to 1.83), whereas the score for control teachers remained relatively stable across time periods (1.80 to 1.86). There were no statistically significant differences, however, for fall-to-spring comparisons for either group, and as for all observed teachers, ratings below 2.0 indicated that the intellectual quality of lessons, on average, was low in both immersed and control classrooms.
Table 10. Adjusted Intellectual Challenge of Instruction for Immersed and Control Teachers with Pre- and Post-Observations
Fall 2004 Spring 2005 Group N Mean SD Mean SD t-value p Immersion 40 1.60 0.74 1.83 0.99 1.22 0.23 Control 51 1.80 0.87 1.86 0.86 0.41 0.68 Note. Intellectual Challenge of Instruction scores could range from 1 (low challenge) to 5 (high challenge). The rating for Substantive Conversation was deleted from the composite score. The difference between immersed and control teachers in spring 2005, net of fall 2004 scores, was statistically insignificant.
Conclusions The Science of Learning The new science of learning informs the debate concerning the “best” instructional practices by focusing attention on student learning rather than instructional methods. Instructional practices are considered effective to the extent that they support students’ learning with understanding, preexisting knowledge, and active learning. Although laptops and digital resources acquired as part of technology immersion may enrich “traditional” practices, their greatest value lies in the provision of “new” student opportunities for more authentic and intellectually challenging school work. Classroom Environment In the first implementation year, a number of factors appeared to limit students’ one-to-one access to laptops in classrooms. Students one-to-one laptop access was constrained by time for repairs, disciplinary actions, and their families’ willingness or ability to pay for damages and insurance fees. Without one-to-one technology access in classrooms, teachers had to adjust lessons to accommodate both technology-enhanced and paper-and-pencil lessons. This is a major obstacle to teachers’ classroom technology use and the achievement of full immersion. Observations of sixth-grade teachers’ classroom arrangements suggest that the majority of teachers hold a teacher-centered rather than learner-centered pedagogical orientation. Teachers typically arranged their classrooms in traditional rows facing the front of the classroom as opposed to arrangements that promoted student-to-student interactions and teacher facilitation. Teachers’ philosophical disposition toward didactic rather than constructive instructional approaches poses challenges as they attempt to implement technology immersion, an innovation that demands a more learner-centered environment. Effects of Immersion on Teaching and Learning After receiving laptops, sixth-grade teachers began to organize their classroom differently. Teachers allocated significantly less time for whole-class instruction and had students spend significantly more time working either individually or in pairs as they used their laptops.
17
The teacher’s role changed in an immersed classroom. Teachers spent significantly less time directing the whole group (e.g., telling, lecturing, questioning, or controlling the topic and pace of the lesson) and more time monitoring students as they worked independently on laptops. Teachers, however, seldom became a facilitator or cognitive coach. This may reflect the fact that students’ work on laptops rarely involved complex projects or problem-based activities or teachers were just unaware of the importance of their role in facilitating or scaffolding student thinking. The student’s role changed substantially with the use of laptops. Sixth graders at immersed schools compared to control spent significantly less time listening to a teacher presentation or rote discussion, and they had significantly more opportunities to write communication related to the lesson, such as a composition, reflection, or journal entry. There was also a substantial increase in immersed classrooms for other indicators of intellectual rigor. For example, lessons in immersed classrooms in spring provided substantially greater opportunities for students to construct knowledge (e.g., synthesize, hypothesize, generalize, or explain), engage in disciplined inquiry (e.g., complex problem solving or investigation) and read individually. As expected, students and teachers at immersed campuses compared to control used technology in a greater proportion of classrooms and for a larger percentage of class time. In spring, teachers in immersed classrooms used word processing software significantly more often during observations than control teachers, and they increased their use of presentation software, e-mail, the Internet for research, and online assessments. After receiving laptops, technology use changed dramatically for students in immersed classrooms. Compared to the control group, immersed students used technology significantly more often to express themselves in writing (word processing software), access online resources, learn and practice skills (drill and practice, learning system, educational games), create or make presentations (with PowerPoint or Keynote), or to complete an assessment. In contrast, students at control campuses spent significantly more time conducting Internet research on an assigned topic. In immersed classrooms, 8.3 students, on average, used technology during observations, whereas less than one student (0.6) used technology in control classrooms. Even though technology use increased significantly in immersed classrooms, teachers typically used laptops to continue traditional practices. Students’ laptop use most frequently involved using a word processor for writing, learning and practicing skills, creating presentations, researching a topic on the Internet, or accessing online resources. Students rarely had opportunities to use laptops as a means to deepen their conceptual understanding of subject matter or to study topics, problems, or issues connected to their personal experiences or the world beyond the classroom. For example, students seldom used technology to analyze or manage data, communicate with the community beyond the classroom (via e-mail, discussion groups, or videoconferencing), use simulations or modeling to enhance conceptual understanding, or to visually represent or investigate concepts (mapping, graphing, charting). It is these kinds of technology use that hold the greatest promise for increasing students’ understanding and academic achievement. Student engagement in immersed classrooms increased in the spring. Students in some immersed classrooms in spring were more highly engaged (rating of 4) than control students. In these classes, nearly all students were on task and students exhibited a sustained commitment to and interest in their assignments. Despite improvements, engagement ratings show that students in the majority of classrooms at both immersed and control schools are only moderately engaged.
18
Although lessons in immersed classrooms showed slightly increased intellectual rigor and relevance after students received laptops, improvement in the intellectual quality of lessons is needed. Ratings of the Intellectual Challenge of Instruction indicated the extent to which instruction in immersed and control classrooms aligned with the scientific principles of learning as measured by standards that have been associated with student academic achievement (Newmann, 1996; Newmann, Bryk, & Nagoaka, 2001). Teachers’ lessons at both immersed and control schools received low ratings of intellectual challenge for Higher Order Thinking, Depth of Knowledge, Substantive Conversation, and Connections to the World beyond the Classroom. Lower ratings reflected the prevalence of lessons where students were passive rather than active participants and lesson content centered on learning isolated facts, definitions, or algorithms, with learning materials often requiring only multiple-choice or short-answer responses.
19
References Bransford, J.D., Brown, A.L., & Cocking, R.R. (2003). How people learn: Brain, mind, experience,
and school. Washington, D.C.: National Academy Press. CEO Forum on Education and Technology (2001). Key building blocks for student achievement in the
21st century: Assessment, alignment, accountability, access, analysis. Washington, DC. Goldman, S., Cole, K., & Syer, C. (1999). The technology/content dilemma. Paper presented at The
Secretary’s Conference on Educational Technology-1999, Washington, D.C. Retrieved April 20, 2006 at http://www.ed.gov/print/rschstat/eval/tech/techconf99/whitepapers/paper4.html
Johnston, M., & Cooley, N. (2001). Supporting new models of teaching and learning through
technology. Arlington, VA: Educational Research Service. Linacre, J. (1995). Prioritizing misfit indicators. Rasch Measurement Transactions, 9(2), 422-423. Linacre, J. (2004). Facets Rasch measurement computer program. Chicago: Winsteps.com. Lunz, M., Wright, B., & Linacre, J. (1990). Measuring the impact of judge severity on examination
scores. Applied Measurement in Education, 3(4), 331-345. Many, J., Fyfe, R., Lewis, G., & Mitchell, E. (1996). Traversing the topical landscape: Exploring
students’ self-directed reading-writing-research processes. Reading Research Quarterly, 31(1), 12-35.
McTighe, J., & Ferrara, S. (1996, October). Performance-based assessment in the classroom. ASCD
Conference on Teaching and Learning Assessment. Newmann, F., & Associates (1996). Authentic achievement: Restructuring schools for intellectual
quality. San Francisco: Jossey-Bass Publishers. Newmann, F., Bryk, A., & Nagoaka, J. (2001). Authentic and intellectual work and standardized tests:
Conflict or coexistence? Chicago: Consortium on Chicago School Research. Newmann, F., Secada, W., & Wehlage, G. (1995). A guide to authentic instruction and assessment:
Vision, standards, and scoring. Madison, WI: Wisconsin Center for Education Research.
Sulla, N. (1999, February). Technology: To use or infuse. The Technology Source Archives at the
University of North Carolina. Retrieved April 20, 2006 from http://technologysource.org/article/technology/
Treatment Group School
‐Leade
rship an
d Sy
stem Sup
port
‐‐Classroom Techn
olog
y Integration
‐Techn
ical Sup
port
‐Inn
ovative Culture
‐Parent & Com
mun
ity Sup
port
‐
Context
Stud
ent
Family
Com
mun
ity
Treatm
ent T
eachers
‐Com
putin
g Devices
‐Digita
l Resou
rces
‐Professiona
l Develop
ment
‐Techn
ical &
Peda
gogical S
uppo
rt
Teache
r Factors
‐Techn
olgy Proficiency
‐Professiona
l Produ
ctivity
‐Stude
ntsʹ Te
chno
logy Use
‐Techn
olog
y Integration
‐Collabo
ratio
n‐Intellectua
l Cha
lleng
e
Stud
ent Factors
‐Techn
olog
y Proficiency
‐Techn
olog
y Use
‐Self‐D
irected Le
arning
‐Small‐G
roup W
ork
‐Motivation/En
gagement
‐Intellectua
l Work
Academic Achievement
‐Math
‐Reading
‐Writin
g‐Social Studies
Context
Stud
ent
Family
Com
mun
ity
Stud
ent F
actors
Teacher F
actors
Control Group School
Con
trol Teachers
Instructiona
l App
roach
Academic Achievement
‐Math
‐Reading
‐Writin
g‐Social StudiesEffect of techn
olog
y im
mersion
is th
e diffe
rence betw
een
expe
rimental/c
ontrol group
s
Appe
ndix
A. T
heor
etic
al F
ram
ewor
k fo
r Tec
hnol
ogy
Imm
ersi
on
20
21
Appendix B
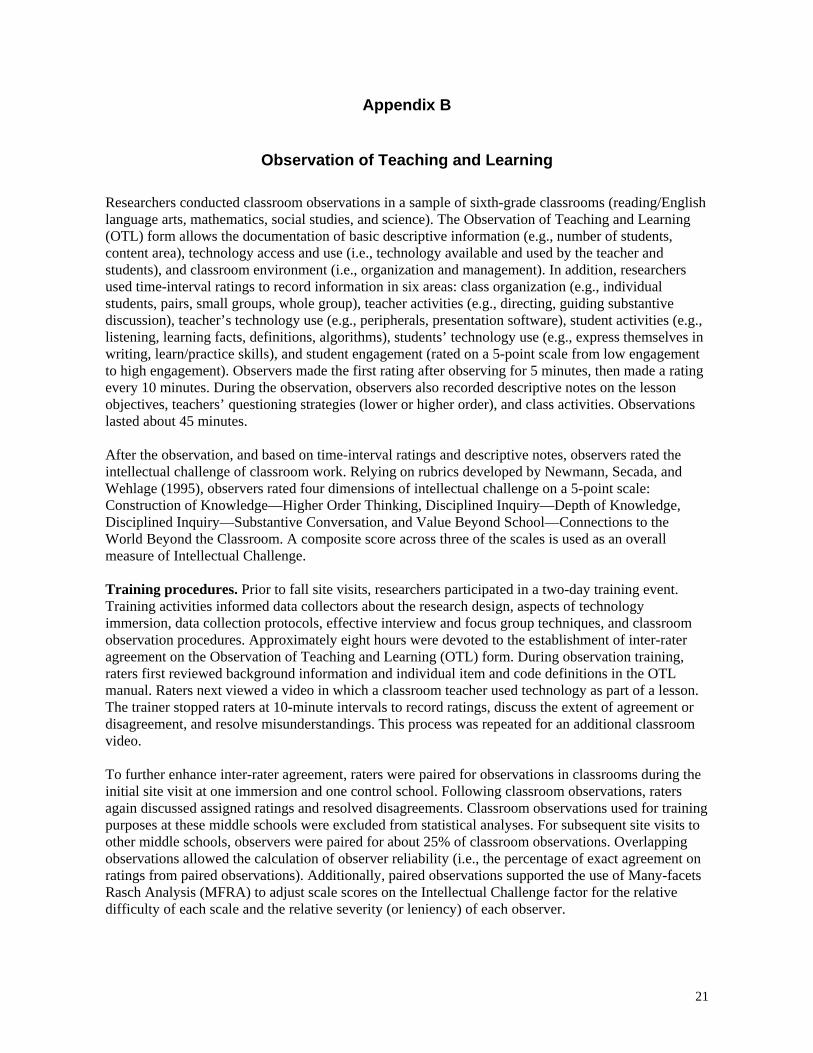
Observation of Teaching and Learning Researchers conducted classroom observations in a sample of sixth-grade classrooms (reading/English language arts, mathematics, social studies, and science). The Observation of Teaching and Learning (OTL) form allows the documentation of basic descriptive information (e.g., number of students, content area), technology access and use (i.e., technology available and used by the teacher and students), and classroom environment (i.e., organization and management). In addition, researchers used time-interval ratings to record information in six areas: class organization (e.g., individual students, pairs, small groups, whole group), teacher activities (e.g., directing, guiding substantive discussion), teacher’s technology use (e.g., peripherals, presentation software), student activities (e.g., listening, learning facts, definitions, algorithms), students’ technology use (e.g., express themselves in writing, learn/practice skills), and student engagement (rated on a 5-point scale from low engagement to high engagement). Observers made the first rating after observing for 5 minutes, then made a rating every 10 minutes. During the observation, observers also recorded descriptive notes on the lesson objectives, teachers’ questioning strategies (lower or higher order), and class activities. Observations lasted about 45 minutes. After the observation, and based on time-interval ratings and descriptive notes, observers rated the intellectual challenge of classroom work. Relying on rubrics developed by Newmann, Secada, and Wehlage (1995), observers rated four dimensions of intellectual challenge on a 5-point scale: Construction of Knowledge—Higher Order Thinking, Disciplined Inquiry—Depth of Knowledge, Disciplined Inquiry—Substantive Conversation, and Value Beyond School—Connections to the World Beyond the Classroom. A composite score across three of the scales is used as an overall measure of Intellectual Challenge. Training procedures. Prior to fall site visits, researchers participated in a two-day training event. Training activities informed data collectors about the research design, aspects of technology immersion, data collection protocols, effective interview and focus group techniques, and classroom observation procedures. Approximately eight hours were devoted to the establishment of inter-rater agreement on the Observation of Teaching and Learning (OTL) form. During observation training, raters first reviewed background information and individual item and code definitions in the OTL manual. Raters next viewed a video in which a classroom teacher used technology as part of a lesson. The trainer stopped raters at 10-minute intervals to record ratings, discuss the extent of agreement or disagreement, and resolve misunderstandings. This process was repeated for an additional classroom video. To further enhance inter-rater agreement, raters were paired for observations in classrooms during the initial site visit at one immersion and one control school. Following classroom observations, raters again discussed assigned ratings and resolved disagreements. Classroom observations used for training purposes at these middle schools were excluded from statistical analyses. For subsequent site visits to other middle schools, observers were paired for about 25% of classroom observations. Overlapping observations allowed the calculation of observer reliability (i.e., the percentage of exact agreement on ratings from paired observations). Additionally, paired observations supported the use of Many-facets Rasch Analysis (MFRA) to adjust scale scores on the Intellectual Challenge factor for the relative difficulty of each scale and the relative severity (or leniency) of each observer.
22
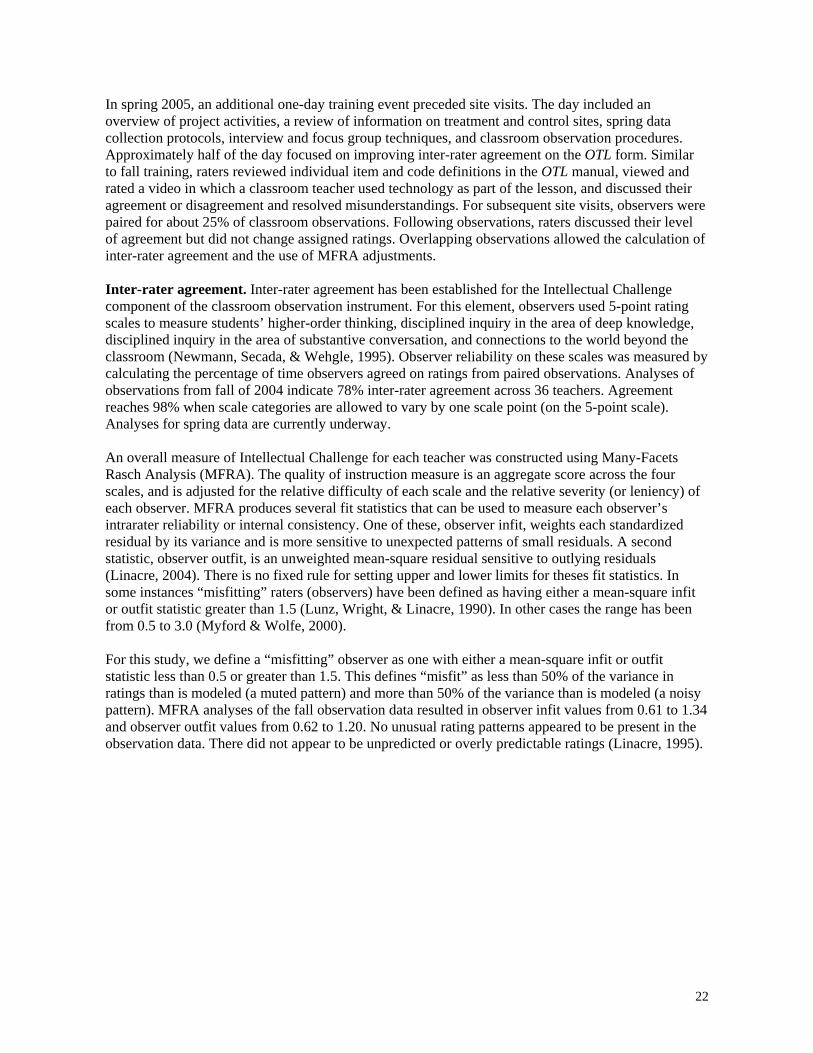
In spring 2005, an additional one-day training event preceded site visits. The day included an overview of project activities, a review of information on treatment and control sites, spring data collection protocols, interview and focus group techniques, and classroom observation procedures. Approximately half of the day focused on improving inter-rater agreement on the OTL form. Similar to fall training, raters reviewed individual item and code definitions in the OTL manual, viewed and rated a video in which a classroom teacher used technology as part of the lesson, and discussed their agreement or disagreement and resolved misunderstandings. For subsequent site visits, observers were paired for about 25% of classroom observations. Following observations, raters discussed their level of agreement but did not change assigned ratings. Overlapping observations allowed the calculation of inter-rater agreement and the use of MFRA adjustments. Inter-rater agreement. Inter-rater agreement has been established for the Intellectual Challenge component of the classroom observation instrument. For this element, observers used 5-point rating scales to measure students’ higher-order thinking, disciplined inquiry in the area of deep knowledge, disciplined inquiry in the area of substantive conversation, and connections to the world beyond the classroom (Newmann, Secada, & Wehgle, 1995). Observer reliability on these scales was measured by calculating the percentage of time observers agreed on ratings from paired observations. Analyses of observations from fall of 2004 indicate 78% inter-rater agreement across 36 teachers. Agreement reaches 98% when scale categories are allowed to vary by one scale point (on the 5-point scale). Analyses for spring data are currently underway. An overall measure of Intellectual Challenge for each teacher was constructed using Many-Facets Rasch Analysis (MFRA). The quality of instruction measure is an aggregate score across the four scales, and is adjusted for the relative difficulty of each scale and the relative severity (or leniency) of each observer. MFRA produces several fit statistics that can be used to measure each observer’s intrarater reliability or internal consistency. One of these, observer infit, weights each standardized residual by its variance and is more sensitive to unexpected patterns of small residuals. A second statistic, observer outfit, is an unweighted mean-square residual sensitive to outlying residuals (Linacre, 2004). There is no fixed rule for setting upper and lower limits for theses fit statistics. In some instances “misfitting” raters (observers) have been defined as having either a mean-square infit or outfit statistic greater than 1.5 (Lunz, Wright, & Linacre, 1990). In other cases the range has been from 0.5 to 3.0 (Myford & Wolfe, 2000). For this study, we define a “misfitting” observer as one with either a mean-square infit or outfit statistic less than 0.5 or greater than 1.5. This defines “misfit” as less than 50% of the variance in ratings than is modeled (a muted pattern) and more than 50% of the variance than is modeled (a noisy pattern). MFRA analyses of the fall observation data resulted in observer infit values from 0.61 to 1.34 and observer outfit values from 0.62 to 1.20. No unusual rating patterns appeared to be present in the observation data. There did not appear to be unpredicted or overly predictable ratings (Linacre, 1995).
23
Appendix C
Framework of Assessment Approaches and Methods
How might we assess student learning in the classroom?
PERFORMANCE-BASED ASSESSMENTS SELECTED RESPONSE
ITEMS CONSTRUCTED
RESPONSES
PRODUCTS
PERFORMANCES PROCESS-FOCUSED
□ Multiple-choice
□ True-false
□ Matching
□ Fill in the blank
▪ word(s) ▪ phrase(s)
□ Short answer
▪ sentences ▪ paragraphs
□ Label a diagram □ Show your work □ Visual representation
▪ web ▪ concept map ▪ flow chart ▪ graph/table ▪ matrix ▪ illustration
□ Essay
□ Research paper
□ Log/journal
□ Lab report
□ Story/play
□ Poem
□ Portfolio
□ Art exhibit
□ Science project
□ Model
□ Video/audiotape
□ Spreadsheet
□ Oral presentation
□ Dance/movement
□ Science lab demonstration
□ Athletic competition
□ Dramatic reading
□ Enactment
□ Debate
□ Musical recital
□ Oral questioning
□ Observation
□ Interview
□ Conference
□ Process description
□ Think aloud
□ Thinking log
Note. Adapted from Performance-Based Assessment in the Classroom, Jay McTighe and Steven Ferrara, ASCD Conference on Teaching and Learning Assessment, October 1996.