effects of the 2012 hewlett & high park wildfires on … of the 2012 hewlett & high park...
TRANSCRIPT
Effects of the 2012 Hewlett & High Park
Wildfires on Water Quality of the Poudre
River and Seaman Reservoir
Prepared by:
Jill Oropeza
Watershed Specialist
Jared Heath
Watershed Technician
City of Fort Collins Utilities
September 5, 2013


iii
TABLE OF CONTENTS
TABLE OF CONTENTS ................................................................................................ iii
LIST OF TABLES ........................................................................................................... iv
LIST OF FIGURES ......................................................................................................... iv
1.0 INTRODUCTION..................................................................................................1 1.1 Fire Activity and Affected Areas ....................................................................1
1.2 Fire Effects on Forest Hydrology ...................................................................2
1.3 Burn Severity ..................................................................................................4
1.4 Effects of Sediment Loading on Poudre River Water Quality .......................6
1.5 Sediment Deposition .......................................................................................8
1.6 Early Warning System ....................................................................................9
1.7 Pleasant Valley Pre-sedimentation Basin .......................................................9
1.8 Fire Effects Mitigation ..................................................................................10
1.9 Key Uncertainties..........................................................................................10
2.0 RESULTS OF STORM EVENT AND ROUTINE RIVER WATER QUALITY SAMPLING .....................................................................................13 2.1 Conductivity, Alkalinity, Hardness and pH ..................................................13
2.2 Total Dissolved Solids & Turbidity ..............................................................14
2.3 Total Organic Carbon (TOC) ........................................................................15
2.4 Nutrients ........................................................................................................16
2.5 Metals ............................................................................................................18
3.0 FIRE EFFECTS ON WATER QUALITY IN SEAMAN RESERVOIR ........21 3.1 Alkalinity and Hardness ................................................................................22
3.2 Total Dissolved Solids (TDS), Turbidity and Chlorophyll-a .......................22
3.3 Total Organic Carbon (TOC) ........................................................................23
3.4 Nutrients ........................................................................................................23
3.5 Post-fire changes in monitoring ...................................................................25
4.0 REFERENCES .....................................................................................................27
Sept. 5, 2013 - Wildfire Effects on Water Quality
iv
LIST OF TABLES
Table 1. Drainages to the Mainstem Poudre River with estimated debris-flow volumes and probabilities >50% for a 10-year/1-hour precipitation event in the High Park Burn Area (USGS OFR 2012–1148) .......................................................4
Table 2. Burn severity and acreage for High Park and Hewlett Fires ............................5
Table 3. Fire-related studies sponsored or co-sponsored by the City of Fort Collins and City of Greeley ........................................................................................11
Table 4. National Primary and Secondary Drinking Water Standards for select heavy metals ..............................................................................................................19
Table 5. Sampling locations and frequencies for metals sampling as part of Upper CLP Monitoring Program ...............................................................................25
LIST OF FIGURES
Figure 1. Hewlett Fire burning riparian zone of the Poudre River ..................................1
Figure 2. Map of the Upper CLP monitoring locations and the area affected by the Hewlett, High Park and Galena Fires ...............................................................2
Figure 3. Pre-fire and post-fire discharge (cfs) in four key drainages in the High Park burn area under a simulated 10-yr rain event (Yochum, 2012) ........................3
Figure 4. Soil burn severity map of 2012 High Park and Hewlett Fires in the Upper Cache la Poudre watershed ...............................................................................5
Figure 5. Highly turbid Poudre River during the July 7 rain event .................................6
Figure 6. Turbidity (black solid line) and conductivity (red solid line) record from early warning system sonde located approximately four miles above the Fort Collins water supply intake facility ..................................................................6
Figure 7. Post-fire vegetation recovery in meadows areas of the South Fork Poudre basin, August 2012 ...........................................................................................7
Figure 8. Debris flow across Highway 14in the High Park burn area following a rain event during summer of 2012 ...........................................................................7
Figure 9. Woody debris accumulation in the lower segment of the South Fork above the confluence with the Mainstem Poudre September 2012 ............................7
Figure 10. Riverbank deposits of sediment and ash from the High Park and Hewlett Fires on the Mainstem Poudre River ................................................................8
Figure 11. A multi-parameter water quality sonde provides real-time turbidity, conductivity and temperature measurements of the river as part of City of Fort Collins early-warning system ...................................................................9
Figure 12. Pre- and post-fire alkalinity (a), hardness (b), conductance (c) and pH (d) values at PNF with storm event concentrations .............................................14
Sept. 5, 2013 - Wildfire Effects on Water Quality
v
Figure 13. Pre- and post-fire Total Dissolved Solids (TDS) values at PNF with storm event concentrations .......................................................................................14
Figure 14. Pre- and post-fire Turbidity (a) values at PNF with storm event concentrations (b) ...........................................................................................15
Figure 15. Pre- and post-fire Total Organic Carbon (TOC) concentrations ....................15
Figure 16. Pre- and post-fire values (a) with storm event concentrations (b) at PNF for ammonia. ........................................................................................................16
Figure 17-20 (a-b). Pre- and post-fire values (a) with storm event concentrations (b) at PNF for nitrate (Fig.17), Total Kjeldahl Nitrogen (Fig.18), ortho-phosphate (Fig.19) and Total P (Fig.20). .........................................................................17
Figure 21. Concentrations of heavy metals (total) in post-fire storm samples ................18
Figure 22. Concentrations of heavy metals (dissolved) in post-fire storm samples ........18
Figure 23. Concentrations of dissolved aluminum (a) and manganese (b) in daily grab samples from Poudre River (July 30 to September 17), following High Park and Hewlett Fires ............................................................................................19
Figure 24. An aerial view of Seaman Reservoir captures the high chlorophyll-a concentrations that resulted from the 2012 mid-summer algal bloom ...........21
Figure 25. Pre- and post-fire values for alkalinity (a), hardness (b) in Seaman Reservoir.........................................................................................................22
Figure 26. Pre- and post-fire values for Total Dissolved Solids (a), turbidity (b) and chlorophyll-a (c) in Seaman Reservoir ...........................................................22
Figure 27. Dissolved oxygen concentrations at the top, middle and bottom of Seaman Reservoir for 2008- 2012................................................................................23
Figure 28. Pre- and post-fire concentrations of Total Organic Carbon (TOC) in Seaman Reservoir.........................................................................................................23
Figure 29. Pre- and post-fire values for ammonia (a), nitrate (b) and nitrite (c), Total Kjeldahl Nitrogen (TKN) (d), ortho-phosphate (e) and Total phosphorus (f) in Seaman Reservoir .......................................................................................24
Sept. 5, 2013 - Wildfire Effects on Water Quality


1.0 Introduction
The two largest wildfires in the history of the Cache la Poudre River Watershed occurred
during the summer months of 2012, resulting in extensive loss of forest and shrub lands,
altered hydrology and changes water quality.
This report provides a detailed discussion on the following topics:
fire activity and affected areas,
observed and anticipated impacts on watershed processes,
key uncertainties related to water quality, and
mitigation and emergency response measures.
Results of 2012 post-fire water quality monitoring on the Poudre River and Seaman
Reservoir are presented Sections 2 and 3.
1.1 Fire Activity and Affected Areas
The Hewlett Fire started on May 14, 2012 and burned until May 22, after flames from a
camping stove ignited dry grass in the Hewlett Gulch area. The fire burned 7,685 acres in
dense Ponderosa Pine forest stands on the north-facing slopes, as well as shrub and
grasslands that occupied much of the south-facing aspects. The burned area includes sub-
watersheds that drain both to the Mainstem Poudre and into Seaman Reservoir on the
North Fork Poudre River.
The High Park Fire was ignited by lightning strike on June 9th and declared contained on
July 2nd. In total, the fire burned 87,415 acres of primarily forested landscape,
characterized by Ponderosa and Lodgepole Pine at the lower elevations and mixed
conifer species at the upper elevations. To a lesser degree, shrublands, grasslands and
riparian areas were also
impacted (Figure 1). The burned
area includes numerous sub-
drainages that are tributary to the
Mainstem Poudre River and the
South Fork of the Poudre River.
The two fires were in close
proximity to each other; the
northeastern edge of the High
Park Fire shares the southern
boundary of the Hewlett Fire,
creating a contiguous burned
area approximately 95,000 acres
in size (Figure 2). In total, the
High Park Fire destroyed 259
homes and cabins.
No homes were damaged in the
Hewlett Fire.
Figure 1. Hewlett Fire burning in the riparian zone of the
Poudre River.
Sept. 5, 2013 - Wildfire Effects on Water Quality 1

Approximately 400 acres along the eastern edge of the High Park Fire burned within a
direct drainage area for Horsetooth Reservoir, the second of the two main sources of raw
drinking water supplies for the City of Fort Collins and Greeley and the Tri-Districts.
Impacts to that drainage area were relatively limited and will not be included in the
discussion for the purposes of this report.
Figure 2. Map of the Upper CLP monitoring locations and the area affected by the Hewlett, High Park and
Galena Fires.
1.2 Fire Effects on Forest Hydrology
The hydrology of forested ecosystems is largely controlled by the degree to which
precipitation is intercepted by surface materials and the rate at which that precipitation
infiltrates into the underlying soils. Tree canopy, surface vegetation and accumulated
surface organic matter increase infiltration rates by slowing the velocity and dispersing
the impact of water droplets, while the organic matter on the forest floor absorbs soil
moisture and provides a physical barrier against erosion. As long as infiltration exceeds
the rate of precipitation during snow or rain events, the hydrology will be dominated by
subsurface flow.
When surface vegetation is removed, by fire or other disturbance, the capacity to
intercept precipitation and retain moisture is significantly diminished. Under these
conditions, the hydrology can quickly shift to overland versus subsurface flow pathways.
The significance of a shift in forest hydrology from subsurface to overland flow is the
tendency for overland flows to move quickly and consolidate along the paths of least
resistance. The increase in flow volume and velocity dramatically increases the erosive
Sept. 5, 2013 - Wildfire Effects on Water Quality 2

capacity, which can quickly transform small ephemeral channels into active conduits for
large sediment and debris flows following a fire (Moody and Martin, 2001).
A report issued by the Natural Resource Conservation Service (NRCS) on the increased
flood potential in the High Park Fire burn area (Yochum, 2012) identified a substantial
increase in the risks associated with flash flooding in several drainages in response to the
shift to overland flow hydrology. The report outlines results of hydrologic model (HEC-
HMS) simulations and predicts a much “flashier” system with substantial increases in
peak flows and total flood flow volume, increased sediment transport, and channel
destabilization in key drainages within the High Park Burn area. These hydrologic
responses are expected to persist over the next several years.
Figure 3. Pre-fire and post-fire
discharge (cfs) in four key
drainages in the High Park burn
area under a simulated 10-yr rain
event (Yochum, 2012).
A 2012 USGS analysis modeled the probabilities and volume of debris flows in all the
identified drainages in the High Park Fire area under 2-yr, 10-yr, and 25-yr rain event
scenarios (Verdin et al. 2012). Model results indicate that for the small and intermediate
sized basins, the likelihood and size of debris flow increases with the size of the rain
event. In contrast, the largest basins (Hewlett and South Fork) had low probabilities of
producing debris flows even for large rain event scenarios. For example, results suggest
that the South Fork of the Poudre is capable of producing debris flows of over 100,000
m3, but the probability of such an event is only 4% and 6%, for 10-yr and 25-yr rain
events, respectively.
Sept. 5, 2013 - Wildfire Effects on Water Quality 3
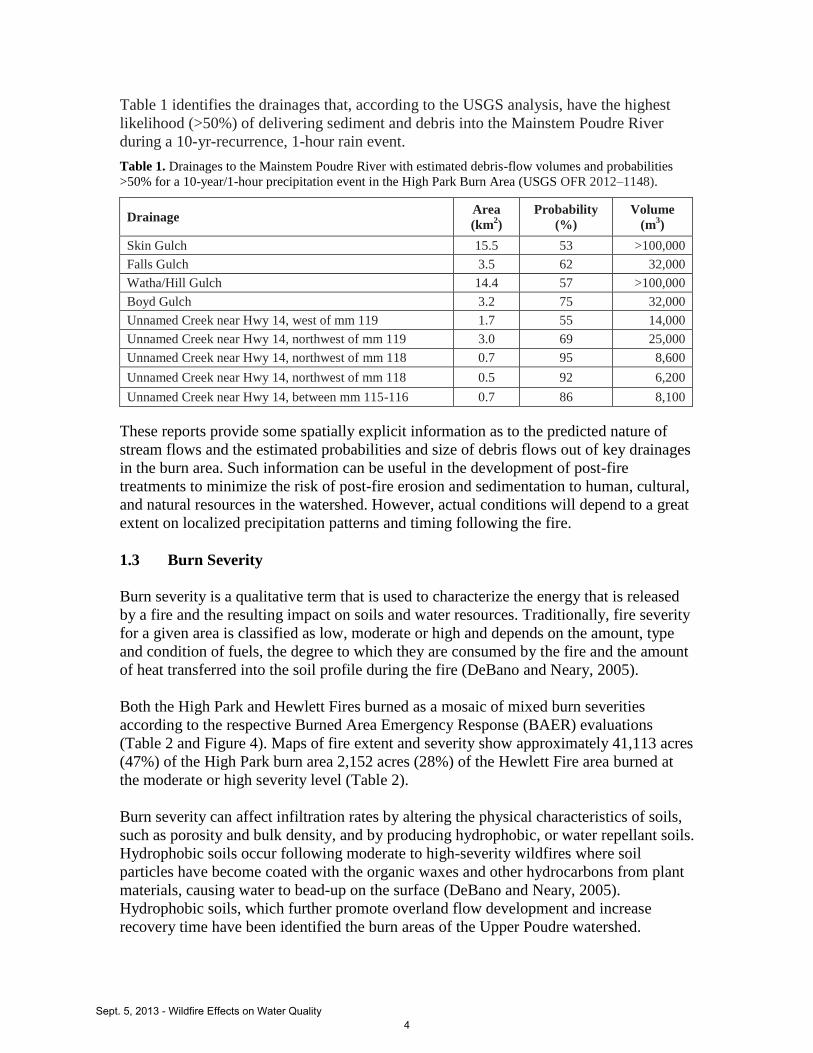
Table 1 identifies the drainages that, according to the USGS analysis, have the highest
likelihood (>50%) of delivering sediment and debris into the Mainstem Poudre River
during a 10-yr-recurrence, 1-hour rain event.
Table 1. Drainages to the Mainstem Poudre River with estimated debris-flow volumes and probabilities
>50% for a 10-year/1-hour precipitation event in the High Park Burn Area (USGS OFR 2012–1148).
Drainage Area
(km2)
Probability
(%)
Volume
(m3)
Skin Gulch 15.5 53 >100,000
Falls Gulch 3.5 62 32,000
Watha/Hill Gulch 14.4 57 >100,000
Boyd Gulch 3.2 75 32,000
Unnamed Creek near Hwy 14, west of mm 119 1.7 55 14,000
Unnamed Creek near Hwy 14, northwest of mm 119 3.0 69 25,000
Unnamed Creek near Hwy 14, northwest of mm 118 0.7 95 8,600
Unnamed Creek near Hwy 14, northwest of mm 118 0.5 92 6,200
Unnamed Creek near Hwy 14, between mm 115-116 0.7 86 8,100
These reports provide some spatially explicit information as to the predicted nature of
stream flows and the estimated probabilities and size of debris flows out of key drainages
in the burn area. Such information can be useful in the development of post-fire
treatments to minimize the risk of post-fire erosion and sedimentation to human, cultural,
and natural resources in the watershed. However, actual conditions will depend to a great
extent on localized precipitation patterns and timing following the fire.
1.3 Burn Severity
Burn severity is a qualitative term that is used to characterize the energy that is released
by a fire and the resulting impact on soils and water resources. Traditionally, fire severity
for a given area is classified as low, moderate or high and depends on the amount, type
and condition of fuels, the degree to which they are consumed by the fire and the amount
of heat transferred into the soil profile during the fire (DeBano and Neary, 2005).
Both the High Park and Hewlett Fires burned as a mosaic of mixed burn severities
according to the respective Burned Area Emergency Response (BAER) evaluations
(Table 2 and Figure 4). Maps of fire extent and severity show approximately 41,113 acres
(47%) of the High Park burn area 2,152 acres (28%) of the Hewlett Fire area burned at
the moderate or high severity level (Table 2).
Burn severity can affect infiltration rates by altering the physical characteristics of soils,
such as porosity and bulk density, and by producing hydrophobic, or water repellant soils.
Hydrophobic soils occur following moderate to high-severity wildfires where soil
particles have become coated with the organic waxes and other hydrocarbons from plant
materials, causing water to bead-up on the surface (DeBano and Neary, 2005).
Hydrophobic soils, which further promote overland flow development and increase
recovery time have been identified the burn areas of the Upper Poudre watershed.
Sept. 5, 2013 - Wildfire Effects on Water Quality 4

High Park Fire
Burn Severity Acres Percent of Burned Area
Unburned 14,000 16%
Low 32,302 37%
Moderate 35,399 40%
High 5,714 7%
Total 87,415
Hewlett Fire
Burn Severity Acres Percent of Burned Area
Unburned 67 1%
Low 5,466 71%
Moderate 639 8%
High 1,513 20%
Total 7,685
Table 2. Burn severity and acreage for
High Park and Hewlett Fires.
Figure 4. Soil burn severity map of 2012 High Park and Hewlett Fires in the Upper Cache la Poudre
watershed.
Sept. 5, 2013 - Wildfire Effects on Water Quality 5

1.4 Effects of Sediment Loading on Poudre River Water Quality
Ultimately, it was not until precipitation fell on the burned landscape that the effects of
the fires on vegetation and soils translated to changes in hydrology and water quality.
Immediately following the containment of the 2012 fires, convective summertime
thunderstorm activity began to occur over the burn area. These thunderstorms can be
extremely localized and intense, as demonstrated by the July 7th storm event which
delivered 1-2 inches of rain in some areas of the burn scar, over a short amount of time
(CoCoRaHS). Consistent with predictions, mudslides and debris flows occurred in many
burned drainages during this rain event and others throughout the summer, delivering
massive quantities of ash and sediment into the South Fork and Mainstem of the Poudre
River (Figure 5) as well as into Seaman Reservoir. Notably, during the first season
following the fire, even small, localized precipitation events proved sufficient to cause
dramatic changes in water quality and streamflow as shown by the numerous turbidity
spikes shown in Figure 6.
Notably, the spike observed on September 28, 2012 occurred not as a result of
precipitation event, but as a result of a water release from an upstream reservoir. The
release of water effectively elevated the river level and resulted in a re-suspension of fire
sediments that had settled on the river banks during earlier summer storms. This event
illustrates the extreme sensitivity of river water quality immediately following the fires.
The numerous alluvial fans that are evident along the Hwy 14 indicate actively eroding
channels that will continue to provide sediment and debris to the river until vegetation
recovers sufficiently to stabilize the hillslopes higher in the drainage areas. The rate of
vegetation establishment will vary by location and aspect, as it depends on the remaining
seed bank, the available soil nutrients and condition as well as how much precipitation
the area receives in the coming year. In some areas where the soil seed bank remained,
new grass and forb cover established by the end of the summer; many other areas
remained bare (Figures 7, 8 and 9).
Figure 6. Turbidity (black solid line) and conductivity
(red solid line) record from early warning system sonde
located approximately four miles above the Fort Collins
water supply intake facility.
Figure 5. Highly turbid Poudre River during the
July 7 rain event.
Sept. 5, 2013 - Wildfire Effects on Water Quality 6

Water quality samples were collected for
three storm events during the summer of
2012 in order to gain an understanding
of the dissolved and particulate
constituents in runoff from these fires.
This sampling was beyond the scope of
routine monthly sampling conducted as
part of the cooperative Upper Cache la
Poudre Monitoring Program, which is
not designed to capture the impacts of
short duration events. Storm samples
were collected on June 26th
(Hewlett
Fire runoff), July 7th
, and July 25th
and
were analyzed for metals, nutrients,
major ions, turbidity, total dissolved
solids (TDS), pH and conductivity. The
results of the 2012 storm sampling are discussed in Section 2.0.
To help ensure the safety of field personnel and improve the likelihood of capturing
storm events, an automatic sampler was installed at the Fort Collins intake facility in
2013. The auto-sampler can be triggered remotely from the Fort Collins Water Treatment
Facility and capture samples from the Poudre River during storm events.
Figure 7. Post-fire vegetation recovery in meadows
areas of the South Fork Poudre basin, August 2012.
Figure 8. Debris flow across Highway 14in
the High Park burn area following a rain
event during summer of 2012.
Figure 9. Woody debris accumulation in the
lower segment of the South Fork above the
confluence with the Mainstem Poudre September
2012.
Sept. 5, 2013 - Wildfire Effects on Water Quality 7
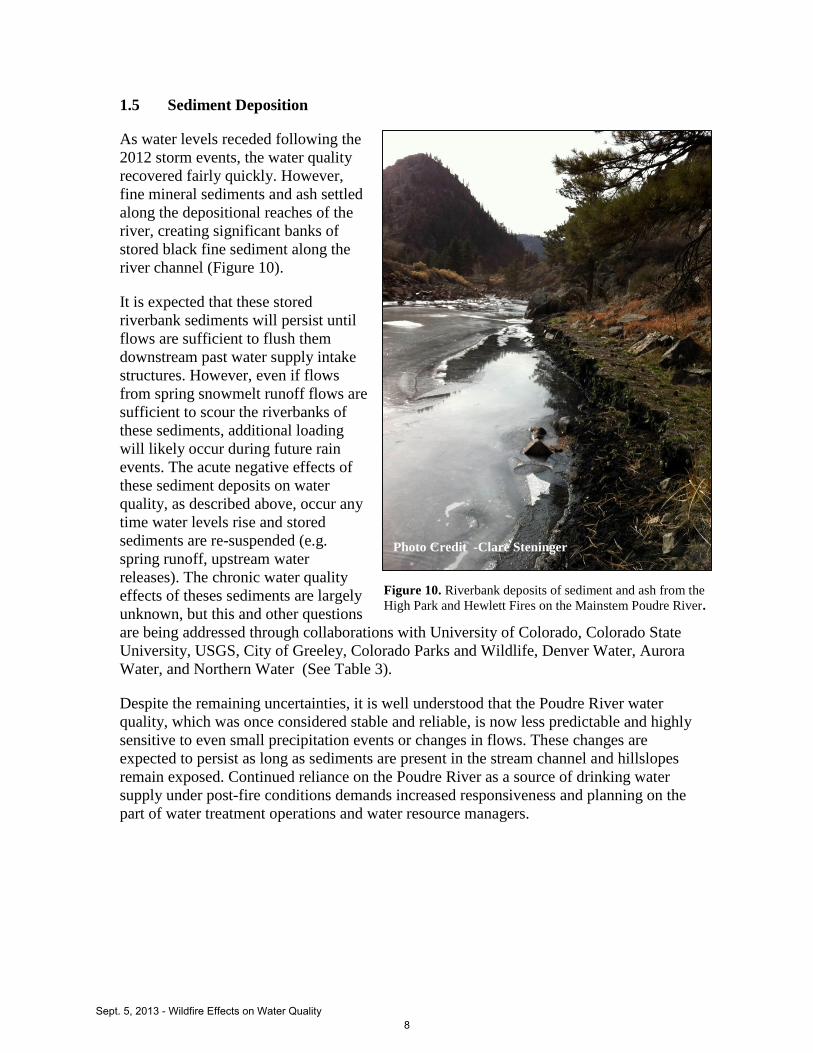
1.5 Sediment Deposition
As water levels receded following the
2012 storm events, the water quality
recovered fairly quickly. However,
fine mineral sediments and ash settled
along the depositional reaches of the
river, creating significant banks of
stored black fine sediment along the
river channel (Figure 10).
It is expected that these stored
riverbank sediments will persist until
flows are sufficient to flush them
downstream past water supply intake
structures. However, even if flows
from spring snowmelt runoff flows are
sufficient to scour the riverbanks of
these sediments, additional loading
will likely occur during future rain
events. The acute negative effects of
these sediment deposits on water
quality, as described above, occur any
time water levels rise and stored
sediments are re-suspended (e.g.
spring runoff, upstream water
releases). The chronic water quality
effects of theses sediments are largely
unknown, but this and other questions
are being addressed through collaborations with University of Colorado, Colorado State
University, USGS, City of Greeley, Colorado Parks and Wildlife, Denver Water, Aurora
Water, and Northern Water (See Table 3).
Despite the remaining uncertainties, it is well understood that the Poudre River water
quality, which was once considered stable and reliable, is now less predictable and highly
sensitive to even small precipitation events or changes in flows. These changes are
expected to persist as long as sediments are present in the stream channel and hillslopes
remain exposed. Continued reliance on the Poudre River as a source of drinking water
supply under post-fire conditions demands increased responsiveness and planning on the
part of water treatment operations and water resource managers.
Figure 10. Riverbank deposits of sediment and ash from the
High Park and Hewlett Fires on the Mainstem Poudre River.
Photo Credit -Clare Steninger
Sept. 5, 2013 - Wildfire Effects on Water Quality 8

1.6 Early Warning System
An early warning alert system is key to being able to respond quickly to rapid changes in
Poudre River water quality. To this end, a multi-parameter water quality sonde was
installed in the river approximately four miles upstream of the Fort Collins water supply
intake facility, immediately following the Hewlett Fire (Figure 11).
The purpose of this installation is to provide the Cities of Fort Collins and Greeley and
the Tri-Districts water treatment operations adequate warning time to bypass ash- and
sediment-laden water at the intake facility in the event of a storm. The instrument
provides real-time measurements of turbidity, specific conductance and temperature and
has been programmed to send alerts when significant deviations from background levels
are detected (See Figure 6 for example of graphical record). The turbidity and
conductivity data generated from the sonde also serve as a proxy record of storms and
other events that affect the water level in the river.
1.7 Pleasant Valley Pre-sedimentation Basin
To address the water quality issues from the 2012 wildfires, Fort Collins Utilities began a
fast-tracked design and construction project of improvements to the turnout structure for
the Pleasant Valley Pipeline (PVP). The PVP is located adjacent to the Munroe Canal,
due north of the mouth of the Poudre Canyon. The resulting project consists of a new
presedimentation basin located on property owned by the Northern Colorado Water
Conservancy District (NCWCD). The Tri-Districts and the City share the capacity in the
PVP during the summer months. The project took 4-1/2 months from design to
construction completion.
This project was necessary to address the removal of sediment in the Poudre River that
resulted from the High Park and Hewlett Fires during the summer of 2012. While the
intake structure for the pipeline currently is equipped with mechanical screening
Figure 11. A multi-parameter water
quality sonde provides real-time
turbidity, conductivity and temperature
measurements of the river as part of City
of Fort Collins early-warning system.
Photo credit - Chris Lochra
Sept. 5, 2013 - Wildfire Effects on Water Quality 9

equipment, the screen will not function properly when faced with the large amount of
sediment that is expected in the raw river water.
The presedimentation basin will reduce the variability of the Poudre River water quality
prior to arriving at the water treatment facility, thereby increasing the efficiency of the
treatment process. The basin will also aid in the removal of debris during normal spring
snowmelt runoff, when pine needles and other debris move quickly in the river.
1.8 Fire Effects Mitigation
In the aftermath of each of the 2012 fires, an interagency Burned Area Emergency
Response (BAER) Team was assembled, with resource specialists from the Natural
Resources Conservation Service (NRCS), Larimer County, Colorado Department of
Transportation (CDOT) and the U.S. Forest Service (USFS). This team evaluated the
risks to life, property, natural and cultural resources resulting from the post-fire effects
and identifies treatment options for mitigating those risks. In this process, the USFS
assumes responsibility for mitigating fire effects on USFS lands, while the NRCS worked
with private landowners and other local participants, including the City of Fort Collins,
City of Greeley, and Larimer County to identify treatment priorities. Funding provided by
the participants is eligible for a federal match through the NRCS Emergency Watershed
Protection (EWP) Program.
Following a fire, debris flow originates from channel scour; however, the majority of the
water originates from hillslope runoff. Therefore, first focus of post-fire mitigation is
often to control hillslope runoff, with in-channel controls as secondary efforts.
Accordingly, the primary treatment identified through the High Park Fire BAER process
was the aerial application of certified weed-free agricultural straw mulch to erosion prone
hillslopes. Wood shred mulch was also identified as a treatment for high severity burn
areas on steep slopes where the lighter agricultural straw was especially susceptible to
being moved around by winds. The intent of both straw and wood mulch is to lend
stability to fire-affected soils by reducing the impact of precipitation and helps retain soil
moisture which facilitates seed establishment. Through the BAER process, the USFS
identified 5,581 acres of federal land for mulching. In 2012, 881 acres of wood-shred
mulch was applied, and an additional 4,700 additional acres of aerial straw mulching was
completed in 2013. In addition, the NRCS identified 5,600 acres of private land for
treatment – approximately 3,000 acres of which was treated with aerial application of
straw mulch in 2012. Additional wood shred mulching and hillslope treatments are
planned on private lands in 2013.
1.9 Key Uncertainties
In effect, the fire was a major destabilizing force within the watershed. How quickly the
system will recover remains uncertain. As the recovery process continues, the Cities of
Fort Collins and Greeley and the Tri-Districts must continue to rely on the Poudre River
as an important municipal water supply. To understand future challenges related to water
quality as well as cost-effectiveness of post-fire treatment options, water providers have
Sept. 5, 2013 - Wildfire Effects on Water Quality 10
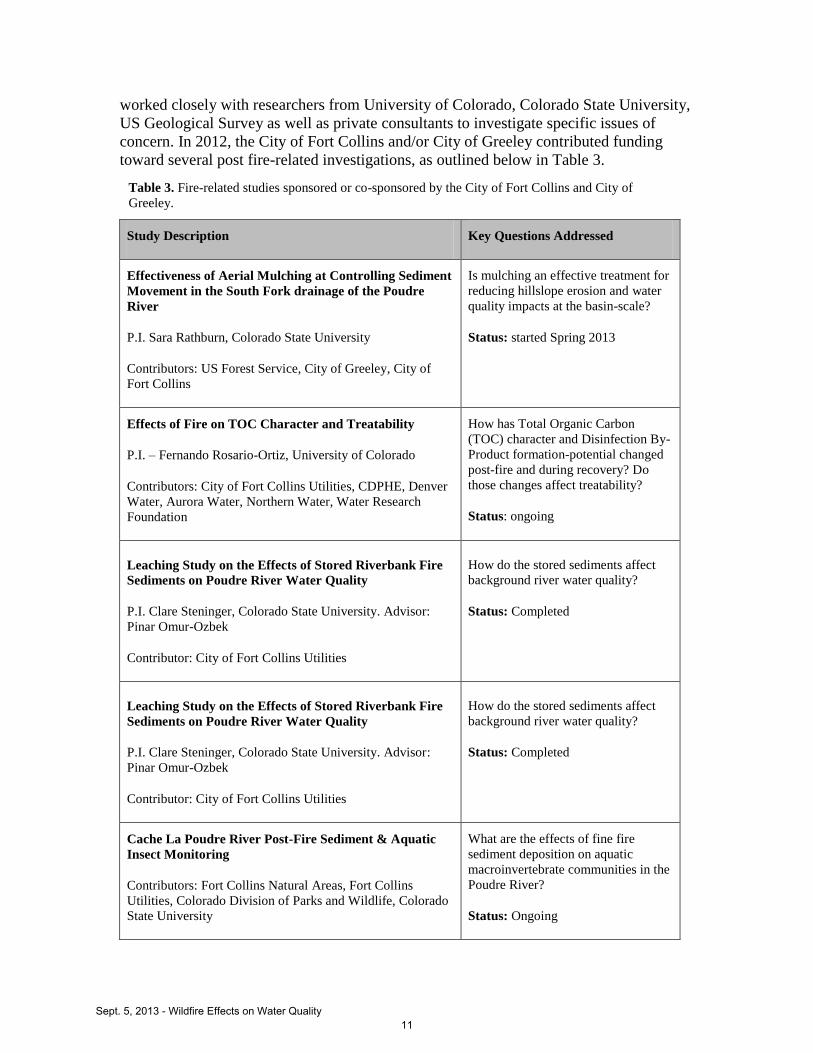
worked closely with researchers from University of Colorado, Colorado State University,
US Geological Survey as well as private consultants to investigate specific issues of
concern. In 2012, the City of Fort Collins and/or City of Greeley contributed funding
toward several post fire-related investigations, as outlined below in Table 3.
Study Description Key Questions Addressed
Effectiveness of Aerial Mulching at Controlling Sediment
Movement in the South Fork drainage of the Poudre
River
P.I. Sara Rathburn, Colorado State University
Contributors: US Forest Service, City of Greeley, City of
Fort Collins
Is mulching an effective treatment for
reducing hillslope erosion and water
quality impacts at the basin-scale?
Status: started Spring 2013
Effects of Fire on TOC Character and Treatability
P.I. – Fernando Rosario-Ortiz, University of Colorado
Contributors: City of Fort Collins Utilities, CDPHE, Denver
Water, Aurora Water, Northern Water, Water Research
Foundation
How has Total Organic Carbon
(TOC) character and Disinfection By-
Product formation-potential changed
post-fire and during recovery? Do
those changes affect treatability?
Status: ongoing
Leaching Study on the Effects of Stored Riverbank Fire
Sediments on Poudre River Water Quality
P.I. Clare Steninger, Colorado State University. Advisor:
Pinar Omur-Ozbek
Contributor: City of Fort Collins Utilities
How do the stored sediments affect
background river water quality?
Status: Completed
Leaching Study on the Effects of Stored Riverbank Fire
Sediments on Poudre River Water Quality
P.I. Clare Steninger, Colorado State University. Advisor:
Pinar Omur-Ozbek
Contributor: City of Fort Collins Utilities
How do the stored sediments affect
background river water quality?
Status: Completed
Cache La Poudre River Post-Fire Sediment & Aquatic
Insect Monitoring
Contributors: Fort Collins Natural Areas, Fort Collins
Utilities, Colorado Division of Parks and Wildlife, Colorado
State University
What are the effects of fine fire
sediment deposition on aquatic
macroinvertebrate communities in the
Poudre River?
Status: Ongoing
Table 3. Fire-related studies sponsored or co-sponsored by the City of Fort Collins and City of
Greeley.
Sept. 5, 2013 - Wildfire Effects on Water Quality 11

Sept. 5, 2013 - Wildfire Effects on Water Quality 12

2.0 Results of Storm Event and Routine River Water Quality Sampling
Improvements in water quality are expected to follow the process of watershed recovery,
although there is no certainty as to how long recovery will take, what specific changes in
water quality can be expected along the way or if it will even return to pre-fire condition.
The availability of baseline water quality data collected as part of the Upper CLP
Cooperative Monitoring Program from 2008-2012 has allowed a quantitative comparison
of pre- and post-fire water quality. Moving forward, routine and targeted monitoring will
be essential to understanding the types of changes that have occurred and will continue to
occur as watershed recovery proceeds.
In addition to routine water quality sampling, there was a focused effort on monitoring
water quality during storm events, as storm samples indicate the progress of future
watershed recovery (e.g. hillslope stability, hydrology, forest nutrient cycling). As
previously mentioned, summertime convective thunderstorm activity began immediately
following the containment of the 2012 wildfires and storm samples were collected on
three occasions: June 27, July 6 and July 25.
The graphical presentations of pre- and post-fire data include routine monitoring data
from the Poudre above the the North Fork (PNF), situated at the Fort Collins water
supply intake. The results of the storm samples collected in 2012 near PNF are also
included. Samples were analyzed by the Fort Collins WQL for nutrients, metals,
hardness, and Total Dissolved Solids (TDS). The Fort Collins Water Treatment Facility
Process Control Lab provided measurements for pH, Conductivity and Turbidity and
Total Organic Carbon (TOC) data were provided by the US Geological Survey.
2.1 Conductivity, Alkalinity, Hardness and pH
Conductivity is an index of dissolved ionic solids in the water and hardness is an index of
the total calcium and magnesium in the water. Alkalinity is a measure of the effective
acid buffering capacity of the water, and is derived, in large part, from the dissociation of
mineral carbonates (CO3-), bicarbonates (HCO3
-) and hydroxides (OH
-). Conductivity,
hardness and alkalinity are influenced by the local geology as well as the dissolved
constituents derived from other watershed activities. Across the watershed, these three
parameters along with pH generally track closely, with minimum values occurring during
peak run-off when the concentrations of all dissolved constituents are diluted by large
volume streamflows, with higher values occurring at times of low streamflow (Figures
12.a -12.d).
Late summer values for all four parameters were slightly elevated following the fires in
background, non-storm event samples, but were within the range of annual variability
observed from 2008 – 2012 (Figures 12.a & 12.b). Following storm events, hardness,
conductivity, and pH values were substantially higher than in post-fire background
samples, but concentrations returned to background levels following storm events.
Sept. 5, 2013 - Wildfire Effects on Water Quality 13

0255075
100125150
01/0
1/08
08/1
6/08
04/0
1/09
11/1
6/09
07/0
2/10
02/1
5/11
10/0
2/11
05/1
7/12
12/3
1/12
mg/
L
TDS
Elevated hardness, conductivity, and pH following wildfires is well documented (DeBano
et al, 1998; Marion et al, 1991) and is likely due to the concentration of elements such as
calcium and magnesium in the surface ash and sediments that were initially washed into
the river.
Figure 12(a-d). Pre- and post-fire alkalinity (a), hardness (b), conductance (c) and pH (d) values at PNF
with storm event concentrations.
2.2 Total Dissolved Solids & Turbidity
The concentrations of total dissolved solids
(TDS) in the Poudre River (PNF) range
from near 20 to 80 mg/L during the years
2008-2012 (Figure 13 and closely follow
the hydrograph. Peak concentrations occur
during spring snowmelt runoff, followed
by a steep decline during the summer
months and a slight increase in
concentrations again during late fall.
Following the fire, concentrations spiked
during storm events, but background
concentrations do not indicate any
sustained post-fire impact on TDS
concentrations in the Poudre River (Figure
13).
0102030405060
01/0
1/08
08/1
6/08
04/0
1/09
11/1
5/09
07/0
2/10
02/1
5/11
10/0
1/11
05/1
6/12
12/3
1/12
mg
/L
Alkalinity
010203040506070
01/0
1/08
08/1
6/08
04/0
1/09
11/1
5/09
07/0
2/10
02/1
5/11
10/0
1/11
05/1
6/12
12/3
1/12
mg
/L
Hardness
020406080
100120
01/0
1/08
08/1
6/08
04/0
1/09
11/1
5/09
07/0
2/10
02/1
5/11
10/0
1/11
05/1
6/12
12/3
1/12
uS
/cm
Specific Conductance
66.5
77.5
88.5
01/0
1/08
08/1
6/08
04/0
1/09
11/1
5/09
07/0
2/10
02/1
5/11
10/0
1/11
05/1
6/12
12/3
1/12
pH
pH
12.a 12.b
12.c
Figure 13. Pre- and post-fire Total Dissolved Solids
(TDS) values at PNF with storm event concentrations.
12.d
13
Sept. 5, 2013 - Wildfire Effects on Water Quality 14
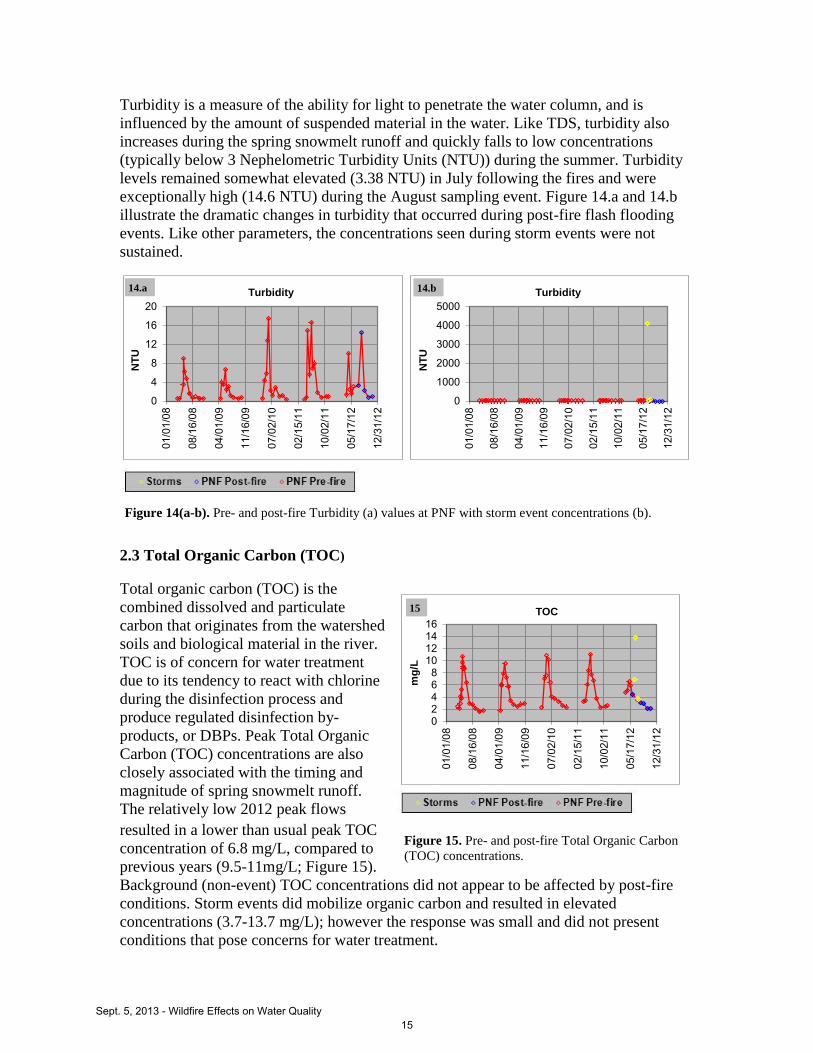
Figure 14(a-b). Pre- and post-fire Turbidity (a) values at PNF with storm event concentrations (b).
Figure 15. Pre- and post-fire Total Organic Carbon
(TOC) concentrations.
Turbidity is a measure of the ability for light to penetrate the water column, and is
influenced by the amount of suspended material in the water. Like TDS, turbidity also
increases during the spring snowmelt runoff and quickly falls to low concentrations
(typically below 3 Nephelometric Turbidity Units (NTU)) during the summer. Turbidity
levels remained somewhat elevated (3.38 NTU) in July following the fires and were
exceptionally high (14.6 NTU) during the August sampling event. Figure 14.a and 14.b
illustrate the dramatic changes in turbidity that occurred during post-fire flash flooding
events. Like other parameters, the concentrations seen during storm events were not
sustained.
2.3 Total Organic Carbon (TOC)
Total organic carbon (TOC) is the
combined dissolved and particulate
carbon that originates from the watershed
soils and biological material in the river.
TOC is of concern for water treatment
due to its tendency to react with chlorine
during the disinfection process and
produce regulated disinfection by-
products, or DBPs. Peak Total Organic
Carbon (TOC) concentrations are also
closely associated with the timing and
magnitude of spring snowmelt runoff.
The relatively low 2012 peak flows
resulted in a lower than usual peak TOC
concentration of 6.8 mg/L, compared to
previous years (9.5-11mg/L; Figure 15).
Background (non-event) TOC concentrations did not appear to be affected by post-fire
conditions. Storm events did mobilize organic carbon and resulted in elevated
concentrations (3.7-13.7 mg/L); however the response was small and did not present
conditions that pose concerns for water treatment.
0
4
8
12
16
20
01/0
1/08
08/1
6/08
04/0
1/09
11/1
6/09
07/0
2/10
02/1
5/11
10/0
2/11
05/1
7/12
12/3
1/12
NT
U
Turbidity
0
1000
2000
3000
4000
5000
01/0
1/08
08/1
6/08
04/0
1/09
11/1
6/09
07/0
2/10
02/1
5/11
10/0
2/11
05/1
7/12
12/3
1/12
NT
U
Turbidity
02468
10121416
01/0
1/08
08/1
6/08
04/0
1/09
11/1
6/09
07/0
2/10
02/1
5/11
10/0
2/11
05/1
7/12
12/3
1/12
mg
/L
TOC
14.a 14.b
15
Sept. 5, 2013 - Wildfire Effects on Water Quality 15

Figures 16 (a-b). Pre- and post-fire values (a) with storm event concentrations (b) at PNF for ammonia.
2.4 Nutrients
In an unburned forested system, nutrients are made available to plants via microbial and
physical decomposition of soil organic matter. In effect, the C, N, and P bound within
the organic matter is slowly liberated and transformed into biologically available forms
that subsequently can become dissolved in subsurface water (soil solution). Fire results in
instantaneous decomposition of forest floor organic matter, where during combustion, N
and C are lost to the atmosphere by volatilization, primarily as N2, CO2 and other volatile
organic compounds (Debano et al, 1998, Debano 1991). At high combustion
temperatures nearly all N is lost as N2, whereas at lower burning temperatures, some of
the N remains on the soil surface as partially consumed organic matter or is converted to
NH4 (Neary et al., 2005). Typically, less phosphorus is volatilized during a fire compared
to nitrogen (Raison et al, 1985), resulting in more available P in the ash. If left
undisturbed, these transformed nutrients will eventually become available for new plant
growth; however, if these surface materials and the underlying mineral soils are subject to
erosion, as they were following the 2012 fires in the Upper CLP watershed, the
associated nutrients are transferred to the aquatic system in both dissolved and particulate
forms.
Following the 2012 wildfires, the largest post-fire responses were observed for ammonia
(NH3) (indicative of NH4 concentrations), Total Kjeldahl Nitrogen (TKN), ortho-P and
Total P (Figures 16-20). Concentrations of these nutrients remained elevated in post-fire
background samples to different degrees, with exceptionally high concentrations
observed during and following storm events. It is expected that the higher than normal
background concentrations and strong pulses following runoff events are due to the
movement hillslope materials into the river. It is notable that background nitrate (NO3)
concentrations in the water did not change following the fire and that runoff events
produced only very small changes in concentrations. Nitrate is a highly mobile, dissolved
form of nitrogen which in an intact forested system is found primarily in the soil solution
and is made available to aquatic systems through subsurface flow pathways. The lack of
nitrate response immediately following the fires is possibly due to the cessation of nitrate
production in the soils (Neary et al., 2005) as well as a switch from subsurface flow
pathways to predominantly overland flow (Bladon et al, 2008).
05
1015202530
01/0
1/08
08/1
6/08
04/0
1/09
11/1
6/09
07/0
2/10
02/1
5/11
10/0
2/11
05/1
7/12
12/3
1/12
ug
/L
Ammonia
0
100
200
300
400
500
01/0
1/08
08/1
6/08
04/0
1/09
11/1
6/09
07/0
2/10
02/1
5/11
10/0
2/11
05/1
7/12
12/3
1/12
ug
/L
Ammonia 16.a 16.b
Sept. 5, 2013 - Wildfire Effects on Water Quality 16
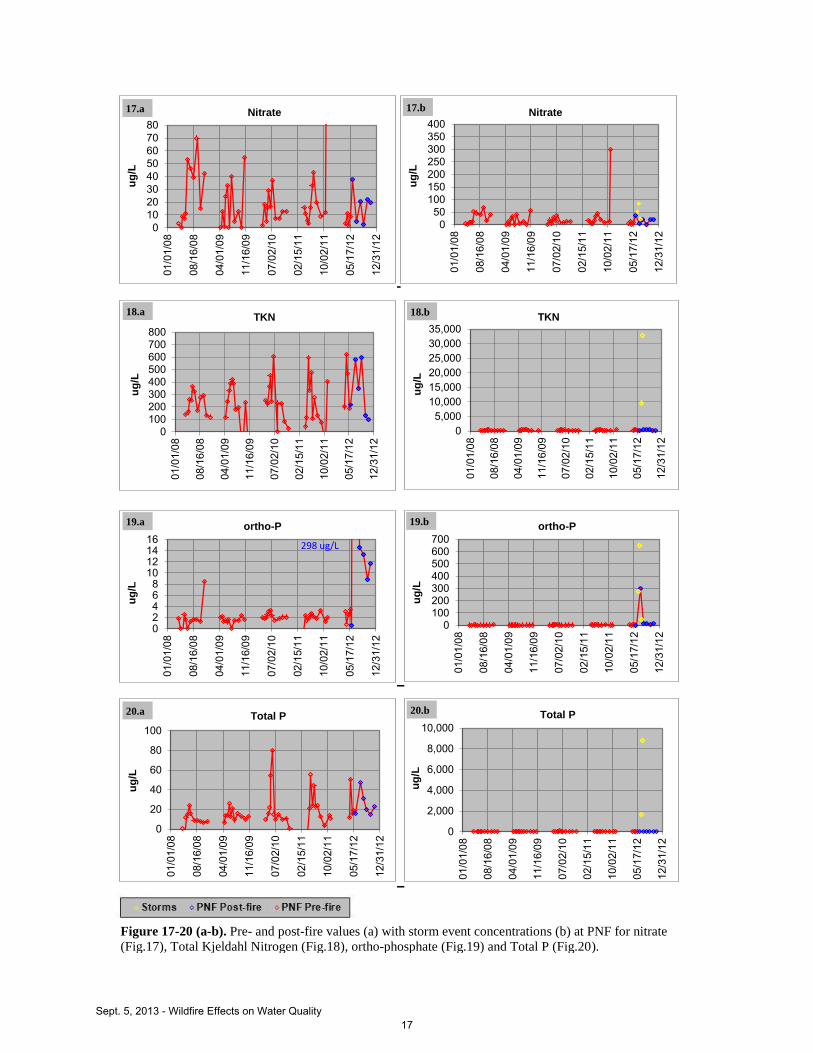
Figure 17-20 (a-b). Pre- and post-fire values (a) with storm event concentrations (b) at PNF for nitrate
(Fig.17), Total Kjeldahl Nitrogen (Fig.18), ortho-phosphate (Fig.19) and Total P (Fig.20).
01020304050607080
01/0
1/08
08/1
6/08
04/0
1/09
11/1
6/09
07/0
2/10
02/1
5/11
10/0
2/11
05/1
7/12
12/3
1/12
ug
/L
Nitrate
050
100150200250300350400
01/0
1/08
08/1
6/08
04/0
1/09
11/1
6/09
07/0
2/10
02/1
5/11
10/0
2/11
05/1
7/12
12/3
1/12
ug
/L
Nitrate
0100200300400500600700800
01/0
1/08
08/1
6/08
04/0
1/09
11/1
6/09
07/0
2/10
02/1
5/11
10/0
2/11
05/1
7/12
12/3
1/12
ug
/L
TKN
05,000
10,00015,00020,00025,00030,00035,000
01/0
1/08
08/1
6/08
04/0
1/09
11/1
6/09
07/0
2/10
02/1
5/11
10/0
2/11
05/1
7/12
12/3
1/12
ug
/L
TKN
02468
10121416
01/0
1/08
08/1
6/08
04/0
1/09
11/1
6/09
07/0
2/10
02/1
5/11
10/0
2/11
05/1
7/12
12/3
1/12
ug
/L
ortho-P
298 ug/L
0100200300400500600700
01/0
1/08
08/1
6/08
04/0
1/09
11/1
6/09
07/0
2/10
02/1
5/11
10/0
2/11
05/1
7/12
12/3
1/12
ug
/L
ortho-P
0
20
40
60
80
100
01/0
1/08
08/1
6/08
04/0
1/09
11/1
6/09
07/0
2/10
02/1
5/11
10/0
2/11
05/1
7/12
12/3
1/12
ug
/L
Total P
0
2,000
4,000
6,000
8,000
10,000
01/0
1/08
08/1
6/08
04/0
1/09
11/1
6/09
07/0
2/10
02/1
5/11
10/0
2/11
05/1
7/12
12/3
1/12
ug
/L
Total P
17.a 17.b
18.a 18.b
19.b 19.a
20.a 20.b
Sept. 5, 2013 - Wildfire Effects on Water Quality 17
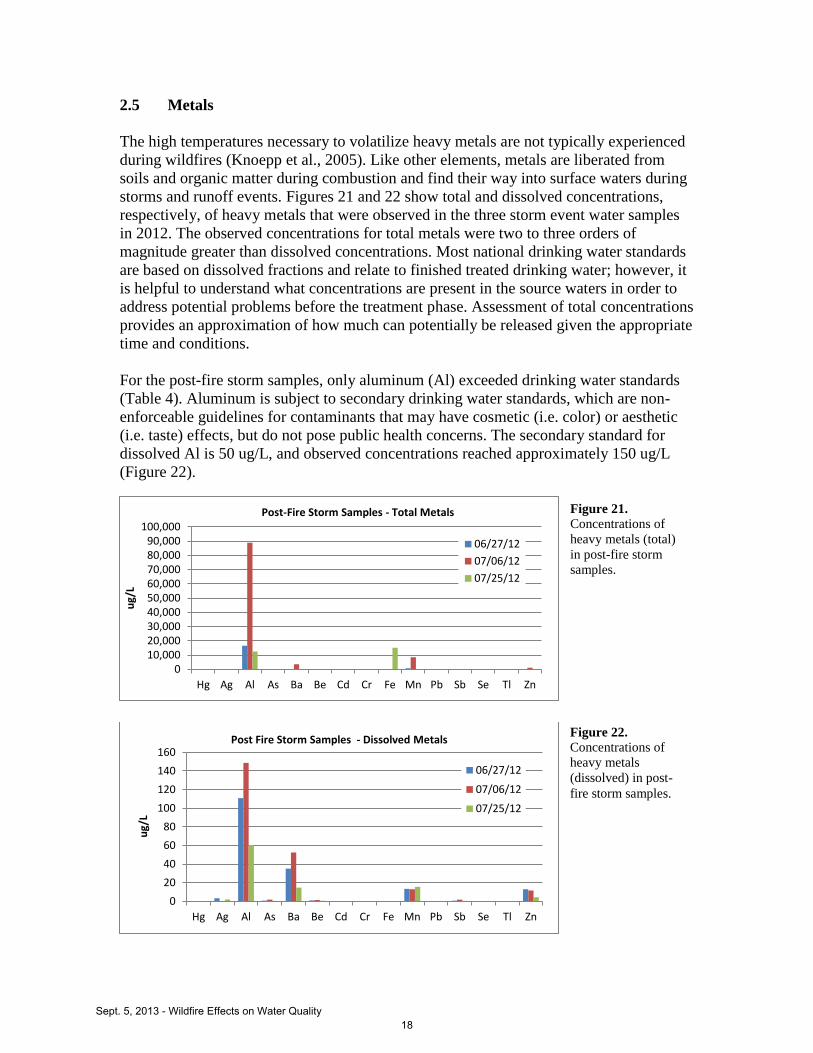
2.5 Metals
The high temperatures necessary to volatilize heavy metals are not typically experienced
during wildfires (Knoepp et al., 2005). Like other elements, metals are liberated from
soils and organic matter during combustion and find their way into surface waters during
storms and runoff events. Figures 21 and 22 show total and dissolved concentrations,
respectively, of heavy metals that were observed in the three storm event water samples
in 2012. The observed concentrations for total metals were two to three orders of
magnitude greater than dissolved concentrations. Most national drinking water standards
are based on dissolved fractions and relate to finished treated drinking water; however, it
is helpful to understand what concentrations are present in the source waters in order to
address potential problems before the treatment phase. Assessment of total concentrations
provides an approximation of how much can potentially be released given the appropriate
time and conditions.
For the post-fire storm samples, only aluminum (Al) exceeded drinking water standards
(Table 4). Aluminum is subject to secondary drinking water standards, which are non-
enforceable guidelines for contaminants that may have cosmetic (i.e. color) or aesthetic
(i.e. taste) effects, but do not pose public health concerns. The secondary standard for
dissolved Al is 50 ug/L, and observed concentrations reached approximately 150 ug/L
(Figure 22).
010,00020,00030,00040,00050,00060,00070,00080,00090,000
100,000
Hg Ag Al As Ba Be Cd Cr Fe Mn Pb Sb Se Tl Zn
ug/
L
Post-Fire Storm Samples - Total Metals
06/27/12
07/06/12
07/25/12
0
20
40
60
80
100
120
140
160
Hg Ag Al As Ba Be Cd Cr Fe Mn Pb Sb Se Tl Zn
ug/
L
Post Fire Storm Samples - Dissolved Metals
06/27/12
07/06/12
07/25/12
Figure 21.
Concentrations of
heavy metals (total)
in post-fire storm
samples.
Figure 22.
Concentrations of
heavy metals
(dissolved) in post-
fire storm samples.
Sept. 5, 2013 - Wildfire Effects on Water Quality 18
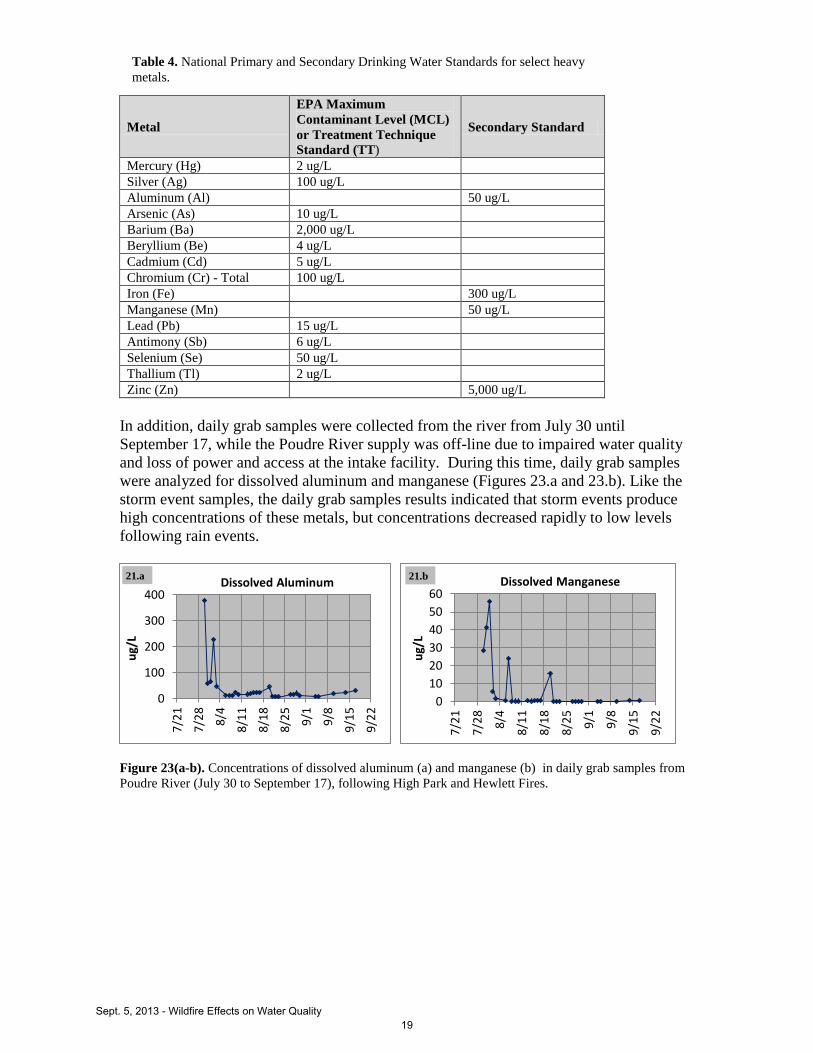
Metal
EPA Maximum
Contaminant Level (MCL)
or Treatment Technique
Standard (TT)
Secondary Standard
Mercury (Hg) 2 ug/L
Silver (Ag) 100 ug/L
Aluminum (Al) 50 ug/L
Arsenic (As) 10 ug/L
Barium (Ba) 2,000 ug/L
Beryllium (Be) 4 ug/L
Cadmium (Cd) 5 ug/L
Chromium (Cr) - Total 100 ug/L
Iron (Fe) 300 ug/L
Manganese (Mn) 50 ug/L
Lead (Pb) 15 ug/L
Antimony (Sb) 6 ug/L
Selenium (Se) 50 ug/L
Thallium (Tl) 2 ug/L
Zinc (Zn) 5,000 ug/L
In addition, daily grab samples were collected from the river from July 30 until
September 17, while the Poudre River supply was off-line due to impaired water quality
and loss of power and access at the intake facility. During this time, daily grab samples
were analyzed for dissolved aluminum and manganese (Figures 23.a and 23.b). Like the
storm event samples, the daily grab samples results indicated that storm events produce
high concentrations of these metals, but concentrations decreased rapidly to low levels
following rain events.
Figure 23(a-b). Concentrations of dissolved aluminum (a) and manganese (b) in daily grab samples from
Poudre River (July 30 to September 17), following High Park and Hewlett Fires.
0
100
200
300
400
7/2
1
7/2
8
8/4
8/1
1
8/1
8
8/2
5
9/1
9/8
9/1
5
9/2
2
ug/
L
Dissolved Aluminum
0
10
20
30
40
50
60
7/2
1
7/2
8
8/4
8/1
1
8/1
8
8/2
5
9/1
9/8
9/1
5
9/2
2
ug/
L
Dissolved Manganese 21.a 21.b
Table 4. National Primary and Secondary Drinking Water Standards for select heavy
metals.
Sept. 5, 2013 - Wildfire Effects on Water Quality 19

Sept. 5, 2013 - Wildfire Effects on Water Quality 20
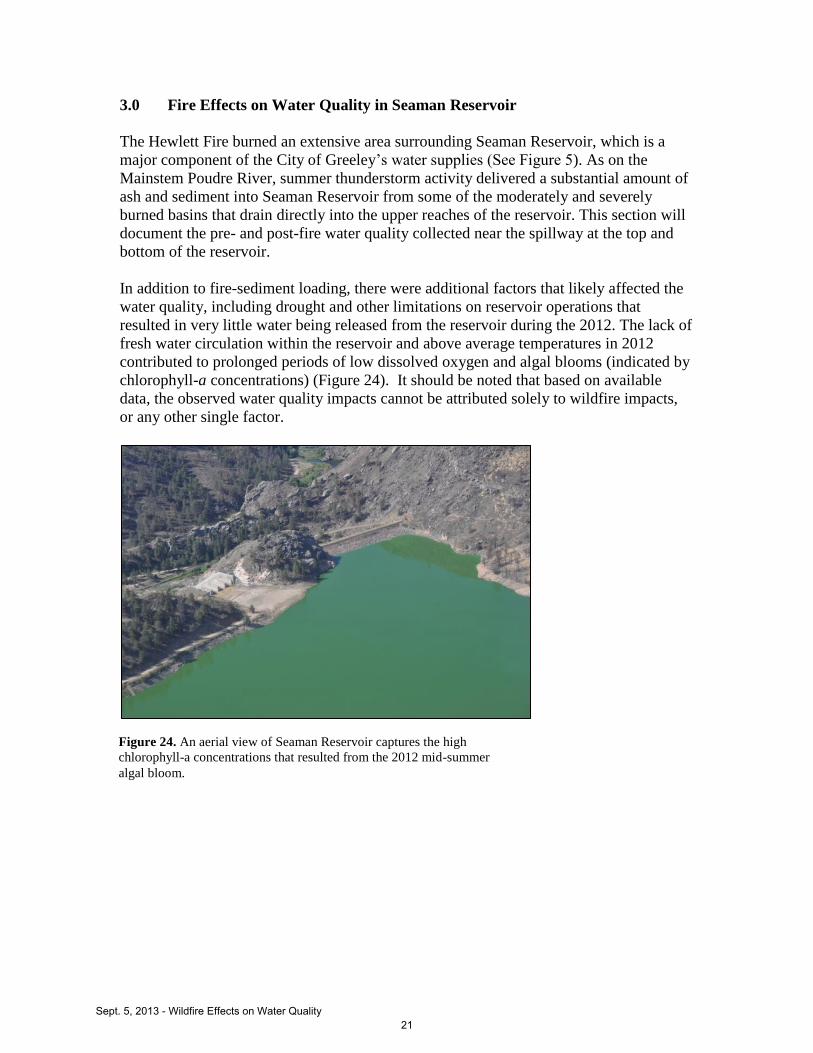
3.0 Fire Effects on Water Quality in Seaman Reservoir
The Hewlett Fire burned an extensive area surrounding Seaman Reservoir, which is a
major component of the City of Greeley’s water supplies (See Figure 5). As on the
Mainstem Poudre River, summer thunderstorm activity delivered a substantial amount of
ash and sediment into Seaman Reservoir from some of the moderately and severely
burned basins that drain directly into the upper reaches of the reservoir. This section will
document the pre- and post-fire water quality collected near the spillway at the top and
bottom of the reservoir.
In addition to fire-sediment loading, there were additional factors that likely affected the
water quality, including drought and other limitations on reservoir operations that
resulted in very little water being released from the reservoir during the 2012. The lack of
fresh water circulation within the reservoir and above average temperatures in 2012
contributed to prolonged periods of low dissolved oxygen and algal blooms (indicated by
chlorophyll-a concentrations) (Figure 24). It should be noted that based on available
data, the observed water quality impacts cannot be attributed solely to wildfire impacts,
or any other single factor.
Figure 24. An aerial view of Seaman Reservoir captures the high
chlorophyll-a concentrations that resulted from the 2012 mid-summer
algal bloom.
Sept. 5, 2013 - Wildfire Effects on Water Quality 21

Figures 25 (a-b). Pre- and post-fire values for alkalinity (a), hardness (b) in Seaman Reservoir.
Figures 26 (a-c). Pre- and post-fire values for
Total Dissolved Solids (a), turbidity (b) and
chlorophyll-a (c) in Seaman Reservoir.
3.1 Alkalinity and Hardness
Post-fire concentrations of alkalinity and hardness were within the range of the mid- to
late-summer concentrations seen in previous years (Figures 25.a and 25.b).
3.2 Total Dissolved Solids (TDS), Turbidity and Chlorophyll-a
TDS concentrations did not follow the typical seasonal pattern of spring dilution followed
by late summer increases, most likely due to limited through-flow of water. However, all
observed concentrations were within the range of values seen in previous years. In
contrast, chlorophyll-a and turbidity exhibit exceptionally high concentrations at the top
of the reservoir on the August 13th
sample date.
0
50
100
150
200
250
01/0
1/08
06/0
1/08
10/3
1/08
04/0
1/09
08/3
1/09
01/3
0/10
07/0
1/10
12/0
1/10
05/0
2/11
10/0
1/11
03/0
1/12
07/3
1/12
12/3
0/12
mg
/L
Alkalinity
TopBottom
0255075
100125150175200225250
01/0
1/08
06/0
1/08
10/3
1/08
04/0
1/09
08/3
1/09
01/3
0/10
07/0
1/10
12/0
1/10
05/0
2/11
10/0
1/11
03/0
1/12
07/3
1/12
12/3
0/12
mg
/L
Hardness
TopBottom
050
100150200250300
01/0
1/08
06/0
1/08
10/3
1/08
04/0
1/09
08/3
1/09
01/3
0/10
07/0
1/10
12/0
1/10
05/0
2/11
10/0
1/11
03/0
1/12
07/3
1/12
12/3
0/12
mg/
L
TDS
TopBottom
0
10
20
30
40
50
01/0
1/08
06/0
1/08
10/3
1/08
04/0
1/09
08/3
1/09
01/3
0/10
07/0
1/10
12/0
1/10
05/0
2/11
10/0
1/11
03/0
1/12
07/3
1/12
12/3
0/12
ug
/L
Turbidity
TopBottom
0
50
100
150
200
01/0
1/08
06/0
1/08
10/3
1/08
04/0
1/09
08/3
1/09
01/3
0/10
07/0
1/10
12/0
1/10
05/0
2/11
10/0
1/11
03/0
1/12
07/3
1/12
12/3
0/12
mg
/L
Chlorophyll-a
TopBottom
25.a 25.b
26.a 26.b
26.c
Sept. 5, 2013 - Wildfire Effects on Water Quality 22
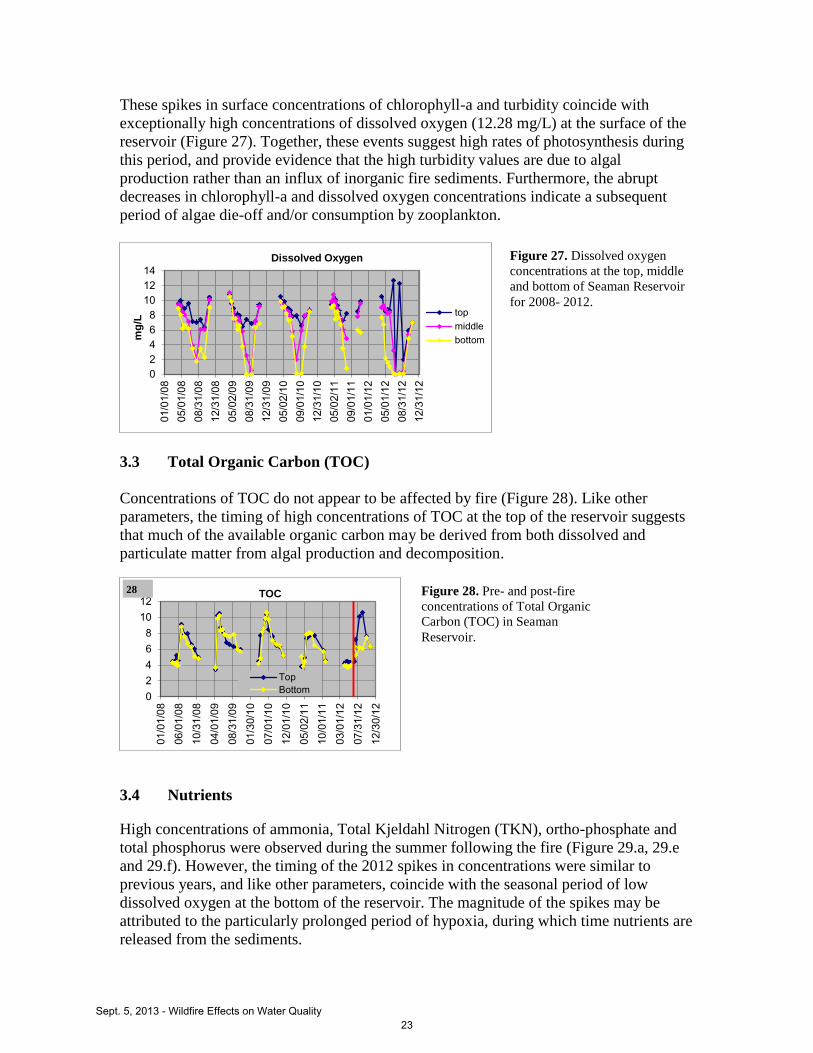
These spikes in surface concentrations of chlorophyll-a and turbidity coincide with
exceptionally high concentrations of dissolved oxygen (12.28 mg/L) at the surface of the
reservoir (Figure 27). Together, these events suggest high rates of photosynthesis during
this period, and provide evidence that the high turbidity values are due to algal
production rather than an influx of inorganic fire sediments. Furthermore, the abrupt
decreases in chlorophyll-a and dissolved oxygen concentrations indicate a subsequent
period of algae die-off and/or consumption by zooplankton.
3.3 Total Organic Carbon (TOC)
Concentrations of TOC do not appear to be affected by fire (Figure 28). Like other
parameters, the timing of high concentrations of TOC at the top of the reservoir suggests
that much of the available organic carbon may be derived from both dissolved and
particulate matter from algal production and decomposition.
3.4 Nutrients
High concentrations of ammonia, Total Kjeldahl Nitrogen (TKN), ortho-phosphate and
total phosphorus were observed during the summer following the fire (Figure 29.a, 29.e
and 29.f). However, the timing of the 2012 spikes in concentrations were similar to
previous years, and like other parameters, coincide with the seasonal period of low
dissolved oxygen at the bottom of the reservoir. The magnitude of the spikes may be
attributed to the particularly prolonged period of hypoxia, during which time nutrients are
released from the sediments.
02468
101214
01/0
1/08
05/0
1/08
08/3
1/08
12/3
1/08
05/0
2/09
08/3
1/09
12/3
1/09
05/0
2/10
09/0
1/10
12/3
1/10
05/0
2/11
09/0
1/11
01/0
1/12
05/0
1/12
08/3
1/12
12/3
1/12
mg
/L
Dissolved Oxygen
topmiddlebottom
02468
1012
01/0
1/08
06/0
1/08
10/3
1/08
04/0
1/09
08/3
1/09
01/3
0/10
07/0
1/10
12/0
1/10
05/0
2/11
10/0
1/11
03/0
1/12
07/3
1/12
12/3
0/12
TOC
TopBottom
Figure 27. Dissolved oxygen
concentrations at the top, middle
and bottom of Seaman Reservoir
for 2008- 2012.
Figure 28. Pre- and post-fire
concentrations of Total Organic
Carbon (TOC) in Seaman
Reservoir.
28
Sept. 5, 2013 - Wildfire Effects on Water Quality 23

Figures 29(a-f). Pre- and post-fire values for ammonia (a), nitrate (b) and nitrite (c), Total Kjeldahl
Nitrogen (TKN) (d), ortho-phosphate (e) and Total phosphorus (f) in Seaman Reservoir.
In general, it appears that the influx of sediments from the surrounding burned hillslopes
is not significantly affecting water quality at the outlet of the reservoir at this time. The
apparent lack of response may be being masked by the larger influence of seasonal
reservoir dynamics. It is also possible that the location of the sediment deposition is far
enough away from the reservoir outlet, that in a year with little through-flow, the impacts
on downstream water quality are not yet detectable. Because fire sediments can carry
high concentrations of nutrients, metals and organic matter, it is expected that they will
have a detectable impact on water quality in the reservoir. The timing of when those
impacts become noticeable will depend upon the reservoir dynamics in the coming years.
0200400600800
10001200
01/0
1/08
06/0
1/08
10/3
1/08
04/0
1/09
08/3
1/09
01/3
0/10
07/0
1/10
12/0
1/10
05/0
2/11
10/0
1/11
03/0
1/12
07/3
1/12
12/3
0/12
ug
/L
Ammonia
TopBottom
050
100150200250300
01/0
1/08
06/0
1/08
10/3
1/08
04/0
1/09
08/3
1/09
01/3
0/10
07/0
1/10
12/0
1/10
05/0
2/11
10/0
1/11
03/0
1/12
07/3
1/12
12/3
0/12
ug
/L
Nitrate
TopBottom
0
10
20
30
40
01/0
1/08
06/0
1/08
10/3
1/08
04/0
1/09
08/3
1/09
01/3
0/10
07/0
1/10
12/0
1/10
05/0
2/11
10/0
1/11
03/0
1/12
07/3
1/12
12/3
0/12
ug
/L
Nitrite
TopBottom
0500
10001500200025003000
01/0
1/08
06/0
1/08
10/3
1/08
04/0
1/09
08/3
1/09
01/3
0/10
07/0
1/10
12/0
1/10
05/0
2/11
10/0
1/11
03/0
1/12
07/3
1/12
12/3
0/12
mg
/L
TKN
TopBottom
0255075
100125150175200225
01/0
1/08
06/0
1/08
10/3
1/08
04/0
1/09
08/3
1/09
01/3
0/10
07/0
1/10
12/0
1/10
05/0
2/11
10/0
1/11
03/0
1/12
07/3
1/12
12/3
0/12
ug
/L
Ortho-phosphate
TopBottom
050
100150200250300
01/0
1/08
06/0
1/08
10/3
1/08
04/0
1/09
08/3
1/09
01/3
0/10
07/0
1/10
12/0
1/10
05/0
2/11
10/0
1/11
03/0
1/12
07/3
1/12
12/3
0/12
ug
/L
Total P
TopBottom
29.a 29.b
29.c 29.d
29.e 29.f
Sept. 5, 2013 - Wildfire Effects on Water Quality 24

Table 5. Sampling locations and frequencies for metals sampling as part of Upper CLP Monitoring
Program.
.
3.5 Post-fire changes in monitoring
The availability of baseline data obtained from the Upper CLP water quality monitoring
program from 2008-2012 provides an excellent opportunity to monitor changes in river
and reservoir conditions following large scale events like the wildfires of 2012. Minor
changes in the monitoring plan were made in 2012 to ensure that the effects of the fires
were captured. These changes include increased frequency and locations at which metals
are sampled, as well as an increase in the number of metals monitored at each site. The
new metals monitoring is outlined in Table 5 below.
NFL SER-Top
SER-Bottom NFG PBR PSF PNF PBD
Al1 3x/yr2 3x/yr 3x/yr 3x/yr 3x/yr 3x/yr 3x/yr 3x/yr As 3x/yr 3x/yr 3x/yr 3x/yr 3x/yr Cd 3x/yr 3x/yr 3x/yr 3x/yr 3x/yr Cr 3x/yr 3x/yr 3x/yr 3x/yr 3x/yr Cu 3x/yr 3x/yr 3x/yr 3x/yr 3x/yr Fe1 3x/yr 3x/yr 3x/yr 3x/yr 3x/yr 3x/yr 3x/yr 3x/yr Hg 3x/yr 3x/yr 3x/yr 3x/yr 3x/yr Mn1 3x/yr 3x/yr 3x/yr 3x/yr 3x/yr 3x/yr 3x/yr 3x/yr Pb 3x/yr 3x/yr 3x/yr 3x/yr 3x/yr Se 3x/yr 3x/yr 3x/yr 3x/yr 3x/yr Ag 3x/yr 3x/yr 3x/yr 3x/yr 3x/yr Ni 3x/yr 3x/yr 3x/yr 3x/yr 3x/yr Zn 3x/yr 3x/yr 3x/yr 3x/yr 3x/yr
1All metals analyzed for dissolved fractions; Al, Mn and Fe also analyzed for Total Digested fractions 2 3x/yr = samples to be collected in May, August, and October
Sept. 5, 2013 - Wildfire Effects on Water Quality 25

Sept. 5, 2013 - Wildfire Effects on Water Quality 26

4.0 References
Bladon, K.D., Silins, U., Wagner, M.J., Stone, M., Emelko, M.B., Devito, K.J., Mendoza,
C.A. & Boon, S. (2008). Wildfire impacts on nitrogen export and production from
headwater streams in southern Alberta’s Rocky Mountains. Can. J. For. Res. 38, 2359–
2371.
Brooks, K.N, Ffolliott, P.F., Gregersen, H.M., Debano, L.F.2003. Hydrology and the
management of watersheds. 3rd
Edition. Ames: Iowa State Press. 704p.
DeBano, L.F., neary, D.G, Ffolliott, P.F.1998. Fire’s effects on ecosystems. New York;
John Wiley & Sons, Inc. 333p.
Debano 1991. The effect of fire on soil. In: Harvey, A.E., Nueunschwander, L.F.(eds.)
Management and productivity of western-montane forest soils. General Technical Report
INT-280. Ogden, UT: U.S. Dept. of Agriculture, Forest Service, Intermountain Forest
and Range Experiment Station: 32-50.
DeBano, L.F., Neary, D.G. 2005. Chapter 1: Introduction: Part A – The Soil Resource: Its
Importance, Characteristics, and General Responses to Fire. In: Neary, D.G., Ryan, K.C.,
DeBano, L.F., (eds). Wildland Fire in Ecosystems: Effects of Fire on Soil and Water.
General Technical Report-42-vol.4. U.S. Dept. of Agriculture, Forest Service, Rocky
Mountain Research Station.
Knoepp, J.D., DeBano, L.F., and Neary, D.G., 2005. Chapter 3: Soil Chemistry. In:
Neary, D.G., Ryan, K.C., DeBano, L.F., (eds). Wildland Fire in Ecosystems: Effects of
Fire on Soil and Water. General Technical Report-42-vol.4. U.S. Dept. of Agriculture,
Forest Service, Rocky Mountain Research Station.
Marion, G.M; Morena, J.m, Oechel, W.C.1991. Fire severity, ash deposition, and
clipping effects on soil nutrients in chaparral. Soil Science Society of America Journal
55: 235-240.
Moody, J.A., Martin, D.A. 2001. Post-fire, rainfall intensity-peak discharge relations for
three mountainous watersheds in the western USA. Hydrological Processes 14: 2981-
2993.
Neary, D. G., Landsberg, J.D., Tiedemann, A.R., Ffolliott, P.F. 2005. Chapter 6: Water
Quality. In: Neary, D.G., Ryan, K.C., DeBano, L.F., (eds). Wildland Fire in Ecosystems:
Effects of Fire on Soil and Water. General Technical Report-42-vol.4. U.S. Dept. of
Agriculture, Forest Service, Rocky Mountain Research Station.
Oropeza, J. 2013. The 2012 5-yr synthesis report for the Collaborative Upper Cache la
Poudre River Water Quality Monitoring Program. City of Fort Collins (forthcoming).
Raison, R.J., Khanna, P.K., Woods, P.V. 1985. Mechanisms of element transfer to the
atmosphere during vegetation fires. Canadian journal of Forest Research. 15: 132-140.
Sept. 5, 2013 - Wildfire Effects on Water Quality 27