effects of the extraction conditions on the yield and composition of rice bran oil extracted with...
TRANSCRIPT
food and bioproducts processing 9 0 ( 2 0 1 2 ) 22–31
Contents lists available at ScienceDirect
Food and Bioproducts Processing
j ourna l ho me p age: www.elsev ier .com/ locate / fbp
Effects of the extraction conditions on the yield andcomposition of rice bran oil extracted withethanol—A response surface approach
Ramon Oliveira, Vinicius Oliveira, Keila Kazue Aracava,Christianne Elisabete da Costa Rodrigues ∗
Separation Engineering Laboratory (LES), Department of Food Engineering (ZEA/FZEA), University of Sao Paulo (USP),PO Box: 23, Zip Code: 13635-900 Pirassununga, SP, Brazil
a b s t r a c t
Rice bran oil was obtained from rice bran by solvent extraction using ethanol. The influence of process variables,
solvent hydration (0–24% of water, on mass basis), temperature (60–90 ◦C), solvent-to-rice bran mass ratio (2.5:1 to
4.5:1) and stirrer speed (100–250 rpm) were analysed using the response surface methodology.
The extraction yield was highly affected by the solvent water content, and it varied from 8.56 to 20.05 g of oil/100 g
of fresh rice bran (or 42.7–99.9% of the total oil available) depending on the experimental conditions. It was observed
that oryzanol and tocols behave in different ways during the extraction process. A larger amount of tocols is extracted
from the solid matrix in relation to �-oryzanol. It was possible to obtain values from 123 to 271 mg of tocols/kg of
fresh rice bran and 1527 to 4164 mg of oryzanol/kg of fresh rice bran, indicating that it is feasible to obtain enriched oil
when this renewable solvent is used. No differences in the chemical composition of the extracted oils were observed
when compared to the data cited in the literature.
© 2011 The Institution of Chemical Engineers. Published by Elsevier B.V. All rights reserved.
Keywords: Solubility; �-Oryzanol; Tocopherols and tocotrienols; Fatty acid composition
1. Introduction
Crude rice bran oil (RBO) stands out among the other edi-ble oils because a unique antioxidant and nutraceuticalcomplex is present in its composition. The unsaponifiablefraction (up to 5% mass of crude oil) contains approximately0.9–2.9% of �-oryzanol and 100–1000 mg kg−1 of tocopherolsand tocotrienols, hereafter referred to as tocols. These minorcompounds have been cited in the scientific literature aspowerful antioxidant agents that are effective in preventingdegenerative diseases (Orthoefer, 1996; MacCaskill and Zhang,1999; Lerma-García et al., 2009).
Tocols have proven effective in preventing cardiovasculardisease and some forms of cancer, whereas oryzanol, a mix-ture of triterpene alcohols and phytosterols esterified withferulic acid, has shown hypocholesterolemic activity and is
effective in decreasing early atherosclerosis and inflammatory∗ Corresponding author at: LES, Separation Engineering Laboratory, Dep(USP), P.O. Box 23, Duque de Caxias Norte, 225 Jardim Elite, 13635-900 P
E-mail address: [email protected] (C.E.C. Rodrigues).Received 9 August 2010; Received in revised form 29 December 2010; A
0960-3085/$ – see front matter © 2011 The Institution of Chemical Engidoi:10.1016/j.fbp.2011.01.004
processes (Xu, 2008; Zigoneanu et al., 2008; Imsanguan et al.,2008).
Rice bran, a low-value co-product obtained from rice pro-cessing, could represent a potential source of healthy productsdue to the nutritional aspects mentioned above. The rice branyield is approximately 8–10% paddy rice, and its oil contentvaries between 14 and 18% depending on its geographicalorigin, seed varieties and extracting methods. This means a10–12 kg yield of crude oil/ton of processed rice, which mayrepresent a significant additional income for rice producers(Orthoefer, 2005; Monsoor and Proctor, 2005; Zullaikah et al.,2009).
Rice bran oil (RBO) is popular in several countries, such asJapan, India, Korea, China and Indonesia, where this productis extensively consumed as an edible oil. However, despite thepositive nutritional characteristics and the possibility of eco-
artment of Food Engineering (ZEA-FZEA), University of São Pauloirassununga, São Paulo, Brazil. Fax: +55 19 3565 4343.
ccepted 13 January 2011
nomical benefits for the rice industry, rice bran oil production
neers. Published by Elsevier B.V. All rights reserved.
food and bioproducts processing 9 0 ( 2 0 1 2 ) 22–31 23
idmctawwwr
mao�
ahc(m
espthsoM12Z
vs2eoaww
ttwtsaToapaa
2
2
TGv
s below its potential, especially in Brazil. This fact is mainlyue to the geographic decentralisation of the production andills and the difficulties in the oil extraction and refining pro-
ess. According to Ghosh (2007), RBO is difficult to process dueo its high levels of free fatty acids (FFAs), waxes, bran finesnd pigment content. These factors lead to high refining losseshen traditional refining processes are employed. However,ith careful attention to processing techniques, beginningith the rice mill, one can produce RBO economically with
easonable yields and quality (Ghosh, 2007).In fact, the rice bran oil extraction method used, either
echanical or solvent extraction, and the solvent used, arelso decisive determinants of the crude rice bran oil qualitybtained and, thus, the final content of minor compounds,-oryzanol and tocols (Rodrigues and Oliveira, 2010).
In general, RBO is extracted from rice bran using hexanes a solvent. Although this solvent presents high stability andigh capability for dissolving oil as its main advantages, it isonsidered a neurotoxin and is toxic at high concentrationsHammond et al., 2005). In addition, it is related to environ-
ental pollution, besides its fossil origin.In recent years, the oil industry has shown increased inter-
st in alternative solvents because of environmental andafety concerns. Several types of solvents have been pro-osed to replace hexane as the extractant of vegetable oils:richlorethylene, water with or without enzymes, halogenatedydrocarbons, aldehydes (furfural), ketones, d-limonene,hort-chain alcohols, and supercritical carbon dioxide, amongthers (Johnson and Lusas, 1983; Rosenthal et al., 1996; Liu andamidipally, 2005; Kuk and Hron, 1998; Proctor and Bowen,
996; Hu et al., 1996; Xu and Godber, 2000; Franco et al.,007, 2009; Monsoor and Proctor, 2005; Imsanguan et al., 2008;igoneanu et al., 2008; Amarasinghe et al., 2009).
Ethanol has gained attention as a potential solvent foregetable oils and has been studied for oil extraction fromoybeans (Arnold and Choudhury, 1962; Rodrigues et al.,010), corn (Moreau and Hicks, 2005), and cottonseed (Sineirot al., 1998; Abraham et al., 1988). In general, previous studiesf solid–liquid extractions carried out with ethanol showed
higher extraction of sugars, phosphatides, pigments andaxes and yielded a better meal compared to that obtainedith hexane (Beckel et al., 1948; Regitano-d’Arce et al., 1994).
In this work, the feasibility of using ethanol as an alterna-ive extraction solvent for rice bran oil was investigated fromhe perspective of the quality of the extracted oil. In otherords, the influence of some process parameters was studied:
emperature, solvent water content, stirrer speed and solid-to-olvent mass ratio as well as their effect on the extraction yieldnd extractability of minor compounds, �-oryzanol and tocols.he data were analysed using the response surface method-logy (RSM), and in general, non-linear multiple regressionllowed us to obtain models with a reliable and acceptableredictive capability. The influence of the independent vari-bles on the fatty acid composition of the extracted oil waslso evaluated.
. Materials and methods
.1. Materials
he solvents used in this work were absolute ethanol (Merck,
ermany) with purity greater than 99.5% and aqueous sol-ents with varying moisture contents ranging from 6 to 24%,on a mass basis that were prepared by diluting absoluteethanol with deionised water (Millipore Direct-Q 3-UV, Mol-heim, France).
Rice bran was stabilised and formulated in pellets in therefinery (Irgovel/NutraCea, Pelotas, Brazil) using a pre-set andpatented combination of heat, water, and pressure, withoutthe use of chemical products. The pellets were stored at −20 ◦Cto prevent enzymatic deterioration (Orthoefer, 2005) until theywere submitted to the extraction process.
The oil content in the rice bran was determined witha Soxhlet apparatus (Tecnal, Piracicaba, SP, Brazil), usingpetroleum ether as the solvent according to the Am 2-93official method (AOCS, 1998). The protein content was deter-mined according to the Ac 4-91 Kjeldahl total nitrogen method(AOCS, 1998). The rice bran moisture content was determinedaccording to the Ac 2-41 official method (AOCS, 1998). All mea-surements were performed in five replicates.
As previously commented, the main aim of this workwas to study the influence of several parameters of the RBOextraction process using ethanol as the solvent. To enable thevisualisation of possible effects of the aforementioned vari-ables on the chemical composition of oils obtained by ethanol,the fatty acid composition and content of nutraceutical com-pounds; the composition of these extracts were comparedwith the composition of an extract obtained via the methodol-ogy suggested by Bligh and Dyer (1959). The use of oil obtainedby cold extraction, as suggested by Bligh and Dyer, is justi-fied because, when using this method, the lipids are extractedwithout heat, ensuring the correct quantification of the levelsof free fatty acids, vitamin E, sterols and the correct determi-nation of the fatty acid composition. In fact, the oil extractedvia the Bligh and Dyer method was used as a reference, whichmade it possible to measure the effects of independent vari-ables on the composition of ethanol extracts.
The RBO, extracted from rice bran pellets according tothe cold method suggested by Bligh and Dyer (1959), wascharacterised in terms of free fatty acids by titration (IUPAC,1979) and the level of gamma-oryzanol was determined byspectrophotometry, using a UV-Vis dual beam spectropho-tometer (model UV 1650 PC, Shimadzu, Japan) at 314.5 nm(Seetharamaiah and Prabhakar, 1986). The tocol quantifica-tion (tocopherols and tocotrienols) was determined at 520 nmaccording to the methodology developed by Emmerie-Engel(Parrish, 1980). This characterisation procedure was accom-plished before each extraction trial.
The RBO extracted according to Bligh and Dyer’s method-ology was also analysed by gas chromatography of the fattyacid methyl esters to determine the fatty acid compositionaccording to the Ce 1-62(97) official method (AOCS, 1998). Priorto the chromatographic analysis, the fatty samples were pre-pared in the form of fatty acid methyl esters according to theCe 2-66(97) official method (AOCS, 1998). A Shimadzu 2010 AFcapillary gas chromatograph (Japan) with an automatic injec-tor (Shimadzu, model AOC 20i, Japan) and a flame ionisationdetector was used under the following experimental condi-tions: Crossbond-PEG 0.25 �m, 30 m × 0.25 mm id. (RTx-Wax,Restek, Bellefonte, PA, USA) capillary column; helium carriergas at a rate of 0.74 mL/min; injection temperature of 250 ◦C;column temperature of 160–245 ◦C (rate of 3 ◦C/min); detectiontemperature of 280 ◦C; and injection volume of 1.0 �L. The fattyacid methyl esters were identified by comparison with exter-nal standards purchased from Supelco (Bellefonte, PA, USA).
The quantification was accomplished by internal normalisa-tion.
24 food and bioproducts processing 9 0 ( 2 0 1 2 ) 22–31
The iodine values of the extracts were calculated accordingto the Cd 1c-85 official method (AOCS, 1998) based on chro-matographic analysis.
2.2. Methods to obtain and characterise the extracts
The batch extractions were performed in a 500-mL stainlesssteel isothermal cylindrical reactor, which was sealed to avoidsolvent losses, and equipped with a manometer, mechani-cal agitator and temperature controller. The apparatus wasequipped with a basket for packing the rice bran pellets. Thissupport plate is resistant to organic solvent and temperature,constructed with perforated stainless steel. The perforatedplate does not restrict the extract and solvent flow, althoughit permits an extraction phase without solid particles.
The components, rice bran pellets and selected solvent(absolute ethanol or alcoholic solutions containing 6, 12, 18or 24% of water, mass basis), in the pre-set conditions of thesolvent-to-solid mass ratio (2.5:1 to 4.5:1), were weighed onan analytical balance with a readability of 0.0001 g (Adam,model PW 254, Milton Keynes, UK). The pre-set quantitiesof the pellets and solvent were transferred to the extrac-tor, which was submitted to the selected stirring speed(100–250 rpm) until the temperature reached the desired value(60–90 ◦C) and then kept under constant agitation for at least3 h.
After extraction, the raffinate phase was weighed on a pre-cision balance with a readability of 0.01 g (Adam, model PGW1502i, Milton Keynes, UK), and the extraction phase profile wasevaluated according to the following methods:
The free fatty acid concentration was determined by titra-tion (IUPAC official method 2201, 1979) with an automaticburette (Metrohm, model Dosimat 775, Herisan, Switzerland).The total solvent concentration was determined by evapora-tion at 60 ◦C in a vacuum oven (absolute pressure = 126 mm Hg,Tecnal, model TE-395, Piracicaba, SP, Brazil) until con-stant mass was reached. The experimental temperatureand pressure conditions were chosen to prevent degrada-tion/volatilisation of the fatty compounds in the samples. Thewater concentration in the extracted phase was determined bya Karl Fischer titration (AOCS method Ca 23-55, 1998) with a KFTitrino (Metrohm, model 787 KF Titrino, Herisan, Switzerland).The �-oryzanol content in the alcoholic extracts was deter-mined by spectrophotometry (Seetharamaiah and Prabhakar,1986) using a spectrophotometer (Shimadzu, model UV 1650PC, Japan). Heptane (HPLC/Spectro, Tedia, Fairfield, USA) wasused as a solvent, and �-oryzanol (Tsuno Rice Fine Chem-icals Co., Wakayama, Japan) was used as the standard.The tocol quantification (tocopherols and tocotrienols) wasdetermined at 520 nm according to the methodology devel-oped by Emmerie-Engel (Parrish, 1980). �-Tocopherol withpurity greater than 99% (Sigma, St. Louis, USA) was used asthe standard, and toluene (Ultimar, Mallinckrodt Chemicals,Hazelwood, USA) was used as a solvent. After quantifying thetotal solvent in the extracts, the soluble substance level wasdetermined by difference.
In fact, the extraction yield was estimated from the actualamount of soluble substances in the bran to the amount inthe extract ratio. In this work, all of the measurements wereperformed in five replicates.
The extracts obtained in each treatment were also submit-ted to chromatographic analysis to determine the fatty acid
composition of the extracted oils (see experimental conditionsin Section 2.1). The iodine values of the extracts were calcu-lated according to the Cd 1c-85 official method (AOCS, 1998)based on chromatographic analysis.
The accuracy and repeatability of the results were testedaccording to the procedure developed by Marcilla et al. (1995)and already applied to fatty systems by Rodrigues and Oliveira(2010). This procedure permits the estimation of the extractphase mass (MEP), from the experimental values MRP (massof raffinate phase) and wEP
i(mass fractions of the system
components in the extract phase) by a least-squares regres-sion. Deviations (ı) between the sum (MRP + MEP) and MOC (theamount of the initial mixture, overall composition) were cal-culated according to Eq. (1).
ı =(
|(MRP + MEP) − MOC|MOC
)× 100 (1)
The relative deviation of the mass balance for each com-pound i (ıi) was calculated according to Eq. (2) in eachequilibrium experiment.
ıi =( |(MRPwRP
i+ MEPwEP
i) − MOCwOC
i|
MOCwOCi
)× 100 (2)
In this work, the values of the relative deviation (ı) variedfrom 0.005% to 0.24%, indicating good precision and repeata-bility of the equilibrium data.
2.3. Response surface methodology
The response surface methodology (RSM) with central com-posite design (CCD) was used to investigate the effect ofseveral process variables (water content in the solvent X1,temperature X2, solvent-to-solid mass ratio X3, and stirrerspeed X4) on the extraction process yield (yield, defined asthe mass of oil (g) per mass of fresh rice bran (100 g)), onthe amount of �-oryzanol (Oryza) and total tocopherols andtocotrienols (Tocols), expressed as the mass of nutraceutical(mg) per mass of fresh rice bran (kg) during an equilibriumstage of the solid–liquid extraction process.
A factorial design was planned to obtain quadratic modelsfor the responses of interest (Eq. (3)). The equation indicatesthe effect of variables in terms of linear, quadratic, and cross-product terms:
yi = ˇ0 ±∑
ˇiXi ±∑
ˇiiX2i ±∑
ˇijXiXj (3)
where yi is the response, Xi and Xj are the levels of variables,ˇ0 is the constant term, ˇi is the coefficient of the linear terms,ˇii is the coefficient of the quadratic terms, and ˇij is the coef-ficient of the cross-product terms.
All of the experimental data were statistically analysedusing Statistica software (Statsoft®, v. 9.0). Graphical represen-tations of the above equation in the form of contour curveswere used to describe the individual and cumulative effectsof the test variables on the responses. The complete set com-prised 24 trials plus a star configuration (or axial points) with
five replicates in the central point (29 trials) (Box et al., 1978;Khuri and Cornell, 1987).
food and bioproducts processing 9 0 ( 2 0 1 2 ) 22–31 25
Table 1 – Rice bran characterisation.
Mean value Standarddeviation
CV (%)a
Moistureb 9.62 0.43 4.81Lipids contentb 22.20 0.06 0.30Crude proteinb 15.36 0.12 0.78�-Oryzanolc 12,510 51 0.41Tocolsc 334 14 4.20
a Coefficient of variance.b Values expressed as percentages in dry weight basis.c Values expressed as mg nutraceutical/kg of fresh rice bran.
o(
A
wee
3
TsTcf
oL
bap(
To test the predictive capacity of the statistical modelsbtained in this investigation, the average relative deviations
ARD) were calculated according to Eq. (4).
RD(%) =[
n∑i=1
(∣∣yexi
− ycalci
∣∣yex
i
)]× 100
n(4)
here yi represents the response, n is the number of trials,x and calc are related to the experimental data and thosestimated using the RSM models, respectively.
. Results and discussion
he rice bran pellet used in this work presents a cylindricalhape approximately 5 mm in diameter and 10 mm in length.he rice bran meal density, obtained as an average of 10 repli-ates, was 603 ± 20 kg m−3. Table 1 presents the average valuesor different characteristics of the raw material.
The results presented in Table 1 are consistent with previ-us results presented by Hu et al. (1996), Orthoefer (2005) andloyd et al. (2000).
Table 2 presents the fatty acid composition profile for riceran oil extracted using the cold method suggested by Blighnd Dyer (1959). In addition, in this table, the fatty acid com-
osition of rice bran oil (Oryza sativa) published by Firestone1999) was presented. The similarity of the fatty composition
Table 2 – Fatty acid composition of RBO.
Fatty acid Molar mass(g mol−1)
Myristic C14:0c 228.38
Palmitic C16:0 256.43
Palmitoleic C16:1 254.41
Stearic C18:0 284.49
Oleic C18:1 282.47
Linoleic C18:2 280.45
Linolenic C18:3 278.44
Arachidic C20:0 312.54
Gadoleic C20:1 310.52
Behenic C22:0 340.59
Erucic C22:1 338.58
Lignoceric C24:0 368.65
Average molar mass (g mol−1)
Iodine value
Unsaturated to saturated fatty acids mass ratio
Linoleic to palmitic fatty acid mass ratioOleic to linoleic fatty acid mass ratio
a Oil extracted from rice bran following the methodology suggested by Blib Firestone (1999).c In Cx:y, x = number of carbons and y = number of double bonds.
between both oils can be noted. It is important to emphasisethat both fatty acid compositions presented in Table 2 werecompared to fatty acid compositions of oils obtained usingethanol as the solvent under different conditions of temper-ature, hydration of ethanol, solvent-to-solid mass ratio, andstirrer speed.
To verify the effect of several process variables, solventwater content (X1), temperature (X2), solvent-to-solid massratio (X3) and stirrer speed (X4) on the extraction process, afactorial design was implemented. Table 3 presents all combi-nations of the studied variables in the statistical analysis andthe corresponding responses for the factorial design.
The data presented in Table 3 were statistically analysed,and the significance (at 95%) of each coefficient was deter-mined by the F value and p value. The corresponding p-valuessuggest that among the test variables used in this study, X1
(solvent water content), X2 (temperature), X3 (solvent-to-solidmass ratio), and the interactions between these variables aresignificant model terms, with p-values of less than 0.05. Otherterms, such as X4 (stirrer speed) and the interactions con-sidering this variable, were insignificant for the responses ofinterest (yield of extraction, oryzanol and tocols concentra-tions).
Table 4 presents a summary of the effects of independentvariables on the responses considered in this work, lineareffects, quadratic effects and interaction effects.
Analysis of variance (ANOVA) was used for determin-ing the significant parameters that influence the responses(Table 5). ANOVA consists of classifying and cross-classifyingstatistical results and testing whether the means of a spec-ified classification differ significantly. This was carried outby Fisher’s statistical test (F test) for the analysis of vari-ance. The F-value is the ratio of the mean squares due toregression and the mean squares due to the error. This testindicates the significance of each controlled factor on eachtested model.
For instance, in Table 5, the model F-value of 50.55, higherthan the listed F (2.55), implies that the model for the response
extraction yield was significant (Box et al., 1978; Khuri andCornell, 1987), making it possible to validate an empiricalBligh–Dyera
(mass%)Literatureb
(mass%)
0.85 ± 0.71 0.50–0.7017.07 ± 0.82 16.00–28.00
0.00 ± 0.00 0.502.00 ± 0.35 2.00–4.00
38.17 ± 0.33 38.00–48.0037.48 ± 0.70 16.00–36.00
2.29 ± 0.39 0.20–2.200.60 ± 0.03 0.50–0.800.40 ± 0.07 0.30–0.500.36 ± 0.42 0.10–0.500.37 ± 0.05 –0.40 ± 0.02 0.00–0.50
277.8 ± 0.7 274.9 ± 0.9104.1 ± 0.7 86.75 ± 3.48
3.70 ± 0.48 3.30 ± 0.042.20 ± 0.06 2.14 ± 0.011.02 ± 0.10 0.93 ± 0.01
gh and Dyer (1959).
26 food and bioproducts processing 9 0 ( 2 0 1 2 ) 22–31
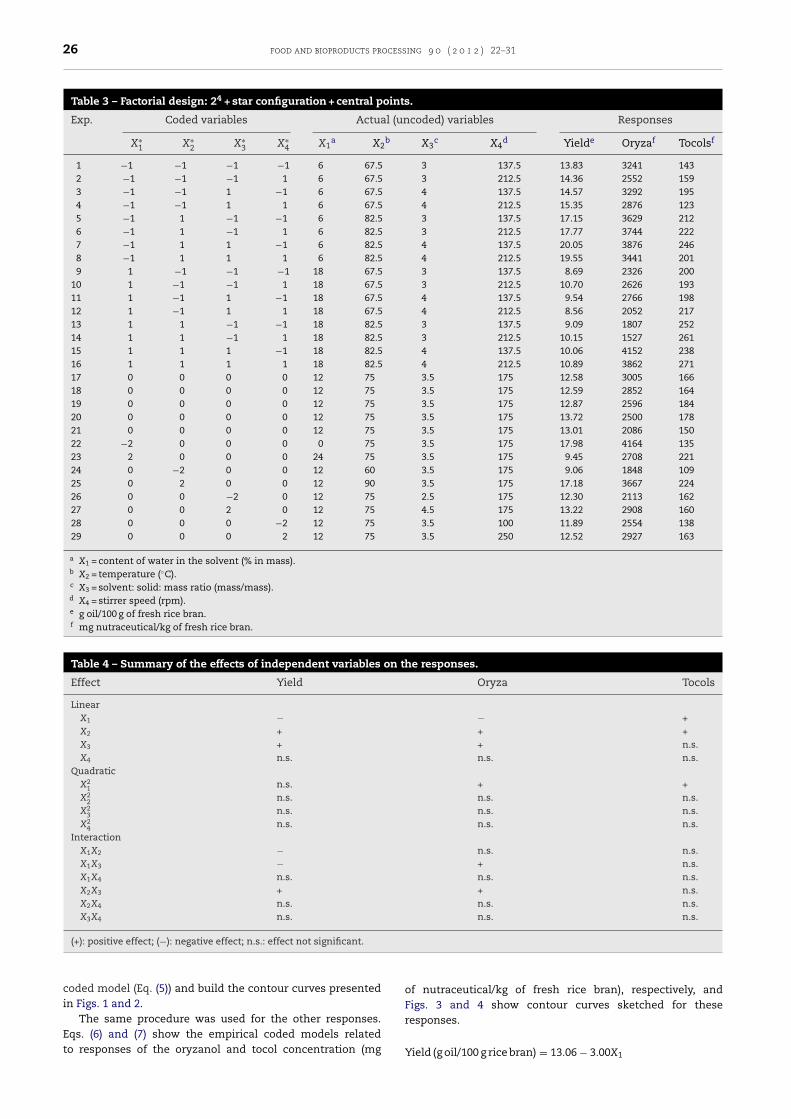
Table 3 – Factorial design: 24 + star configuration + central points.
Exp. Coded variables Actual (uncoded) variables Responses
X∗1 X∗
2 X∗3 X∗
4 X1a X2
b X3c X4
d Yielde Oryzaf Tocolsf
1 −1 −1 −1 −1 6 67.5 3 137.5 13.83 3241 1432 −1 −1 −1 1 6 67.5 3 212.5 14.36 2552 1593 −1 −1 1 −1 6 67.5 4 137.5 14.57 3292 1954 −1 −1 1 1 6 67.5 4 212.5 15.35 2876 1235 −1 1 −1 −1 6 82.5 3 137.5 17.15 3629 2126 −1 1 −1 1 6 82.5 3 212.5 17.77 3744 2227 −1 1 1 −1 6 82.5 4 137.5 20.05 3876 2468 −1 1 1 1 6 82.5 4 212.5 19.55 3441 2019 1 −1 −1 −1 18 67.5 3 137.5 8.69 2326 200
10 1 −1 −1 1 18 67.5 3 212.5 10.70 2626 19311 1 −1 1 −1 18 67.5 4 137.5 9.54 2766 19812 1 −1 1 1 18 67.5 4 212.5 8.56 2052 21713 1 1 −1 −1 18 82.5 3 137.5 9.09 1807 25214 1 1 −1 1 18 82.5 3 212.5 10.15 1527 26115 1 1 1 −1 18 82.5 4 137.5 10.06 4152 23816 1 1 1 1 18 82.5 4 212.5 10.89 3862 27117 0 0 0 0 12 75 3.5 175 12.58 3005 16618 0 0 0 0 12 75 3.5 175 12.59 2852 16419 0 0 0 0 12 75 3.5 175 12.87 2596 18420 0 0 0 0 12 75 3.5 175 13.72 2500 17821 0 0 0 0 12 75 3.5 175 13.01 2086 15022 −2 0 0 0 0 75 3.5 175 17.98 4164 13523 2 0 0 0 24 75 3.5 175 9.45 2708 22124 0 −2 0 0 12 60 3.5 175 9.06 1848 10925 0 2 0 0 12 90 3.5 175 17.18 3667 22426 0 0 −2 0 12 75 2.5 175 12.30 2113 16227 0 0 2 0 12 75 4.5 175 13.22 2908 16028 0 0 0 −2 12 75 3.5 100 11.89 2554 13829 0 0 0 2 12 75 3.5 250 12.52 2927 163
a X1 = content of water in the solvent (% in mass).b X2 = temperature (◦C).c X3 = solvent: solid: mass ratio (mass/mass).d X4 = stirrer speed (rpm).e g oil/100 g of fresh rice bran.f mg nutraceutical/kg of fresh rice bran.
Table 4 – Summary of the effects of independent variables on the responses.
Effect Yield Oryza Tocols
LinearX1 − − +X2 + + +X3 + + n.s.X4 n.s. n.s. n.s.
QuadraticX2
1 n.s. + +X2
2 n.s. n.s. n.s.X2
3 n.s. n.s. n.s.X2
4 n.s. n.s. n.s.Interaction
X1X2 − n.s. n.s.X1X3 − + n.s.X1X4 n.s. n.s. n.s.X2X3 + + n.s.X2X4 n.s. n.s. n.s.X3X4 n.s. n.s. n.s.
(+): positive effect; (−): negative effect; n.s.: effect not significant.
coded model (Eq. (5)) and build the contour curves presentedin Figs. 1 and 2.
The same procedure was used for the other responses.
Eqs. (6) and (7) show the empirical coded models relatedto responses of the oryzanol and tocol concentration (mgof nutraceutical/kg of fresh rice bran), respectively, andFigs. 3 and 4 show contour curves sketched for theseresponses.
Yield (g oil/100 g rice bran) = 13.06 − 3.00X1

food and bioproducts processing 9 0 ( 2 0 1 2 ) 22–31 27
Tabl
e
5
–
An
alys
is
of
vari
ance
(AN
OV
A).
Sou
rce
of
vari
atio
nY
ield
Ory
zaTo
cols
Sum
ofsq
uar
esM
ean
squ
are
Deg
rees
offr
eed
omF
test
aSu
m
ofsq
uar
esM
ean
squ
are
Deg
rees
offr
eed
omF
test
bSu
m
ofsq
uar
esM
ean
squ
are
Deg
rees
offr
eed
omF
test
c
Reg
ress
ion
287.
5
47.9
1
6.00
50.5
5
10,9
30,7
801,
821,
797
6.00
10.9
6
32,8
1410
,938
3.00
15.0
8R
esid
ual
20.8
5
0.95
22.0
0
5.13
3,65
6,91
216
6,22
322
.00
1.40
18,1
3772
625
.00
4.65
Tota
l30
8.3
28.0
0
14,5
87,6
9328
.00
50,9
5128
.00
Cor
rela
tion
coef
fici
ent
0.97
0.87
0.80
AR
D
(%)d
5.83
11.5
9
11.7
0
aF 0
.95;
6;
22=
2.55
.b
F 0.9
5;
6;
22=
2.55
.c
F 0.9
5;
3;
25=
2.99
.d
Ave
rage
rela
tive
dev
iati
on
calc
ula
ted
acco
rdin
g
to
Eq. (
4).
Fig. 1 – Contour curves of yield of extraction expressed as afunction of water content in the solvent (X1), in mass%, andtemperature (X2), in ◦C, with solvent:solid mass ratio (X3) of3.5:1 and stirrer speed (X4) of 175 rpm.
Fig. 2 – Contour curves of yield of extraction expressed as afunction of temperature (X2), in ◦C, and solvent:solid massratio (X3) with water content in the solvent (X1) of 6% inmass and stirrer speed (X4) of 175 rpm.
Fig. 3 – Contour curves of oryzanol expressed as a functionof water content in the solvent (X1), in mass%, andtemperature (X2), in ◦C, with solvent:solid mass ratio (X3) of3.5:1 and stirrer speed (X4) of 175 rpm.

28 food and bioproducts processing 9 0 ( 2 0 1 2 ) 22–31
Fig. 4 – Contour curves of tocols expressed as a function ofwater content in the solvent (X1), in mass%, andtemperature (X2), in ◦C, with solvent:solid mass ratio (X3) of
3.5:1 and stirrer speed (X4) of 175 rpm.+ 1.47X2 + 0.36X3 − 0.86X1X2 − 0.37X1X3 + 0.37X2X3 (5)
Oryza (mg/kg rice bran) = 2710 − 352X1 + 213X21
+ 331X2 + 269X3 + 264X1X3 + 274X2X3 (6)
Tocols (mg/kg rice bran) = 183 + 21X1 + 8X21 + 29X2 (7)
where X1, X2, X3 and X4 are coded variables.Additionally, it can be seen in Table 5 that the correlation
coefficients varied from 80 to 97% and the ARD values, calcu-lated using Eq. (4), were acceptable (not higher than 12%). Fromthe above information, it can be concluded that the devel-oped models could adequately represent the real relationshipamong the parameters chosen (Table 5).
In Fig. 1, it can be observed that the extraction yield isstrongly influenced by the water content in the solvent. In fact,the increase in water content strongly suppresses the extrac-tion yield, whereas the temperature increase only promotessoluble solid extraction in which low-hydrated solvents areused. In this analysis, the values of the solvent-to-solid massratio (X3) and stirrer speed (X4) were set at a coded zero levelor 3.5 to 1 mass ratio and 175 rpm, respectively.
Changes in temperature and the solvent-to-solid massratio, with a stirrer speed maintained at a coded zero level andhydration of the solvent at a −1 level (ethanol with 6% watercontent), revealed that the independent variable solvent-to-solid mass ratio is only important in high-temperaturetreatments (see Fig. 2).
Some extraction yield data for rice bran oil using differ-ent solvents are available in the literature. Proctor et al. (1994)studied the extraction of RBO using hexane as a solvent atambient temperature, which yielded approximately 19.30% oilfrom the fresh rice bran against a control of 21.25% of oil fora solvent-to-solid ratio of 20 mL to 2 g. In a subsequent work,Proctor and Bowen (1996) compared hexane and isopropanolat ambient temperature and at the same solvent-to-solid ratioas the previous work. In this case, the best performance was
obtained with isopropanol, which extracted 100% of the con-trol against 92% for hexane. It is important to emphasise thatthe authors have used high solvent-to-solid mass ratios, 6.6to 1 and 7.9 to 1 for hexane and isopropanol, respectively,considering their densities at 25 ◦C. In the present work, itwas possible to obtain a maximum yield of 20.05, which cor-responds to 99% oil extraction from the solid matrix (seeexperimental conditions of experiment 7 in Table 3), using alower value for the solvent-to-solid mass ratio.
Liu and Mamidipally (2005) have considered limonene asa potential solvent for rice bran oil. Oil extractions wereperformed at the boiling point of the solvent (162.8 ◦C) fordifferent solvent-to-solid mass ratios (from 2:1 up to 5:1)that provided a maximum yield value of 22.98, which cor-responds to 81% oil extraction. The solvent proposed by theauthors leads to a high energy consuming process when com-pared with hexane or ethanol due to the high boiling point oflimonene.
Based on the results from the present work, it is possi-ble to infer that the extraction of rice bran oil from rice branusing ethanol is feasible even under mild temperature and lowsolvent-to-solid mass ratios.
Fig. 3 shows how temperature and solvent moisture con-tent affect the extraction of �-oryzanol while fixing the valuesof the solvent-to-solid mass ratio and stirrer speed at a codedzero level. The high moisture-containing solvents are lesseffective in extracting this nutraceutical. From this figure, itcan be also observed that the temperature effect is minimisedwith high moisture-content ethanol.
Rodrigues and Oliveira (2010), in a previous study of ricebran oil extraction using ethanol in the temperature intervalof 40–60 ◦C, have obtained similar results regarding the effectsof temperature and solvent hydration on the extraction of oiland orysanol. Despite the experimental differences, it can beinferred that the high water content in the solvent results in amoderate effect of temperature on the phase behaviour of thefatty system, even for high temperature values.
Imsanguan et al. (2008) studied the �-oryzanol extractionfrom rice bran using supercritical fluid and solvent extrac-tion. In this work, it is possible to note that the temperatureof the extraction process was an especially important factoraffecting the oryzanol concentration when ethanol or hexanewas used as the solvent. The authors obtained extracts with7349 mg of oryzanol/kg of rice bran and 9414 mg of oryzanol/kgof rice bran, on a dry basis, for hexane and ethanol as the sol-vent, respectively, using a high value of solvent-to-solid ratio,100 mL to 1 g, at temperatures between 55 and 60 ◦C.
Imsanguan et al. (2008) have concluded that ethanol wasa better solvent for oryzanol extraction compared to hexane,which can be explained by the relatively high polarity of theoryzanol molecule (consisting of triterpene alcohols and phy-tosterols esterified with ferulic acid), where the polarity of thesolvent may significantly affect the extractability of oryzanolfrom rice bran (Xu and Godber, 2000).
In the present work, it was possible to obtain extracts con-taining from 1527 to 4164 mg of oryzanol/kg of fresh rice bran,which corresponds to values varying from 12.2 to 33.3% of thetotal orysanol extracted in an equilibrium stage. Based on thisresult, it can be inferred that the total transfer of oryzanolfrom the bran to the extract could be controlled and max-imised by the number of the successive contacts with thesolvent.
In Fig. 4, the behaviour of tocols is shown as a functionof the water content in the solvent and temperature for set
values of the solvent-to-solid mass ratio and stirrer speed at acoded zero level. It can be observed that the extraction of this
food and bioproducts processing 9 0 ( 2 0 1 2 ) 22–31 29
Table 6 – Chemical properties of the extracts.
Expa Average molarmass (g mol−1)
Iodine value Unsaturated tosaturated fattyacids mass ratio
Linoleic topalmitic fattyacid mass ratio
Oleic to linoleicfatty acid massratio
1 276.3 ± 0.1abc 103.8 ± 0.2abc 3.57 ± 0.03abcdef 1.94 ± 0.02abc 0.97 ± 0.00abc2 276.2 ± 0.3bc 103.1 ± 0.2abc 3.49 ± 0.02abcdefg 1.90 ± 0.01abc 0.98 ± 0.00abc3 275.7 ± 0.0bc 103.3 ± 0.2abc 3.34 ± 0.00bcdefg 1.80 ± 0.01bc 0.95 ± 0.00abcd4 276.1 ± 0.3bc 103.3 ± 0.2abc 3.46 ± 0.03abcdefg 1.90 ± 0.02abc 0.97 ± 0.00abc5 276.2 ± 0.2abc 102.3 ± 0.1bc 3.35 ± 0.04bcdefg 1.84 ± 0.02abc 0.96 ± 0.00abc6 276.2 ± 0.3bc 103.0 ± 0.2abc 3.44 ± 0.01abcdefg 1.88 ± 0.01abc 0.96 ± 0.01abc7 275.8 ± 0.6bc 101.4 ± 0.4bc 3.20 ± 0.03defg 1.77 ± 0.04c 0.99 ± 0.01abc8 275.7 ± 0.5bc 100.6 ± 0.4bc 3.07 ± 0.00fg 1.75 ± 0.01c 1.01 ± 0.00abc9 275.9 ± 0.0bc 103.6 ± 0.9abc 3.42 ± 0.04bcdefg 1.84 ± 0.07abc 0.94 ± 0.03abcd10 276.1 ± 0.1bc 105.9 ± 0.6abc 3.55 ± 0.05abcdef 1.98 ± 0.00abc 0.85 ± 0.02cdef11 276.1 ± 0.8bc 95.1 ± 3.9cd 3.13 ± 0.19efg 1.57 ± 0.07c 1.07 ± 0.04ab12 276.5 ± 1.9abc 110.8 ± 13.7ab 3.95 ± 1.13ab 2.65 ± 1.34a 0.71 ± 0.24ef13 278.8 ± 3.1a 99.1 ± 8.9c 3.90 ± 0.12abcd 2.02 ± 0.17abc 0.78 ± 0.06def14 276.4 ± 0.1abc 104.6 ± 0.1abc 3.66 ± 0.02abcdef 1.93 ± 0.00abc 0.93 ± 0.00bcd15 275.8 ± 0.1bc 105.6 ± 0.8abc 3.47 ± 0.14abcdefg 1.92 ± 0.05abc 0.89 ± 0.01cd16 276.6 ± 0.2abc 110.9 ± 6.2ab 3.86 ± 0.23abcde 2.33 ± 0.42abc 0.78 ± 0.14def17 275.9 ± 0.1bc 102.8 ± 1.0bc 3.32 ± 0.10bcdefg 1.80 ± 0.03bc 0.92 ± 0.03bcd18b n.a. n.a. n.a. n.a. n.a.19 274.4 ± 0.6c 96.0 ± 5.0cd 2.79 ± 0.38g 1.54 ± 0.16c 0.91 ± 0.04bcd20 276.6 ± 0.2abc 102.0 ± 0.2bc 3.43 ± 0.00abcdefg 1.86 ± 0.01abc 0.94 ± 0.00abcd21b n.a. n.a. n.a. n.a. n.a.22 276.1 ± 0.2bc 105.1 ± 0.1abc 3.69 ± 0.03abcdef 2.03 ± 0.04abc 0.96 ± 0.01abc23 277.4 ± 0.7ab 95.5 ± 1.8cd 3.45 ± 0.10abcdefg 1.59 ± 0.05c 1.07 ± 0.06ab24b n.a. n.a. n.a. n.a. n.a.25 276.0 ± 0.3bc 102.5 ± 0.6bc 3.23 ± 0.03cdefg 1.79 ± 0.03bc 0.88 ± 0.02cde26 276.1 ± 0.7bc 100.3 ± 1.6bc 3.16 ± 0.02defg 1.74 ± 0.05c 0.95 ± 0.03abcd27 276.0 ± 0.1bc 101.4 ± 0.9bc 3.29 ± 0.10bcdefg 1.77 ± 0.02c 0.90 ± 0.01bcd28 275.9 ± 0.2bc 103.2 ± 0.6abc 3.28 ± 0.04bcdefg 1.85 ± 0.02abc 0.90 ± 0.01bcd29 276.6 ± 0.4abc 114.4 ± 0.3a 4.01 ± 0.01ab 2.64 ± 0.02ab 0.68 ± 0.01fBligh–Dyerc 277.8 ± 0.7abc 104.1 ± 0.7abc 3.70 ± 0.48abcdefg 2.20 ± 0.06abc 1.02 ± 0.10abcdLiteraturec 274.9 ± 0.9bc 86.8 ± 3.5d 3.30 ± 0.04bcdefg 2.14 ± 0.01abc 0.93 ± 0.01bcd
Values are means ± standard deviation. Means in the same column with different online letters are significantly different (p < 0.05).a Experiments 1–29 from Table 3.b Results are not available for experiments 18, 21 and 24.c Data from Table 2.
nh
wttvvvo
itct�
stt
dptpom
utraceutical compound is favoured by increasing the solventydration and temperature.
Zigoneanu et al. (2008) observed that isopropanol, at 40 ◦Cith a solvent-to-solid mass ratio of 3 to 1, is more efficient
han hexane in extracting total vitamin E (tocopherols andocotrienols) from rice bran. The authors obtained 87 mg ofitamin E/kg of fresh rice bran for isopropanol and 53 mg ofitamin E/kg of fresh rice bran for hexane. In the present work,alues from 123 to 271 mg of tocols/kg of fresh rice bran werebtained using ethanol as the solvent.
In fact, Figs. 3 and 4 show that oryzanol and tocols behaven different ways. A larger amount of tocols is extracted fromhe solid matrix in relation to �-oryzanol. This differencean be attributed to the structural differences between thewo classes of molecules. Tocols are less hydrophobic than-oryzanol (Abidi et al., 2002); in fact, they are composed bymaller molecules that contain an unsaturated side chain inhe tocotrienol series and a lower number of methyl substitu-ions than the oryzanol molecules (Batista et al., 2009).
Monsoor and Proctor (2005) studied the application ofeionised water as the extractant of rice bran oil at tem-eratures varying from 20 to 60 ◦C. The authors observedhat the extractability for tocotrienol (19–27%) and toco-herol (10–17%) was greater than the extractability of
ryzanol (8–9%). These results corroborate our previous com-ents.In addition to studying the influence of the extraction pro-cess conditions on yield and on nutraceutical extractability,it would also be important to investigate the influence ofthe solvent on the fatty acid composition of the extractedoils.
In fact, it is a consensus among scientists that dietary fatintake strongly influences the risk of cardiovascular diseasessuch as coronary heart disease. However, the qualitative com-position of fats in the diet has a significant role in modifyingthis risk (Deckere and Korver, 1996).
According to the World Health Organization (WHO, 2010),saturated fatty acid consumption, mainly myristic andpalmitic acids, is directly related to the risk of cardiovasculardiseases. These fatty acids with 12–16 carbons have a greatereffect on raising the low-density lipoprotein (LDL) cholesterollevel. However, diets should provide an adequate supply ofpolyunsaturated fatty acids and oleic acid.
In this context, it can be inferred that the fatty acid pro-file in the rice bran oil presents a good balance in terms ofthe unsaturated-to-saturated fatty acids ratio and the ratio ofdiunsaturated (linoleic acid) to saturated (palmitic acid) andmonounsaturated (oleic acid) fatty acids (see Table 2).
This work also aimed at evaluating the effect of the sol-vent water content, temperature, the solvent-to-solid mass
ratio and the stirrer speed on the fatty acid composition ofthe extracted oils.
30 food and bioproducts processing 9 0 ( 2 0 1 2 ) 22–31
The extracts from each treatment were submitted to GC-FAME, and the data were statistically analysed using analysisof variance (ANOVA) and the Tukey test using the 9.2 versionof the SAS® software.
Table 6 shows the average molar masses, the calculatediodine index values (AOCS, 1998), the unsaturated-to-saturated acids mass ratio, the linoleic-to-palmitic acid massratio, and the oleic-to-linoleic acid mass ratio.
Based on the statistical analysis presented in Table 6, itcan be observed that no significant difference was observedbetween the oils obtained according to the planned exper-iments and those extracted according to Bligh and Dyer’smethodology (1959) and commercial rice bran oil, commonlyextracted using the fossil hexane solvent (see data fromFirestone, 1999).
In fact, the oils extracted with ethanol presented the typi-cal composition of rice bran oil (Oryza sativa) (Firestone, 1999)with no significant change in the fatty acid composition. Ingeneral, rice bran oil extracted by ethanol provides fat withhigh unsaturated-to-saturated fatty acids ratio (up to 4.0:1),high linoleic-to-palmitic fatty acid ratio (up to 2.7:1), and alinoleic-to-oleic fatty acid ratio close to 1.
4. Conclusions
According to the experimental design and response surfaceanalysis, quadratic polynomial models can be used to predictthe yield of rice bran oil and the extractability of nutraceu-tical compounds, �-oryzanol and tocols from experimentsusing ethanol as the solvent, carried out at equilibrium condi-tions. The four independent variables involved in the modelswere the water content in the ethanol, temperature, solid-to-solvent mass ratio and stirrer speed.
The results indicated that the variables of solvent hydra-tion, temperature and solid-to-solvent mass ratio had thegreatest impact on the responses followed by interactionsbetween the solvent hydration and temperature, solventhydration and solid-to-solvent mass ratio, temperature andsolid-to-solvent mass ratio and the quadratic term of the sol-vent hydration.
Within the range of the operating conditions studied, theoptimal point was at 6 mass% of water in the solvent, 82 ◦C, 4parts of solvent to 1 part of rice bran and 137.5 rpm, achievingan oil yield of 20.05 g of oil/100 g of fresh rice bran (or 99.9% ofthe total oil available).
The results show that the oil extraction process from ricebran using ethanol is feasible. The levels of nutraceuticalcompounds present in the extracted oil can be controlled byselecting the solvent and process temperature. It was possibleto obtain values from 123 to 271 mg of tocols/kg of fresh ricebran and 1527 to 4164 mg of oryzanol/kg of fresh rice bran,indicating that it is feasible to obtain enriched oil when thisrenewable solvent is used.
In addition, the chemical profile of the extracts indi-cates that the ethanol-extracted oil presents the typicalcomposition of rice bran oil (Oryza sativa) regardless of theexperimental condition.
Acknowledgments
The authors wish to acknowledge FAPESP (Fundacão deAmparo à Pesquisa do Estado de São Paulo 2006/00565-
4, 2006/04819-0, 2008/56258-8 and 2009/17855-3), CAPES(Coordenacão de Aperfeicoamento de Pessoal de Nível Supe-rior), CNPq (Conselho Nacional de Desenvolvimento Científicoe Tecnológico), and IRGOVEL (Indústria Riograndense de ÓleosVegetais Ltda).
References
Abidi, S.L., Thiam, S., Warner, I.M., 2002. Elution behavior ofunsaponifiable lipids with various capillaryelectrochromatographic stationary phases. J. Chromatogr. A949 (1–2), 195–207.
Abraham, G., Hron, R.J., Koltun, S.P., 1988. Modeling the solventextraction of oilseeds. J. Am. Oil Chem. Soc. 65 (1), 129–135.
Amarasinghe, B.M.W.P.K., Kumarasiri, M.P.M., Gangodavilage,N.C., 2009. Effect of method of stabilization on aqueousextraction of rice bran oil. Food Bioprod. Process. 87,108–114.
AOCS, 1998. Official Methods and Recommended Practices of theAmerican Oil Chemists’ Society. AOCS Press, Champaign, USA.
Arnold, L.K., Choudhury, R.B.R., 1962. Ethanol extraction ofsoybean oil. J. Am. Oil Chem. Soc. 39 (8), 379–380.
Batista, E.A.C., Meirelles, A.J.A., Rodrigues, C.E.C., Goncalves, C.B.,2009. Liquid–liquid extraction applied to the processing ofvegetable oil. In: Meireles, A.J.A. (Ed.), Extracting BioactiveCompounds for Food Products. CRC Press, Florida, USA, pp.219–267.
Beckel, A.C., Belter, P.A., Smith, A.K., 1948. Solvent effects on theproducts of soybean oil extraction. J. Am. Oil Chem. Soc. 25 (1),7–9.
Bligh, E.G., Dyer, W.J., 1959. A rapid method of total lipidextraction and purification. Can. J. Biochem. Physiol. 37 (8),911–917.
Box, G.E.P., Hunter, W.G., Hunter, J.S., 1978. Statistic forExperimenters—An Introduction to Design Data Analysis andModel Building. John Wiley & Sons, New York, USA.
Deckere, E.A.M., Korver, O., 1996. Minor constituents of rice branoil as functional foods. Nutr. Rev. 54 (11), 120S–126S.
Firestone, D. (Ed.), 1999. Physical and Chemical Characteristics ofOils, Fats, and Waxes. AOCS Press, Washington, DC,pp. 86–87.
Franco, D., Sineiro, J., Pinelo, M., Núnez, M.J., 2007. Ethanolicextraction of rosa rubiginosa soluble substances: oil solubilityequilibria and kinetic studies. J. Food Eng. 79 (1), 150–157.
Franco, D., Sineiro, J., Núnez, M.J., 2009. Analysis of variables andmodeling of gevuina avellana oil extraction with ethanol nearazeotrope conditions. J. Food Process Eng. 32 (5), 664–681.
Ghosh, M., 2007. Review on recent trends in rice bran oilprocessing. J. Am. Oil Chem. Soc. 84 (4), 315–324.
Hammond, E.G., Johnson, L.A., Su, C., Wang, T., White, P.J., 2005.Soybean oil. In: Shahidi, F. (Ed.), Bailey’s Industrial Oil and FatProducts. John Wiley and Sons, New Jersey, USA, pp. 577–653.
Hu, W., Wells, J.H., Shin, T., Godber, J.S., 1996. Comparison ofisopropanol and hexane for extraction of vitamin E andoryzanols from stabilized rice bran. J. Am. Oil Chem. Soc. 73(12), 1653–1656.
Imsanguan, P., Roaysubtawee, A., Borirak, R., Pongamphai, S.,Douglas, S., Douglas, P.L., 2008. Extraction of alpha-tocopheroland gamma-oryzanol from rice bran. LWT: Food Sci. Technol.41 (8), 1417–1424.
IUPAC, 1979. Standard Methods for the Analysis of Oils Fats andDerivatives. Pergamon Press, New York, USA.
Johnson, L.A., Lusas, E.W., 1983. Comparison of alternativesolvents for oils extraction. J. Am. Oil Chem. Soc. 60 (4),229–242.
Khuri, A.I., Cornell, J.A., 1987. In: Dekker, M. (Ed.), ResponseSurface Design and Analysis. ASQC Quality Press, New York,USA.
Kuk, M.S., Hron, R.J., 1998. Cottonseed extraction with newsolvent system: isohexane and alcohol mixtures. J. Am. OilChem. Soc. 75 (8), 927–930.
Lerma-García, M.J., Herrero-Martínez, J.M., Simó-Alfonso, E.F.,Mendonca, C.R.B., Ramis-Ramos, G., 2009. Composition,

food and bioproducts processing 9 0 ( 2 0 1 2 ) 22–31 31
L
L
M
M
M
M
O
O
P
P
P
R
Zullaikah, S., Melwita, E., Ju, Y.H., 2009. Isolation of oryzanol fromcrude rice bran oil. Bioresour. Technol. 100 (1), 299–302.
industrial processing and applications of rice bran �-oryzanol.Food Chem. 115 (2), 389–404.
iu, S.X., Mamidipally, P.K., 2005. Quality comparison of rice branoil extracted with d-limonene and hexane. Cereal Chem. 82(2), 209–215.
loyd, B.J., Siebermorgan, T.J., Beers, K.W., 2000. Effects ofcommercial processing on antioxidants in rice bran. CerealChem. 77 (5), 551–555.
acCaskill, D.R., Zhang, F., 1999. Use of rice bran oil in foods.Food Technol. 53 (2), 50–52.
arcilla, A., Ruiz, F., García, A.N., 1995. Liquid–liquid–solidequilibria of the quaternary systemwater–ethanol–acetone–sodium chloride at 25 ◦C. Fluid PhaseEquilib. 112 (2), 273–289.
onsoor, M.A., Proctor, A., 2005. Tocopherol, tocotrienol, andoryzanol content of rice bran aqueous extracts. J. Am. OilChem. Soc. 82 (6), 463–464.
oreau, R.A., Hicks, K.B., 2005. The composition of corn oilobtained by the alcohol extraction of ground corn. J. Am. OilChem. Soc. 82 (11), 809–815.
rthoefer, F.T., 1996. Rice bran oil: healthy lipid source. FoodTechnol. 50 (12), 62–64.
rthoefer, F.T., 2005. Rice bran oil. In: Shahidi, F. (Ed.), Bailey’sIndustrial Oil and Fat Products. John Wiley and Sons, NewJersey, USA, pp. 465–489.
arrish, D.B., 1980. Determination of vitamin E in foods—a review.CRC Crit. Rev. Food Sci. Nutr. 13 (2), 161–187.
roctor, A., Bowen, D.J., 1996. Ambient-temperature extraction ofrice bran oil with hexane and isopropanol. J. Am. Oil Chem.Soc. 73 (6), 811–813.
roctor, A., Jackson, V.M., Scott, M., Clark, P.K., 1994. Rapidequilibrium extraction of rice bran oil atambient-temperature. J. Am. Oil Chem. Soc. 71 (11), 1295–1296.
egitano-d’Arce, M.A.B., Assis, R.P., Lima, U.A., 1994. Functional
properties of sunflower seed meal obtained by ethanolextraction. Arch. Latinoam. Nutr. 44 (1), 29–32.Rodrigues, C.E.C., Oliveira, R., 2010. Response surfacemethodology applied to the analysis of rice bran oil extractionprocess with ethanol. Int. J. Food Sci. Technol. 45 (4),813–820.
Rodrigues, C.E.C., Aracava, K.K., Abreu, F.N., 2010.Thermodynamic and statistical analysis of soybean oilextraction process using renewable solvent. Int. J. Food Sci.Technol. 45 (11), 2407–2414.
Rosenthal, A., Pyle, D.L., Niranjan, K., 1996. Aqueous andenzymatic processes for edible oil extraction. Enzyme Microb.Technol. 19 (6), 402–420.
Seetharamaiah, G.S., Prabhakar, J.V., 1986. �-Oryzanol content ofIndian rice bran oil and its extraction from soapstock. J. FoodSci. Technol. Mys. 23 (5), 270–273.
Sineiro, J., Domínguez, H., Núnez, M.J., Lema, J.M., 1998. Ethanolicextraction of sunflower oil in a pulsing extractor. J. Am. OilChem. Soc. 75 (6), 753–754.
World Health Organization, 2010. Population nutrient intakegoals for preventing diet-related chronic diseases, Geneva,Switzerland, Available at: http://www.who.int. Accessed 5 July2010.
Xu, Z., 2008. Comparison of extraction methods for quantifyingvitamin E from animal tissues. Bioresour. Technol. 99 (18),8705–8709.
Xu, Z., Godber, J.S., 2000. Comparison of supercritical fluid andsolvent extraction methods in extracting �-oryzanol from ricebran. J. Am. Oil Chem. Soc. 77 (5), 547–551.
Zigoneanu, I.G., Wilhams, L., Xu, Z., Sabliov, C.M., 2008.Determination of antioxidant components in rice bran oilextracted by microwave-assisted method. Bioresour. Technol.99 (11), 4910–4918.