effects of tio 2-sio 2 fillers on thermal and dielectric...
TRANSCRIPT
1
Effects of TiO2-SiO2 fillers on thermal and dielectric properties
of bismuth glass microcomposite dielectrics for plasma display
panel Anal Tarafder ⋅⋅⋅⋅ Shiv Prakash Singh ⋅⋅⋅⋅ Basudeb Karmakar*
Glass Science & Technology Section, Glass Division,
Central Glass and Ceramic Research Institute,
Council of Scientific and Industrial Research (CSIR, India),
196, Raja S.C. Mullick Road, Kolkata 700 032, India
_______________________________________________________________________
Abstract The combined effects of TiO2 and SiO2 fillers on thermal and dielectric
properties of a new lead-free environmental friendly zinc bismuth borate, ZnO-Bi2O3-
B2O3 (ZBIB) glass microcomposite dielectrics have been investigated from the viewpoint
of application as rear glass dielectric layer of plasma display panels (PDPs). The
interaction of fillers with glass occurred during firing has also been explored by XRD,
SEM and FTIR spectroscopic analyses. All the properties are found to be regulated by the
covalent character (a fundamental property) of resultant microcomposite dielectrics. In
this work, the co-addition of TiO2-SiO2 filler to ZBIB glass is found to be more effective
to adjust the required properties to employ with PD200 glass substrate in PDP
technology.
* Corresponding author. Tel.: +91 33 2473 3496; fax: +91 33 2473 0957.
E-mail address: [email protected] (B. Karmakar).
2
1 Introduction
In the last decade, the commercial uses of flat panel displays (FPDs) have increased
enormously, especially in case of consumer electronics such as televisions, laptop
computers, digital clocks, cell phones, telephones etc. In such cases, the most widely used
flat panel display is the liquid crystal display (LCD). But plasma display panels (PDP)
which is one kind of flat panel display have emerged to be a potential display material for
large dimension (> 100 inches) high definition TV. Significant quality differences remain
between PDP and LCD while they offer some shared benefits. PDPs are characterized by
larger screen sizes (greater than 100 inches), wide viewing angle, more accurate image
reproduction with better colour accuracy, contrast and brightness, superior ability to
display moving images without motion artifacts and better pixel reliability over LCDs
[1]. In PDP a rear glass dielectric layer (popularly known as white back) is used as the
insulating film of the address electrodes on the rear glass substrate and also gives
mechanical support to the barrier ribs (the partitions between the phosphor cavities).
White back materials of PDP systems require a low dielectric constant (less than 15), low
softening temperature (less than the strain point of PDP glass substrate which is 610oC
for PD200) and low coefficient of thermal expansion (less than 83x10-7/K) with respect
to use of PD200 glass as substrate [1, 2]. Lead oxide (PbO) containing glass
microcomposites (micron sized ceramic oxide reinforced glass) are being used as white
dielectric layer of PDPs [1-6]. But recently, interest in Pb-free glass systems has greatly
increased with regard to their application in white backs of plasma display panels due to
hazardous effects of Pb on health and environment during processing and discarding [1,
2, 4-7].

3
Several studies have been carried out by adding various types of crystalline fillers
(e.g., TiO2, SiO2, ZrO2, Al2O3, MgO and cordierite) to lead free BaO-ZnO-B2O3-SiO2 [2-
4], BaO-B2O3-SiO2 [5] and BaO-ZnO-B2O3 [6] glass systems where the behavior of the
composites with respect to different properties have been reported for use in PDPs. Very
recently, Chong et al. [8, 9] have examined the influence of Al2O3, TiO2 and ZrO2
ceramic filler on the thermophysical and dielectric properties of BaO-ZnO-B2O3-P2O5
glass composites for plasma display panels. In this work, we have tried to replace lead
oxide, PbO (MP = 880oC, n = 2.24) [10] by bismuth oxide (Bi2O3) because of its low
melting temperature (820oC) and high refractive index (n = 2.5). Above all Bi2O3 is not as
hazardous as PbO [7] and Bi2O3 is being considered a suitable alternative of PbO with
respect to environmental friendliness. So, attempts were made to incorporate Bi2O3 in the
glass composition. To the best of our knowledge, there is no report on the combined
effects of TiO2-SiO2 fillers on thermal and dielectric properties of bismuth containing
glass with the view of its use as rear glass dielectric layer (white back) of plasma display
panels.
In view of above, in this study we report the combined effect the TiO2 (crystalline,
rutile) and SiO2 (amorphous, spherical) fillers to an extent of 25 wt% on the softening
point (Ts), glass transition temperature (Tg), coefficient of thermal expansion (CTE) and
dielectric constant (εr) of lead-free ZnO-Bi2O3-B2O3 glass. Here, SiO2 having low CTE
(5.5x10⁻⁷/K), low εr (3.8) and high Ts (1723oC); and TiO2 having high CTE (80-100x10-
7/K), high εr (80-100) and high Ts (1850oC) have been selected for controlling CTE, εr
and Ts of the resultant microcomposite dielectrics. The glass-filler interaction which
4
occurs at the sintering temperature has also been investigated by XRD, SEM and FTIR
spectral analyses.
2 Experimental
2.1 Preparation of glass and microcomposite dielectrics
The selected glass composition (wt%) is 19ZnO-46Bi2O3-35B2O3 (ZBIB). We have
selected this glass composition to meet the requirement of three important properties of
plasma display panel such as (i) coefficient of thermal expansion, CTE (less than 83 x 10-
7/K), (ii) dielectric constant (less than 15) and (iii) softening point, Ts (less than 580oC).
The batch was prepared using the pure raw materials: ZnO (GR, 99%, Loba Chemie,
Mumbai, India), Bi2O3 (99%, Loba Chemie, Mumbai, India) and H3BO3 (GR, 99.5%,
Loba Chemie, Mumbai, India). About 600 g of glass was melted in a platinum crucible in
an electrically heated raised hearth furnace at 1150oC for 1h in air with intermittent
stirring. The molten glass was quenched by casting onto an iron plate. The quenched
glass was initially crushed in a stainless steel mortar and then pulverized in a planetary
ball mill (Model PM100, Retsch, Germany) using a zirconia jar and balls to obtain final
glass powders of 14.4 µm size (d50).
The pulverized ZBIB glass powders were mixed in isopropanol medium with
appropriate amount of microsilica (spherical), SiO2 (99.5 %, d50 = 1.5 µm, Pooja
Enterprises, Mumbai, India) and titania, TiO2 (99.9 %, d50 = 3.2 µm, Sigma-Aldrich, St.
Louis, MO) fillers in an agate mortar. All the powders were then granulated using 2 wt%
aqueous solution of polyvinyl alcohol (PVA) followed by pressing uniaxially into disk or
cylindrical shape under a pressure of 500 kgf/cm2 and then dried. It was sintered at 560oC

5
for 2h in air for measurement of coefficient of thermal expansion, dielectric constant,
XRD, SEM and FTIR spectra. The composition of microcomposites is listed in Table 1.
2.2 Characterization
Particle size analyses of powders were carried out using a particle size analyzer (Model
Mastersizer 2000, Malvern Instrument, Worcestershire, UK). XRD data were recorded
using an XPERT-PRO MPD diffractometer (PANalytical, Almelo, the Netherlands) with
Ni-filtered and anchor scan parameter wavelength 1.54060 Å (CuKα) at 25oC at 40 kV
and 30 mA and a scan speed 10o/min. The morphology of the samples was investigated
with a SEM (Model S 430i, LEO Electronic Microscopy Ltd., Cambridge, UK)
instrument at an accelerating potential of 15 kV. FTIR spectra were recorded by
dispersing the sintered glass and microcomposite dielectric powders in KBr with a FTIR
spectrometer (Model 1615, Perkin-Elmer Corporation, Norwalk, CT) at a resolution of +
2 cm-1 after 16 scans. It was calibrated with a polystyrene film supplied by the instrument
manufacturer.
The softening point (Ts) of the dried disk was measured by a glass softening point
system (Model SP-3A, Harrop Industries Inc., OH) with an accuracy of +1oC. The
instrument was previously calibrated with a NBS (National Bureau of Standards, USA)
standard glass of known softening point. The CTE and Tg of the sintered microcomposite
cylinders were measured with an accuracy of +1% using a horizontal-loading dilatometer
(Model 402C, NETZSCH-Gerätebau GmbH, Germany) after calibration with a standard
alumina supplied with the instrument by the manufacturer. The CTE in the temperature
range 50-350oC is reported here. The dielectric constant was measured with an accuracy

6
of +1% at a frequency of 1MHz using a LCR meter (Model 3532-50 Hitester, Hioki,
Ueda, Nagano, Japan) at 25oC. The instrument was calibrated previously by a Suprasil-W
silica glass (εr = 3.8).
3 Results and discussion
3.1 Particle size distribution
It is well known that the degree of glass-filler interaction (powders-solid state reaction) is
largely depended on their particle size and its distribution. The smaller the particle sizes
of the fillers, the greater the extent of interaction. Thus the particle size distribution of
ZBIB glass powder, TiO2 and SiO2 fillers is measured and presented in Fig. 1. It is seen
that the glass powder as well as TiO2 and SiO2 fillers exhibit a bimodal particle size
distribution. Bimodal particle sizes are beneficial to obtain high packing density. The
median particle sizes (d50) ZBIB glass powder, TiO2 and SiO2 fillers are found to be 14.4,
3.2 and 1.5 µm respectively. The compositions of microcomposite dielectrics are given in
Table 1.
3.2 XRD analysis
As the reaction of fillers (TiO2 and SiO2) with glass during firing at 560oC is the
fundamental to the formation of filler-glass microcomposites, thus they have been
examined by XRD analysis. The variation of XRD patterns with added TiO2-SiO2 filler
content is shown in Fig. 2. ZBIB glass is X-ray amorphous (Fig. 2, curve a). Since the
added SiO2 filler is amorphous (see Fig. 2, curve f) so there is no XRD peak of SiO2
whereas on the other hand TiO2 filler is rutile (see Fig. 2, curve g), so the composite C1

7
containing highest TiO2 exhibits well developed XRD pattern of rutile TiO2 (JCPDS card
file No.: 21-1276) with diminished amorphous character (see curve b). With gradual
decrease in TiO2 content and increase in SiO2, the characteristic peaks of rutile TiO2
decrease and amorphous character gradually increases. XRD pattern also indicates that
the filler has partially dissolved in glass during sintering at 560oC leaving behind some
residual filler in the glass matrix which exhibit their characteristic peaks. This
observation correlates well with those of FTIR spectral study as discussed later. Thus, it
is clear from XRD analysis that combined TiO2-SiO2 filler containing microcomposite
dielectrics are of crystal (ceramic)-in-amorphous characteristics.
3.3 Microstructural analysis
The SEM analysis of the sintered samples was performed by grinding and polishing
followed by etching in 1% aqueous solution of HF for 60 s. The dried samples were
examined after Au coating on the surface to pass the electron beam through it. The fact
that the fillers have partially dissolved in the glass matrix during sintering is evidenced by
SEM images of the microcomposite dielectrics as shown in Fig. 3 (a) and (b) of samples
C1 and C4 respectively. They exhibit the porous microstructure which is beneficial and
essential to anchor the red, green and blue (RGB) phosphors. They also show the
distribution of fillers in the microcomposite dielectrics after sintering. It is seen from Fig.
3 (a) of composite C1 which contains 20% TiO2 and 5% SiO2 fillers that TiO2 is almost
dissolved in the glass whereas a large number of small irregular spherical particles of
SiO2 found to be embedded in the glassy matrix. It is seen that the degree of solubility of
TiO2 is higher than that of SiO2. The glassy matrix is distinctly visible here. However, the
8
picture is entirely different in Fig. 3 (b) of composite C4 which contains 5% TiO2 and
20% SiO2 fillers. Here it is seen that TiO2 dissolves almost completely and SiO2 fillers
remain relatively undissolved. Thus partial solubility of the added filler in the glass
matrix generates closed pores in the microcomposie dielectrics. As a result of the
presence of undissolved SiO2 and TiO2 fillers with closed pores, the bulk density of
resultant microcomposites decreases and the same is reflected in Fig. 4. This matter can
easily be realized if one consider and compare the SEM images of microstructures of C1
and C4.
3.4 FTIR spectra analysis
The FTIR spectra of TiO2-SiO2 containing microcomposite dielectrics are depicted in Fig.
5. The ZBIB glass exhibits three distinct bands around 1346, 954 and 685 cm-1, which are
attributed to asymmetric stretching vibration of B-O-B bond of the trigonal [BO3] units,
asymmetric stretching vibration of B-O-B bond of the tetragonal [BO4] units, and
bending vibration of B-O-B linkages of the borate glass networks, respectively [11-13].
The band appeared at 685 cm-1 is also due to the stretching vibration of Bi-O-Bi bond of
[BiO6] octahedral [14, 15]. The SiO2 filler also exhibits three intense bands at around
1115, 815 and 469 cm-1 which are attributed to asymmetric stretching vibration of Si-O-
Si bond, symmetric stretching vibrations of O-Si-O bond and bending vibration of Si-O-
Si bond of [SiO4] tetrahedra respectively [11]. It is seen from Fig. 5 that with increasing
SiO2 filler in the composites C1 to C4 all these three bands gradually become more
intense along with the intensity decrease and changes of the shape of all the three bands
of the ZBIB glass. The bands at around 1238, 1100 and 923 cm-1 are attributed to
9
asymmetric vibration of B-O-Si bond [11]. This fact clearly indicates the distinct
interaction of ZBIB glass with SiO2 filler.
The TiO2 (rutile) filler, on the other hand, exhibits only one very strong doublet
absorption band peaking at 654 and 546 cm-1 which are due to stretching vibrations of Ti-
O-Ti bond of [TiO6] octahedral [16, 17]. It is seen from Fig. 5 that initially in composite
C1 having 20 wt% TiO2 the band at 685 cm-1 of ZBIB glass undergoes pronounced
change and takes almost the similar shape of TiO2 (compare curves b and g). However,
with decreasing TiO2 filler in the composites C2 to C4, this band undergoes a gradual
change and the bands related to TiO2 filler at 654 and 546 cm-1 gradually become less
intense (see Fig. 5, curve b-e). This fact clearly indicates the formation of Ti-O-Bi bonds
(see Fig. 5 curve b) in the microcomposite dielectrics. In addition to this, the 923 cm-1
band undergoes changes with formations of medium intense band at around 1023 and 908
cm-1 which are due to asymmetric vibration of B-O-Si and B-O-Ti bonds [18]
respectively. All the facts clearly indicate the distinct interaction of ZBIB glass with TiO2
and SiO2 fillers. It is seen from Fig. 5 by comparing spectra a-g that the nature of the
spectra (b-e) of microcomposite dielectrics due to combined TiO2-SiO2 addition gradually
becomes closer to the individual filler at its respective highest content but has the mixed
nature at their intermediate content. It further indicates that both the fillers have partially
dissolved in the glass leaving behind residual fillers in the resultant microcomposite
dielectrics. This is analogous to the observation of XRD as well as microstructural
analysis discussed earlier.

10
3.5 Softening point and glass transition temperature
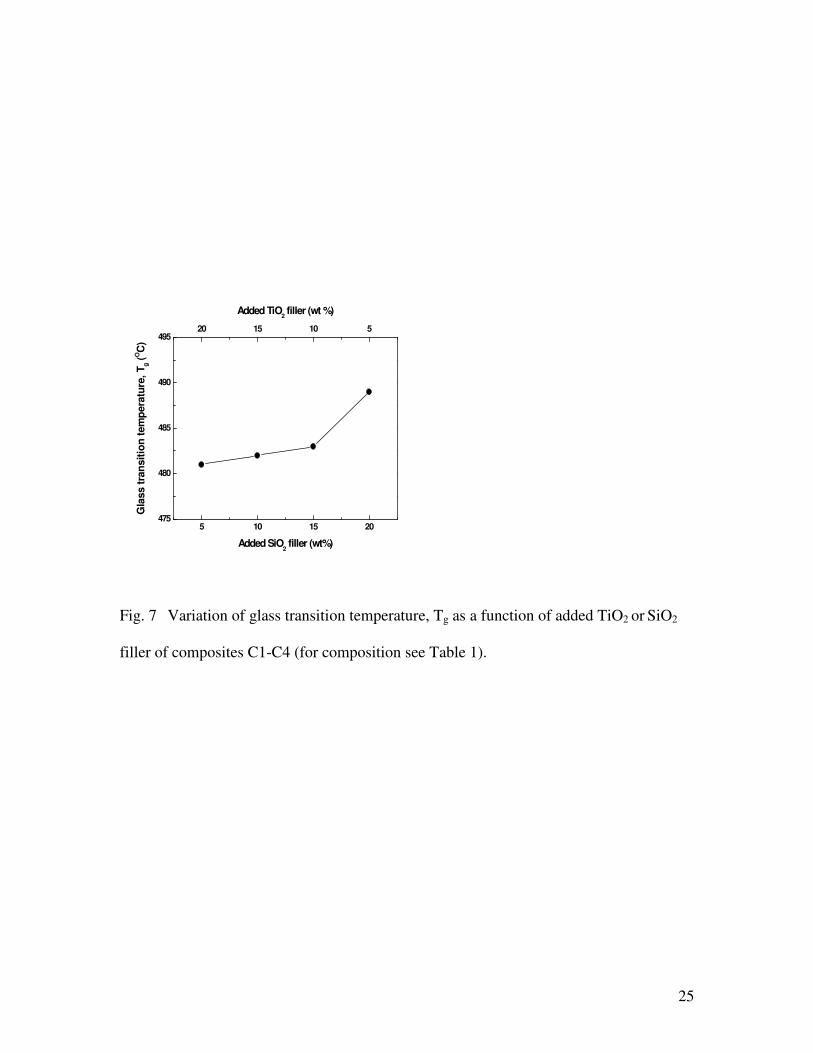
The softening point (Ts) and glass transition temperature (Tg) gradually increase as the
SiO2 content in the combined SiO2-TiO2 filler increases from 5 to 20 wt%. But the effect
is more pronounced on Ts than that on Tg. These facts are depicted in Figs. 6 and 7
respectively. A similar increasing trend of glass transition temperature with increasing
SiO2 content has been demonstrated by Vernacotola and Shelby [19, 20] for potassium
niobium silicate glasses. The increase of Ts and Tg is due to high melting points of SiO2
(1723oC) filler. It is also seen from Fig. 6 that SiO2 filler has greater effect on softening
point as compared to TiO2 filler. This is due to higher electronegativity of Si (1.8) than Ti
(1.5) which results in higher covalent character of the ultimate microcomposite dielectrics
with increasing SiO2 content.
The extent of covalent bonding character of the resultant microcomposite dielectrics
can be calculated approximately using the following formula [21]
Covalent character (%) = exp [-0.25 (∆χ)2] x 100 (1)
where ∆χ is the electronegativity of the composite, that is, the electronegativity difference
(χA- χC) of the anions and the cations. The average electronegativity of the anions (χA) or
cations (χC) can be evaluated by the following simple additive relation [22]
χA or χC = ∑ Ni χi / ∑ Ni (2)
where Ni and χi are the number of individual constituent atom per mole and its
electronegativity, respectively.
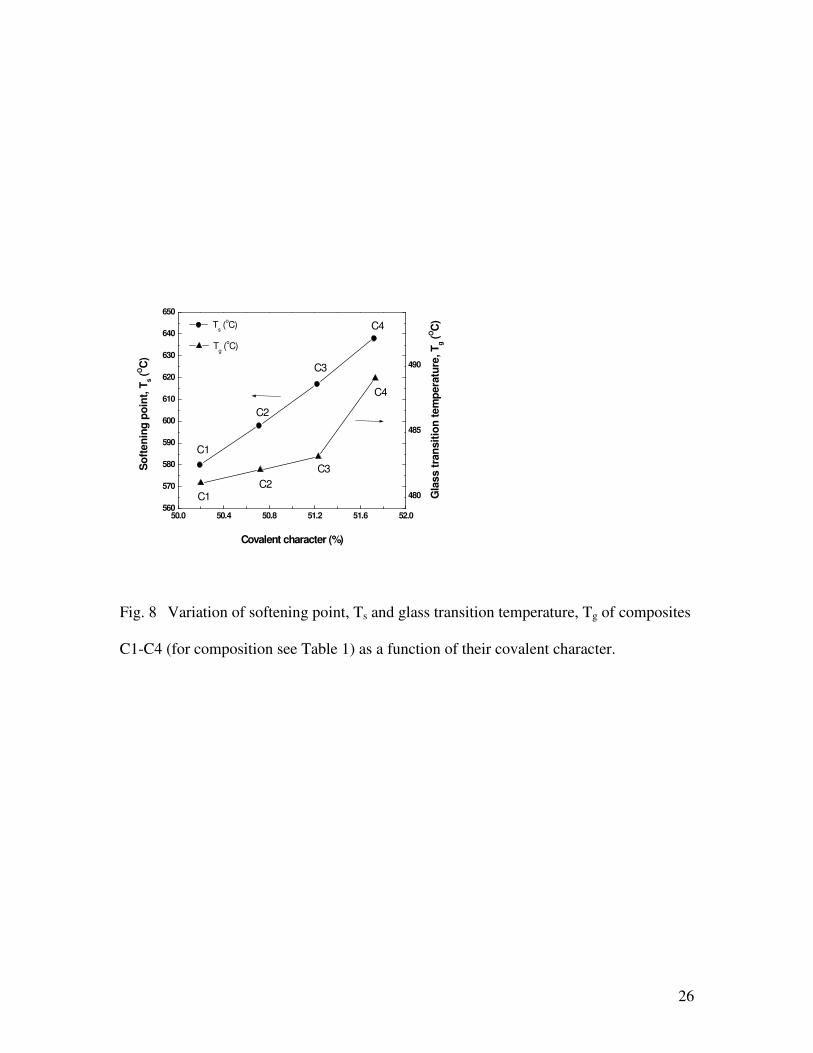
The variation of softening point, Ts and glass transition temperature, Tg of
microcomposite dielectrics C1-C4 as a function of their covalent character is shown in
Fig. 8. It is seen that both Ts and Tg increase with increase in covalent character of the

11
microcomposite dielectrics. Thus, there exists a direct relation between the Ts or Tg and
covalent character of the microcomposite dielectrics, and seems to be regulated these
properties. It is well known that covalent bond is stronger than ionic bond. Thus with
increase in covalent character, the matrix of the microcomposite dielectric would be more
strengthened. In consequence, their Ts and Tg would increase.
3.6 Coefficient of thermal expansion
Variation of coefficient of thermal expansion (CTE) as a function of added TiO2 or SiO2
filler content is shown in Fig. 9. The CTE of composites gradually decreases as SiO2
filler content increases form 5 to 20 wt%. Vernacotola and Shelby [19, 20] have also
found a similar decreasing trend of CTE with increasing SiO2 content in potassium
niobium silicate glasses. It is well known that SiO2 filler has very low CTE (5.5 x 10⁻⁷/K)
as compared to the glass (82 x 10-7/K) and TiO2 (80-100 x 10-7/K). The resultant CTE of
the microcomposite dielectrics, therefore, decreases gradually.
The above fact can also be well understood from the decrease in CTE with increase in
covalent character of the composites which results in strengthening of connectivity of the
network of composites. This is shown in Fig. 10. Thus, there exists an inverse relation
between the CTE and covalent character of the microcomposite dielectrics. The matrix of
the microcomposites would be strengthened with increase in covalent character.
Consequently, their CTE would increase.
12
3.7 Dielectric constant
Dielectric constants (εr) of the microcomposite dielectrics have been calculated by using
the following formula23
εr = cd/(0.0885 A) (3)
where c, d and A are capacitance in pico Farad (pF), thickness of glass or
microcomposite (in cm) and area of the dielectric (in cm2) respectively.
Variation of dielectric constant as a function of added TiO2 or SiO2 fillers is shown in
Fig. 11. It is seen that the dielectric constant of the composites gradually decreases with
increase in SiO2 filler content. It is a well known fact that the dielectric constant of SiO2
filler is 3.8 which is lower than that of the glass (11.2) whereas the dielectric constant of
TiO2 filler is higher (80-100) than the glass. Thus, the resultant dielectric constant of
combined TiO2-SiO2 filler added composite gradually decreases with increasing SiO2
content or decreasing TiO2 content. The variation of dielectric constant of composites
C1-C4 as a function of their covalent character is already shown in Fig. 10. It is seen that
the dielectric constants of the microcomposite dielectrics decrease with increase in their
covalent character. Thus, there exists an inverse relation between the dielectric constant
and the covalent character of the microcomposite dielectrics.
4 Conclusions
In this effort to disclose a lead-free environmental-friendly alternative microcomposite
dielectric for the white back (rear glass dielectric layer) of plasma display panels, the co-
effect of two types of TiO2-SiO2 ceramic fillers to an extent of 25 wt% on the softening
point, glass transition temperature, coefficient of thermal expansion and dielectric

13
properties of a new lead-free environmental-friendly ZnO-Bi2O3-B2O3 (ZBIB) glass
system has been investigated. Based on qualitative XRD and FTIR spectral analyses, both
the fillers investigated are found to be partially dissolved in the glass at the sintering
temperature (560oC), and thus the specimen successfully formed ceramic filler
particulate-reinforced glass matrix microcomposites with a strong interfacial bonding.
This is supported by the SEM images of the microcomposite dielectrics. The softening
point, Ts and glass transition temperature, Tg have been found to be increased whereas
coefficient of thermal expansion (CTE) and dielectric constant, εr decreased with
increasing SiO2 content. The increase and decrease of these properties are correlated well
with the covalent character (a fundamental property) of the resultant microcomposite
dielectrics. The co-addition of TiO2-SiO2 filler to ZBIB is found to be more effective in
consideration of the desired properties of white back (the rear glass substrate) of the
PDPs.
Acknowledgements This work has been supported by the NMITLI/CSIR, New
Delhi under the sanctioned no. 5/258/49/2006-NMITLI. The authors gratefully thank
Director of the institute for his kind permission to publish this paper. They also
thankfully acknowledge the XRD, SEM and Ceramic Membrane Divisions of this
institute for their respective help.

14
References
1. J. S. An, J. S. Park, J. R. Kim, K. S. Hong, H. Shin, J. Am. Ceram. Soc., 89, 3658
(2006).
2. H. Shin, S. G. Kim, J. S. Park, J. S. An, K. S. Hong, H. Kim, J. Am. Ceram. Soc.,
89, 3258 (2006).
3. R. R. Tummala, Borate Glasses: Structure, Properties and Applications, edited by L.
D. Pye, et.al., Plenum Publishing Corp., 1978.
4. S. G. Kim, J. S. Park, J. S. An, K. S. Hong, H. Shin, H. Kim, J. Am. Ceram. Soc.,
89, 902 (2006).
5. E. S. Lim, B. S. Kim, J. H. Lee, J. J. Kim, J. Electroceram., 17, 359 (2006).
6. S. G. Kim, H. Shin, J. S. Park, K. S. Hong, H. Kim, J. Electroceram., 15, 129
(2005).
7. C. L. Yawa, Chemical Properties Handbook: Physical, Thermodynamic,
Environmental, Transport, Safety and Health Related Properties for Organic and
Inorganic Chemicals, pp. 613-615, McGraw-Hill Book Co., New York, 1999.
8. E. Chong, S. Hwang, W. Sung, H. Kim, H. Shin, Int. J. Appl. Ceram. Technol., 6,
295 (2009).
9. E. Chong, S. Hwang, W. Sung, H. Kim, H. Shin, Int. J. Thermophys., DOI
10.1007/s10765-008-0496-8.
10. M. B. Volf, Chemical Approach to Glass, p. 443, Elsevier Science Publishing
Company, Inc., New York, 1984.
11. G. Fuxi, Optical and Spectroscopic Properties of Glass, pp. 18-61, Springer-Verlag,
Berlin, 1992.

15
12. E. I. Kamitsos, A. M. Karakassides, D. G. Chryssikos, J. Phys. Chem., 91, 1073
(1987).
13. S. G. Motke, S. P. Yowale, S. S. Yawale, Bull. Mater. Sci., 25, 75 (2002).
14. L. Baia, R. Stefan, J. Popp, S. Simon, W. Keifer, J. Non-Cryst. Solids, 324, 109
(2003).
15. A. A. Kharlamov, R. M. Almeida, J. Heo, J. Non-cryst. Solids, 202, 233 (1996).
16. A. Shaim, M. Et-tabirou, M. Montagne, G. Palavit, Mater. Res. Bull., 37, 2459
(2002).
17. J. Rocha and M. W. Anderson, Eur. J. Inorg. Chem. 2000, 801 (2000).
18. T. Uma, M. Nogami, J. Phys. Chem. C., 111, 16635 (2007).
19. D. E. Vernacotola, Key Engg. Mater., 94-95, 379 (1994).
20. D. E. Vernacotola, J. E. Shelby, Phys. Chem. Glasses, 35, 53 (1994).
21. L. Pauling, The Nature of the Chemical Bond, 3rd edition, pp. 34-75, Cornell
University Press, New York, 1960.
22. B. Karmakar, J. Solid State Chem., 178, 2663 (2005).
23. T. K. Dakin, Standard Handbook for Electrical Engineers, eds. D. G. Fink, & H. W.
Beaty, 13th edition, McGraw Hill Inc., New York, pp. 4-117, 1993.

16
Figure captions
Fig. 1 Particle size distribution of ZBIB glass powder, TiO2 and SiO2 fillers.
Fig. 2 Variation of XRD patterns with TiO2 and SiO2 filler content: (a) glass, G, (b) C1,
(c) C2, (d) C3, and (e) C4 (for composition see Table 1). XRD patterns of added (f) SiO2
and (g) TiO2 fillers are also provided for comparison.
Fig. 3 SEM images after etching in HF of (a) C1 and (b) C4 (for composition see Table
1).
Fig. 4 Variation bulk density as a function of added TiO2 or SiO2 filler of composites
C1-C4 (for composition see Table 1).
Fig. 5 FTIR spectra of (a) glass, G, (b) C1, (c) C2, (d) C3 and (e) C4 (for composition
see Table 1). Spectra of added (f) SiO2 and (g) TiO2 fillers are also given for comparison.
Fig. 6 Variation of softening points, Ts as a function of added TiO2 or SiO2 filler of
composites C1-C4 (for composition see Table 1).
Fig. 7 Variation of glass transition temperature, Tg as a function of added TiO2 or SiO2
filler of composites C1-C4 (for composition see Table 1).
Fig. 8 Variation of softening point, Ts and glass transition temperature, Tg of composites
C1-C4 (for composition see Table 1) as a function of their covalent character.
17
Fig. 9 Variation of coefficient of thermal expansion (CTE) as a function of added TiO2
or SiO2 filler of composites C1-C4 (for composition see Table 1).
Fig. 10 Variation of coefficient of thermal expansion (CTE) and dielectric constant (εr) of
composites C1-C4 (for composition see Table 1) as a function of their covalent character.
Fig. 11 Variation of dielectric constant (εr) as a function of added TiO2 or SiO2 filler of
composites C1-C4 (for composition see Table 1).

18
Table 1 Composition of microcomposite dielectrics derived from glass
Composition (wt%) Sample
identity ZBIB
glass
Added
TiO2 filler
Added SiO2
filler
Ga 100 - -
C1 75 20 5
C2 75 15 10
C3 75 10 15
C4 75 5 20 aComposition (wt %) of glass (G): 19ZnO-46 Bi2O3-35 B2O3

19
Figures
Fig. 1 Particle size distribution of ZBIB glass powder, TiO2 and SiO2 fillers.
-1 0 1 2
0
4
8
12
16
Vo
lum
e (
%)
Log particle size (µm)
SiO2, d
50=1.5 µm
TiO2, d
50= 3.2 µm
ZBIB Glass Powder,
d50
=14.4 µm

20
10 20 30 40 50 60 70 80
g
f
e
d
c
b
a
Inte
nsit
y (
a.u
.)
2θ θ θ θ (degree)
Fig. 2 Variation of XRD patterns with TiO2 and SiO2 filler content: (a) glass, G, (b) C1,
(c) C2, (d) C3, and (e) C4 (for composition see Table 1). XRD patterns of added (f) SiO2
and (g) TiO2 fillers are also provided for comparison.

21
Fig. 3 SEM images after etching in HF of (a) C1 and (b) C4 (for composition see Table
1).
10 µµµµm
10 µµµµm
(a) (b)
SiO2
SiO2
SiO2
SiO2
TiO2
TiO2
TiO2
TiO2 SiO2 SiO2
TiO2
SiO2
SiO2
TiO2
TiO2
TiO2

22
5 10 15 203.2
3.3
3.4
3.5
3.6
3.7
3.8
3.9
4.0
Bu
lk d
en
sit
y,
ρρ ρρ (
g. cm
-3)
Added SiO2 filler (wt%)
20 15 10 5
Added TiO2 filler (wt%)
Fig. 4 Variation bulk density as a function of added TiO2 or SiO2 filler of composites
C1-C4 (for composition see Table 1).

23
Fig. 5 FTIR spectra of (a) glass, G, (b) C1, (c) C2, (d) C3 and (e) C4 (for composition
see Table 1). Spectra of added (f) SiO2 and (g) TiO2 fillers are also given for comparison.

24
5 10 15 20
580
590
600
610
620
630
640
So
ften
ing
po
int,
Ts (
OC
)
Added SiO2 filler (wt%)
20 15 10 5
Added TiO2 filler (wt %)
Fig. 6 Variation of softening points, Ts as a function of added TiO2 or SiO2 filler of
composites C1-C4 (for composition see Table 1).
25
5 10 15 20475
480
485
490
495
Gla
ss t
ran
sit
ion
tem
pera
ture
, T
g (
OC
)
Added SiO2 filler (wt%)
20 15 10 5
Added TiO2 filler (wt %)
Fig. 7 Variation of glass transition temperature, Tg as a function of added TiO2 or SiO2
filler of composites C1-C4 (for composition see Table 1).
26
50.0 50.4 50.8 51.2 51.6 52.0560
570
580
590
600
610
620
630
640
650
Ts (
oC)
So
ften
ing
po
int,
Ts (
OC
)
Covalent character (%)
480
485
490
C4
C3
C4
C3
C2
C1
C2C1 G
lass t
ran
sit
ion
tem
pera
ture
, T
g (
OC
)
Tg (
oC)
Fig. 8 Variation of softening point, Ts and glass transition temperature, Tg of composites
C1-C4 (for composition see Table 1) as a function of their covalent character.

27
5 10 15 2055
60
65
70
75
80
85
CT
E (
x 1
0-7/K
)
Added SiO2 filler (wt %)
20 15 10 5
Added TiO2 filler (wt %)
Fig. 9 Variation of coefficient of thermal expansion (CTE) as a function of added TiO2
or SiO2 filler of composites C1-C4 (for composition see Table 1).

28
50.0 50.4 50.8 51.2 51.6 52.045
50
55
60
65
70
75
80
85
CT
E (
X1
0-7/K
)
Covalent character (%)
9
12
15
18
C1
C2
C2
C3
C3
C4
C4
C1
CTE ε
Die
lec
tric
co
ns
tan
t, εε εε
r
Fig. 10 Variation of coefficient of thermal expansion (CTE) and dielectric constant (εr) of
composites C1-C4 (for composition see Table 1) as a function of their covalent character.

29
5 10 15 206
9
12
15
18
Die
lec
tric
co
ns
tan
t, εε εε
r
Added SiO2 filler (wt %)
20 15 10 5
Added TiO2 filler (wt %)
Fig. 11 Variation of dielectric constant (εr) as a function of added TiO2 or SiO2 filler of
composites C1-C4 (for composition see Table 1).